1. Introduction
Effective management of electricity networks at a distribution level is increasingly important to prevent system issues due to an increase in distributed generation, for example from renewable energy systems, and demand driven in part by the upsurge in electric vehicles (EVs) [
1,
2]. However, enhanced system management also provides additional benefits such as the possibility of eligible assets to participate in energy markets, for example EVs through vehicle-to-grid (V2G) or smart charging [
3,
4,
5,
6].
V2G services enable electric vehicles to generate an income from participating in electricity trading during the prolonged periods they are not being used for their primary transportation purpose. At an aggregated level, energy loads can be traded on the power exchanges and previous research has shown that significant revenues can be derived from these services [
7]. Commercial services capitalising on this opportunity are beginning to emerge. Octopus Energy has developed Powerloop, which provides participants with a bi-directional charger and a Nissan LEAF vehicle enabling them to receive financial rewards for making their vehicle available during times of peak demand [
8]. Kaluza, an Ovo Energy company, has completed a large-scale trial of V2G technology to provide grid balancing services through their smart energy platform concluding that users could save substantial amounts on their electricity bills [
9]. Nuvve has developed a V2G platform that makes use of bi-directional chargers and a cloud-based control platform, to enable the use of V2G technology for commercial fleets [
10]. EV8 Technologies are piloting and developing the EV8 Live Service, introduced in this paper, to enable V2G for consumers and fleets [
11].
A key factor in V2G services is the complexity arising from the underlying storage being mobile rather than fixed, which raises two important issues: (1) the aggregation provider cannot typically enforce connectivity—the owner or user can unplug at any time; (2) to access the V2G value pool through the power exchange markets, understanding and managing the availability of storage, rate of discharge possible and disconnection risk is central to solving the challenge. Successfully managing this complexity requires prediction and adaptation to changing circumstances.
Such prediction is required at multiple levels. For example, a machine learning framework was introduced in [
12] that predicted available capacity from a vehicle fleet based on the learned behaviour of simulated user types, their willingness to participate in proposed V2G events and their reliability in making their vehicles available at agreed times. In [
13], an automated machine learning was used to predict the parking locations of a fleet of vehicles and their proximity to V2G charging locations. This capability could provide a V2G service with a set of vehicles ranked by risk, that may be available at the time of potential future trading opportunities. A deep learning neural network was used in [
14] that predicted the available capacity for trading opportunities from a fleet of vehicles operated by the University of Nottingham (UoN) in the United Kingdom. The state-of-charge of individual vehicles was simulated given observed fleet behaviour and the neural network was shown to be able to predict aggregated capacity available from the fleet at future times while adapting to discharge events resulting from the actions of the aggregator executing market trades. However, this work used data from a fleet with relatively consistent schedules and the ability of the predictive system to adapt to substantial deviations from these schedules is an outstanding question.
The coronavirus pandemic that was declared by the World Health Organisation in 2020 resulted in unprecedented changes to the lives and routines of individuals and organisations across the world. During large periods of the year in the UK, people were instructed to stay at home, only essential businesses remained operational and university campuses were largely closed. This systemic shock also had a profound impact on the usage of vehicles with traffic reduced and fleet activity altered. At the University of Nottingham, for example, vehicles that were previously used for catering and estates services were required to support the coronavirus testing facilities on campus and thus the entire fleet was impacted. Such dramatic change provided a unique opportunity to assess the ability of a predictive tool to adapt to changing conditions—a critical requirement for a successful V2G service.
In this work, we build upon the deep learning neural network introduced in [
14], which was used to predict the capacity available to a V2G service from UoN’s vehicle fleet. This network consisted of a convolutional neural network layer (CNN) coupled with a long-short term memory (LSTM) layer. Networks such as these have been used with success for multiple time-series prediction applications including natural language processing [
15], visual recognition [
16], residential energy consumption [
17] and the routing of EVs to manage their impact on the electrical distribution system [
18].
We extend the initial work to support ongoing adaptation in which the learning model is updated using new data as they arrive sequentially. Such online machine learning has received much attention for a wide range of applications [
19]. Most of this work focusses on learning shallow models, however, the use of online machine learning for deep models has received increasing attention [
20,
21]. In this paper, we compare predictive performance of the CNN-LSTM model during 2020 with and without online machine learning and demonstrate a highly statistically significant improvement using the latter. To the best of our knowledge, this is the first successful application of online machine learning to predicting available capacity for a V2G service and adapting to a significant change in the behaviour of the underlying vehicles, such as that caused by the coronavirus pandemic.
The remainder of the paper is structured as follows: in the following section we place the work in the context of the Live Service that is under development by EV8 Technologies [
11], describe the dataset and introduce the recurrent neural network at the heart of the predictive engine. We then show and discuss the accuracy of its predictions using 2020 data with and without online machine learning.
2. Materials and Methods
2.1. Live Service Description
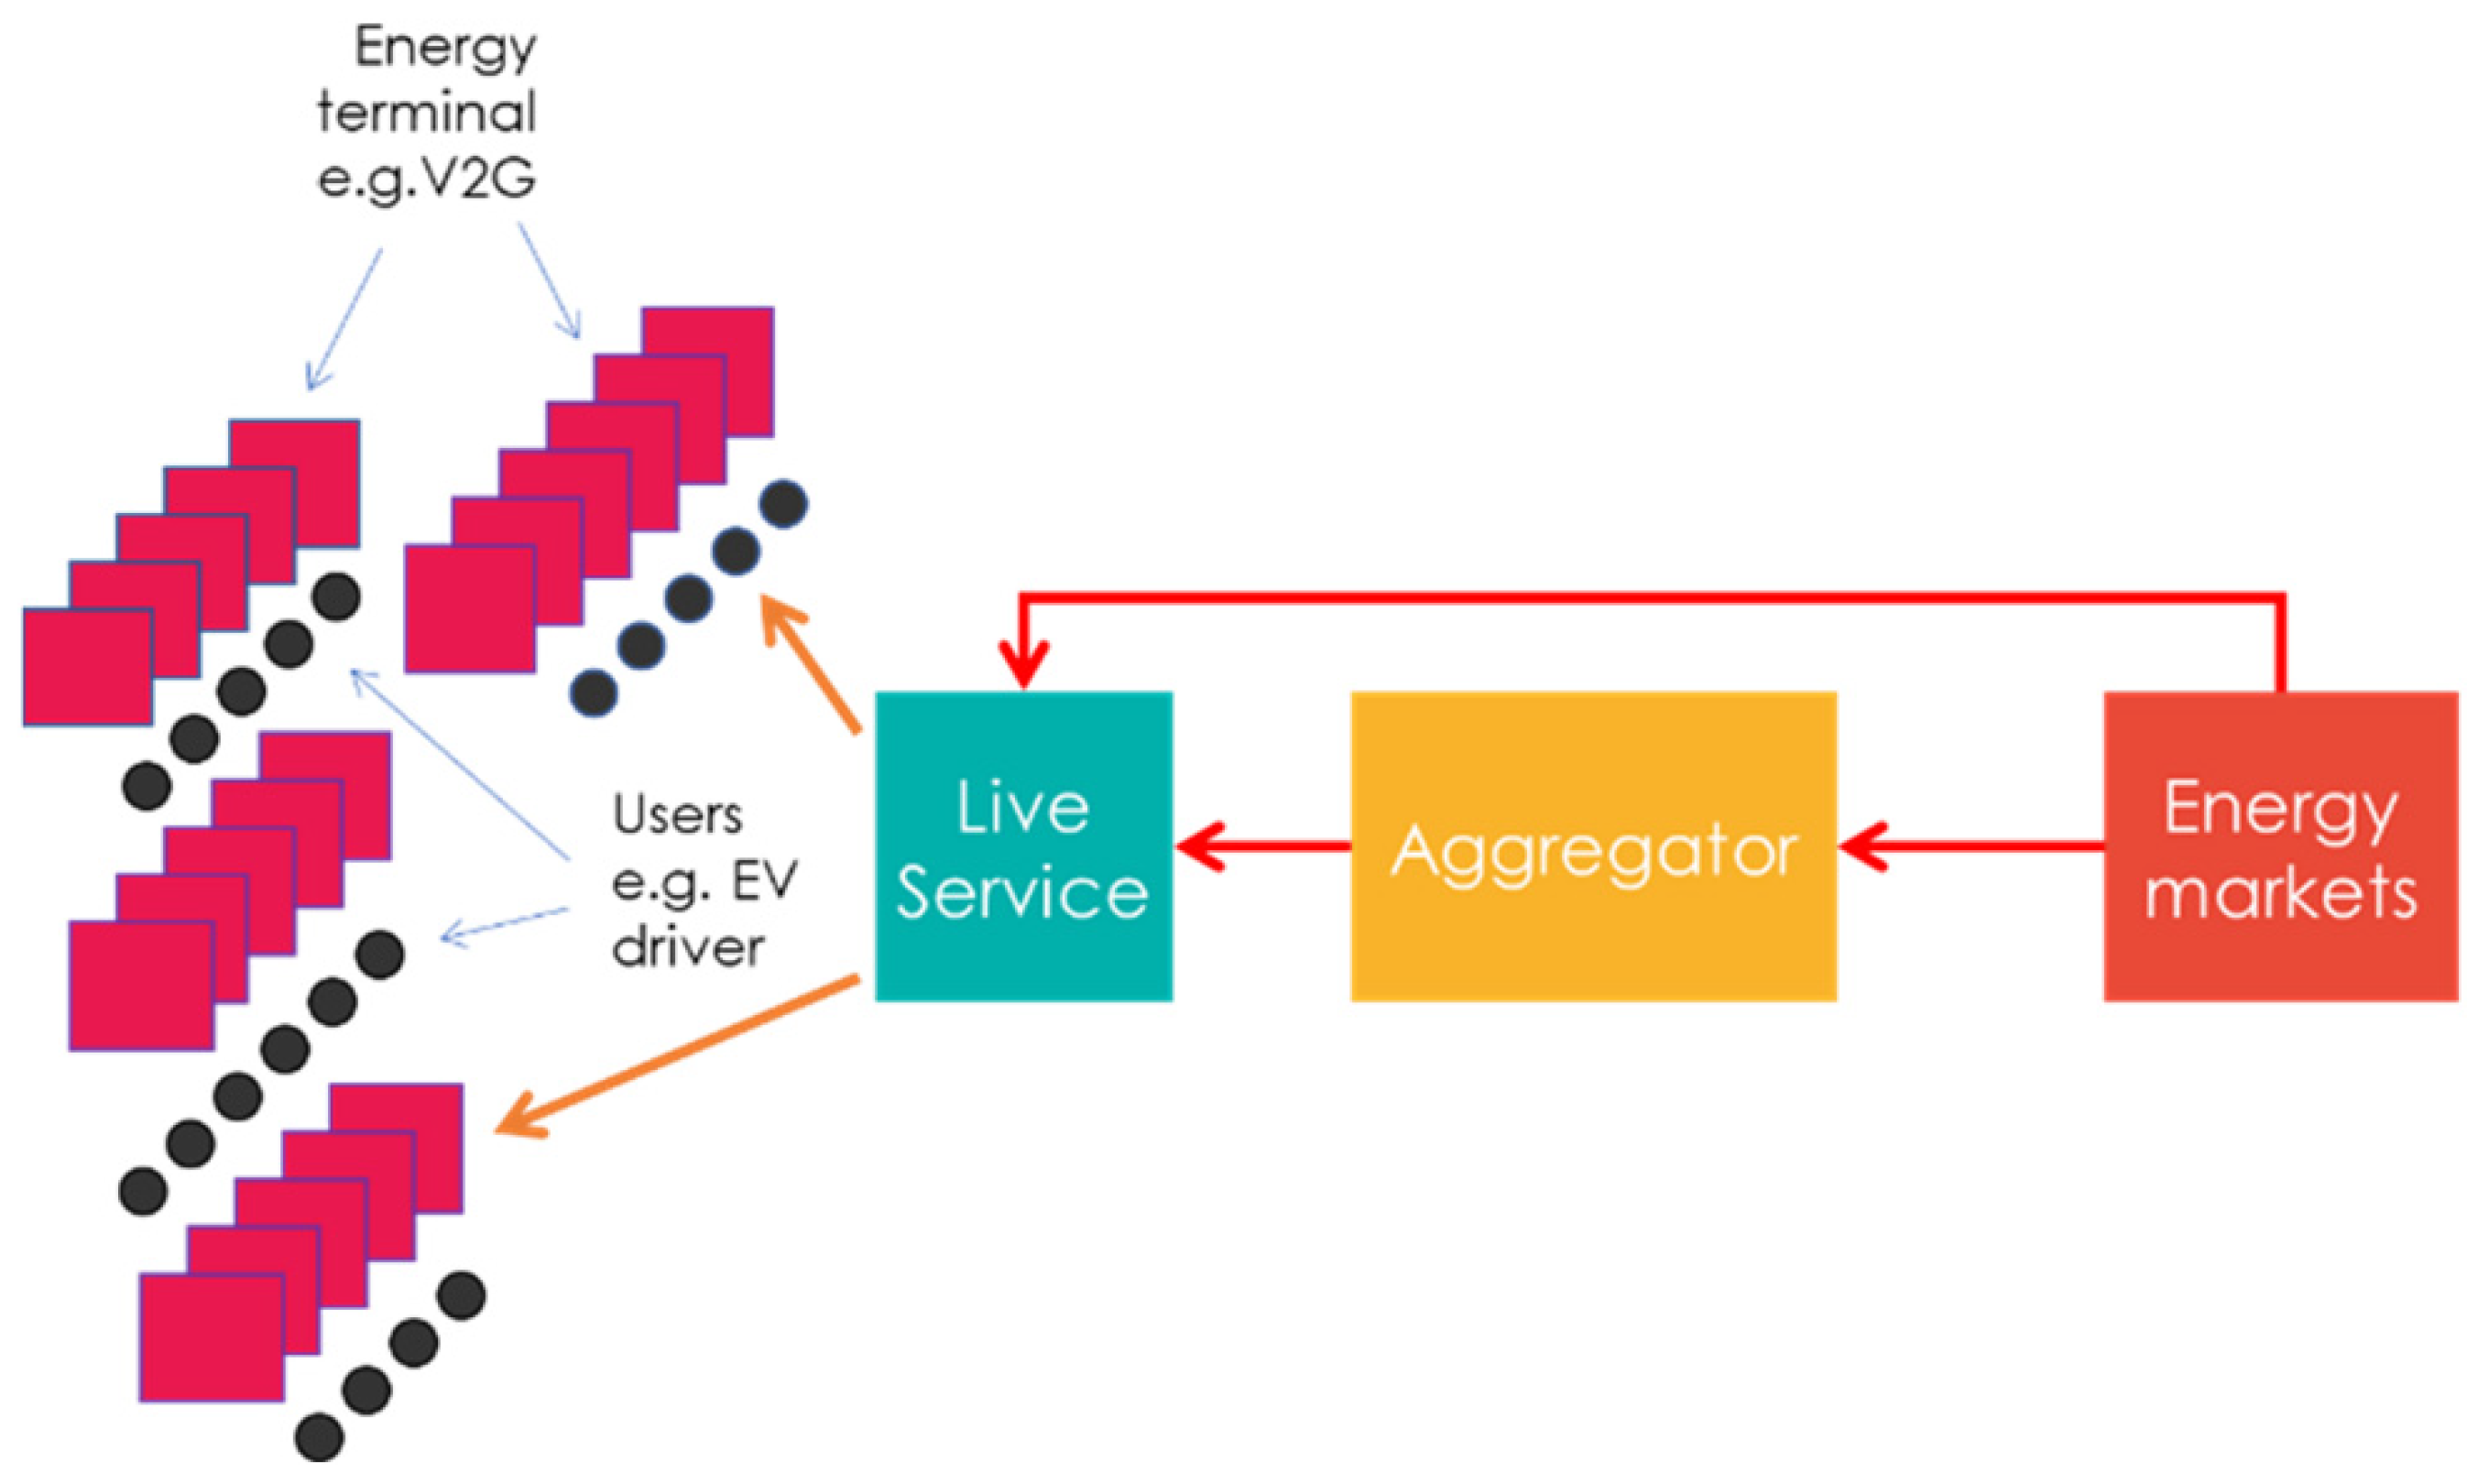
The system described in this section, called the Live Service, was developed to simulate income potential from participation in energy market trading using EVs connected to V2G equipment. Data collected through telematics sources were used to simulate EV operators participating in V2G market mechanisms, whilst preserving the minimum level of transport utility from the vehicles. This system simulated the end-to-end application from vehicle management and owner interface through to energy market integration for trading of the stored energy. A whole system diagram of where the Live Service sits in the energy market is shown in
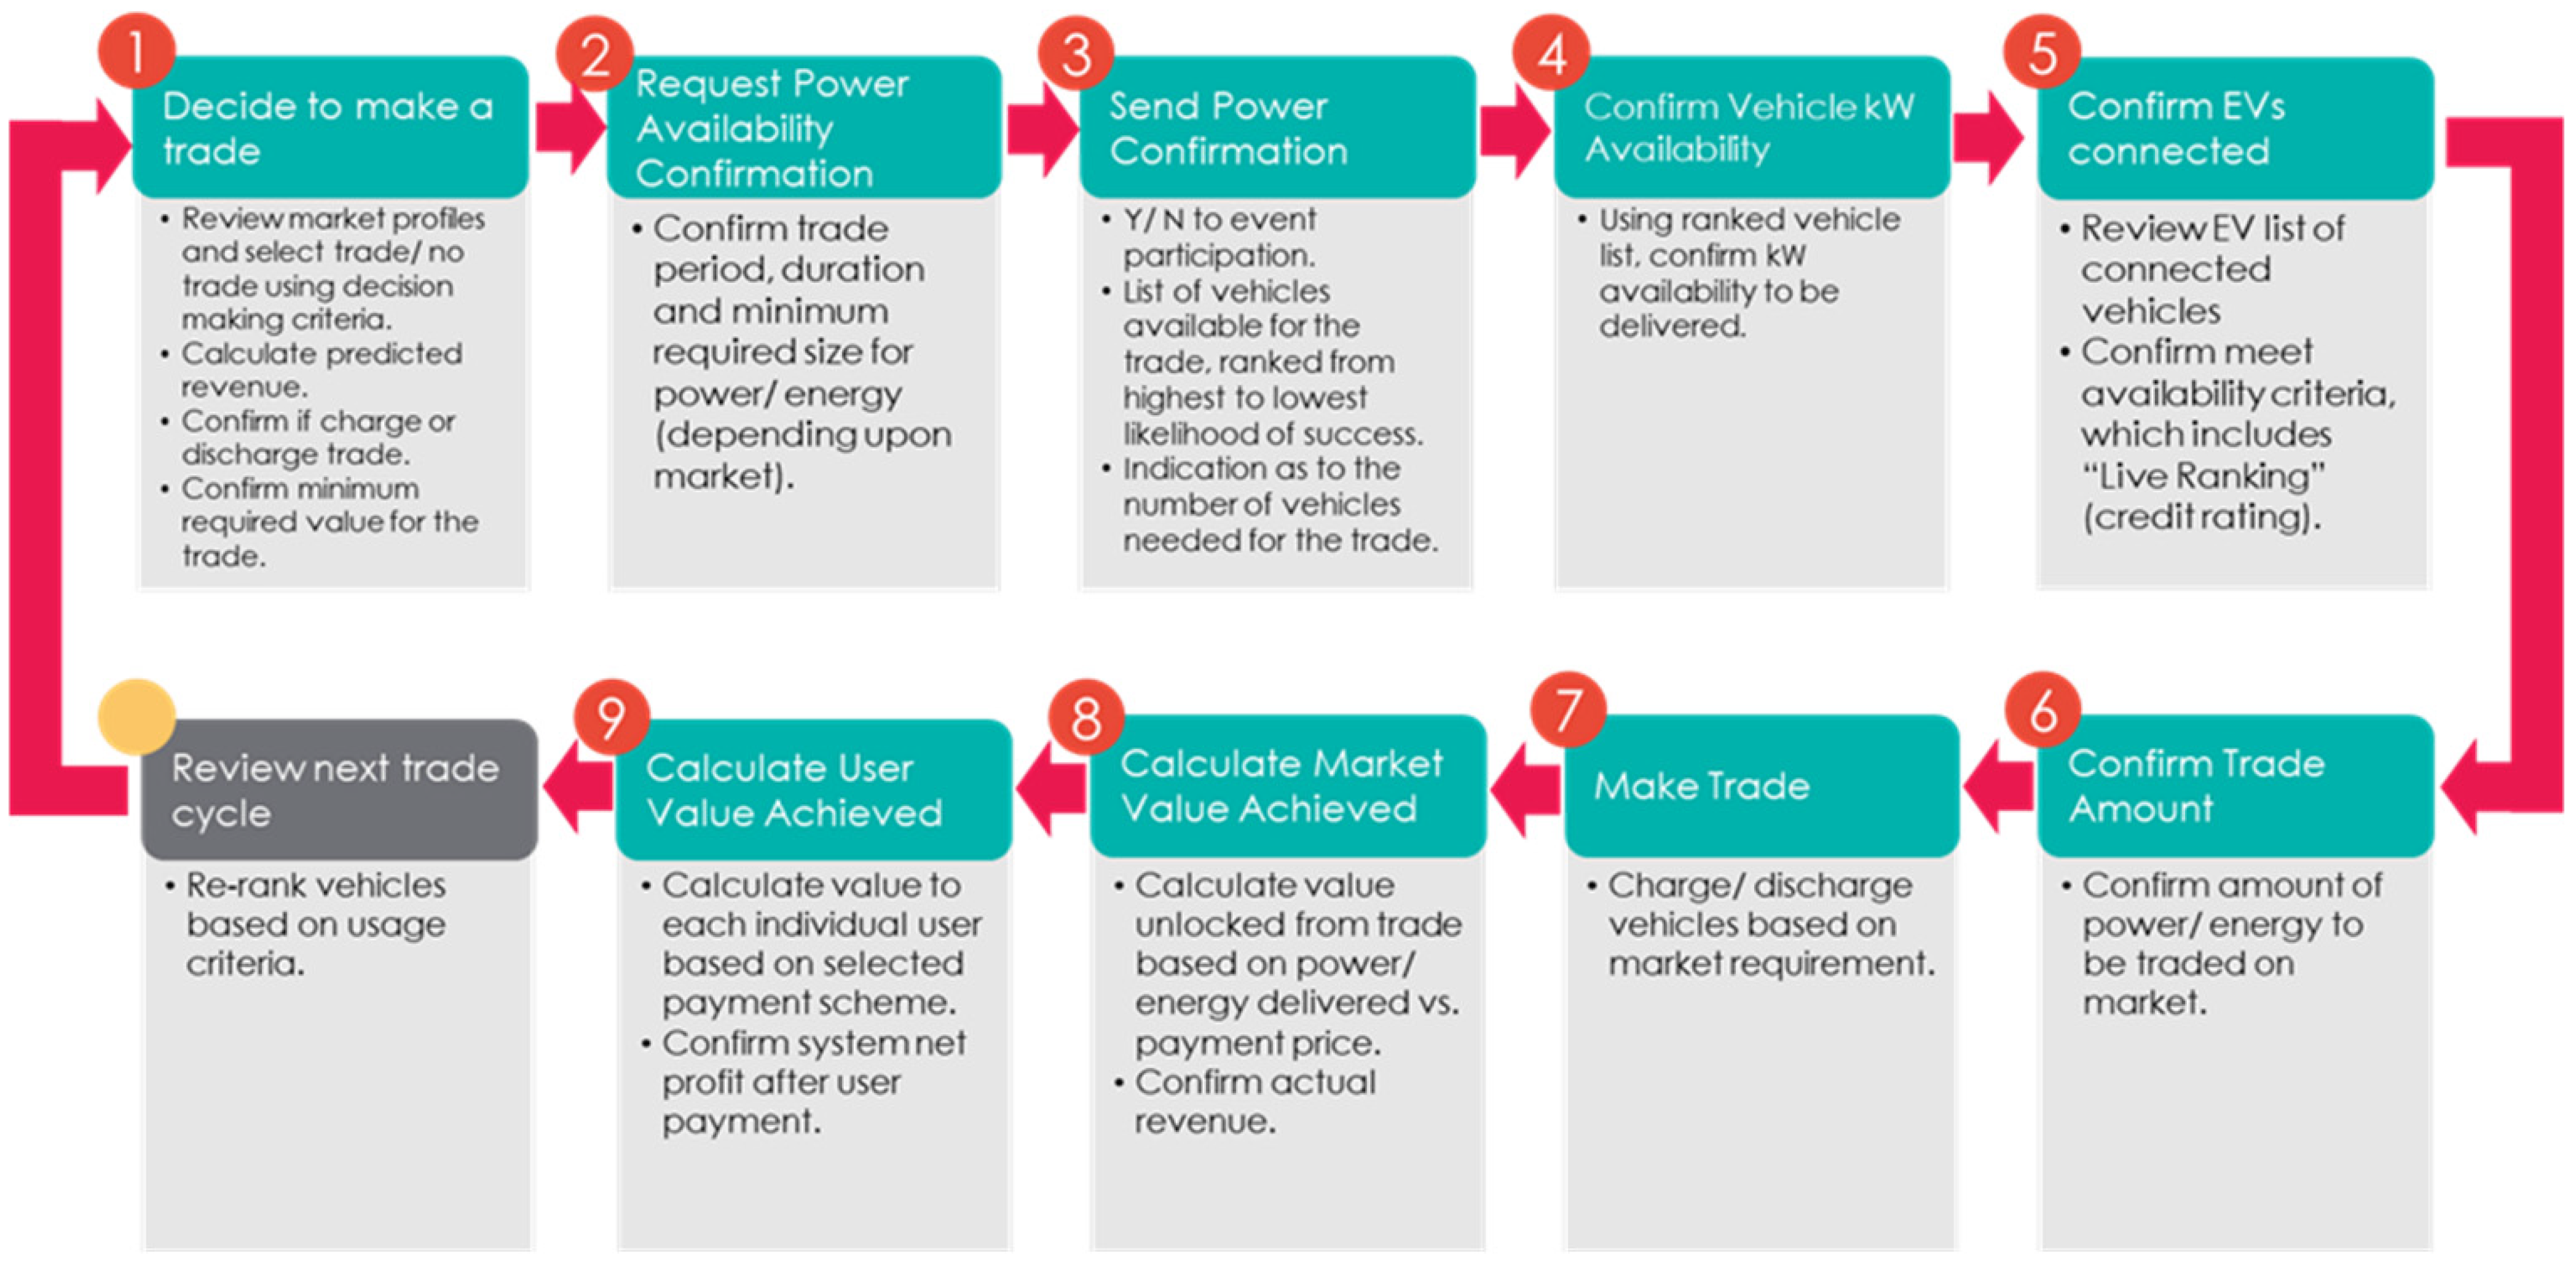
Figure 1, and the process of making an energy trade using the aggregated fleet is shown in
Figure 2.
The focus of this paper is on point 3 in
Figure 2 and is on specifically supporting the service in deciding on whether to trade in the following 24 h period given the predicted available capacity from the aggregated vehicle fleet.
2.2. Vehicle Dataset
The University of Nottingham operates a fleet of vehicles to support the various functions of the university, including estates management, security, mailroom, transport, grounds, and catering services. During the study period, most of the vehicles were powered by internal combustion engines, however, nine electric vans were also in operation. Many of the vehicles were equipped with Trakm8 telematics equipment [
22] that provided information on the trips made including start and end locations and the distance travelled. Data from 48 of these vehicles were used from the start of 2019 to the end of 2020 as the input dataset for this work, thus providing a detailed profile of a real fleet during the study period.
For each trip, the Global Navigation Satellite System (GNSS) coordinates and time at the start and end of each trip were recorded along with the trip distance. This resulted in a total of over 330,000 rows in the trip dataset each representing a single trip by an individual vehicle, an excerpt from which is shown in
Table 1.
This dataset included a period of typical university operations until March 2020 followed by a period until the end of 2020 that was significantly impacted by the coronavirus pandemic, which resulted in university closures and in some cases a repurposing of university vehicles to support the response to the pandemic such as the vaccination program.
Analysis of the trips allowed the stationary location and dwell time of each vehicle throughout the 2-year period to be determined. Adopting the approach introduced in [
13] and [
14], if a vehicle was stationary for a full half-hour period within 100 m of the simulated location of one of six V2G chargers on the university campuses it was deemed to be available to the V2G aggregation service for that period. This process resulted in a dataset for each vehicle of consecutive half-hour periods indicating whether the vehicle was available. The total distance travelled for each trip was recorded for the half-hour period in which it was completed. The fleet operated differently during weekends or holidays and these features were therefore also added to the dataset. The combined vehicle availability dataset contained approximately 1.7 million rows, almost 57% of which represented half-hour periods in which a vehicle was available. An anonymised excerpt representing the trips shown in
Table 1 assuming that the vehicles were parked close to a simulated V2G charger is provided in
Table 2.
The vehicle availability dataset was used as input to state-of-charge simulations, which calculated reductions in battery state-of-charge (SoC) resulting from any trips made and increases in state-of-charge during stationary periods in which a vehicle was available and charging. This process, developed in [
14] and reproduced in
Appendix A and Equation (1), resulted in a state-of-charge for each vehicle at each half-hour period.
For some of the 48 vehicles, the SoC dropped to zero during the simulated period, which indicated that the vehicle was not parked close to the simulated V2G charger locations with enough regularity to allow the charge to be replenished. In these cases, it was assumed that the vehicles would be charged elsewhere and not available to the V2G service until they again were parked in a simulated V2G charger location. It was also assumed that on return, their SoC remained zero, i.e., the externally provided charge was enough to allow any trips taken but not enough for the vehicles to return to the service with surplus charge.
The output of this simulation was then used to determine the available capacity from each vehicle at each half-hour period as follows:
where
is the available capacity in kWh from vehicle
v at half-hour period
hh,
is the availability of vehicle
v in this period and
is the state-of-charge, ranging from 0 to 1 of vehicle
v at the end of the preceding half-hour period. This equation ensured that capacity was only available when the state-of-charge exceeded a minimum value of 0.5 and assumed the total battery capacity of a vehicle was 40 kWh, which mirrored that of some fleet electric vehicles at the time of the study. The maximum capacity available from each vehicle during a given half-hour period was therefore 20 kWh.
The final step of data preparation was to create an aggregated dataset for the fleet. The total available capacity for each half-hour period was calculated by summing the available capacity from each of the 48 vehicles for that period. This resulted in an available capacity dataset consisting of approximately 35,000 rows, one for each half-hour period during 2019 and 2020. This dataset was used as input to the predictive model.
2.3. Model Training
The CNN-LSTM model, developed in [
14] and described in detail in
Appendix B, was also used as the predictive model for this work. These networks utilize a convolutional neural network to encode the input, which is presented to a long short-term memory neural network that utilises recurrent connections and parameters enabling both short-term and long-term memory [
23]. They are thus well suited for learning sequences in time-series data, such as those from vehicle activity over an extended period.
The CNN-LSTM network took data from the previous 24 h period as input and produced as output the predicted available capacity for the subsequent 24 h period. Thus, to produce a prediction at a given half hour period the previous 48 consecutive rows of the available capacity dataset were presented to the network, which then produced a 48-element vector representing the predicted capacity for each half-hour period in the subsequent 24 h. These outputs were then compared to the observed available capacity allowing prediction errors to be ascertained and minimized using the Adam optimizer [
24] with mean squared error across all predictions in the training dataset as the loss function.
An initial model was trained using data from 2019, which was representative of typical university operations. The first 280 days of the 2019 data were used for training and the subsequent 85 days used as an independent test dataset. Batches of 48 inputs, representing one 24 h period, were presented to the network before each model update and training was run for a maximum of 100 epochs, i.e., cycles through the full training dataset. However, each training run was typically shorter than this due to an early-stopping feature that was used to protect against overtraining. Loss on the test set was assessed at the end of every epoch and if this did not improve for 10 epochs, training was stopped, and the best model seen to date used.
Two different approaches were investigated to assess the model’s ability to predict available capacity for 2020. First, predictions were made for each day of the year without further model updates. Second, online machine learning was implemented in which the model was updated following each week of the year. In this case, predictions were made for each day sequentially as previously. However, after each 7-day period the training set was expanded to include the data for the preceding week and the model re-trained for an additional 2 epochs. Thus, the model was updated 52 times during 2020.
2.4. Model Testing
The model was used to predict available capacity for each half-hour period within each day of 2020 with and without online machine learning. Although the model supported predictions up to 24 h in advance, the results presented in this paper focus on predictions half an hour in advance, which allowed the impact of the changes in fleet behaviour to be determined. Longer-term predictions were qualitatively similar with a gradually decreasing accuracy for both approaches. Mean absolute error (MAE) was calculated for each day as follows:
where
is the predicted available capacity for half-hour period
hh on day
d and
is the observed available capacity for that period.
3. Results
3.1. Fleet Behaviour
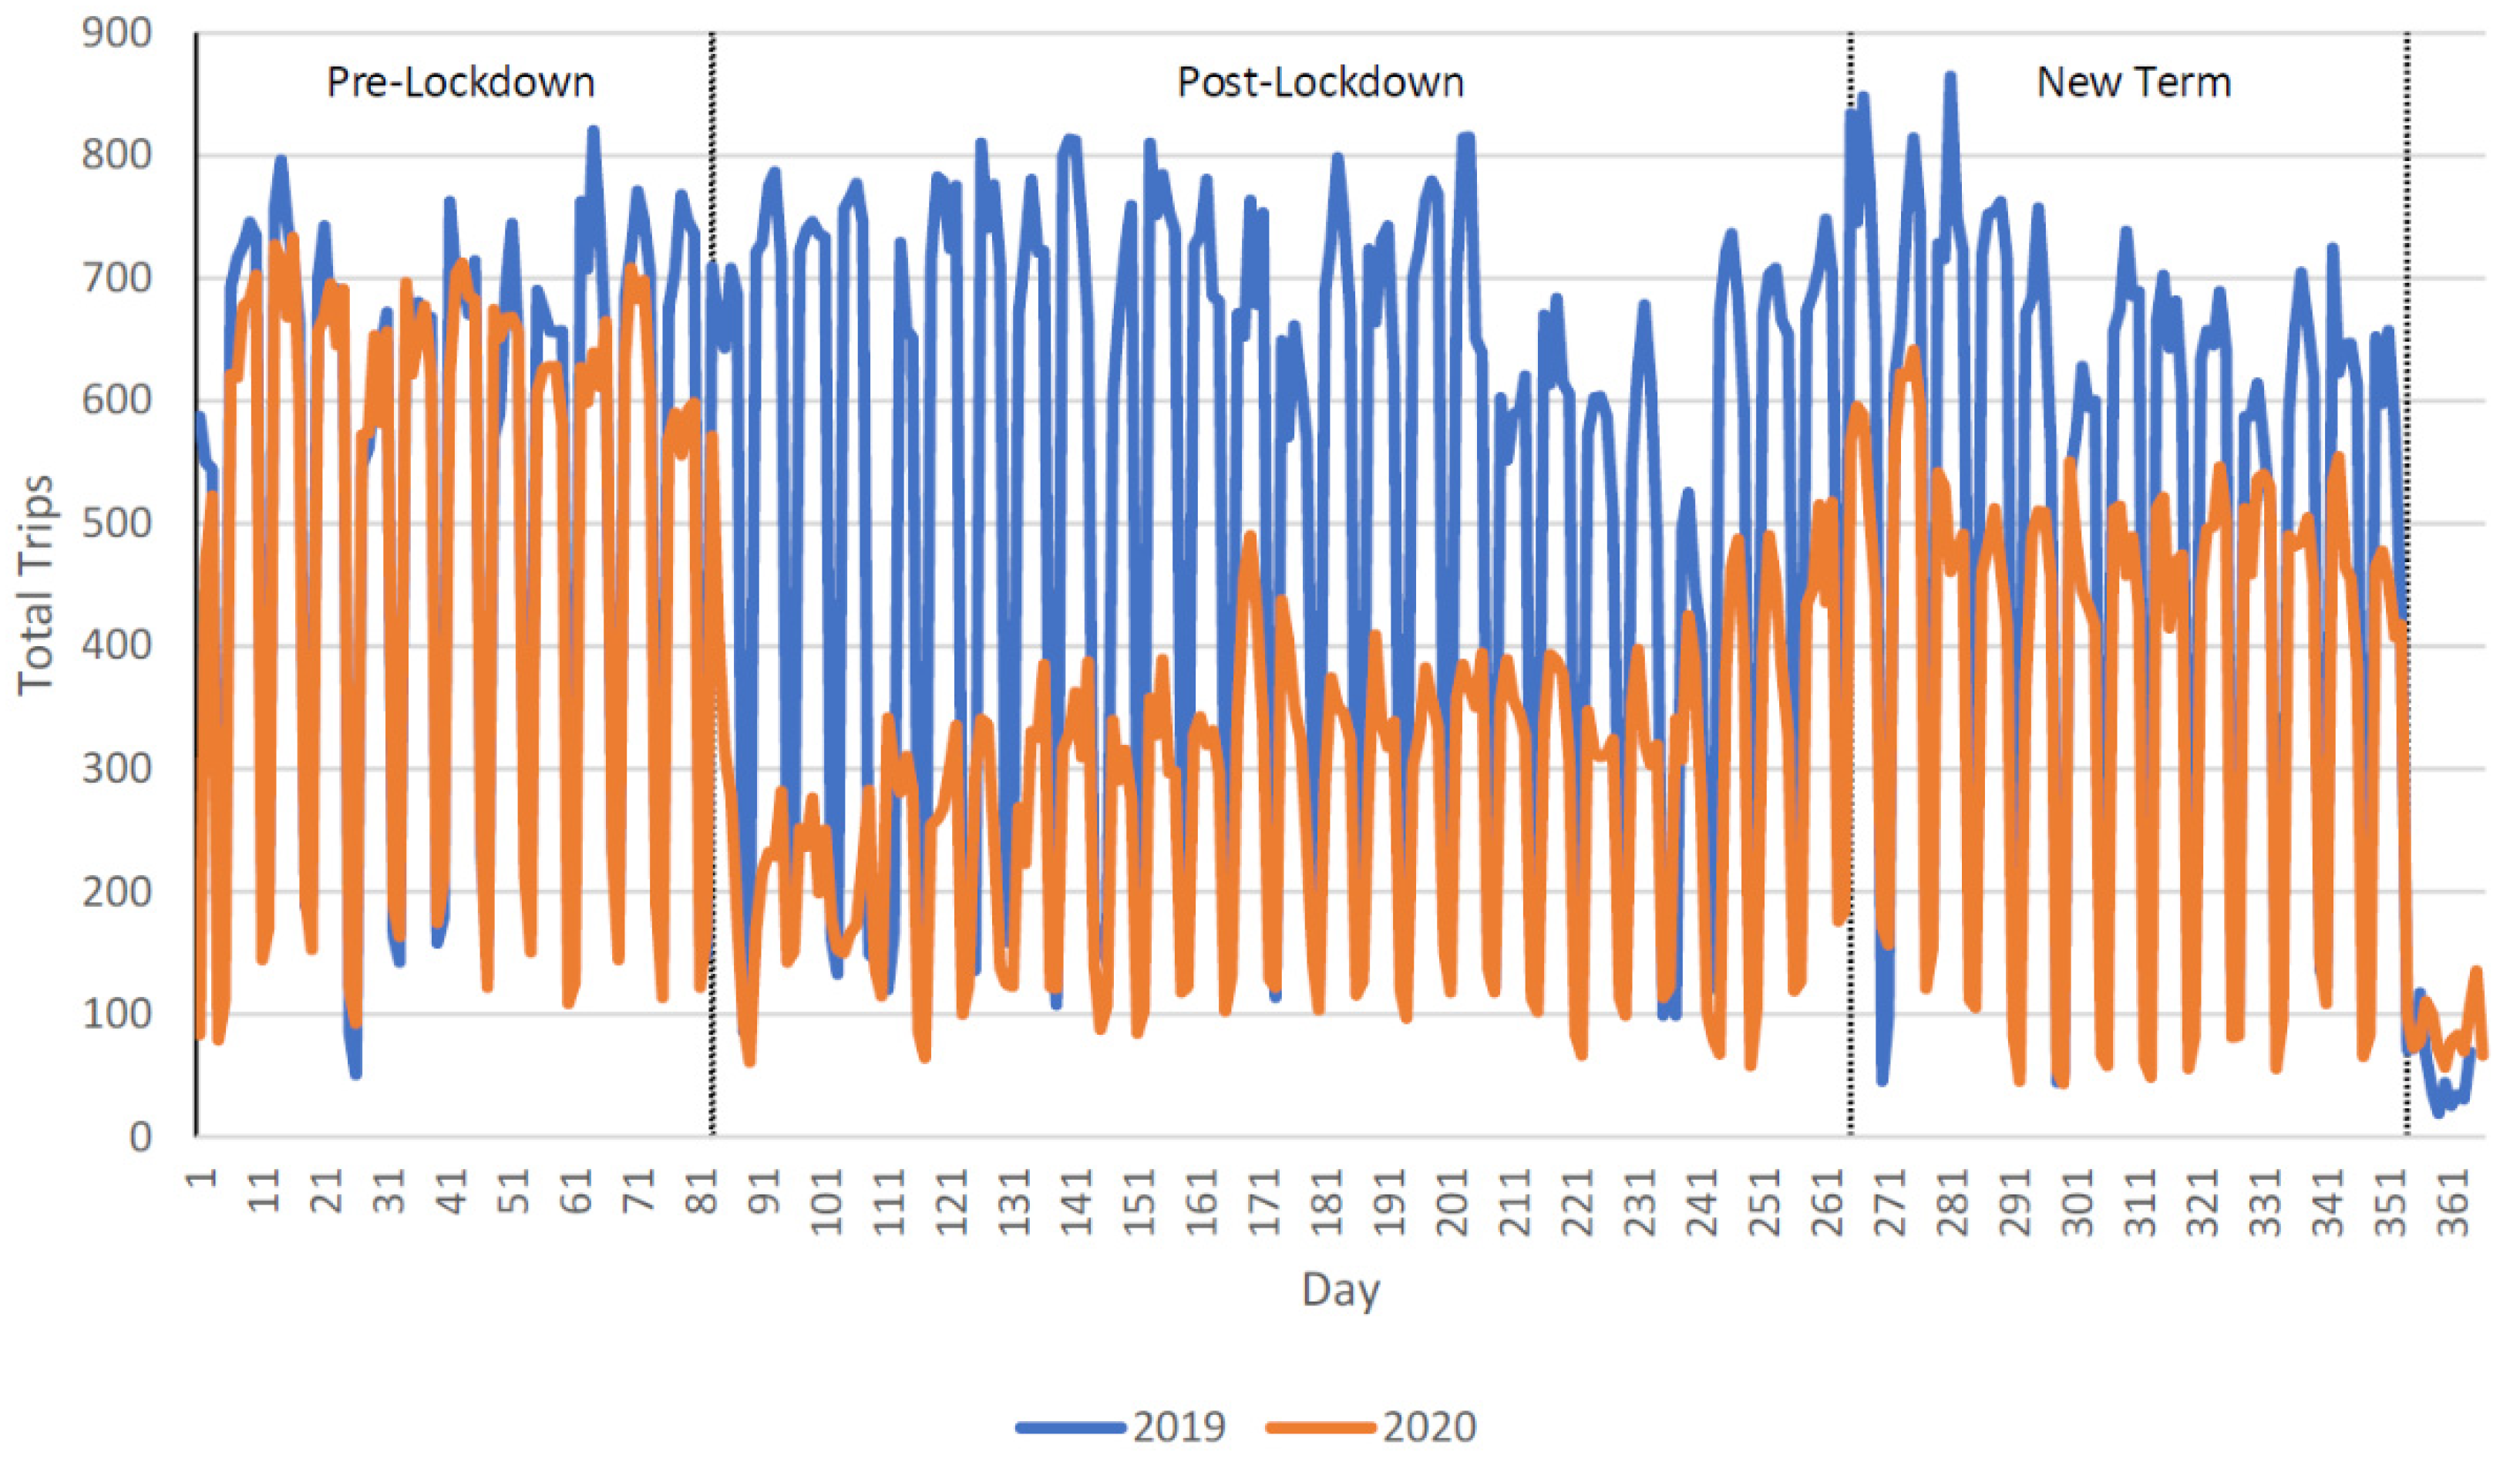
The impact of the pandemic on the operation of the university fleet was analysed by comparing the trips taken in 2019 and 2020.
Figure 3 shows the total number of trips taken by the fleet on each day over these two years.
In both years, a higher number of trips were typically taken by the fleet during the working week with much reduced activity at the weekends. A cyclical pattern is therefore evident reflecting this behaviour. On 23 March 2020 (day 83), a national lockdown was announced by the UK government with an instruction to “stay at home” wherever possible. This strict lockdown stayed in force until a gradual reduction in restrictions began on the 1 June (day 153) with the phased re-opening of schools, followed by the opening of non-essential shops on the 15 June (day 167) and the introduction of more general relaxation in restrictions from the 23 June (day 175). A second wave of infections however prompted a tightening of restrictions from the 14 September (day 258) and a second national lockdown starting on the 5 November (day 310), which lasted for four weeks.
The impact of the first national lockdown on the behaviour of the fleet can be clearly seen in the figure. Many fewer trips were taken immediately following the announcement, however, despite the ongoing upheaval and changes in national restrictions no obvious correlation between fleet behaviour and the subsequent key events was apparent. This was likely because most staff continued to work at home during this period, with online teaching dominating. However, the start of the new academic year on 21 September (day 265) saw a return to more usual patterns of trips, albeit at a reduced level. Fleet activity was greatly reduced during closure of the university for Christmas holidays at the end of both years.
3.2. Available Capacity
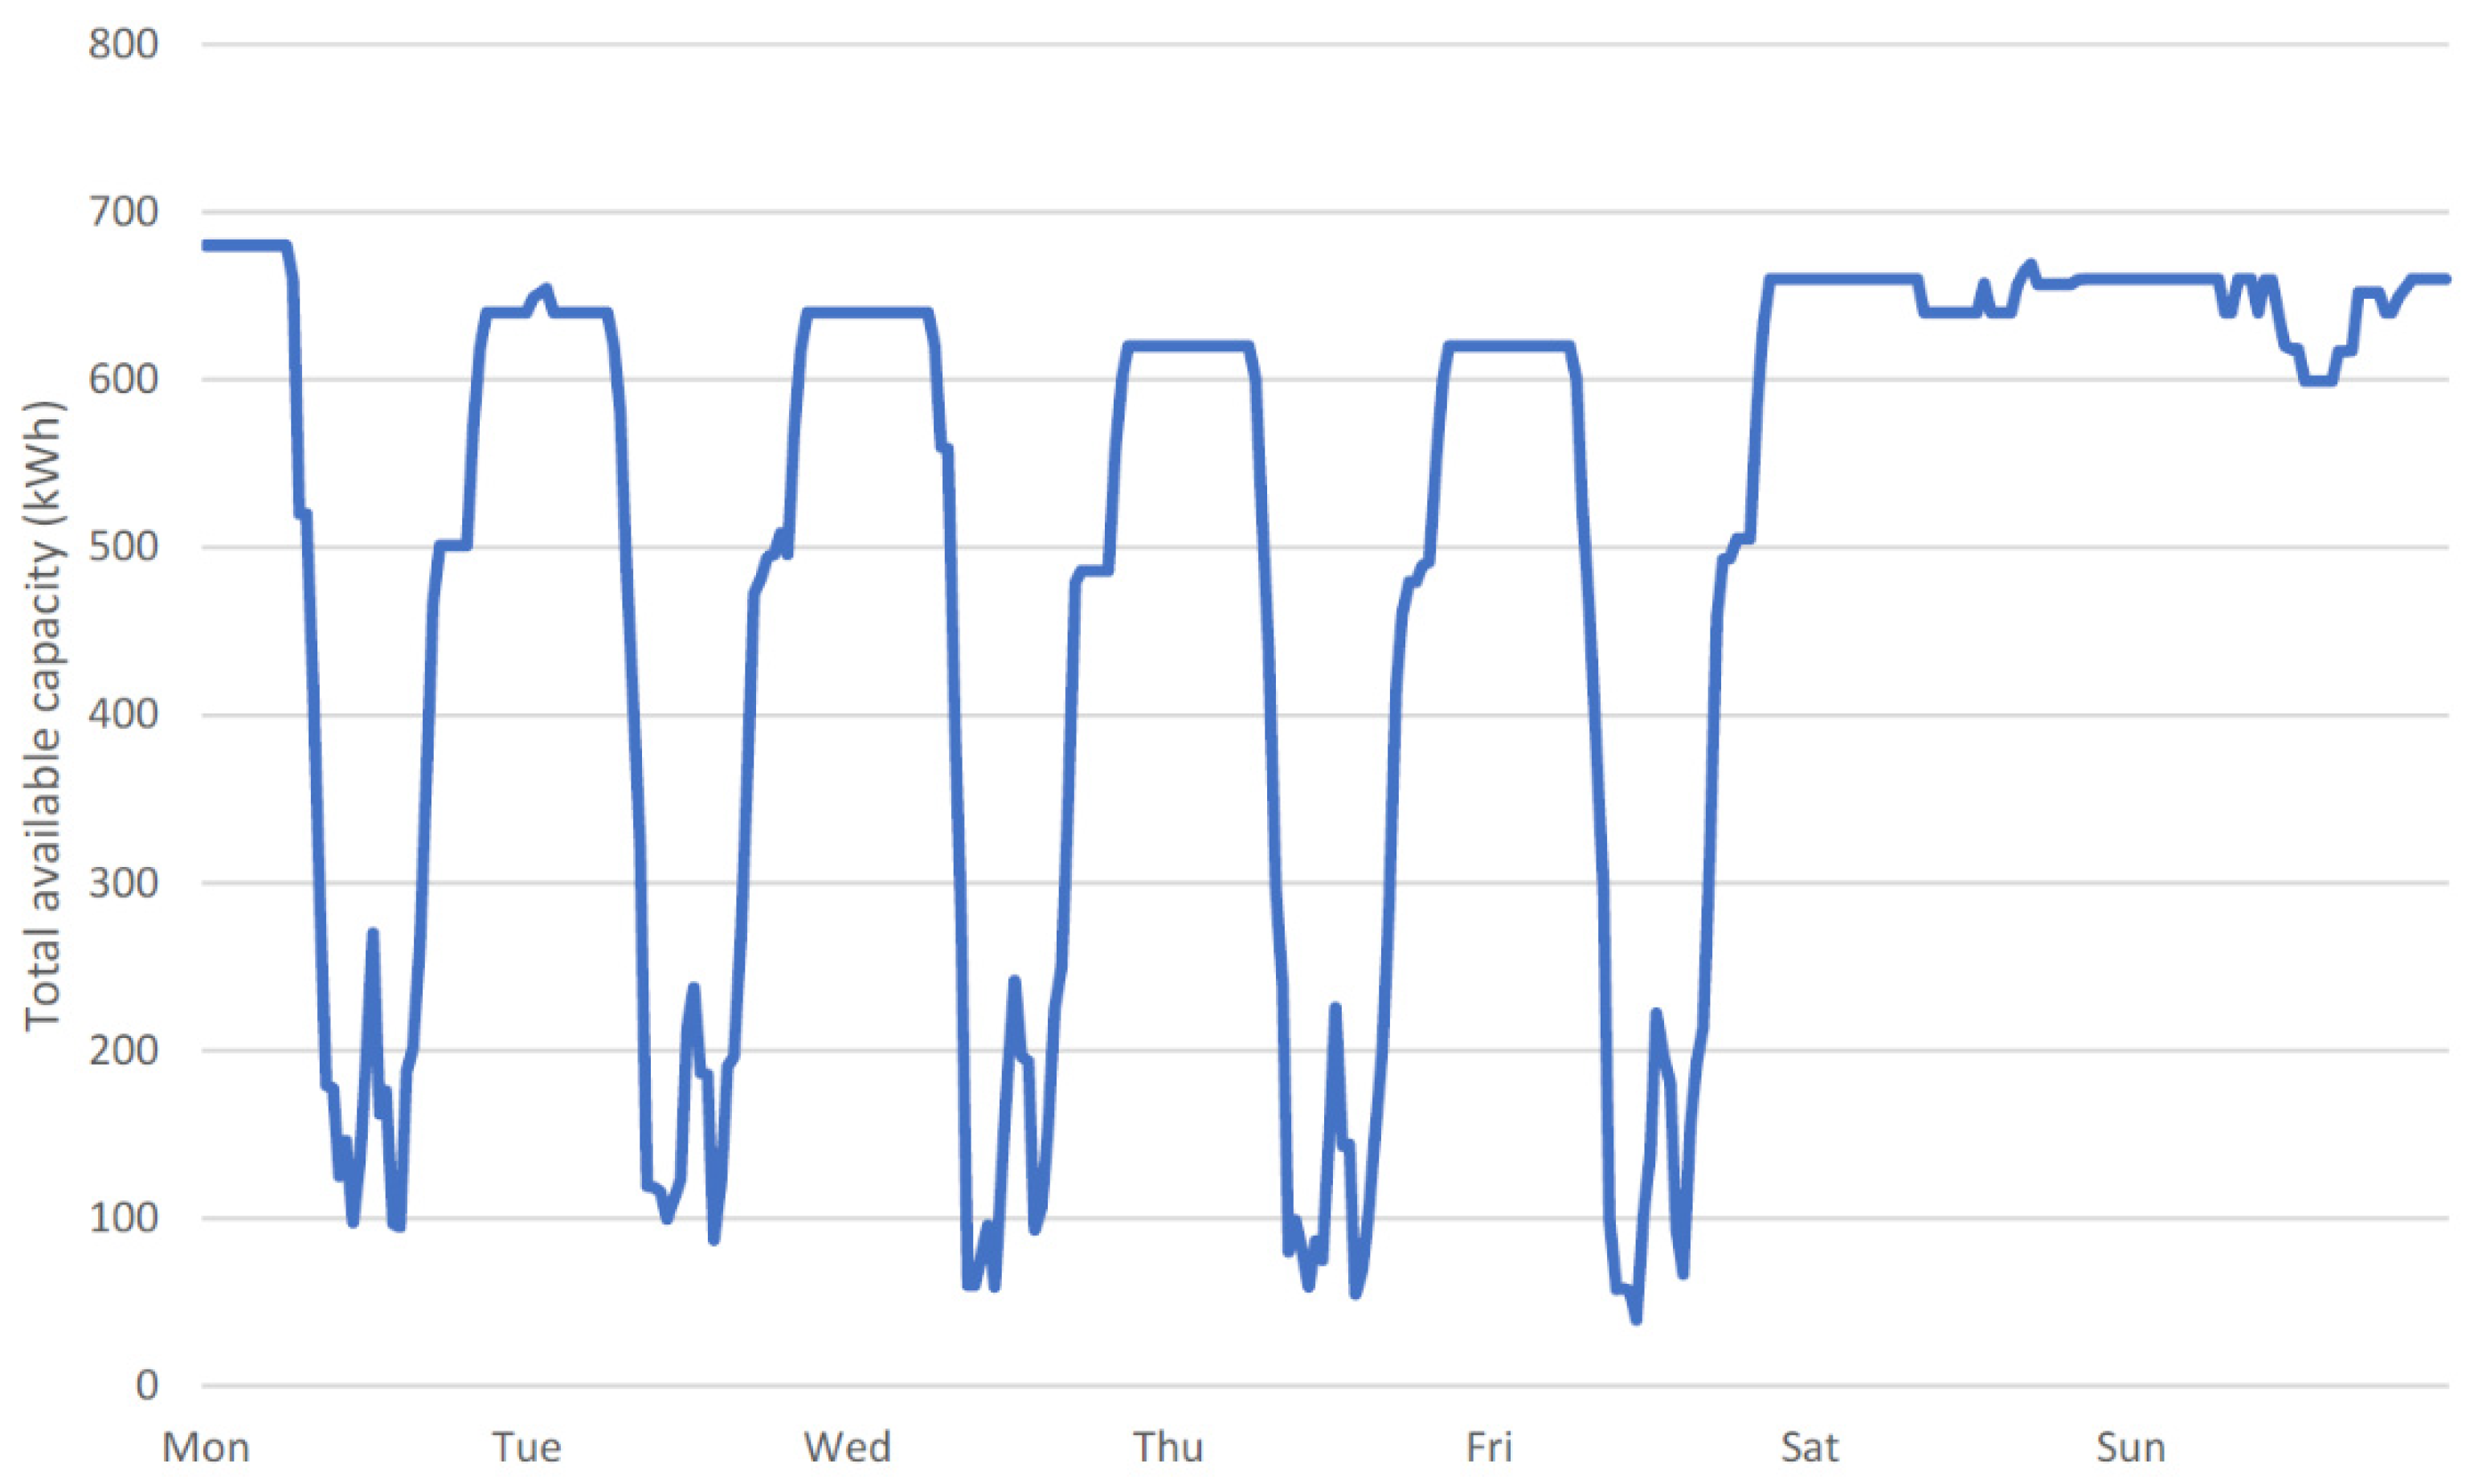
A typical pattern of simulated available capacity for a pre-pandemic week during 2019 is shown in
Figure 4. During the working day, available capacity was typically reduced as vehicles were used more regularly with a consistent spike corresponding to lunch break. Available capacity was far greater during overnight periods and during the weekends when vehicles tended to be more stationary.
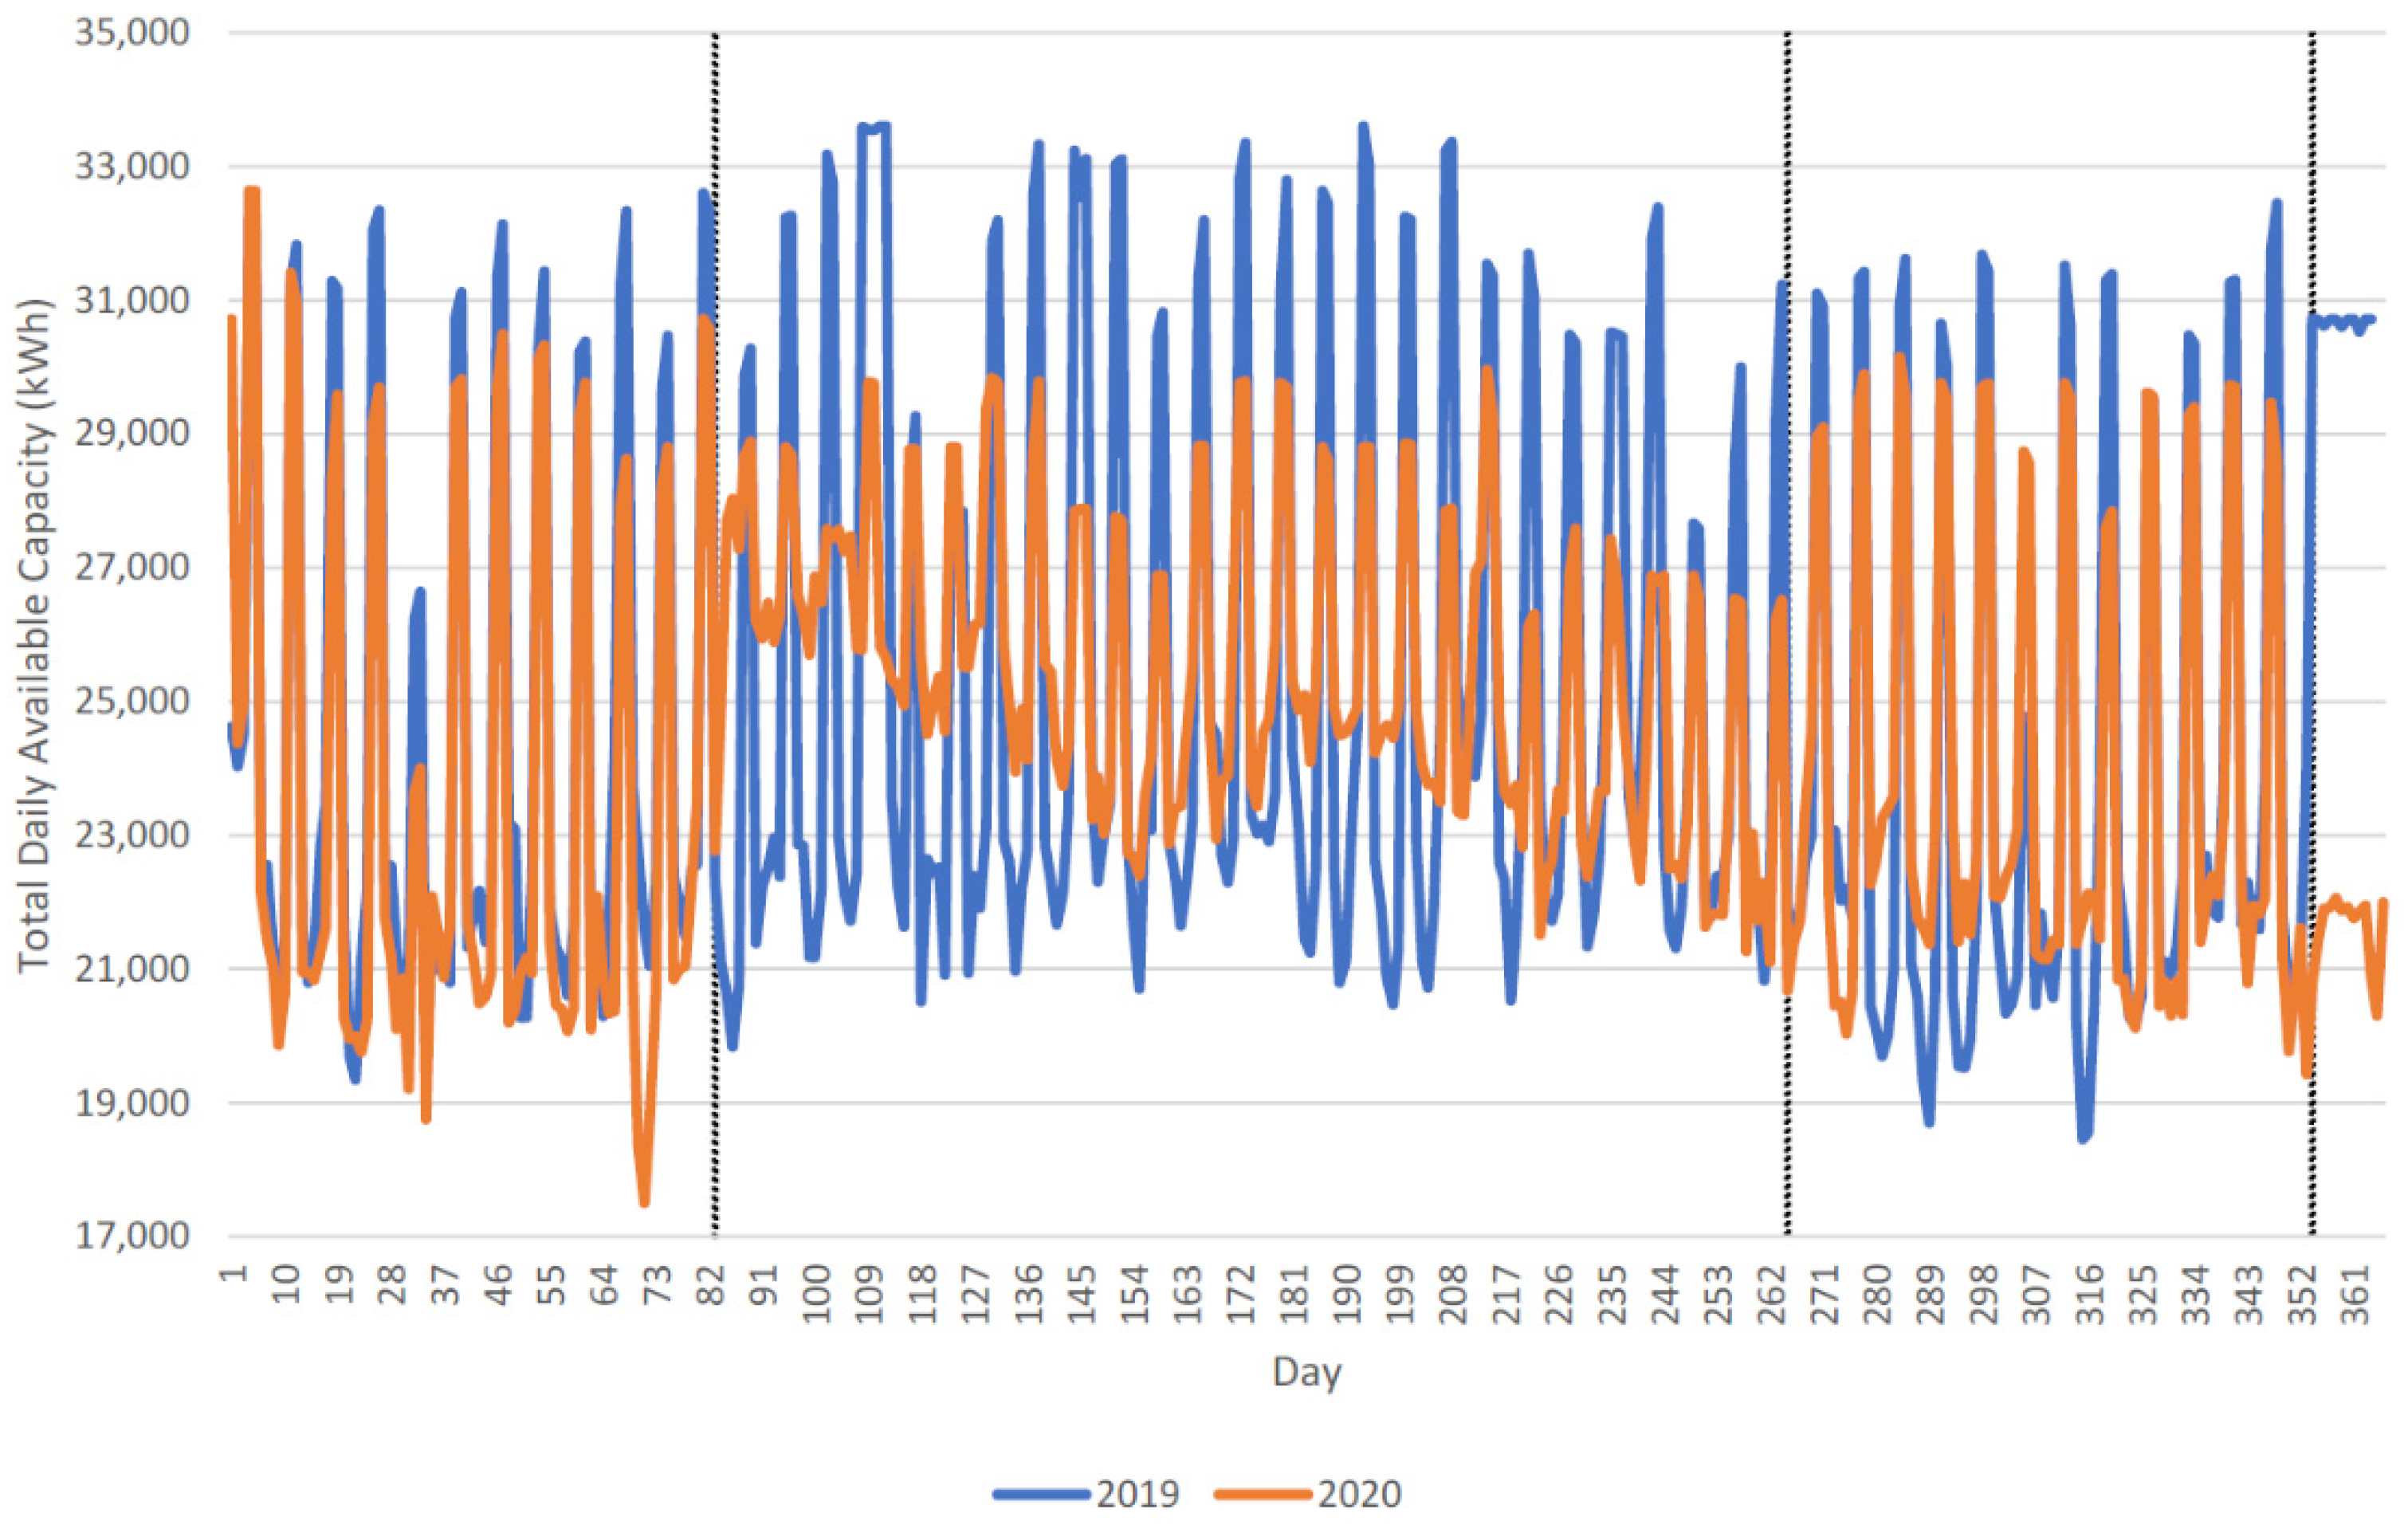
The available capacity for all half-hour periods during each day was summed to yield the total daily available capacity, which is shown over the 2-year period in
Figure 5. In contrast to total trips shown in
Figure 3 the peaks in this graph represent the weekends and the troughs working days.
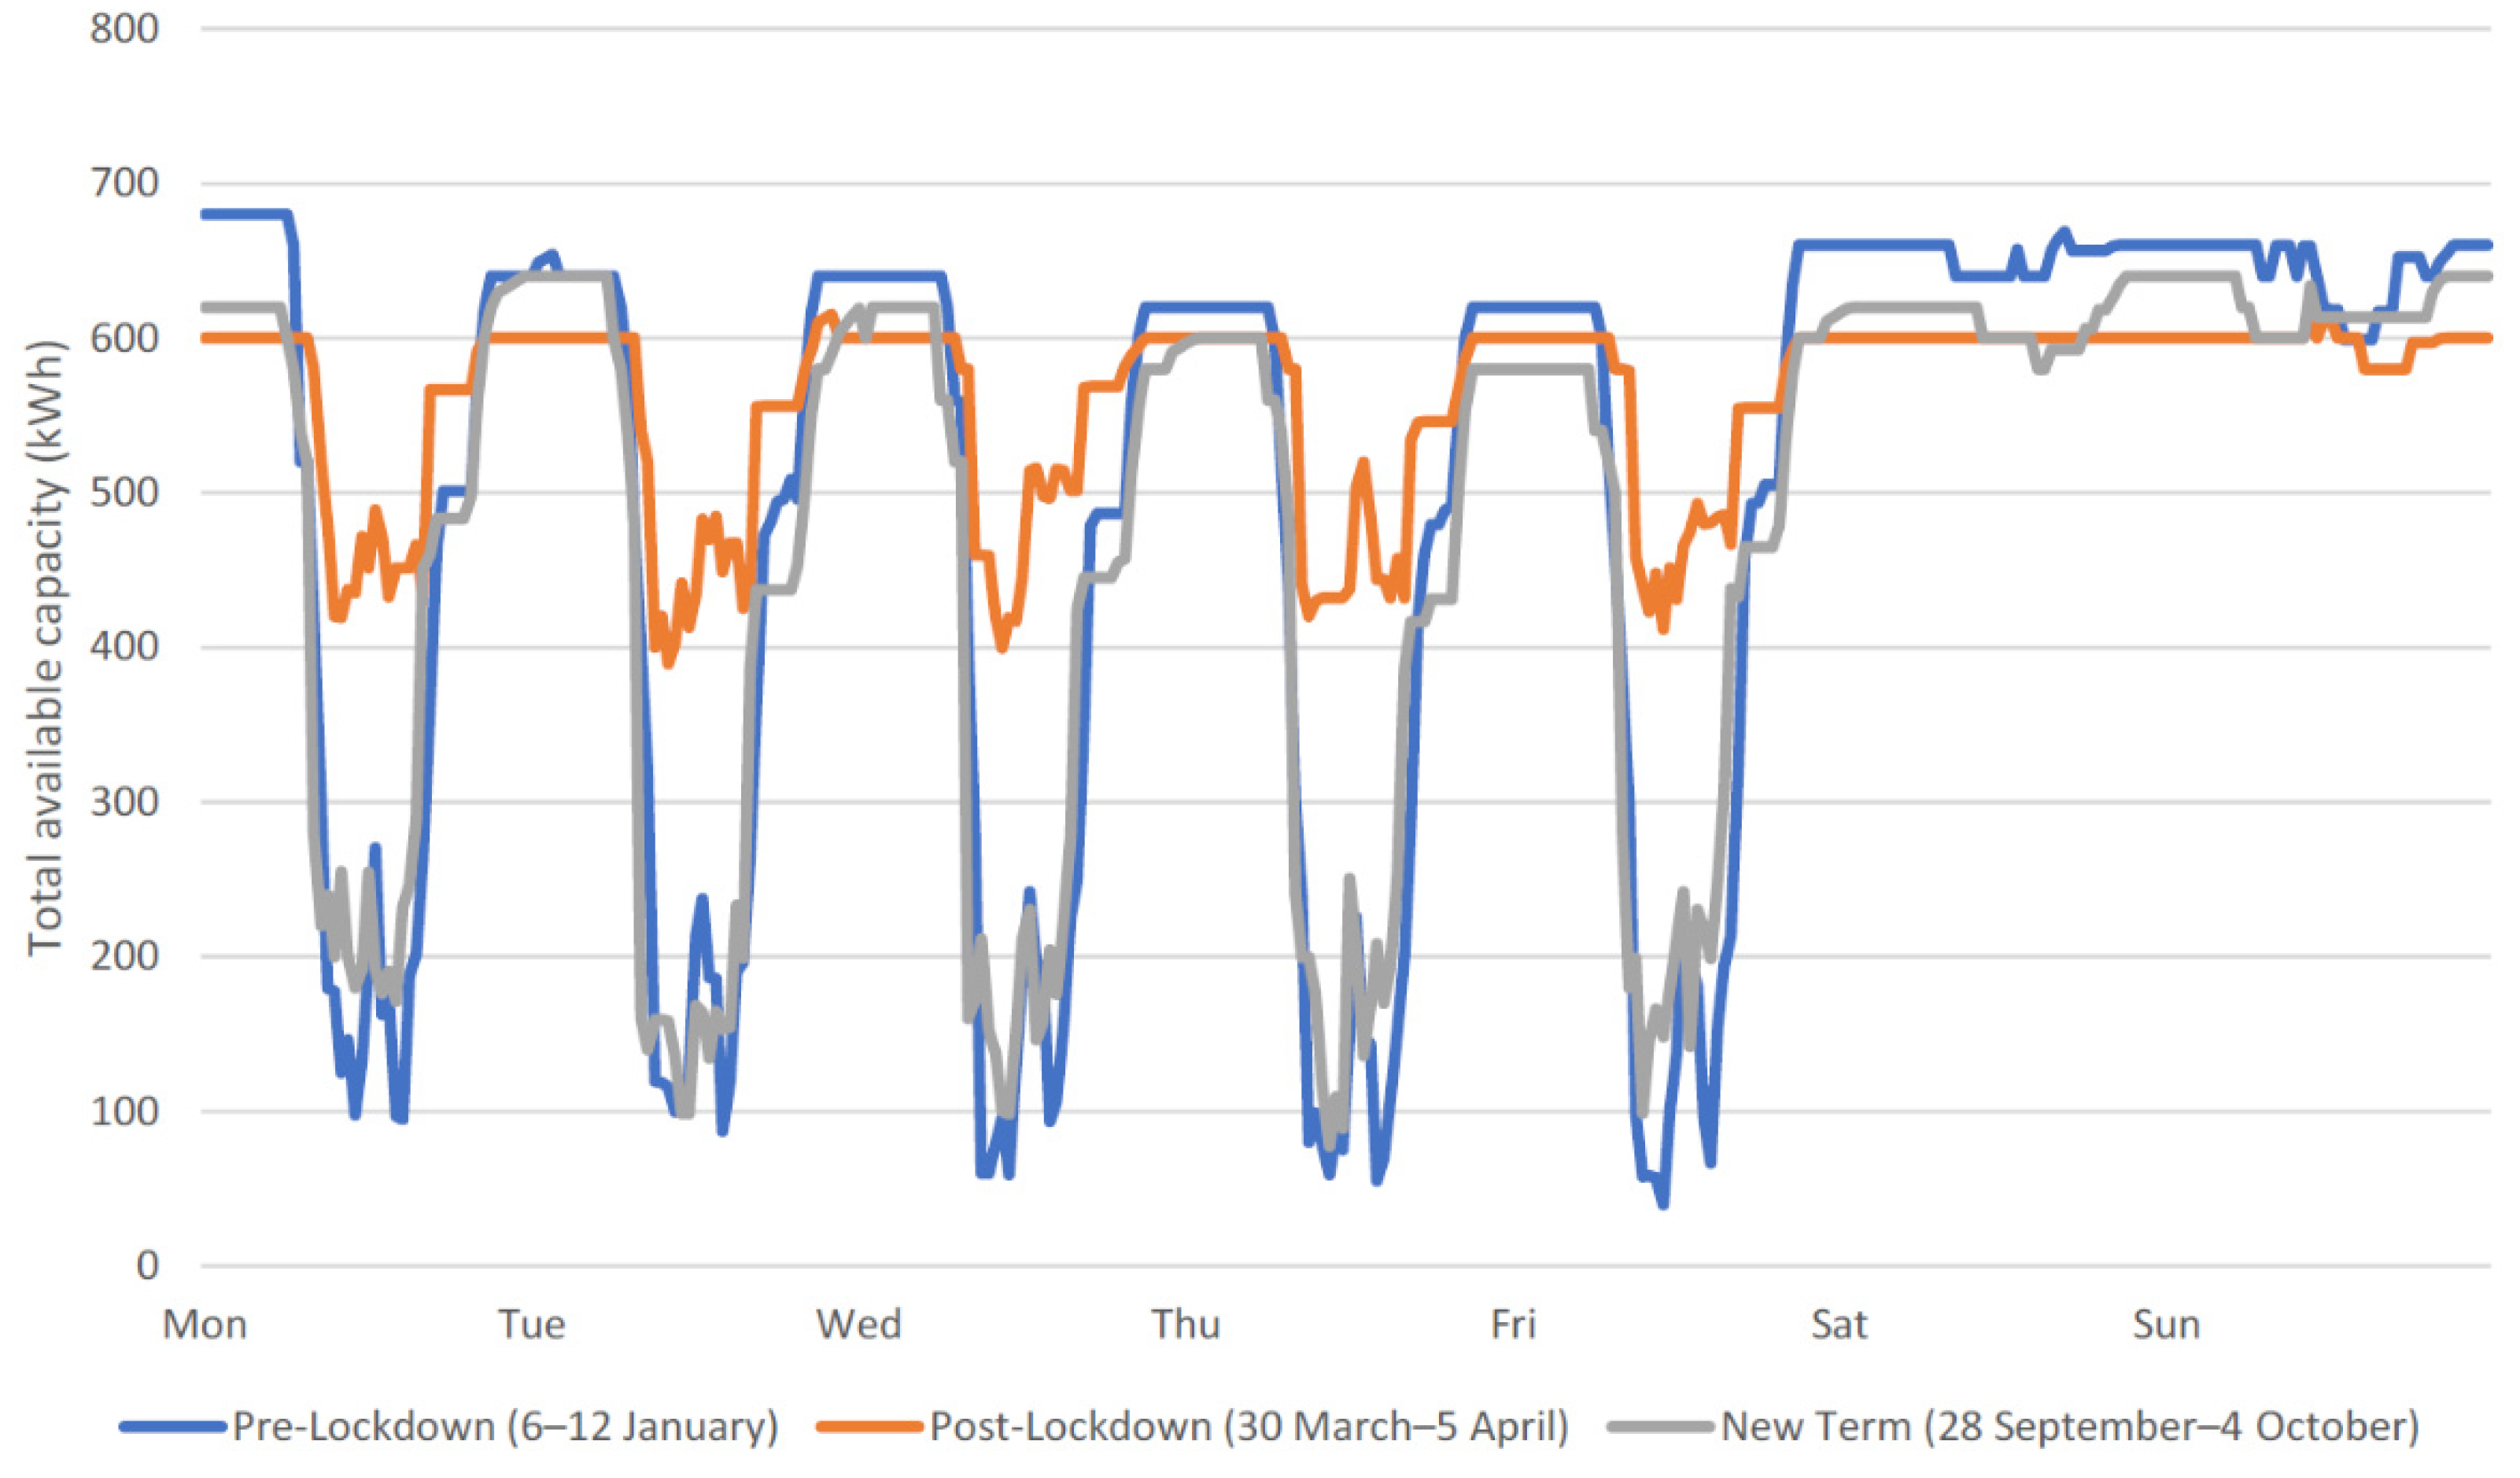
The impact of the lockdown announcement on day 83 is again evident in the figure. Available capacity in 2020 followed a pattern consistent with the previous year up until this date following which there was a fundamental change. Available capacity was typically reduced but less variable suggesting that vehicles became more static as the activity of the fleet reduced during the post-lockdown phase and that they were parked away from V2G charger locations more frequently. A pattern more consistent with 2019 was again evident at the start of the new academic year until the Christmas holidays, when available capacity was greatly reduced in 2020 compared to 2019 despite a similarly reduced number of trips. This suggested that the stationary location of the vehicles differed, and they were more frequently parked away from the V2G charger locations. An example weekly profile from the post-lockdown and new term phases are compared with an example week from the pre-lockdown phase in
Figure 6.
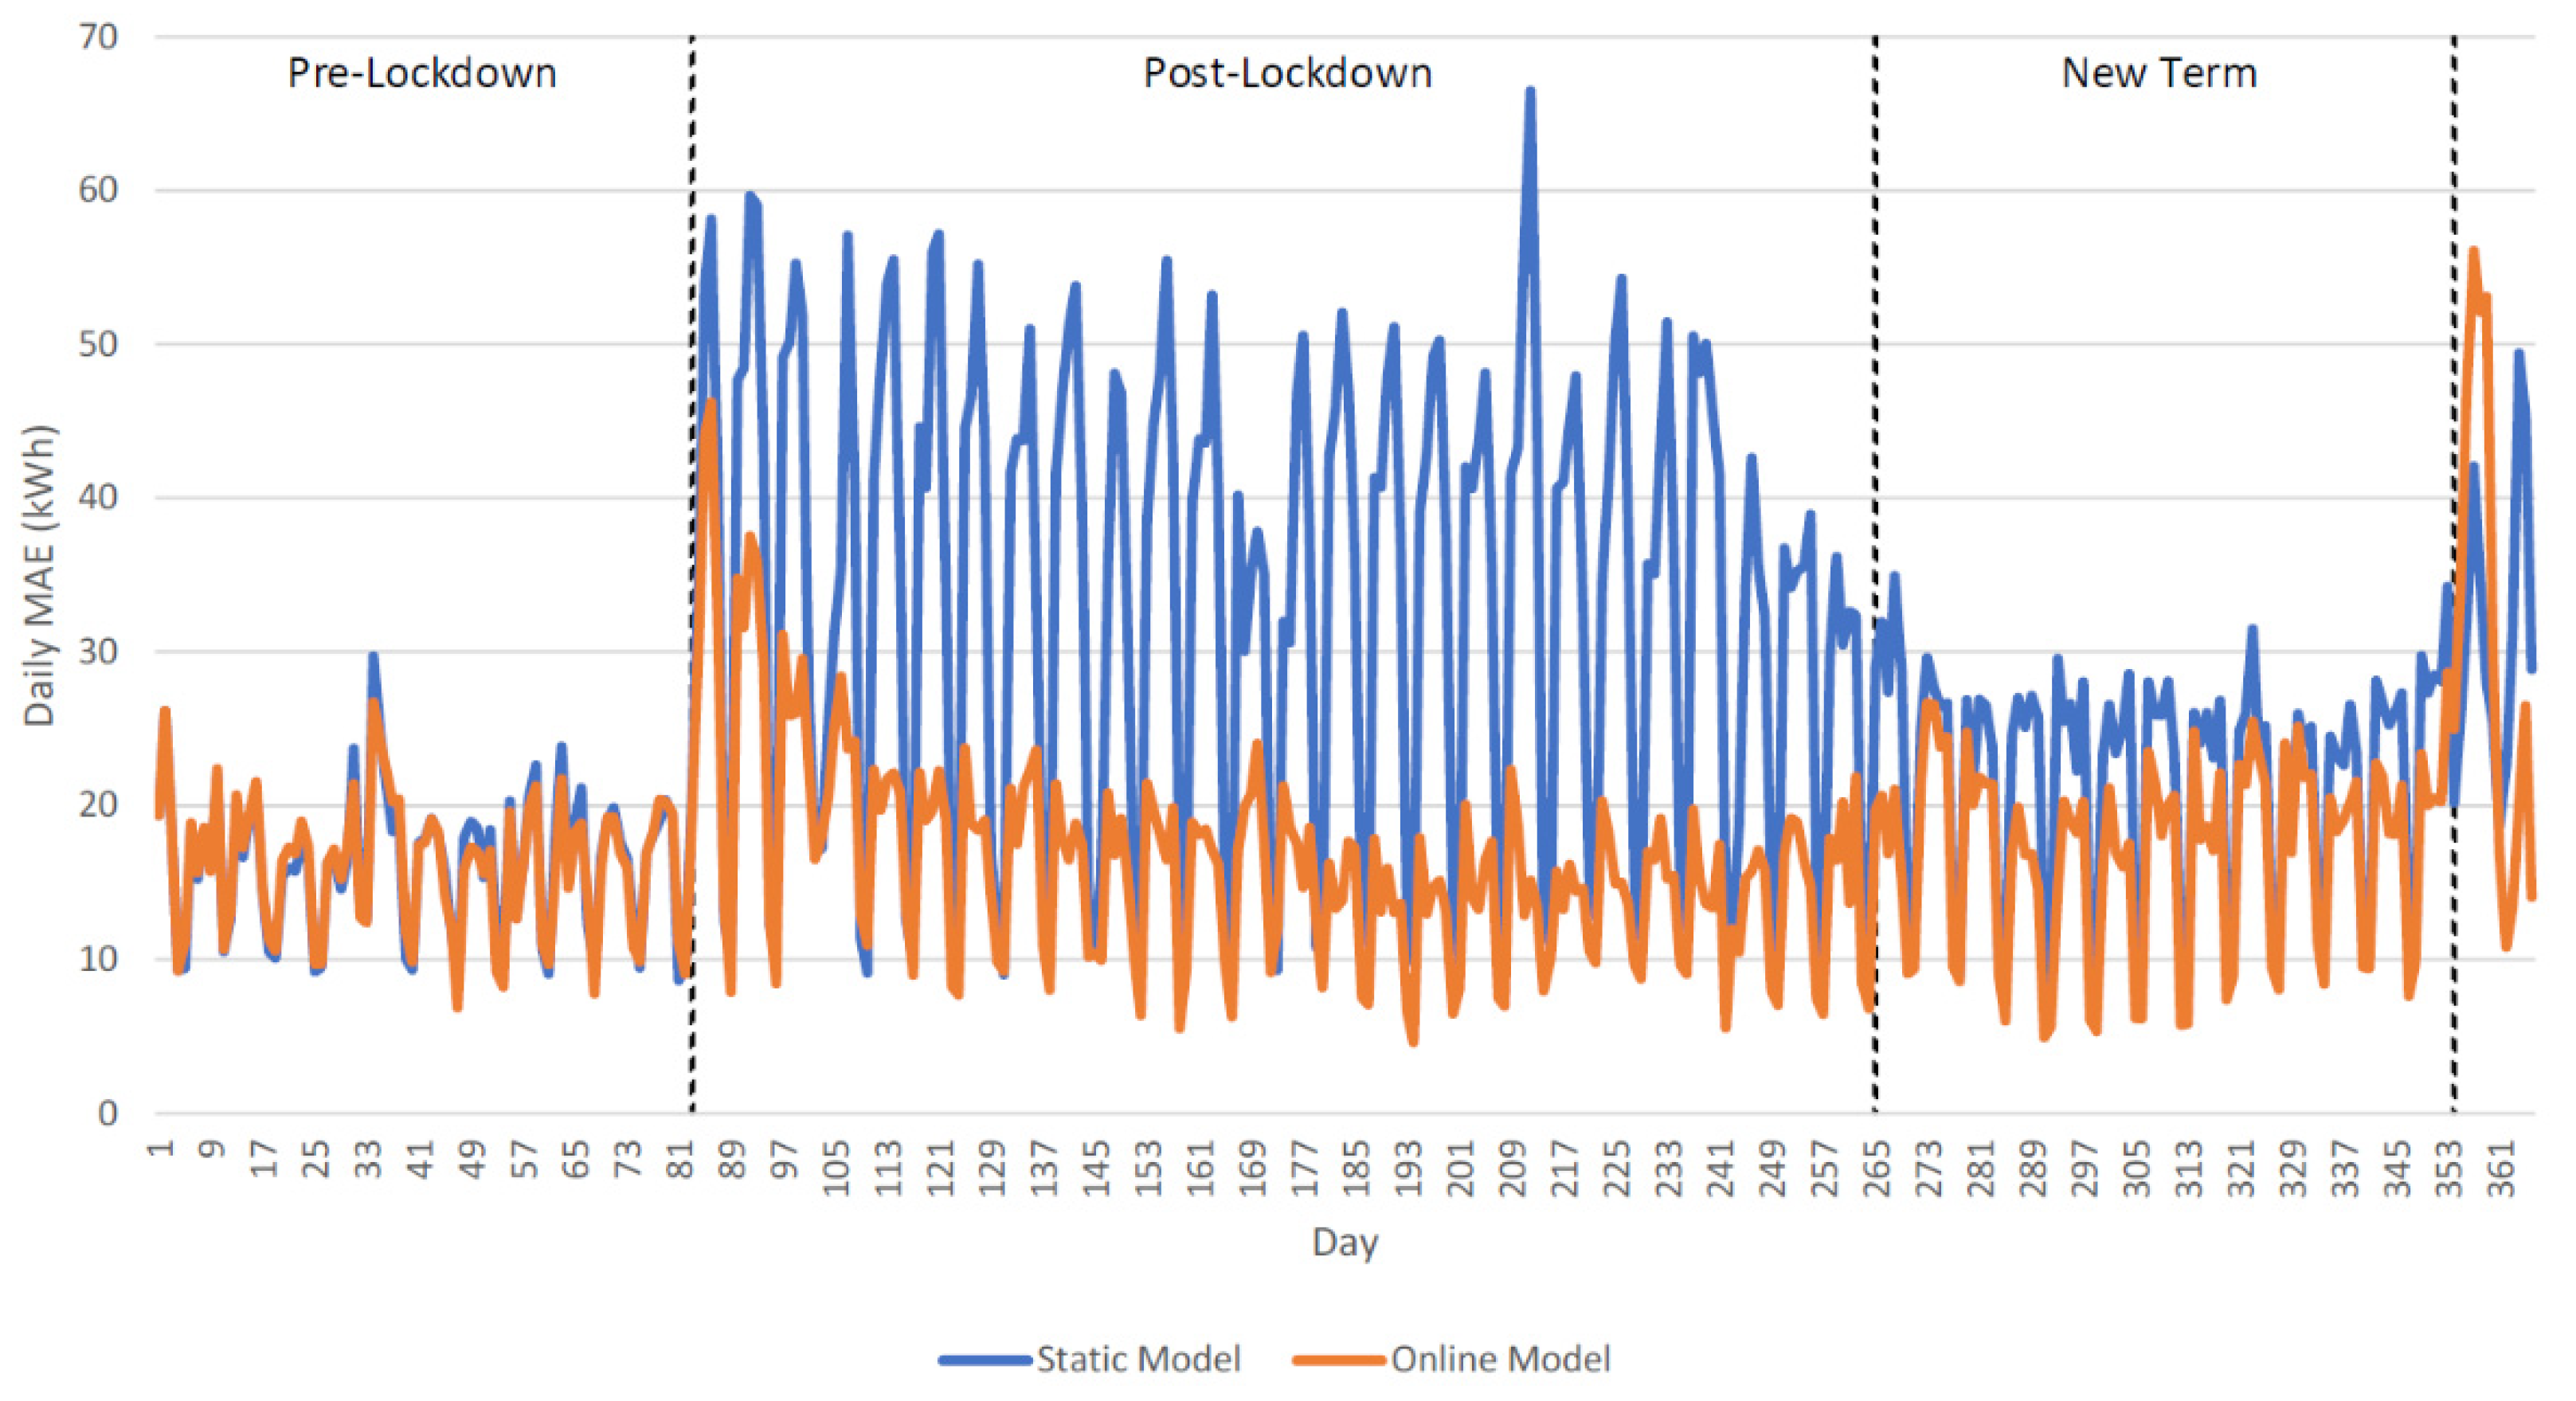
3.3. Static Model
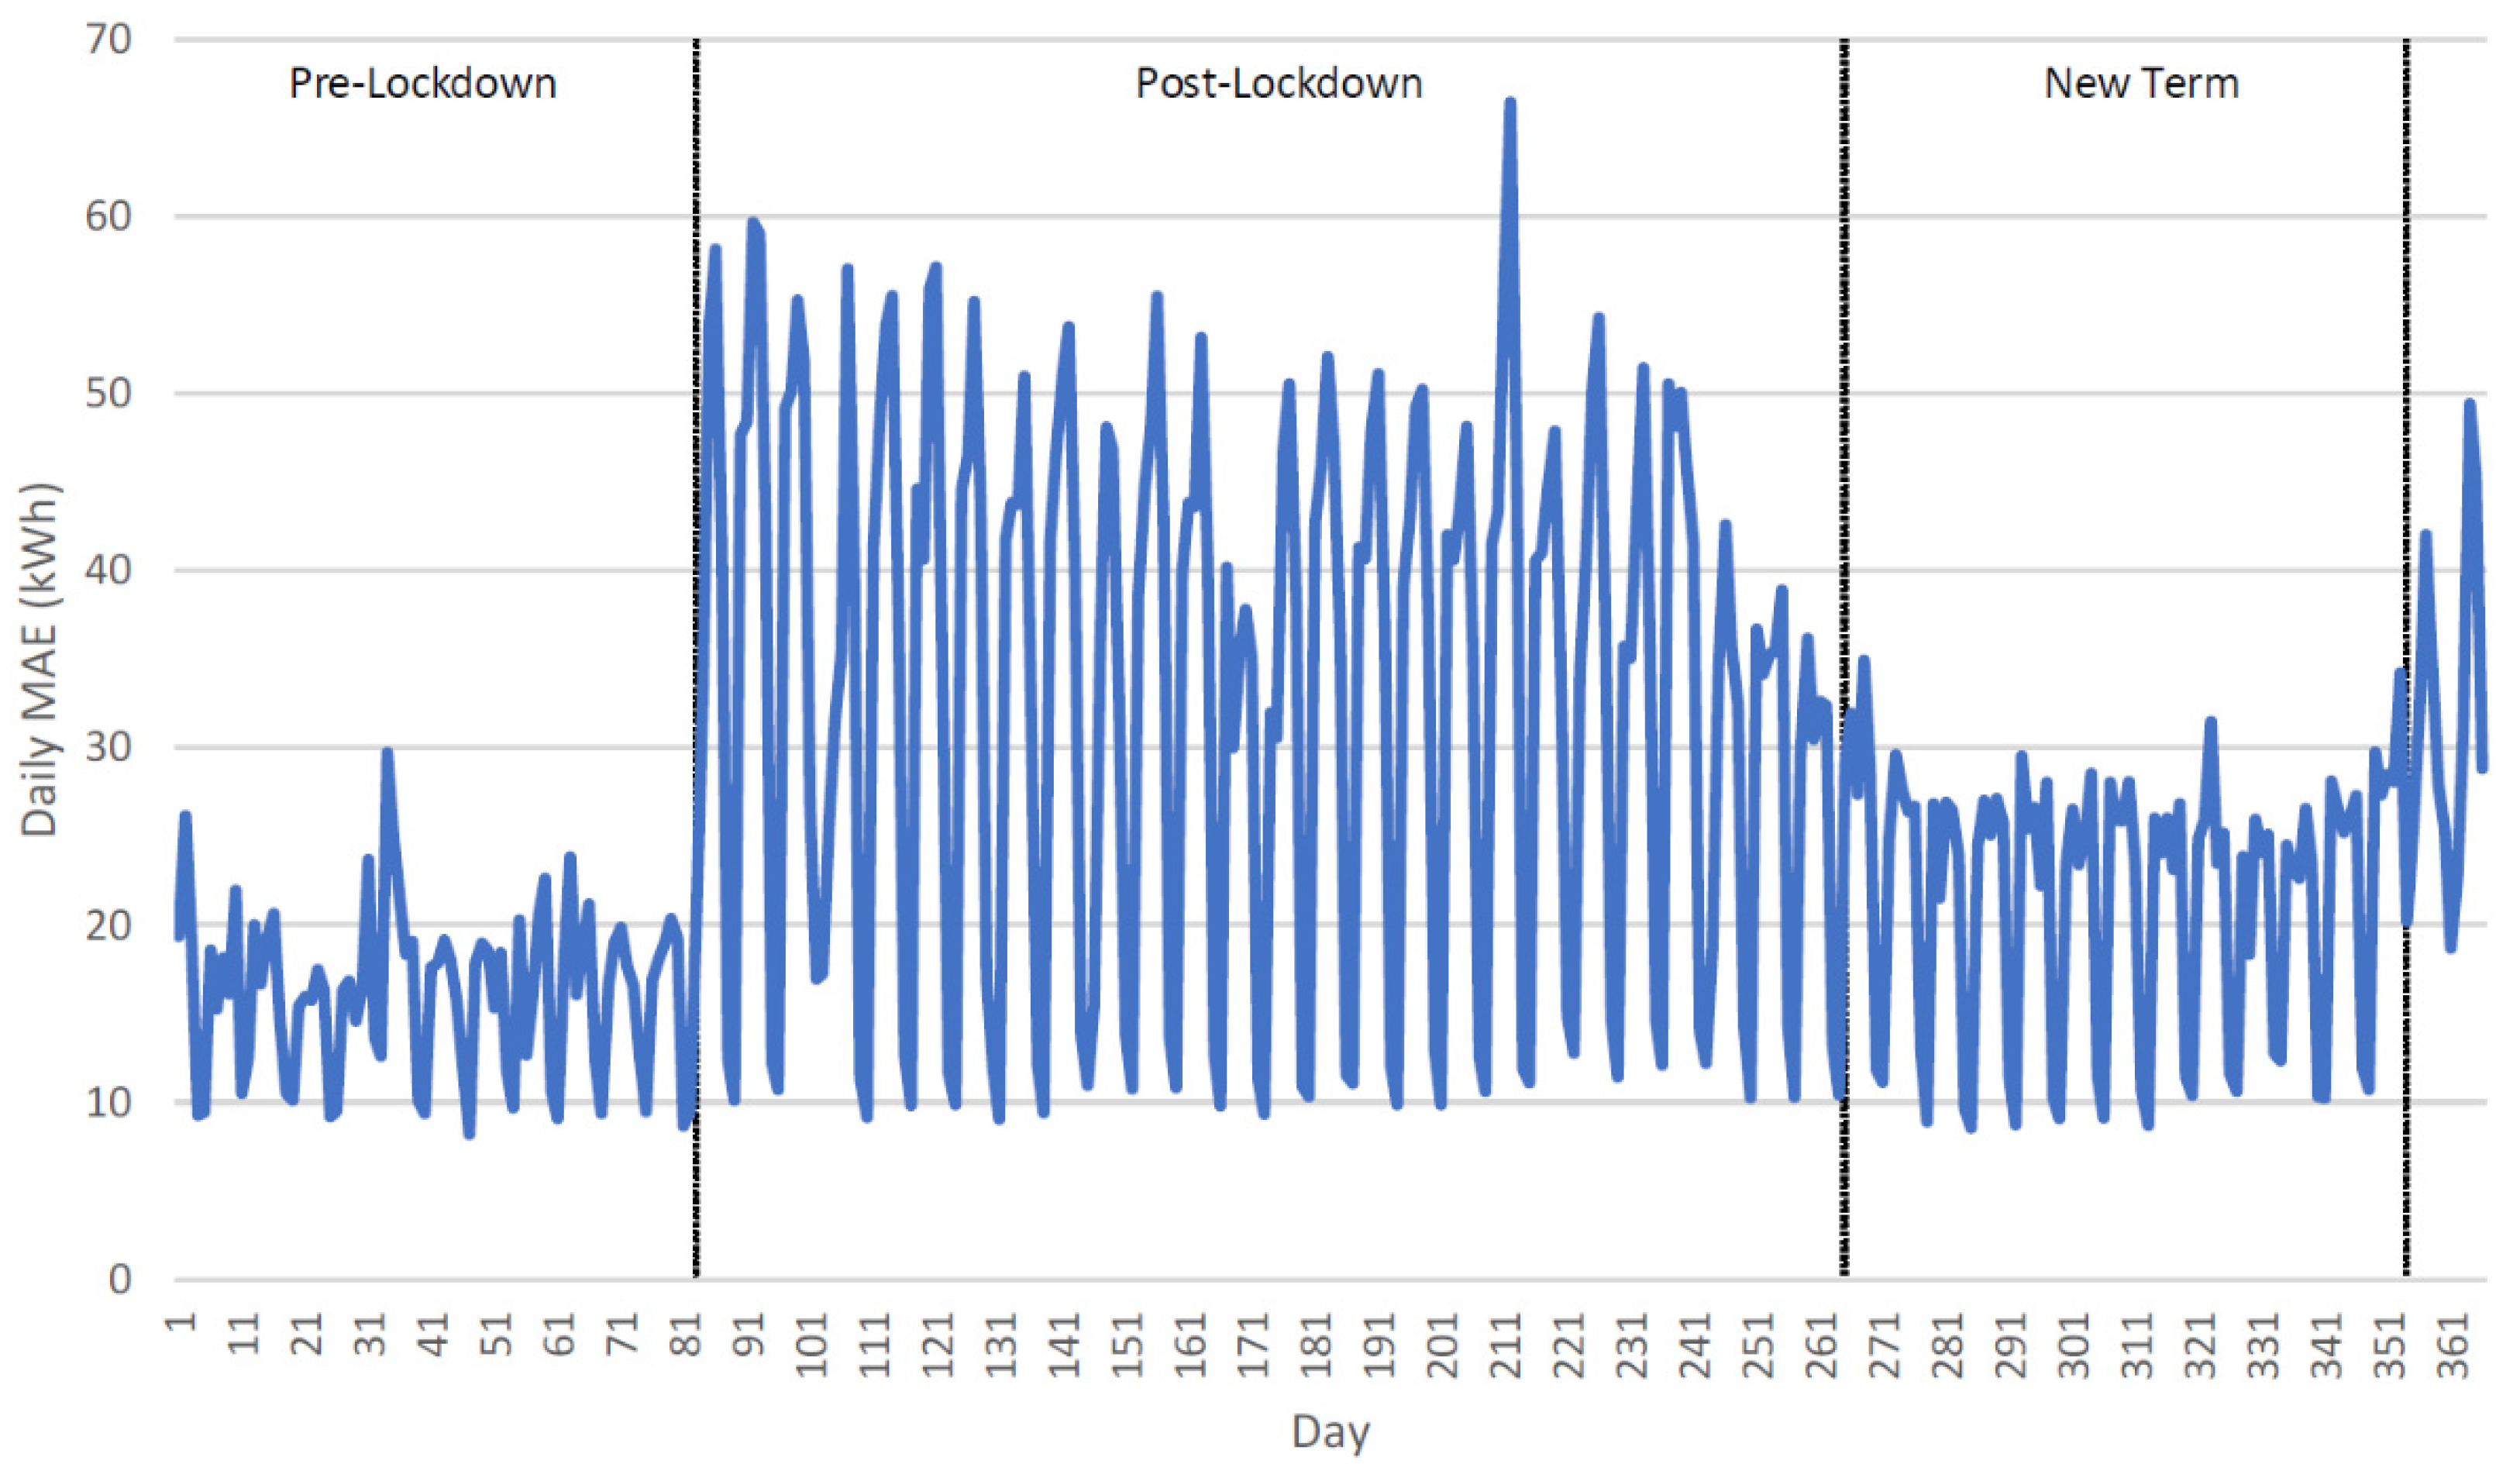
A series of 10 independent runs were performed to train a CNN-LTSM model on the 2019 dataset. The resulting networks thus represented typical pre-pandemic behaviour of the fleet. Following training, each network was tested using the 2020 dataset, which included the fluctuations in fleet behaviour resulting from the pandemic. Online machine learning was not enabled, and thus the model remained static throughout this period. Daily mean absolute error, MAE
d, for each day of 2020 was calculated as described in
Section 2.4. Average results for the 10 models are shown in
Figure 7.
Prediction errors during weekends were typically much lower than during weekdays as fleet behaviour was typically more static and predictable. However, the figure reveals a dramatic increase in prediction errors following the start of lockdown on day 83. Average MAE
d for the pre-lockdown phase was 16.2 kWh (
s = 4.6), which more than doubled to 33.7 kWh (
s = 15.8) for the post-lockdown phase before reducing to 22.1 kWh (
s = 7.4) for the new term when fleet activity more closely reflected 2019 behaviour. Prediction errors again increased as the holiday period began, which was due to the different pattern of available capacity in 2020 revealed in
Figure 3.
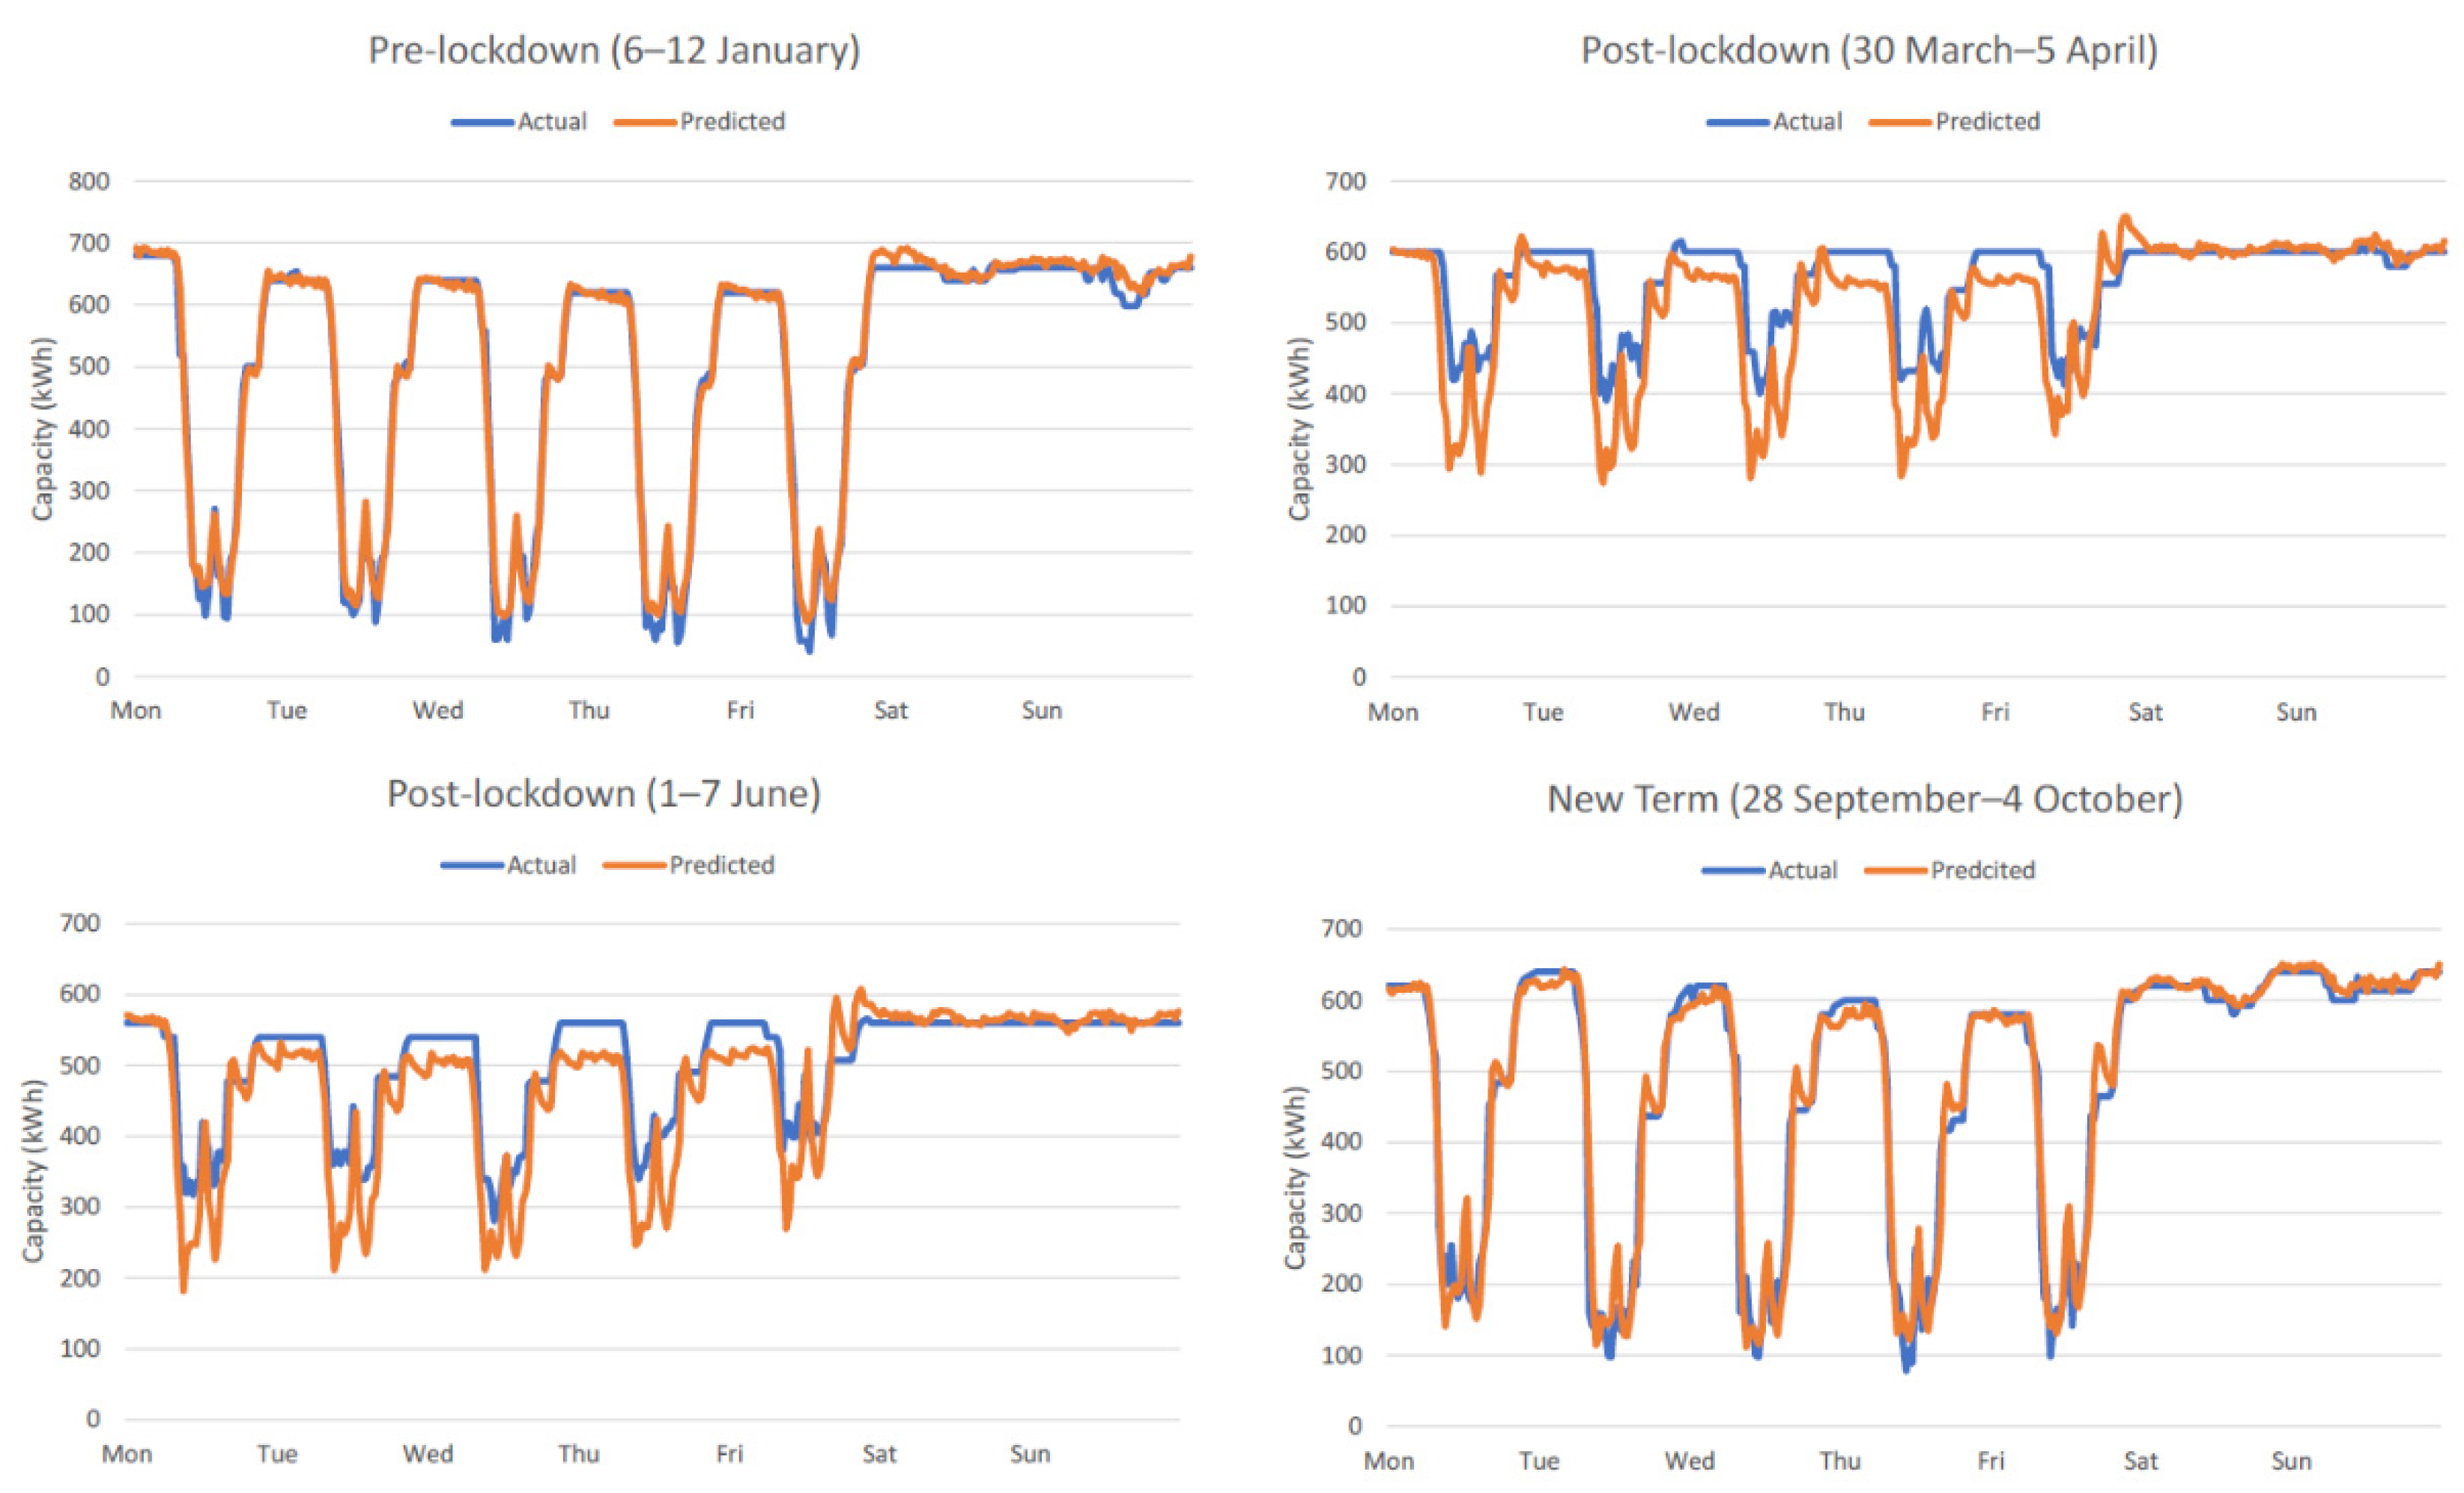
Further insight into model performance was gained by analysing the detailed predictions for four typical calendar weeks: one each during the pre-lockdown and new term phases and two at different times during the post-lockdown phase as shown in
Figure 8. In the pre-lockdown phase, week beginning 6 January 2020, model predictions followed actual capacity closely and MAE during this period was 15.8 kWh (
s = 16.2). However, these errors grew substantially in the post-lockdown week beginning 30 March 2020 and MAE increased to 40.1 kWh (
s = 43.2). Similar prediction errors were also apparent later in the post-lockdown period, week beginning 1 June 2020, when MAE was 37.1 kWh (
s = 35). As fleet behaviour returned to patterns more representative of the previous year in the new term, week beginning 28 September 2020, MAE reduced to 21.8 kWh (
s = 26.8).
3.4. Online Machine Learning Model
The same 10 independent models trained and tested in
Section 3.3 were used to directly compare performance with online machine learning. MAE
d was again calculated for each day of 2020 sequentially. However, following each 7-day period, the models were re-trained for two epochs with a training dataset that was expanded to include the additional data collected during that period as described in
Section 2.3. Average results for the 10 models are shown in
Figure 9.
Average MAEd for the pre-lockdown phase was 16.1 kWh (s = 4.4), which was similar between both models. Following lockdown, performance of the online machine learning model also decreased; however, prediction errors were quickly reduced and the overall MAEd during this period was only slightly higher than pre-lockdown at 16.5 kWh (s = 6.9). This was a 51% improvement over the model without online machine learning. A Welch’s t test was performed to determine the statistical significance between the models with and without online machine learning, which revealed that the improved prediction errors of the online model were highly statistically significant (p < 0.001). Performance of the online model during the new term phase also improved over the static model with an average MAEd of 17.1 kWh (s = 6.3), which was a 22.6% improvement and again a highly statistically significant result (p < 0.001).
Detailed predictions for the same four weeks detailed in
Section 3.3 are shown in
Figure 10. MAE for the pre-lockdown week rose slightly for the online model to 18.98 kWh (
s = 15.4), primarily due to a small overestimation of available capacity during the overnight periods. However, this was not a statistically significant change (
p = 0.05). The post-lockdown week beginning on 30 March 2020, was the second full week of lockdown in the UK and therefore the model had been updated once with training data representative of this period at the end of the first week. Even with such limited post-lockdown training data, MAE was considerably lower than the static model at 29.58 kWh (
s = 28.6)—a 26.2% improvement. However, this again was not statistically significant (
p = 0.07). Clear improvements had, however been made by the post-lockdown week beginning on 1 June 2020. MAE for the online model was 15.76 kWh (
s = 17.6), which was a 57.5% improvement over the static model and a highly statistically significant result (
p < 0.001). MAE for the new term week beginning on 28 September 2020 was 14.77 kWh, which was a 29.4% improvement over the static model. However, this result did not reach statistical significance for this week (
p = 0.12).
4. Discussion
The pandemic that was declared in 2020 was an extreme example of the need for the predictive models at the heart of a V2G service to adapt to changes in the behaviour of participating vehicles and in available capacity. However, such abrupt changes may also occur due to other events such as company re-organisations, repurposing of vehicles or refreshing a vehicle fleet at the end of its lifetime. In more usual times, smaller variations may also occur due to less dramatic events as patterns of vehicle behaviour gradually evolve over time due to schedule changes for example. The results presented in this paper demonstrated the ability of the CNN-LSTM model to quickly adapt to the most abrupt of changes with a limited amount of retraining; only two additional epochs were used following each new week in 2020 and the predictive performance of the network was recovered within several weeks of the changes in fleet behaviour resulting from national lockdown. This was achieved by extending the training set each week during 2020 before updating the models initially trained using data from 2019. This approach was manageable given that only 52 additional weeks were used in the study. However, for ongoing operation of a V2G service over many years this approach is not scalable as the dataset would become too large and the neural network too expensive and time-consuming to retrain. This is of particular concern for networks such as the LSTM, which have a relatively large number of trainable parameters. This need for scalability is likely to necessitate the use of other techniques, therefore. One approach is to use a rolling window such that the training dataset remains the same size, this would also result in network predictions being more strongly influenced by the more recent past. Periods that in retrospect are deemed to be more representative of typical fleet behaviour could also be favoured for re-training. However, such pruning of the data risks discarding important knowledge embedded in the training dataset such as infrequent but impactful events or, as in this study, data that is more representative of long-term vehicle behaviour.
Another potential issue when retraining the network is that of catastrophic forgetting in which the network loses the ability to make predictions for historical events due to the adaptations to new data [
25]. This issue was addressed in [
26] through use of an elastic weight consolidation algorithm inspired by synaptic consolidation in biological neural networks, which slowed down learning of weights that were important to previous tasks. Dynamically expandable networks were also introduced in [
21], which selectively retrained parts of the network and extended it where necessary. The hedge backpropagation algorithm [
20] and autonomous deep learning [
27] allow the network architecture to grow from shallow to deep driven by the demands of the data and to learn from streaming data without need for any mini-batch learning phase. Approaches such as these are likely to be of value in the efficient operation and ongoing adaptation of the predictive models at the heart of a V2G service to changes in vehicle behaviour.
Vehicles are operated by people and used to satisfy their needs and schedules. The impact of user behaviour is thus of critical to the performance of a V2G service. Quantifying and adapting to individual users is of particular importance when a V2G aggregator targets individual vehicle owners rather than fleets, which are more likely to have well defined patterns of activity. An early example of such work was developed in [
12], in which a learning algorithm was introduced to adapt to changes in factors influencing a user’s decision making and a user’s reliability in making their vehicle available to the service. A methodology was also developed in [
28] using behavioural analysis to assess the potential of a fleet to transition to electric vehicles and V2G.
The scale of the increases in prediction error resulting from changes in underlying fleet behaviour without online machine learning emphasises the need for V2G services, such as the Live Service introduced in this work, to learn and adapt to changes at multiple different levels to confidently participate in energy markets and fully realise the promise of the technology.


 ,
, 


