
Longitudinal Analysis of Urinary Cytokines and Biomarkers in COVID-19 Patients with Subclinical Acute Kidney Injury

 , , , , , ,
Abstract
:1. Introduction
2. Results
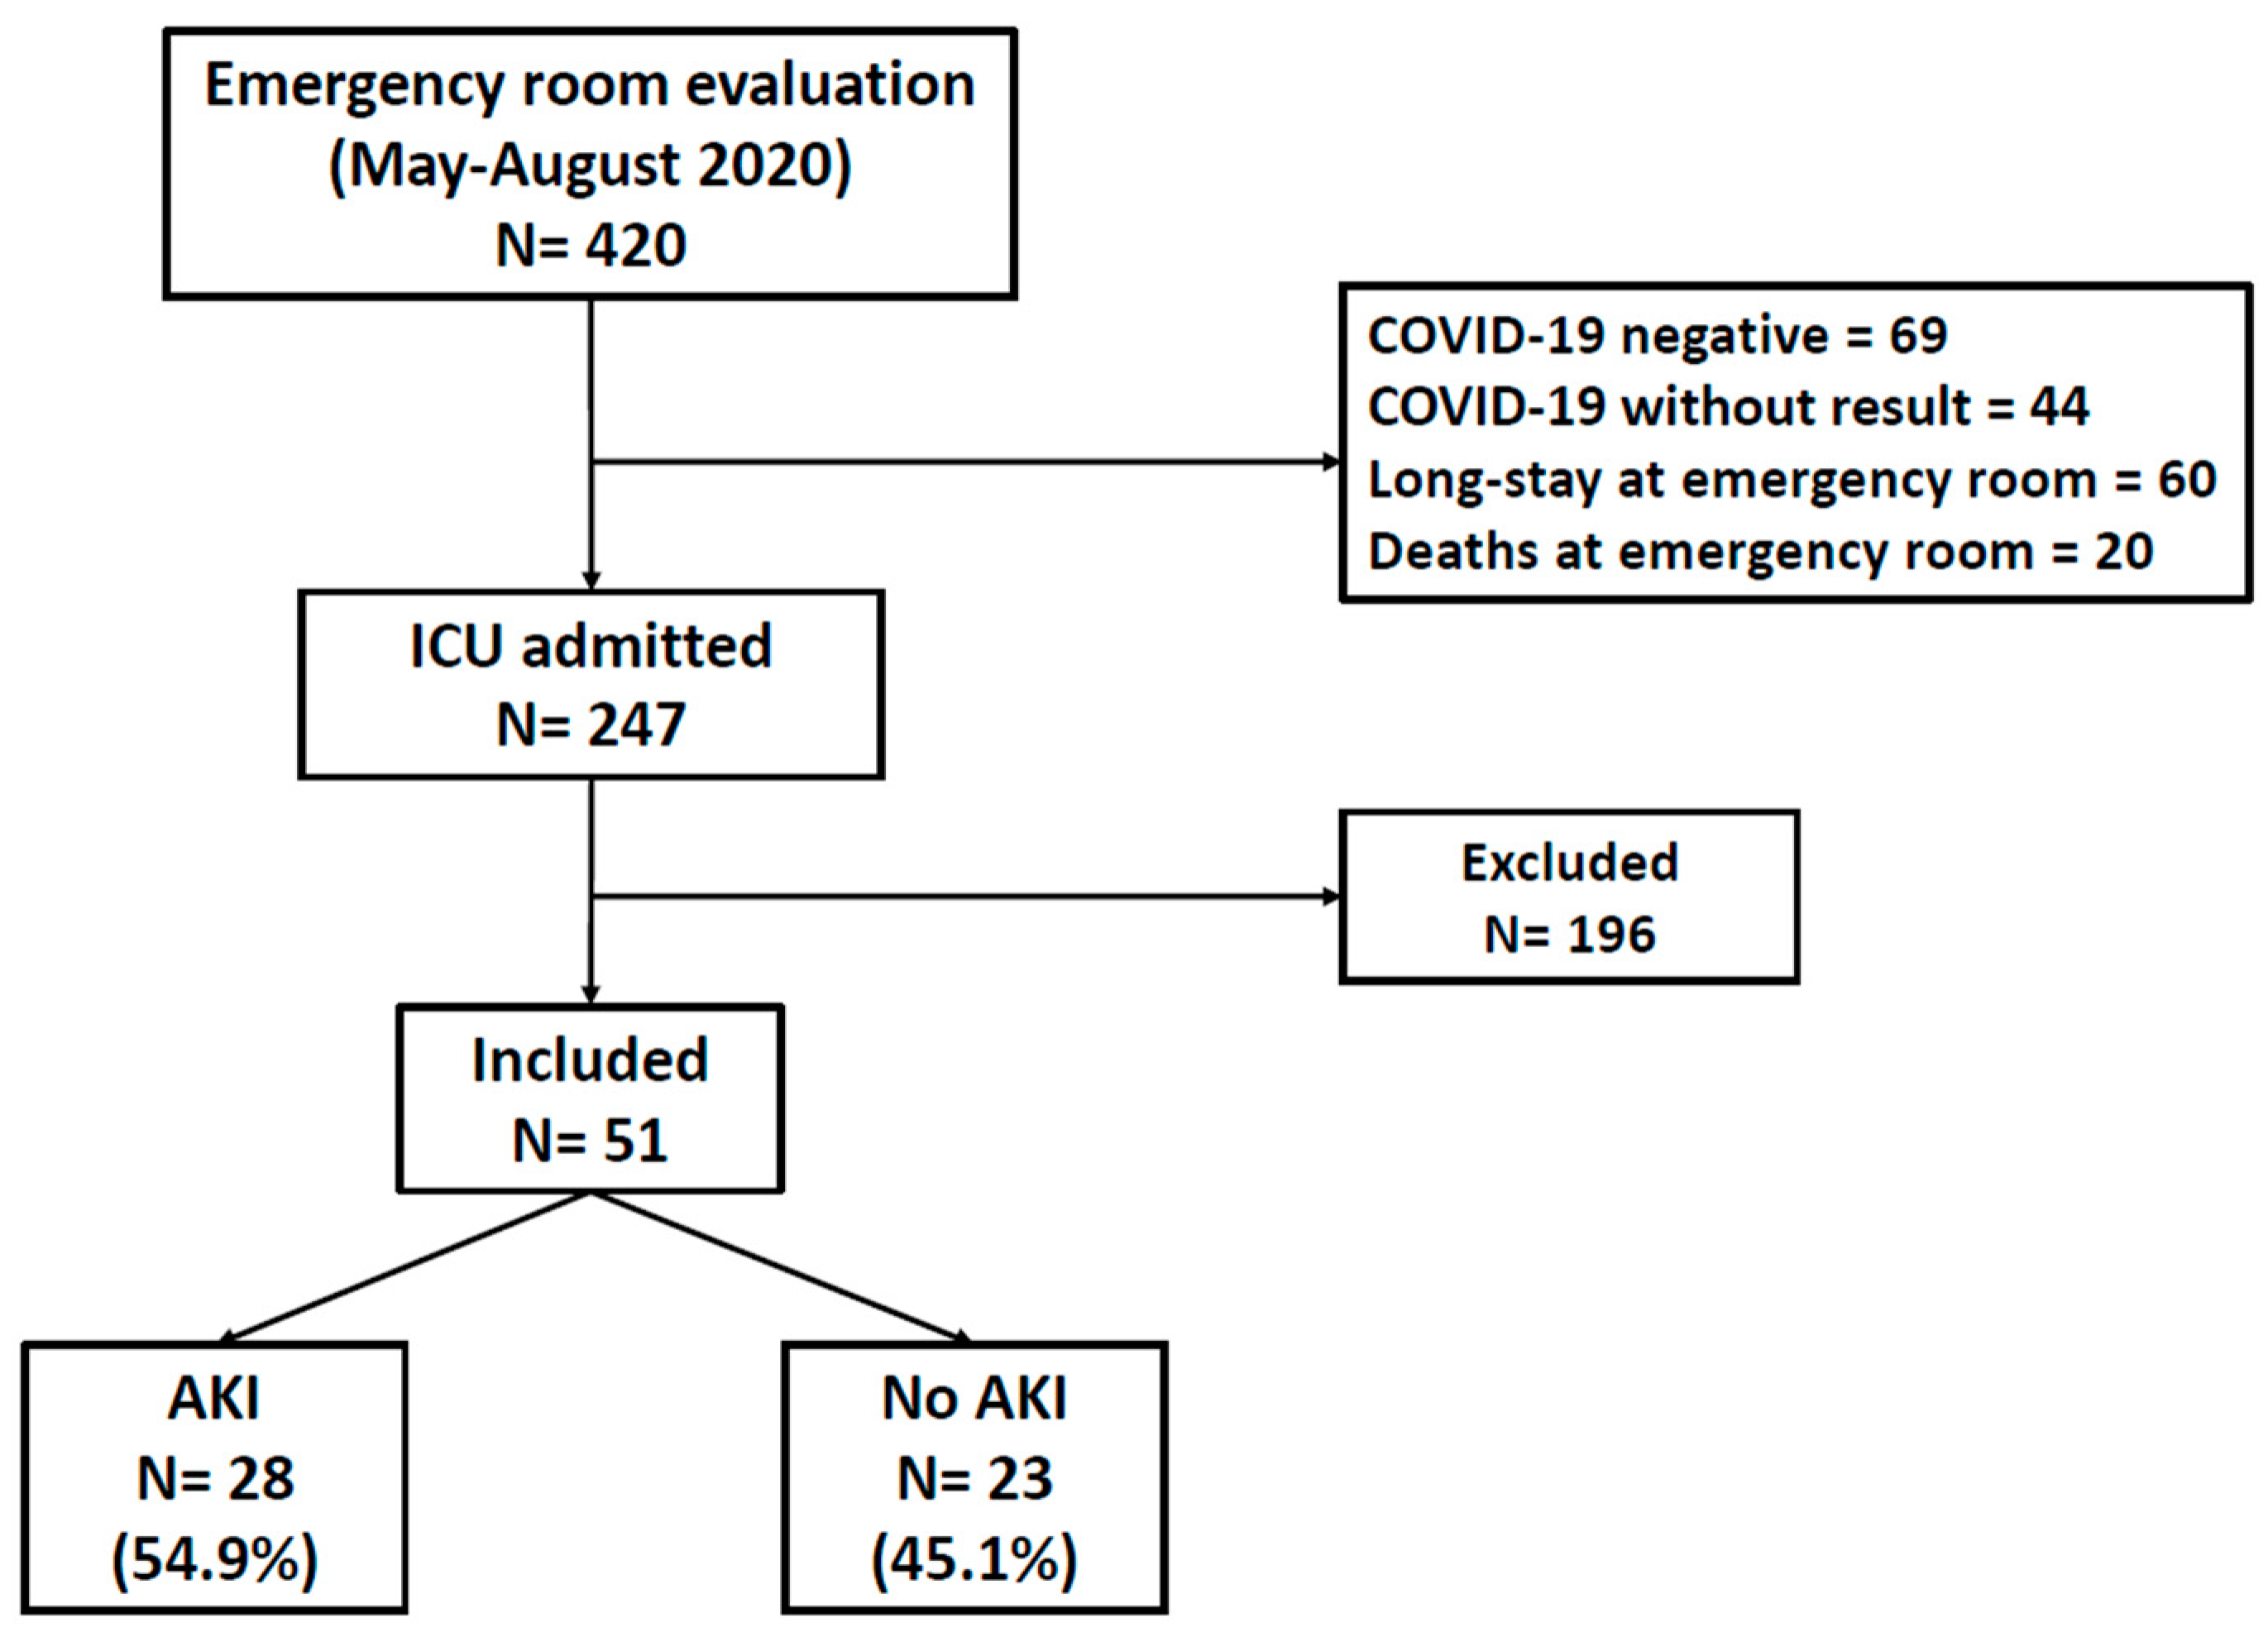
2.1. Characteristics of Study Participants
2.2. Performance of Biomarkers and Cytokines as Predictors of AKI
2.3. Higher Levels of Urinary EGF Were Protective for AKI
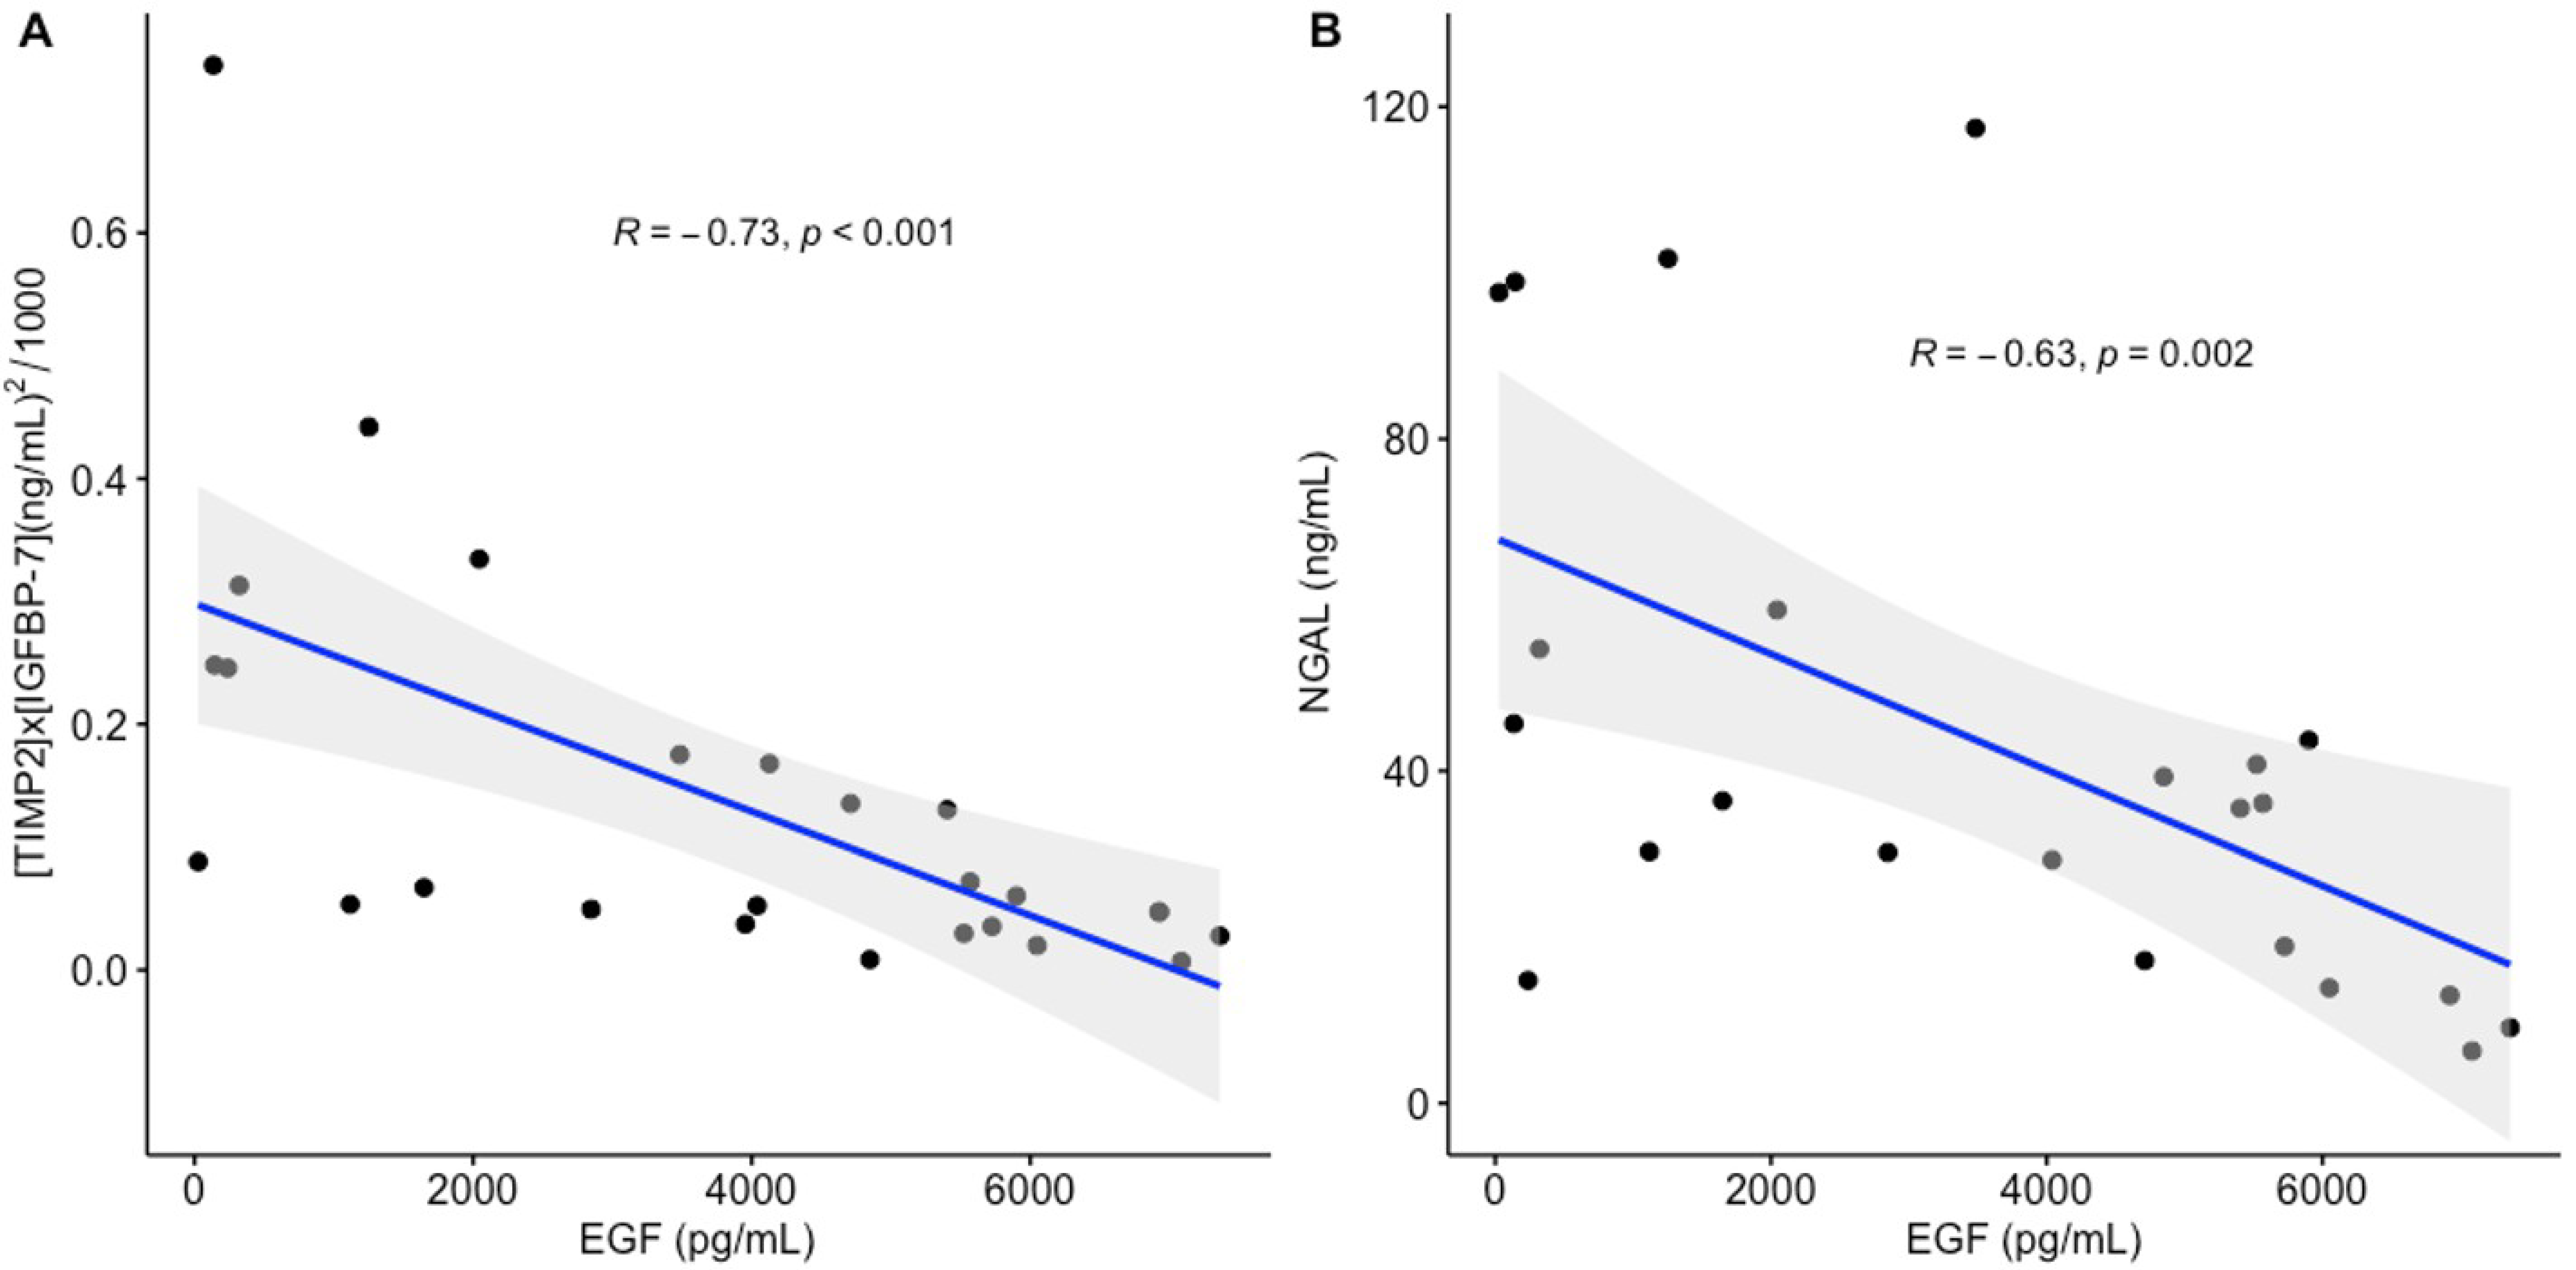
2.4. Correlation of Urinary EGF with Kidney Stress Biomarkers
2.5. Imputation of Cytokine and Chemokine Missing Values
2.6. Principal Component Analysis of Cytokines
3. Discussion
4. Materials and Methods
4.1. Study Population
4.2. Definition of Acute Kidney Injury
4.3. Biomarker Determinations
4.4. Cytokine Determinations
4.5. Statistical Analysis
Supplementary Materials
Author Contributions
Funding
Institutional Review Board Statement
Informed Consent statement
Data Availability Statement
Conflicts of Interest
References
- Ahmadian, E.; Hosseiniyan Khatibi, S.M.; Razi Soofiyani, S.; Abediazar, S.; Shoja, M.M.; Ardalan, M.; Zununi Vahed, S. COVID-19 and kidney injury: Pathophysiology and molecular mechanisms. Rev. Med. Virol. 2021, 31, e2176. [Google Scholar] [CrossRef] [PubMed]
- Gómez-Escobar, L.G.; Hoffman, K.L.; Choi, J.J.; Borczuk, A.; Salvatore, S.; Alvarez-Mulett, S.L.; Galvan, M.D.; Zhao, Z.; Racine-Brzostek, S.E.; Yang, H.S.; et al. Cytokine signatures of end organ injury in COVID-19. Sci. Rep. 2021, 11, 12606. [Google Scholar] [CrossRef] [PubMed]
- Liu, J.; Li, S.; Liu, J.; Liang, B.; Wang, X.; Wang, H.; Li, W.; Tong, Q.; Yi, J.; Zhao, L.; et al. Longitudinal characteristics of lymphocyte responses and cytokine profiles in the peripheral blood of SARS-CoV-2 infected patients. eBioMedicine 2020, 55, 102763. [Google Scholar] [CrossRef] [PubMed]
- Del Valle, D.M.; Kim-Schulze, S.; Huang, H.H.; Beckmann, N.D.; Nirenberg, S.; Wang, B.; Lavin, Y.; Swartz, T.H.; Madduri, D.; Stock, A.; et al. An inflammatory cytokine signature predicts COVID-19 severity and survival. Nat. Med. 2020, 26, 1636–1643. [Google Scholar] [CrossRef] [PubMed]
- Huang, C.; Wang, Y.; Li, X.; Ren, L.; Zhao, J.; Hu, Y.; Zhang, L.; Fan, G.; Xu, J.; Gu, X.; et al. Clinical features of patients infected with 2019 novel coronavirus in Wuhan, China. Lancet 2020, 395, 497–506. [Google Scholar] [CrossRef] [PubMed] [Green Version]
- Cheng, Y.; Luo, R.; Wang, K.; Zhang, M.; Wang, Z.; Dong, L.; Li, J.; Yao, Y.; Ge, S.; Xu, G. Kidney disease is associated with in-hospital death of patients with COVID-19. Kidney Int. 2020, 97, 829–838. [Google Scholar] [CrossRef]
- Levey, A.S.; James, M.T. Acute Kidney Injury. Ann. Intern. Med. 2017, 167, ITC66–ITC80. [Google Scholar] [CrossRef]
- Hirsch, J.S.; Ng, J.H.; Ross, D.W.; Sharma, P.; Shah, H.H.; Barnett, R.L.; Hazzan, A.D.; Fishbane, S.; Jhaveri, K.D.; Northwell COVID-19 Research Consortium; et al. Acute kidney injury in patients hospitalized with COVID-19. Kidney Int. 2020, 98, 209–218. [Google Scholar] [CrossRef]
- Chan, L.; Chaudhary, K.; Saha, A.; Chauhan, K.; Vaid, A.; Zhao, S.; Paranjpe, I.; Somani, S.; Richter, F.; Miotto, R.; et al. Mount Sinai COVID Informatics Center (MSCIC). AKI in Hospitalized Patients with COVID-19. J. Am. Soc. Nephrol. 2021, 32, 151–160. [Google Scholar] [CrossRef] [PubMed]
- Ronco, C.; Bellomo, R.; Kellum, J.A. Acute kidney injury. Lancet 2019, 394, 1949–1964. [Google Scholar] [CrossRef]
- Haase, M.; Kellum, J.A.; Ronco, C. Subclinical AKI: An emerging syndrome with important consequences. Nat. Rev. Nephrol. 2012, 8, 735–739. [Google Scholar] [CrossRef] [PubMed]
- KDIGO Clinical Practice Guideline for Acute Kidney Injury. 2012. Available online: https://kdigo.org/wp-content/uploads/2016/10/KDIGO-2012-AKI-Guideline-English.pdf (accessed on 12 September 2022).
- Nadim, M.K.; Forni, L.G.; Mehta, R.L.; Connor, M.J., Jr.; Liu, K.D.; Ostermann, M.; Rimmelé, T.; Zarbock, A.; Bell, S.; Bihorac, A.; et al. COVID-19-associated acute kidney injury: Consensus report of the 25th Acute Disease Quality Initiative (ADQI) Workgroup. Nat. Rev. Nephrol. 2020, 16, 747–764. [Google Scholar] [CrossRef] [PubMed]
- Casas-Aparicio, G.; Alvarado-de la Barrera, C.; Escamilla-Illescas, D.; León-Rodríguez, I.; Del Río-Estrada, P.M.; Calderón-Dávila, N.; González-Navarro, M.; Olmedo-Ocampo, R.; Castillejos-López, M.; Figueroa-Hernández, L.; et al. Role of Urinary Kidney Stress Biomarkers for Early Recognition of Subclinical Acute Kidney Injury in Critically Ill COVID-19 Patients. Biomolecules 2022, 12, 275. [Google Scholar] [CrossRef] [PubMed]
- Macedo, E. Urine Output Assessment as a Clinical Quality Measure. Nephron 2015, 131, 252–254. [Google Scholar] [CrossRef] [PubMed]
- Domagala, T.; Konstantopoulos, N.; Smyth, F.; Jorissen, R.N.; Fabri, L.; Geleick, D.; Lax, I.; Schlessinger, J.; Sawyer, W.; Howlett, G.J.; et al. Stoichiometry, kinetic and binding analysis of the interaction between epidermal growth factor (EGF) and the extracellular domain of the EGF receptor. Growth Factors 2000, 18, 11–29. [Google Scholar] [CrossRef]
- Chiarelli, F.; Gaspari, S.; Marcovecchio, M.L. Role of growth factors in diabetic kidney disease. Horm. Metab. Res. 2009, 41, 585–593. [Google Scholar] [CrossRef]
- Menez, S.; Moledina, D.G.; Thiessen-Philbrook, H.; Wilson, F.P.; Obeid, W.; Simonov, M.; Yamamoto, Y.; Corona-Villalobos, C.P.; Chang, C.; Garibaldi, B.T.; et al. Prognostic Significance of Urinary Biomarkers in Patients Hospitalized with COVID-19. Am. J. Kidney Dis. 2022, 79, 257–267.e1. [Google Scholar] [CrossRef]
- Menez, S.; Ju, W.; Menon, R.; Moledina, D.G.; Thiessen Philbrook, H.; McArthur, E.; Jia, Y.; Obeid, W.; Mansour, S.G.; Koyner, J.L.; et al. Urinary EGF and MCP-1 and risk of CKD after cardiac surgery. JCI Insight. 2021, 6, e147464. [Google Scholar] [CrossRef]
- Kwon, O.; Ahn, K.; Zhang, B.; Lockwood, T.; Dhamija, R.; Anderson, D.; Saqib, N. Simultaneous monitoring of multiple urinary cytokines may predict renal and patient outcome in ischemic AKI. Ren. Fail. 2010, 32, 699–708. [Google Scholar] [CrossRef] [Green Version]
- Mejia-Vilet, J.M.; Shapiro, J.P.; Zhang, X.L.; Cruz, C.; Zimmerman, G.; Méndez-Pérez, R.A.; Cano-Verduzco, M.L.; Parikh, S.V.; Nagaraja, H.N.; Morales-Buenrostro, L.E.; et al. Association Between Urinary Epidermal Growth Factor and Renal Prognosis in Lupus Nephritis. Arth. Rheumatol. 2021, 73, 244–254. [Google Scholar] [CrossRef]
- Satirapoj, B.; Dispan, R.; Radinahamed, P.; Kitiyakara, C. Urinary epidermal growth factor, monocyte chemoattractant protein-1 or their ratio as predictors for rapid loss of renal function in type 2 diabetic patients with diabetic kidney disease. BMC Nephrol. 2018, 19, 246. [Google Scholar] [CrossRef] [PubMed] [Green Version]
- Zheng, B.; He, M.L.; Wong, K.L.; Lum, C.T.; Poon, L.L.; Peng, Y.; Guan, Y.; Lin, M.C.; Kung, H.F. Potent Inhibition of SARS-associated coronavirus (SCoV) infection and replication by type I interferons (IFN-a/b) but not by type II interferon (IFN-g). J. Interf. Cytokine Res. 2004, 24, 388–390. [Google Scholar] [CrossRef] [PubMed] [Green Version]
- Jamilloux, Y.; Henry, T.; Belot, A.; Viel, S.; Fauter, M.; El Jammal, T.; Walzer, T.; François, B.; Sève, P. Should we stimulate or suppress immune responses in COVID-19? Cytokine and anti-cytokine interventions. Autoimmun. Rev. 2020, 19, 102567. [Google Scholar] [CrossRef] [PubMed]
- Ramasamy, S.; Subbian, S. Critical Determinants of Cytokine Storm and Type I Interferon Response in COVID-19 Pathogenesis. Clin. Microbiol. Rev. 2021, 34, e00299-20. [Google Scholar] [CrossRef] [PubMed]
- Crouse, J.; Kalinke, U.; Oxenius, A. Regulation of antiviral T cell responses by type I interferons. Nat. Rev. Immune. 2015, 15, 231–242. [Google Scholar] [CrossRef]
- Makris, S.; Paulsen, M.; Johansson, C. Type I interferons as regulators of lung inflammation. Front. Immunol. 2017, 8, 259. [Google Scholar] [CrossRef] [Green Version]
- Schneider, W.M.; Chevillotte, M.D.; Rice, C.M. Interferon-stimulated genes: A complex web of host defenses. Annu. Rev. Immunol. 2014, 32, 513–545. [Google Scholar] [CrossRef] [Green Version]
- D’Andrea, A.; Rengaraju, M.; Valiante, N.M.; Chehimi, J.; Kubin, M.; Aste, M.; Chan, S.H.; Kobayashi, M.; Young, D.; Nickbarg, E. Production of natural killer cell stimulatory factor (interleukin 12) by peripheral blood mononuclear cells. J. Exp. Med. 1992, 176, 1387–1398. [Google Scholar] [CrossRef] [Green Version]
- Moll-Bernardes, R.; de Sousa, A.S.; Macedo, A.V.S.; Lopes, R.D.; Vera, N.; Maia, L.; Feldman, A.; Arruda, G.; Castro, M.; Pimentel-Coelho, P.; et al. IL-10 and IL-12 (P70) Levels Predict the Risk of COVID-19 Progression in Hypertensive Patients: Insights From the BRACE-CORONA Trial. Front. Cardiovasc. Med. 2021, 8, 702507. [Google Scholar] [CrossRef]
- Chung, A.C.; Lan, H.Y. Chemokines in renal injury. J. Am. Soc. Nephrol. 2011, 22, 802–809. [Google Scholar] [CrossRef]
- Fiorentino, M.; Xu, Z.; Smith, A.; Singbartl, K.; Palevsky, P.M.; Chawla, L.S.; Huang, D.T.; Yealy, D.M.; Angus, D.C.; Kellum, J.A.; et al. Serial Measurement of cell-cycle arrest biomarkers [TIMP-2]•[IGFBP7] and risk for progression to death, dialysis or severe acute kidney injury in patients with septic shock. Am. J. Respir. Crit. Care Med. 2020, 202, 1262–1270. [Google Scholar] [CrossRef] [PubMed]
- Hoste, E.A.; McCullough, P.A.; Kashani, K.; Chawla, L.S.; Joannidis, M.; Shaw, A.D.; Feldkamp, T.; Uettwiller-Geiger, D.L.; McCarthy, P.; Shi, J.; et al. Derivation and validation of cutoffs for clinical use of cell cycle arrest biomarkers. Nephrol. Dial. Transplant. 2014, 29, 2054–2061. [Google Scholar] [CrossRef] [PubMed]
- Xu, K.; Shang, N.; Levitman, A.; Corker, A.; Kudose, S.; Yaeh, A.; Neupane, U.; Stevens, J.; Sampogna, R.; Mills, A.M.; et al. Elevated neutrophil gelatinase-associated lipocalin is associated with the severity of kidney injury and poor prognosis of patients with COVID-19. Kidney Int. Rep. 2021, 12, 2979–2992. [Google Scholar] [CrossRef] [PubMed]
- Takatsu, K.; Nakajima, H. IL-5 and eosinophilia. Curr. Opin. Immunol. 2008, 20, 288–294. [Google Scholar] [CrossRef] [PubMed]
- Mohamed, M.; Lukitsch, I.; Torres-Ortiz, A.E.; Walker, J.B.; Varghese, V.; Hernandez-Arroyo, C.F.; Alqudsi, M.; LeDoux, J.R.; Velez, J. Acute Kidney Injury Associated with Coronavirus Disease 2019 in Urban New Orleans. Kidney360 2020, 1, 614–622. [Google Scholar] [CrossRef]
- Levey, A.S.; Stevens, L.A.; Schmid, C.H.; Zhang, Y.L.; Castro, A.F., 3rd; Feldman, H.I.; Kusek, J.W.; Eggers, P.; Van Lente, F.; Greene, T.; et al. A new equation to estimate glomerular filtration rate. Ann. Intern. Med. 2009, 150, 604–612. [Google Scholar] [CrossRef]
- World Health Organization. Clinical Management of Severe Acute Respiratory Infection When Novel Coronavirus (nCoV) Infection Is Suspected: Interim Guidance. 2020. Available online: https://apps.who.int/iris/bitstream/handle/10665/330893/WHO-nCoV-Clinical-2020.3-eng.pdf?sequence=1&isAllowed=y (accessed on 12 September 2022).
- Moore, P.K.; Hsu, R.K.; Liu, K.D. Management of Acute Kidney Injury: Core Curriculum 2018. Am. J. Kidney Dis. 2018, 72, 136–148. [Google Scholar] [CrossRef]
- Storey, J. A direct approach to false discovery rates. J. R. Stat. Soc. Ser. A 2002, 64, 479–498. [Google Scholar] [CrossRef] [Green Version]
- Blazek, K.; van Zwieten, A.; Saglimbene, V.; Teixeira-Pinto, A. A practical guide to multiple imputation of missing data in nephrology. Kidney Int. 2021, 99, 68–74. [Google Scholar] [CrossRef]
- Abdi, H.; Williams, L.J. Principal Component Analysis. Wiley Interdiscip. Rev. Comput. Stat. 2010, 2, 433–459. [Google Scholar] [CrossRef]


| Variable | Overall (n = 51) | AKI ** (n = 28) | Non-AKI (n = 23) | p |
|---|---|---|---|---|
| Age, years * | 53 (40–61) | 56 (40.5–61.5) | 51 (40–55) | 0.12 |
| Male (n (%)) | 30 (58.8) | 19 (68) | 11 (47) | 0.14 |
| BMI, kg/m2 * | 29.3 (25.9–31.6) | 16 (57) | 14 (46.7) | 0.71 |
| Comorbidities | ||||
| Obesity (n (%)) | 21 (41.2) | 12 (43) | 9 (39) | 0.78 |
| Diabetes (n (%)) | 16 (31.4) | 8 (28) | 8 (35) | 0.63 |
| Hypertension (n (%)) | 14 (27.5) | 12 (42) | 2 (8.7) | 0.01 |
| 2 ≥ comorbidities (n (%)) | 21 (41.2) | 14 (50) | 7 (30.4) | 0.15 |
| Critical care variables | ||||
| IMV (n (%)) | 32 (62.7) | 20 (71.4) | 12 (52.2) | 0.15 |
| PaO2/FiO2 ratio, mmHg * | 141 (108–187) | 139 (101–162) | 167 (132–220) | 0.06 |
| PEEP, cm H2O * | 10 (9.5–14) | 10 (10–14) | 10 (10–12) | 0.79 |
| pH * | 7.41 (7.33–7.44) | 7.39 (7.34–7.44) | 7.41 (7.33–7.46) | 0.53 |
| pCO2, mmHg * | 38.0 (32.3–51.9) | 42.1 (35–52.5) | 37.5 (25–47) | 0.15 |
| SOFA score, points * | 4 (2–6) | 4 (3–7) | 3 (2–6) | 0.01 |
| Treatments | ||||
| Vasoactive drugs (n (%)) | 16 (31.4) | 10 (62.5) | 6 (26) | 0.46 |
| Inotropic drug (n (%)) | 2 (3.9) | 1 (50) | 1 (4.3) | 0.88 |
| Systemic steroids (n (%)) | 25 (49) | 13 (52) | 12 (52) | 0.68 |
| Hydroxychloroquine (n (%)) | 7 (13.7) | 5 (71.4) | 2 (8.69) | 0.34 |
| Lopinavir/Ritonavir (n (%)) | 12 (23.5) | 4 (33.3) | 8 (34.7) | 0.08 |
| Nephrotoxic drugs (n (%)) | 1 (2) | 0 (0.0) | 1 (4.34) | 0.26 |
| Renal function indicators | ||||
| Serum creatinine, mg/dL, Day 1 * | 0.60 (0.50–0.72) | 0.61 (0.51–0.76) | 0.60 (0.49–0.70) | 0.58 |
| eGFR, mL/min/1.73m2, Day 1 * | 112.38 (98.45–121.40) | 113 (96–118) | 111 (106–124) | 0.73 |
| Serum creatinine, mg/dL, Day 5 * | 0.69 (0.54–0.88) | 0.79 (0.67–1.13) | 0.60 (0.51–0.75) | 0.01 |
| eGFR, mL/min/1.73m2, Day 5 * | 104 (90–117.50) | 99 (69.5–109.5) | 110 (103–121) | 0.01 |
| Final serum creatinine, mL/min * | 0.67 (0.55–0.97) | 0.74 (0.61–1.09) | 0.61 (0.52–0.76) | 0.13 |
| Final eGFR, mL/min/1.73m2 * | 104 (90–118-50) | 102 (88.5–113) | 107 (102–121) | 0.07 |
| Laboratories at Day 1 | ||||
| Hemoglobin, g/dL * | 13.3 (12.6–14.9) | 13.4 (12.5–15) | 13.3 (12.7–14.4) | 0.99 |
| Leucocytes, 10 ×3 mm3 * | 8.9 (6.3–13.4) | 9.3 (7.8–12.1) | 7.8 (5.1–13.5) | 0.22 |
| Lymphocytes, 10 ×3 mm3 * | 0.8 (0.6–1.0) | 0.8 (0.45–1) | 0.8 (0.65–1) | 0.37 |
| Platelets, 10 ×3 mm3 * | 272 (219–329) | 272 (216–362) | 272 (219–314) | 0.75 |
| Lactate dehydrogenase, U/mL * | 387 (299–557) | 386 (314–544) | 397 (265–572) | 0.37 |
| Total bilirubin, mg/dL * | 0.47 (0.37–0.63) | 0.56 (0.40–0.88) | 0.43 (0.34–0.54) | 0.07 |
| Creatine phosphokinase, U/L * | 140 (39–443) | 224.5 (79.5–739.5) | 60 (35.5–291) | 0.02 |
| D-dimer, µg/mL * | 0.91 (0.42–2.50) | 1.08 (0.55–4.27) | 0.49 (0.34–1.29) | 0.04 |
| C-reactive protein, mg/dL * | 16.5 (10–27.6) | 18 (13–31.9) | 13.2 (10–22.4) | 0.05 |
| Fibrinogen, mg/dL * | 734 (580–821) | 742 (604–805) | 685 (565–786) | 0.41 |
| Procalcitonin, ng/mL * | 0.39 (0.11–0.92) | 0.62 (0.35–1.26) | 0.14 (0.08–0.34) | 0.01 |
| Troponin, pg/mL * | 5.6 (3.3–37) | 11.8 (3.8–37) | 3.9 (1.5–9) | 0.04 |
| Ferritin, ng/mL * | 745 (358–1883) | 710 (304–2491) | 756 (457–953) | 0.83 |
| Urinary kidney biomarkers | ||||
| TIMP-2, ng/mL, Day 1 * | 5.64 (3.03–9.02) | 6.16 (3.49–9.66) | 5.07 (3.01–7.24) | 0.26 |
| TIMP-2, ng/mL, Day 5 * | 5.21 (3.31–7.81) | 4.16 (3.18–7.36) | 5.26 (3.65–12.03) | 0.11 |
| IGFBP7, ng/mL/1000, Day 1 * | 13.83 (8.60–24.65) | 17.43 (9.35–30.20) | 12.50 (7.04–19.92) | 0.12 |
| IGFBP7, ng/mL/1000, Day 5 * | 22.75 (12.63–46.20) | 28.44 (13.05–77.78) | 16.53 (11.93–32.35) | 0.22 |
| [TIMP2] × [IGFBP7], (ng/mL)2/1000, Day 1 * | 0.085 (0.05–0.24) | 0.16 (0.05–0.32) | 0.07 (0.04–0.11 | 0.04 |
| [TIMP2] × [IGFBP7], (ng/mL)2/1000, Day 5 * | 0.14 (0.05–0.28) | 0.13 (0.05–0.32) | 0.14 (0.06–0.19) | 0.99 |
| NGAL, ng/mL, Day 1 * | 39.3 (19.2–98.5) | 54.70 (36.40–117.40) | 32.40 (14–40.05) | 0.00 |
| NGAL, ng/mL, Day 5 * | 33 (14–106.2) | 35.20 (17.55–118.95) | 20.50 (11.45–52.50) | 0.07 |
| Outcomes | ||||
| Day in hospital | 16 (12–27) | 20.5 (14.5–28) | 13 (10.5–22.5) | 0.03 |
| Days on IMV | 13 (10–22.2) | 13 (12–22) | 10.5 (8–26) | 0.43 |
| Mortality (n (%)) | 10 (19.6) | 7 (25) | 3 (13) | 0.28 |
| Cytokine/ Chemokine (pg/mL) | Overall (n = 51) | AKI (n = 25) | No-AKI (n = 26) | p a | q b |
|---|---|---|---|---|---|
| FGF * Day 1 | 3.21 (1.78–9.14) | 2.61 (1.74–7.31) | 4.52 (1.97–11.81) | 0.30 | 0.89 |
| FGF * Day 5 | 2.86 (1.44–6.64) | 2.43 (1.42–6.64) | 3.75 (1.74–6.09) | 0.76 | 0.97 |
| IL-1β * Day 1 | 10.17 (5.54–20.11) | 9.77 (4.92–15.94) | 17.21 (7.71–25.31) | 0.16 | 0.84 |
| IL-1β * Day 5 | 7.38 (3.78–12.41) | 6.48 (3.60–12.29) | 9.07 (5.92–12.73) | 0.22 | 0.97 |
| G-CSF * Day 1 | 173.98 (123.48–197.43) | 171.05 (119.76–224.19) | 176.49 (166.81–188.64) | 0.51 | 0.89 |
| G-CSF * Day 5 | 159.05 (93.93–199.12) | 181.37 (109.50–211.79) | 157.53 (94.46–191.30) | 0.56 | 0.97 |
| IL-10 * Day 1 | 1.94 (1.70–4.48) | 1.84 (1.70–3.16) | 4.48 (1.88–13.35) | 0.09 | 0.60 |
| IL-10 * Day 5 | 3.52 (2.13–5.03) | 3.52 (2.47–4.72) | 2.59 (2.14–4) | 0.73 | 0.97 |
| IL-13 * Day 1 | 6.30 (3.01–9.28) | 5.56 (2.67–7.87) | 7.12 (4.03–9.93) | 0.51 | 0.89 |
| IL-13 * Day 5 | 5.68 (2.93–7.83) | 5.33 (2.64–7.65) | 6.05 (3.07–8.05) | 0.65 | 0.97 |
| IL-6 * Day 1 | 7.46 (3.57–15.43) | 6.15 (3.71–14) | 10.37 (3.39–19.61) | 0.27 | 0.89 |
| IL-6 * Day 5 | 6.16 (2.22–12.98) | 5.92 (2.54–13.14) | 6.97 (2.11–10.22) | 0.90 | 0.99 |
| IL-12 * Day 1 | 2.22 (1.73–3.40) | 2.19 (1.75–3.26) | 2.38 (1.73–3.27) | 0.80 | 0.89 |
| IL-12 * Day 5 | 2.26 (1.51–4.41) | 1.83 (1.33–2.37) | 2.80 (1.74–5.65) | 0.01 | 0.41 |
| RANTES * Day 1 | 13.83 (9.38–22.67) | 17.40 (13.2–25.4) | 10.7 (7.9–12.8) | 0.01 | 0.14 |
| RANTES * Day 5 | 15.98 (12.93–25.14) | 15.62 (11.14–28.60) | 16.11 (12.94–22.84) | 0.82 | 0.99 |
| Eotaxin * Day 1 | 2.20 (1.12–4.24) | 2.52 (1.17–4.24) | 1.87 (1.13–4.62) | 0.82 | 0.89 |
| Eotaxin * Day 5 | 3.50 (1.24–6.29) | 3.26 (1.84–6.18) | 4.10 (0.68–6.24) | 0.64 | 0.97 |
| IL-17A * Day 1 | 3.05 (2.34–5.23) | 3.19 (2.21–8.20) | 2.90 (2.53–3.19) | 0.37 | 0.89 |
| IL-17A * Day 5 | 3.04 (2.50–3.21) | 3.08 (2.60–3.63) | 2.99 (2.44–3.20) | 0.60 | 0.97 |
| MIP-1α * Day 1 | 21.35 (10.97–35.89) | 21.35 (9.61–30.61) | 20.85 (11.79–35.89) | 0.69 | 0.89 |
| MIP-1α * Day 5 | 11.79 (6.04–29.27) | 9.08 (4.90–29.27) | 11.79 (9.61–20.85) | 0.52 | 0.97 |
| GM-CSF * Day 1 | 0.65 (0.38–1.27) | 0.75 (0.43–1.27) | 0.59 (0.34–1.22) | 0.46 | 0.89 |
| GM-CSF * Day 5 | 0.68 (0.43–1.32) | 0.53 (0.38–1.38) | 0.74 (0.53.1.26) | 0.44 | 0.97 |
| MIP-1β * Day 1 | 3.27 (1.84–8.16) | 3.27 (1.84–6.64) | 3.25 (1.84–8.17) | 0.79 | 0.89 |
| MIP-1β * Day 5 | 4.32 (1.66–6.62) | 2.87 (1.37–6.64) | 4.37 (2.13–6.03) | 0.65 | 0.97 |
| MCP-1 * Day 1 | 137.22 (50.57–311) | 148.43 (61.49–323.19) | 121.02 (49.56–237.50) | 0.62 | 0.89 |
| MCP-1 * Day 5 | 124.6 (50.77–242.04) | 116.29 (91.46–254.88) | 143.23 (45.57–219.43) | 0.88 | 0.99 |
| IL-15 * Day 1 | 127.72 (82.62–196.61) | 108.47 (79.62–240.22) | 130.74 (93.11–193.87) | 0.73 | 0.89 |
| IL-15 * Day 5 | 140.19 (97.14–176.12) | 145.27 (128.26–190.80) | 103.37 (56.60–142.85) | 0.12 | 0.97 |
| EGF * Day 1 | 4083.27 (1218.24–5768.37) | 2044 (719–4083) | 5568 (5056–5974) | 0.01 | 0.14 |
| EGF * Day 5 | 4127.73 (1722.80–5494.66) | 3934.24 (1552.42–5254.31) | 4614.17 (3537.42–5424.23) | 0.55 | 0.97 |
| IL-5 * Day 1 | 0.77 (0.23–2.38) | 0.91 (0.23–4.73) | 0.67 (0.29–1.25) | 0.34 | 0.89 |
| IL-5 * Day 5 | 2.38 (0.46–5.85) | 2.38 (0.35–6.40) | 2.38 (1.44–2.71) | 0.75 | 0.97 |
| HGF * Day 1 | 41.18 (21.27–80.86) | 40.12 (21.27–80.22) | 41.18 (21.99–81.51) | 0.80 | 0.89 |
| HGF * Day 5 | 53.12 (28.68–79.97) | 54.82 (28.84–70.20) | 52.50 (32.45–79.97) | 0.86 | 0.99 |
| VEGF * Day 1 | 2.59 (0.82–4.41) | 2.26 (0.82–3.79) | 3 (0.70–4.74) | 0.77 | 0.89 |
| VEGF * Day 5 | 2.74 (0.77–4.41) | 2.88 (0.95–3.76) | 1.36 (0.77–4.60) | 0.60 | 0.97 |
| IFN-α * Day 1 | 10.90 (1.89–17.50) | 10.90 (1.55–16.77) | 13.64 (2.52–17.50) | 0.27 | 0.89 |
| IFN-α * Day 5 | 12.09 (1.92–17.21) | 10.90 (1.92–14.39) | 13.45 (2.08–18.82) | 0.41 | 0.97 |
| IL-1RA * Day 1 | 2829.72 (1209.25–5344.40) | 2689.10 (1238.42–5813.46) | 3421.78 (1263.64–4084.19) | 0.90 | 0.93 |
| IL-1RA * Day 5 | 1879.33 (1000.58–4591.50) | 1675.03 (1071.18–3571.60) | 2088.81 (830.36–4601.67) | 0.72 | 0.97 |
| IL-2 * Day 1 | 1.57 (1.27–2.51) | 1.58 (1.45–2.27) | 1.53 (1.12–2.23) | 0.45 | 0.89 |
| IL-2 * Day 5 | 1.83 (1.26–2.52) | 1.79 (1.34–3) | 1.88 (1.26–2.27) | 0.98 | 1 |
| IL-7 * Day 1 | 14.31 (4.35–29.41) | 15.69 (4.65–30.05) | 12.93 (4.54–27.03) | 0.66 | 0.89 |
| IL-7 * Day 5 | 10.41 (3.71–30.71) | 12.59 (3.95–43.47) | 6.78 (4.06–16.37) | 0.42 | 0.97 |
| IP-10 * Day 1 | 2.38 (2.04–6.06) | 2.52 (2.02–7.33) | 2.24 (2.19–3.63) | 0.64 | 0.89 |
| IP-10 * Day 5 | 2.93 (1.44–5.02) | 3.06 (1.81–6.77) | 2.78 (1.75–3.75) | 0.49 | 0.97 |
| IL-2R * Day 1 | 653 (197.59–1633.81) | 649.43 (203.20–1429.30) | 786.61 (193.19–1686.19) | 0.84 | 0.89 |
| IL-2R * Day 5 | 296.03 (116.97–990.57) | 304.80 (121.13–1103) | 296.03 (107.33–818.01) | 0.89 | 1 |
| MIG * Day 1 | 43.28 (21.73–52.93 | 39.96 (15.74–56.63) | 46.12 (25.48–51.75) | 0.67 | 0.89 |
| MIG * Day 5 | 39.97 (21.73–61.45) | 34.17 (21.73–60.93) | 49.22 (22.28–61.45) | 0.53 | 0.97 |
| IL-4 * Day 1 | 70.19 (3.15) | 6.36 (6.36–6.36) | 6.36 (6.36–6.36) | ||
| IL-4 * Day 5 | 10.29 (6.18) | 34.98 (6.18–63.78) | 1 | 1 | |
| IL-8 * Day 1 | 8.52 (2.66–28.19) | 9.04 (2.63–28.60) | 7.83 (3.47–26.93) | 1 | 0.89 |
| IL-8 * Day 5 | 15.09 (5.14–76.49) | 10.81 (5.22–73.64) | 16.42 (3.18–135.60) | 0.61 | 0.97 |
| Biomarker | AUC | 95% CI | p | Cutoff | Sensitivity (%) | Specificity (%) | PPV (%) | NPV (%) | Accuracy (%) |
|---|---|---|---|---|---|---|---|---|---|
| Prediction of AKI on day 1 | |||||||||
| EGF (pg/mL) | 0.788 | 0.597–0.979 | 0.014 | 4600 | 80.00 | 81.82 | 74.58 | 85.99 | 81.09 |
| [TIMP2] × [IGFBP7] (ng/mL)2/1000 | 0.672 | 0.521–0.823 | 0.036 | 0.2 | 42.86 | 95.65 | 86.79 | 71.52 | 74.53 |
| NGAL (ng/mL) | 0.797 | 0.668–0.927 | 0.014 | 40.0 | 68.00 | 73.91 | 63.47 | 77.60 | 71.55 |
| Variables | Unadjusted OR (CI 95%) | p | Adjusted OR (CI 95%) | p |
|---|---|---|---|---|
| Age > 60 years | 2.29 (0.44–11.91) | 0.324 | 0.84 (0.06–11.22) | 0.901 |
| Men | 2.25 (0.34–14.61) | 0.396 | 2.75 (0.28–26.68) | 0.381 |
| Hypertension | 11.42 (1.15–113) | 0.037 | 5.75 (0.32–103) | 0.235 |
| D-Dimer μg/ml | 1.35 (0.18–10.0) | 0.769 | - | - |
| NGAL > 40 ng/ml | 2.66 (0.46–15.25) | 0.270 | - | - |
| EGF > 4600 pg/mL * | 0.05 (0.008–0.40) | 0.004 | 0.095 (0.01–0.81) | 0.031 |
| Principal Component | Unadjusted OR (95% CI) | p | Adjusted OR (95% CI) * | p |
|---|---|---|---|---|
| Day 1 | ||||
| PC-1: IFN-α; EGF | 0.5 (0.23–1.11) | 0.08 | 0.24 (0.07–0.78) | 0.01 |
| PC-2: IL-1R; G-CSF; IP-10; IL-5 | 7.14 (0.58–87.78) | 0.12 | 15.95 (0.31–817) | 0.16 |
| PC-3: IL-10 | 0.45 (0.13–1.51) | 0.19 | - | - |
| PC-4: IL-12; MIP-1β | 7.38 (0.95–57.18) | 0.05 | 51.09 (2.12–1233) | 0.01 |
| PC-5: HGF; MCP-1; IL-6 | 0.39 (0.12–1.22) | 0.10 | - | - |
| Day 5 | ||||
| PC-1: IFN-α; EGF | 0.37 (0.14–0.97) | 0.04 | 0.09 (0.01–0.74) | 0.02 |
| PC-2: IL-1R; G-CSF; IP-10; IL-5 | 1.81 (0.64–5.13) | 0.26 | 7.7 (1.06–55.74) | 0.04 |
| PC-3: IL-10 | 6.46 (0.72–58.29) | 0.09 | - | - |
| PC-4: IL-12; MIP-1β | 0.42 (0.11–1.57) | 0.19 | 0.2 (0.02–1.73) | 0.14 |
| PC-5: HGF; MCP-1; IL-6 | 1.13 (0.41–3.12) | 0.81 | 9.37 (0.97–90.1) | 0.05 |
Publisher’s Note: MDPI stays neutral with regard to jurisdictional claims in published maps and institutional affiliations. |
© 2022 by the authors. Licensee MDPI, Basel, Switzerland. This article is an open access article distributed under the terms and conditions of the Creative Commons Attribution (CC BY) license (https://creativecommons.org/licenses/by/4.0/).
Share and Cite
Casas-Aparicio, G.; Alvarado-de la Barrera, C.; Escamilla-Illescas, D.; León-Rodríguez, I.; Del Río-Estrada, P.M.; González-Navarro, M.; Calderón-Dávila, N.; Olmedo-Ocampo, R.; Castillejos-López, M.; Figueroa-Hernández, L.; et al. Longitudinal Analysis of Urinary Cytokines and Biomarkers in COVID-19 Patients with Subclinical Acute Kidney Injury. Int. J. Mol. Sci. 2022, 23, 15419. https://doi.org/10.3390/ijms232315419
Casas-Aparicio G, Alvarado-de la Barrera C, Escamilla-Illescas D, León-Rodríguez I, Del Río-Estrada PM, González-Navarro M, Calderón-Dávila N, Olmedo-Ocampo R, Castillejos-López M, Figueroa-Hernández L, et al. Longitudinal Analysis of Urinary Cytokines and Biomarkers in COVID-19 Patients with Subclinical Acute Kidney Injury. International Journal of Molecular Sciences. 2022; 23(23):15419. https://doi.org/10.3390/ijms232315419
Chicago/Turabian StyleCasas-Aparicio, Gustavo, Claudia Alvarado-de la Barrera, David Escamilla-Illescas, Isabel León-Rodríguez, Perla Mariana Del Río-Estrada, Mauricio González-Navarro, Natalia Calderón-Dávila, Rossana Olmedo-Ocampo, Manuel Castillejos-López, Liliana Figueroa-Hernández, and et al. 2022. "Longitudinal Analysis of Urinary Cytokines and Biomarkers in COVID-19 Patients with Subclinical Acute Kidney Injury" International Journal of Molecular Sciences 23, no. 23: 15419. https://doi.org/10.3390/ijms232315419