
The Impact of COVID-19 on the Choice of Transport Means in Journeys to Work Based on the Selected Example from Poland


Faculty of Civil Engineering, Wrocław University of Science and Technology (Politechnika Wrocławska), 50-370 Wrocław, Poland
*
Author to whom correspondence should be addressed.
Sustainability 2022, 14(13), 7619; https://doi.org/10.3390/su14137619
Submission received: 6 May 2022
/
Revised: 17 June 2022
/
Accepted: 20 June 2022
/
Published: 22 June 2022
(This article belongs to the Special Issue Impact of COVID-19 on Pedestrian Behavior, Road Safety and Sustainable Transportation)
Abstract
:In recent years, the problem of overusing cars has been amplified by the COVID-19 pandemic. To understand this problem, we analyzed the results of a survey dedicated to mobility patterns of employees of the Wroclaw University of Sciences and Technology conducted in June and July 2021. Consideration was given to the share of different means of transport and their changes in pre-, through and post-COVID-19 periods and factors such as the distance, population and public transport standards specific for various journeys. Overall, we found that the pandemic strongly influenced the choice of transport means. We did not identify any significant influence of the distance or population on the share of transport means between various periods. However, regardless of the period, dependencies between the public transport standards and the share of transport means were evident.
1. Introduction
The use of specific transport means for journeys, especially in daily destinations such as “to work”, has a profound influence on the environment. In this context, the choice of a car typically has the most negative influence due to the emission of CO2 [1]. The wide spread of COVID-19 in 2020 [2] affected the choice of transport means, as reported by numerous studies [3,4,5,6,7,8,9,10,11]. Changes in mobility policy aiming at reducing the spread of contagions greatly strengthened this relationship [12,13], while the increasing use of cars (and decreasing use of public means of transport) has been widely observed [14]. This is envisaged to be a long-term trend [15].
A private car has been the most frequently chosen means of transport for commuting to work for several decades. This has been shown by research results from Poland and the whole world [14,16,17]. This leads to increased vehicle traffic on the road network and to the enlargement of negative effects of traffic. It causes the excessive emission of CO2, CO, NOx and other pollutants, which adversely affects the surrounding environment [1,18]. Efforts have been devoted to reduce the use of cars in favor of other means of transport. Psychological conditions influencing the choice of the means of transport have been examined and competitive modes of transport have been proposed, including inter alia, bicycles or public transport [5,19,20,21,22,23,24,25].
In recent years, the problem of overusing cars has been compounded by the COVID-19 pandemic. A significant change in the selection of the means of transport during every day societal journeys is the cornerstone of mobility policies in many countries around the world [6,25,26,27]. However, during the pandemic, there has been a decline in the number of people using public transport, while the number of people using cars has increased [28,29,30,31,32,33,34,35,36]. This is likely to have significant consequences in the future [36,37,38,39,40,41,42], because it exacerbates the problem of the excessive production of CO2, CO, NOx and other pollutants.
In this paper, we analyze the results of a survey dedicated to mobility patterns of employees of the Wroclaw University of Sciences and Technology (WUST, Politechnika Wrocławska) conducted in June and July 2021. The survey focuses on transport means used in journeys to work in relation to three periods: pre-, through and post-COVID-19. The rest of the paper is organized as follows: The construction of the survey and the population sample are described in Section 2. The main results from the survey are provided in Section 3, considering the share of different groups of transport means and their changes between different periods. In Section 3, the results are analyzed in regard to the traveled distance, population size and public transport standards too. The overall results are discussed in Section 4, followed by conclusions in Section 5.
2. Materials and Methods
2.1. Description of Survey
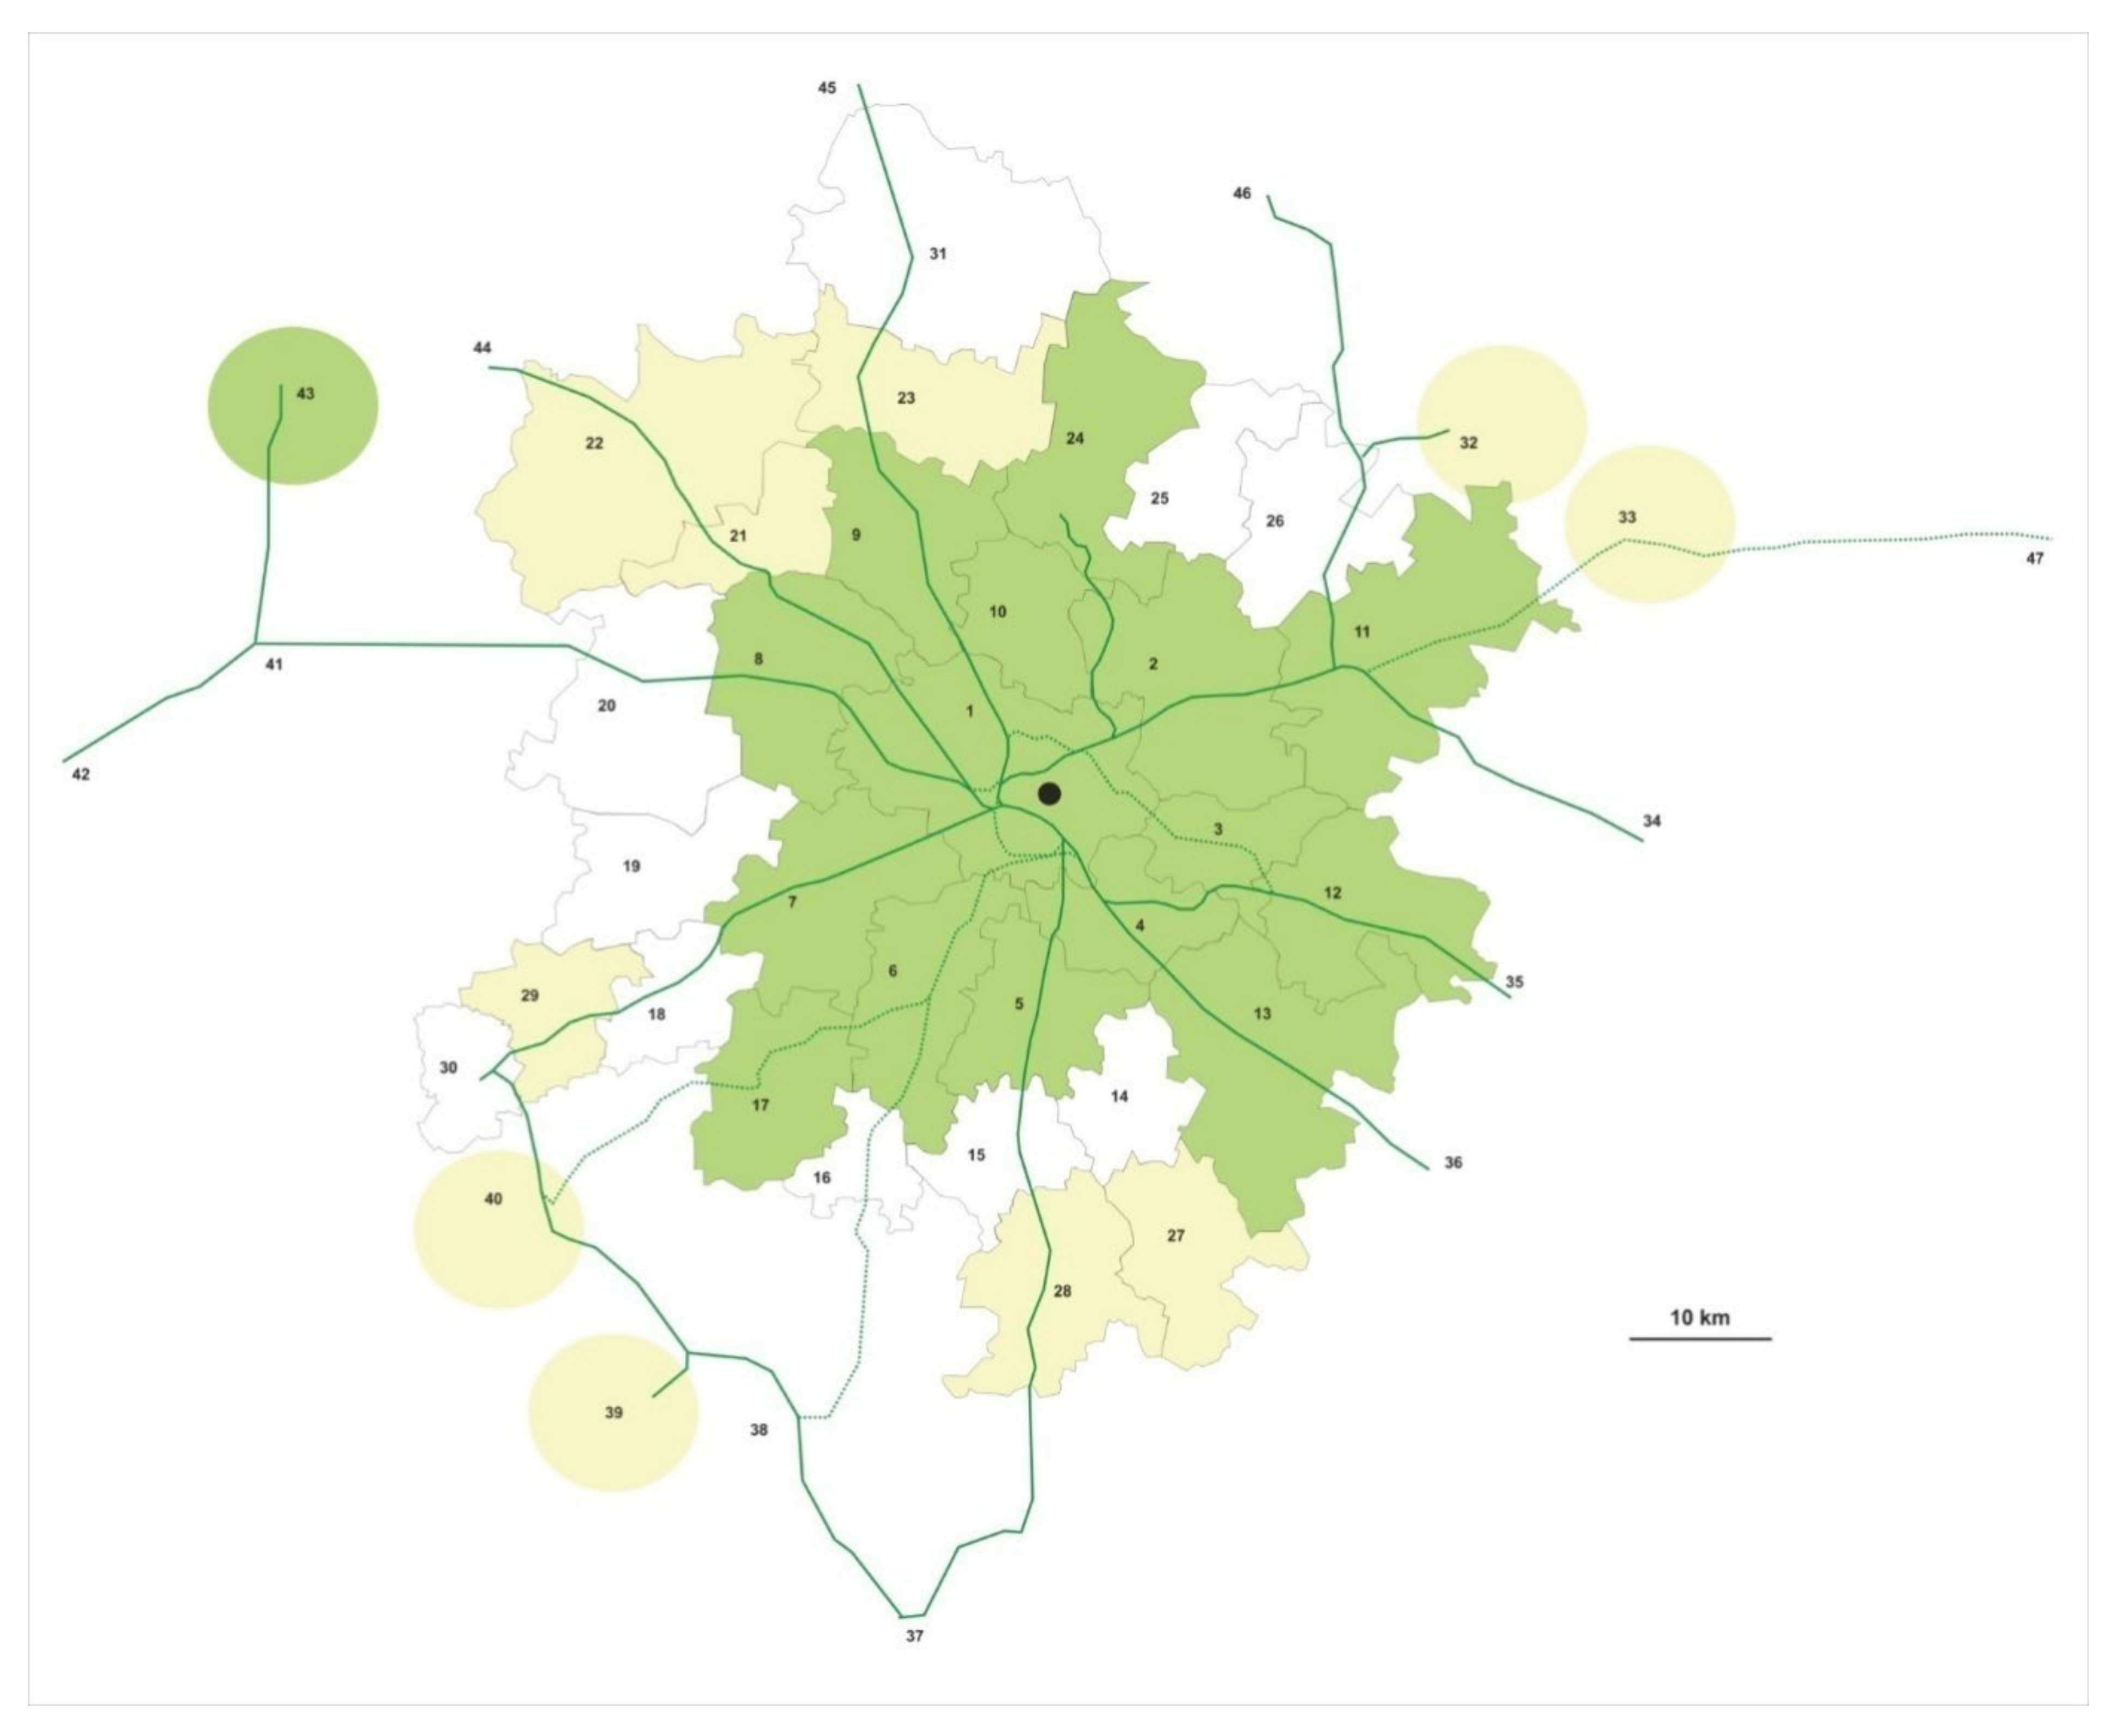
WUST is one of the largest universities in Poland, and is located in the central part of Wrocław (see the black point in area no. 1 on Figure 1 representing the main campus). Wrocław is the fourth large city in Poland, with more than 640 thousand residents (see Table 1). As an element of the prepared “Mobility Plan”, specific surveys were created. The first survey was dedicated to employees. The survey was a part of broader works named “mobility plan”. These works started in late spring 2021 (not ended yet) and were not planned cyclically. The surveys were conducted from the end of June to the beginning of July. This was in fact no vacation. In this period, a part of the restriction was canceled (telework) and others were left (masks, limits on public transport). It consisted of 18 questions about the ways and conditions of traveling to the university. Information about the survey and an invitation (link) to complete it were sent by e-mail to all 5795 active employees of WUST. Over 1300 people (approximately 23% of the recipients of the e-mail) used the link; however, only 815 responses were obtained in full. In total, 391 respondents were women and 375 men (approximately 6% did not provide their gender). Therefore, the women/men ratio was almost at unity (51%/49%). In total, 312 people (38.3%) were research and teaching staff, 279 people (34.2%) were administrative staff, 90 people (11.0%) were teaching staff, 64 people (7.9%) were technical staff, 70 people (8.6%) were others (this last group included PhD students). In the group of actual employees, an approximately 20% response rate to the survey was obtained. PhD students were omitted from further analyzes as they represented a rather specific group. PhD students are not typical teachers, although they carry some limited teaching duties. They are also enrolled as students in some advanced courses. Consequently, the number of scheduled activities of an atypical PhD student is not as high as in the case of typical employees or even students at earlier stages of an academic pathway. They are typically on campus fewer days a week and live nearby, and they have no children, hence, the associated responsibilities. For these reasons, they were not considered in the survey of employees.
The most important for further analyses were the questions connected with the choice of transport means in the journey to work. In the survey, six options were taken into account: on foot, by bike, by public transport means (bus, tram, train or multiple as one possibility), by car as a driver, by car as a passenger and by motorcycle (or similar). In this paper, we aggregated the number of possibilities to only three main groups: on foot or using bikes (group PB), using public transport (group T) and using cars (as a driver or passenger) or motorcycles (group CM). Three periods were considered in the survey: pre-, through and post-COVID-19 pandemic. The pre-pandemic period was associated with “normal” conditions, in which the journeys to work were performed. The through-pandemic period considered specific conditions such as teleworking, limitations (especially in public transport means), quarantine and individual human behaviors. These influence of course the choice of transport means. However, at the time of the survey (late June of 2021), the restrictions were temporarily lifted and work was predominantly realized in a normal operating regime. Consequently, we observed the “normal” number of journeys. Still, these journeys were conducted under pandemic conditions, including the requirement of wearing masks and limitations as to the number of places available on public transport. The post-pandemic period was forecasted and illustrated the plans of employees.
2.2. Area from Which the Employees Journeyed from
The employees of WUST lived in Wrocław and in surrounding areas. We considered the specific territorial units (called the analyzed territorial unit (ATU)) that were the municipalities in general. In two cases (ATUs no. 11 and 13), there were two municipalities each (separated by the city and villages). First, we considered Wrocław (ATU no. 1) and 31 closely located ATUs creating the agglomeration. Next, we added 16 other areas outside the agglomeration connected with Wrocław (a comprehensive survey from 2018 identified the journeys between these areas). All of the units were presented in Figure 1. We divided the units into three groups: ATUs with significant numbers of questionnaires (more than 3) were marked with green markings, ATUs with fewer numbers of journeys with yellow markings, and ATUs with no journeys to WUST with no markings. In the next analysis, we considered only 16 ATUs with numbers of journeys higher then 3 (the green ones). Figure 1 contained the main rail network too, considering the used lines (solid green line) and not used for passenger transport in the year 2021 (dotted green line).
We collected the basic parameters characterizing all ATUs (in Table 1). They were the number and the name, distance to WUST (in kilometers), population size (on 30 June 2021) and categorized standard of public transport (as a PTS parameter). Public transport Standards (PTS) were categorized as follows: H (high) with the dense transport network, short time of journey (up to 30 min) or high speed of journey by longer distances (unit no. 43) and short intervals between the trains or buses in the timetable (30 min or less in rush hours); M (medium) intermediate between high and low; L (low) with not dense transport network, long time of journey (more than 1 h) and long intervals between the trains or buses in the timetable (more than 1 h).
3. Results
The usage percentages of different transport means for journeys to WUST are shown in Table 2. The third column shows the number of employees (who completed the survey) arriving from the selected ATUs. The groups were presented in three periods: pre-pandemic, through-pandemic and post-pandemic. They were considerable differences in the shares between the units in all periods. We identified the ATUs with a high use of public transport means (12, 43 and 9) and with a high share of motorized transport (7 and 17). Interesting differences were found between the selected periods (Table 3).
The presented percentage changes in the shares of individual means of transport showed a change in the trend through- and post-pandemic. In ATUs no. 7, 10 and 17, the choice of public transport did not change through-and post-pandemic. As a result, most employees in these units were not using public transport prior to the pandemic and, therefore, remained the same. In the remaining cases, employees switched, on average, from approximately 17.7% using public transport to individual transport during the pandemic. Analyzing the situation pre- and post-pandemic, it was expected that the number of employees giving up public transport would falling, but it was still lower than pre- pandemic by approximately 7.2%. There was also growing interest in walking and cycling to work.
The above-collected remarks are illustrated more distinct in Table 4, where we showed only the shares of public transport ranking the units according to shares from the pre-pandemic period. The comparison of the percentages of employees using public transport showed the greatest popularity in the following ATUs: 43, 8, 9, 12, 13 and 24. According to the PTU parameter, the given units were classified as H (high) with the exception of 12, which was marked as M (medium). In these units, the number of employees choosing public transport oscillated between 43% and 62.5%.
The order of ATUs was more or less unchanged observing all periods. The units with a higher share of public transport pre- COVID-19 kept this level through- and post-pandemic. Higher differences occurred in the units with a small number of questionnaires.
4. Discussion
ATUs no. 3, 10 and 17 were classified as L (low). Due to the long journey time through a not too dense communication network (lack of trains), a large number of people used individual means of transport. In each of these units and periods, 80–100% of employees chose private means of transport. The low level of use of public transport means (20, 0 and 0 % in following periods) occurred for ATU no. 6 too. Despite the classification of this unit to class M (middle) of PTS (according to a distinct number of bus connections), we found the important influence of the lack of rail lines.
The frequent selection of private means of transport also covered ATU no. 2 classified as M (medium) and ATU no. 7 classified as H (high). In the first case, the share was approximately 80%, and in the second case 100%. Both units had a good rail connection with Wrocław, but this form of public transport did not cover the whole area of the municipality. The municipalities were highly populated (see Table 1), and public transport was not fully integrated, so the potential of the rail was not fully realized.
Similar results as discussed above were reported in some previous studies. Before the pandemic, the choice of means of transport was predominantly shaped by factors such as satisfaction, experience, pricing, emissions, distances and land use [5,19,22,23,24,25]. In the identified cases, the share of public transport means decreased by approximately 18% on average, with employees switching to individual transport means during the pandemic [33,34,35].
We did not identify any significant influence of distance or population on the changes between percentages in any periods (pre-, through and post-pandemic). However, dependencies between the shares in transport means and the standards of public transport were evident. However, this aspect needs more detailed studies. The standards (PTSs) should be more detailed and defined in relation to spatial diversity. The hypothesis that the influence of standards on the shares was stronger than the influence of the pandemic itself is intriguing, but should be confirmed by other studies.
5. Conclusions
The presented analyses of a survey conducted on a representative sample of employees of WUST revealed long-term implications of the COVID-19 pandemic for transport and the environment. The proportion of public transport means used for journeys to work through the pandemic period decreased in comparison to the pre-pandemic period. Although the survey results suggested this trend to be reversed in the post-pandemic period, it should not bounce back to the pre-pandemic levels. This was most likely caused by employees who used public means of transport such as trains, trams or buses in the pre-pandemic period that did not go back to these practices in the post-pandemic period. Therefore, it was concluded that the consequences of the pandemic for transport and the environment are negative and are likely to worsen, inter alia, the carbon footprint. Beyond the abovementioned effects, it was found that the influence of the standards of the public transport means (referred herein as PST) on the mobility patterns could be stronger than that of the pandemic itself; however, this issue requires further investigation.
The presented study was conducted on a rather specific sample of a population of (university) employees based around a single workplace, and for this reason should be considered in the context of other studies on this matter. Plans have already been determined to conduct similar surveys on students of WUST and at other universities and entities employing a considerable number of people in Wrocław. Despite these limitations, the present study confirmed findings from other studies dedicated to the COVID-19 pandemic and its influence on transport means observed all over the world.
This research did not receive any specific grant from funding agencies in the public, commercial or not-for-profit sectors.
This article belongs to the Special Issue Impact of COVID-19 on Pedestrian Behavior, Road Safety and Sustainable Transportation.
Author Contributions
Conceptualization, M.K. and W.K.S.; methodology, M.K.; software, W.K.S.; validation, M.K. and W.K.S.; formal analysis, M.K.; investigation, M.K and W.K.S.; resources, M.K.; data curation, W.K.S.; writing—original draft preparation, M.K. and W.K.S.; writing—review and editing, M.K. and W.K.S.; visualization, M.K.; supervision, M.K. and W.K.S.; project administration, M.K. All authors have read and agreed to the published version of the manuscript.
Funding
This research received no external funding.
Institutional Review Board Statement
Not applicable.
Informed Consent Statement
Not applicable.
Data Availability Statement
Not applicable.
Conflicts of Interest
The authors declare no conflict of interest.
References
- Brand, C.; Dons, E.; Anaya-Boig, E.; Avila-Palencia, I.; Clark, A.; de Nazelle, A.; Gascon, M.; Gaupp-Berghausen, M.; Gerike, R.; Götschi, T.; et al. The climate change mitigation effects of daily active travel in cities. Transp. Res. Part D Transp. Environ. 2021, 93, 102764. [Google Scholar] [CrossRef]
- Cucinotta, D.; Vanelli, M. WHO declares COVID-19 a pandemic. Acta Biomed. 2020, 91, 157–160. [Google Scholar] [CrossRef] [PubMed]
- Borkowski, P.; Jażdżewska-Gutta, M.; Szmelter-Jarosz, A. Lockdowned: Everyday mobility changes in response to COVID-19. J. Transp. Geogr. 2020, 90, 102906. [Google Scholar] [CrossRef] [PubMed]
- Brinchi, S.; Carrese, S.; Cipriani, E.; Colombaroni, C.; Crisalli, U.; Fusco, G.; Gemma, A.; Isaenko, N.; Mannini, L.; Patella, S.M.; et al. On Transport Monitoring and Forecasting During COVID-19 Pandemic in Rome. Transp. Telecommun. J. 2020, 21, 275–284. [Google Scholar] [CrossRef]
- Bucsky, P. Modal share changes due to COVID-19: The case of Budapest. Transp. Res. Interdiscip. Perspect. 2020, 8, 100141. [Google Scholar] [CrossRef]
- Eisenmann, C.; Nobis, C.; Kolarova, V.; Lenz, B.; Winkler, C. Transport mode use during the COVID-19 lockdown period in Germany: The car became more important, public transport lost ground. Transp. Policy 2021, 103, 60–67. [Google Scholar] [CrossRef]
- Jenelius, E.; Cebecauer, M. Impacts of COVID-19 on public transport ridership in Sweden: Analysis of ticket validations, sales and passenger counts. Transp. Res. Interdiscip. Perspect. 2020, 8, 100242. [Google Scholar] [CrossRef]
- Molloy, J.; Schatzmann, T.; Schoeman, B.; Tchervenkov, C.; Hintermann, B.; Axhausen, K.W. Observed impacts of the Covid-19 first wave on travel behaviour in Switzerland based on a large GPS panel. Transp. Policy 2021, 104, 43–51. [Google Scholar] [CrossRef]
- Przybylowski, A.; Stelmak, S.; Suchanek, M. Mobility Behaviour in View of the Impact of the COVID-19 Pandemic—Public Transport Users in Gdansk Case Study. Sustainability 2021, 13, 364. [Google Scholar] [CrossRef]
- Zafri, N.; Khan, A.; Jamal, S.; Alam, B. Impacts of the COVID-19 Pandemic on Active Travel Mode Choice in Bangladesh: A Study from the Perspective of Sustainability and New Normal Situation. Sustainability 2021, 13, 6975. [Google Scholar] [CrossRef]
- Macioszek, E.; Kurek, A. Extracting Road Traffic Volume in the City before and during covid-19 through Video Remote Sensing. Remote Sens. 2021, 13, 2329. [Google Scholar] [CrossRef]
- Wielechowski, M.; Czech, K.; Grzęda, Ł. Decline in Mobility: Public Transport in Poland in the time of the COVID-19 Pandemic. Economies 2020, 8, 78. [Google Scholar] [CrossRef]
- Hadjidemetriou, G.M.; Sasidharan, M.; Kouyialis, G.; Parlikad, A.K. The impact of government measures and human mobility trend on COVID-19 related deaths in the UK. Transp. Res. Interdiscip. Perspect. 2020, 6, 100167. [Google Scholar] [CrossRef]
- Pozo, R.F.; Wilby, M.R.; Díaz, J.J.V.; González, A.B.R. Data-driven analysis of the impact of COVID-19 on Madrid’s public transport during each phase of the pandemic. Cities 2022, 127, 103723. [Google Scholar] [CrossRef]
- Shakibaei, S.; de Jong, G.C.; Alpkökin, P.; Rashidi, T.H. Impact of the COVID-19 pandemic on travel behavior in Istanbul: A panel data analysis. Sustain. Cities Soc. 2020, 65, 102619. [Google Scholar] [CrossRef]
- Palak, M. Contemporary Commuting to Work. Soc. Inequalities Econ. Growth 2013, 33, 161–168. Available online: https://cejsh.icm.edu.pl/cejsh/element/bwmeta1.element.desklight-265599c0-1b63-48d3-ba85-07401fc35631?q=bwmeta1.element.desklight-5e031d91-2f96-4ba6-b3ae-ea71fbe32e77;12&qt=CHILDREN-STATELESS (accessed on 6 May 2022).
- Harbering, M.; Schlüter, J. Determinants of transport mode choice in metropolitan areas the case of the metropolitan area of the Valley of Mexico. J. Transp. Geogr. 2020, 87, 102766. [Google Scholar] [CrossRef]
- Brand, C.; Preston, J.M. ‘60–20 emission’—The unequal distribution of greenhouse gas emissions from personal, non-business travel in the UK. Transp. Policy 2010, 17, 9–19. [Google Scholar] [CrossRef]
- Sukhov, A.; Lättman, K.; Olsson, L.E.; Friman, M.; Fujii, S. Assessing travel satisfaction in public transport: A configurational approach. Transp. Res. Part D Transp. Environ. 2021, 93, 102732. [Google Scholar] [CrossRef]
- Kłos-Adamkiewicz, Z.; Gutowski, P. The Outbreak of COVID-19 Pandemic in Relation to Sense of Safety and Mobility Changes in Public Transport Using the Example of Warsaw. Sustainability 2022, 14, 1780. [Google Scholar] [CrossRef]
- De Palma, A.; Vosough, S.; Liao, F. An overview of effects of COVID-19 on mobility and lifestyle: 18 months since the outbreak. Transp. Res. Part A Policy Pract. 2022, 159, 372–397. [Google Scholar] [CrossRef] [PubMed]
- Tennøy, A.; Knapskog, M.; Wolday, F. Walking distances to public transport in smaller and larger Norwegian cities. Transp. Res. Part D Transp. Environ. 2022, 103, 103169. [Google Scholar] [CrossRef]
- Wyszomirska-Góra, M. Psychological Determinants Influencing Everyday Means of Transport Choice. Transp. Miej. I Regionalny 2013, 1, 4–9. Available online: https://bibliotekanauki.pl/articles/192667 (accessed on 6 May 2022).
- Murena, F.; Prati, M.V.; Costagliola, M.A. Real driving emissions of a scooter and a passenger car in Naples city. Transp. Res. Part D Transp. Environ. 2019, 73, 46–55. [Google Scholar] [CrossRef]
- Montero-Lamas, Y.; Orro, A.; Novales, M.; Varela-García, F.-A. Analysis of the Relationship between the Characteristics of the Areas of Influence of Bus Stops and the Decrease in Ridership during COVID-19 Lockdowns. Sustainability 2022, 14, 4248. [Google Scholar] [CrossRef]
- Beck, M.J.; Hensher, D.A.; Nelson, J.D. Public transport trends in Australia during the COVID-19 pandemic: An investigation of the influence of bio-security concerns on trip behaviour. J. Transp. Geogr. 2021, 96, 103167. [Google Scholar] [CrossRef]
- Marra, A.D.; Sun, L.; Corman, F. The impact of COVID-19 pandemic on public transport usage and route choice: Evidences from a long-term tracking study in urban area. Transp. Policy 2021, 116, 258–268. [Google Scholar] [CrossRef] [PubMed]
- Tirachini, A.; Cats, O.; Delft University of Technology. COVID-19 and Public Transportation: Current Assessment, Prospects, and Research Needs. J. Public Transp. 2020, 22, 1. [Google Scholar] [CrossRef]
- Barbieri, D.M.; Lou, B.; Passavanti, M.; Hui, C.; Lessa, D.A.; Maharaj, B.; Banerjee, A.; Wang, F.; Chang, K.; Naik, B.; et al. A survey dataset to evaluate the changes in mobility and transportation due to COVID-19 travel restrictions in Australia, Brazil, China, Ghana, India, Iran, Italy, Norway, South Africa, United States. Data Brief. 2020, 33, 106459. [Google Scholar] [CrossRef]
- Barbarossa, L. The Post Pandemic City: Challenges and Opportunities for a Non-Motorized Urban Environment. An Overview of Italian Cases. Sustainability 2020, 12, 7172. [Google Scholar] [CrossRef]
- Fatmi, M.R. COVID-19 impact on urban mobility. J. Urban Manag. 2020, 9, 270–275. [Google Scholar] [CrossRef]
- Ahangari, S.; Chavis, C.; Jeihani, M. Public Transit Ridership Analysis during the COVID-19 Pandemic. medRxiv. 2020. [Google Scholar] [CrossRef]
- Schaefer, K.J.; Tuitjer, L.; Levin-Keitel, M. Transport disrupted–Substituting public transport by bike or car under Covid 19. Transp. Res. Part A Policy Pract. 2021, 153, 202–217. [Google Scholar] [CrossRef] [PubMed]
- Xu, Y.; Li, J.-P.; Chu, C.-C.; Dinca, G. Impact of COVID-19 on transportation and logistics: A case of China. Econ. Res.-Ekon. Istraz. 2021, 1–19. [Google Scholar] [CrossRef]
- Gkiotsalitis, K.; Cats, O. Public transport planning adaption under the COVID-19 pandemic crisis: Literature review of research needs and directions. Transp. Rev. 2020, 41, 374–392. [Google Scholar] [CrossRef]
- Matiza, T. Post-COVID-19 crisis travel behaviour: Towards mitigating the effects of perceived risk. J. Tour. Futur. 2020, 8, 99–108. [Google Scholar] [CrossRef]
- Bagdatli, M.E.C.; Ipek, F. Transport mode preferences of university students in post-COVID-19 pandemic. Transp. Policy 2022, 118, 20–32. [Google Scholar] [CrossRef] [PubMed]
- Awad-Núñez, S.; Julio, R.; Moya-Gómez, B.; Gomez, J.; González, J.S. Acceptability of sustainable mobility policies under a post-COVID-19 scenario. Evidence from Spain. Transp. Policy 2021, 106, 205–214. [Google Scholar] [CrossRef]
- Basu, R.; Ferreira, J. Sustainable mobility in auto-dominated Metro Boston: Challenges and opportunities post-COVID-19. Transp. Policy 2021, 103, 197–210. [Google Scholar] [CrossRef]
- Abdullah, M.; Dias, C.; Muley, D.; Shahin, M. Exploring the impacts of COVID-19 on travel behavior and mode preferences. Transp. Res. Interdiscip. Perspect. 2020, 8, 100255. [Google Scholar] [CrossRef]
- Vickerman, R. Will Covid-19 put the public back in public transport? A UK perspective. Transp. Policy 2021, 103, 95–102. [Google Scholar] [CrossRef]
- Zhang, R.; Zhang, J. Long-term pathways to deep decarbonization of the transport sector in the post-COVID world. Transp. Policy 2021, 110, 28–36. [Google Scholar] [CrossRef]
Figure 1.
Considered area.


Table 1.
Parameters characterizing the origins of the journey (ATU) to WUST.
| ATU 1 | Distance | Population Size | PTS 2 | |
|---|---|---|---|---|
| No. | Name | (km) | (30.06.2021) | |
| 1. | Wrocław | 0–17.9 | 641,201 | H |
| 2. | Długołęka | 9.3–19.7 | 35,714 | M |
| 3. | Czernica | 10.9–25.9 | 18,240 | L |
| 4. | Siechnice | 8.9–15.1 | 24,775 | H |
| 5. | Żórawina | 12.4–21.2 | 11,569 | M |
| 6. | Kobierzyce | 15.7–24.7 | 22,323 | M |
| 7. | Kąty Wr. | 14.7–28.3 | 26,390 | H |
| 8. | Miękinia | 19.1–27.9 | 18,072 | H |
| 9. | Oborniki Śl. | 20.6–35.8 | 20,349 | H |
| 10. | Wisznia Mł. | 13.8–18.1 | 10,660 | L |
| 11. | Oleśnica | 22.9–43.5 | 51,071 | H |
| 12. | Jelcz Laskowice | 21.4–26.4 | 23,264 | M |
| 13. | Oława | 27.3 | 48,301 | H |
| 17. | Sobótka | 36.3–42.4 | 12,825 | L |
| 24. | Trzebnica | 26.5–44.6 | 24,485 | H |
| 43. | Lubin | 74.7 | 87,982 | H |
Notes: 1 ATU—analyzed territorial unit (description in text). 2 PTS—public transport standard (description in text).
Table 2.
Shares of use of transport means for individual areas.
| ATU 1 | Mean of Transport Pre-Pandemic (%) | Mean of Transport through-Pandemic (%) | Mean of Transport Post-Pandemic (%) | ||||||||
|---|---|---|---|---|---|---|---|---|---|---|---|
| No. | Name | Number of Employees | PB | T | CM | PB | T | CM | PB | T | CM |
| 1. | Wrocław | 590 | 33.1 | 33.5 | 33.5 | 33.0 | 18.0 | 49.0 | 35.2 | 26.2 | 38.6 |
| 2. | Długołęka | 31 | 7.7 | 12.8 | 79.5 | 7.9 | 7.9 | 84.2 | 10.3 | 10.3 | 79.5 |
| 3. | Czernica | 37 | 2.4 | 12.2 | 85.4 | 2.6 | 5.3 | 92.1 | 2.3 | 9.1 | 88.6 |
| 4. | Siechnice | 21 | 10.3 | 20.7 | 69.0 | 3.7 | 14.8 | 81.5 | 7.1 | 17.9 | 75.0 |
| 5. | Żórawina | 5 | 0.0 | 33.3 | 66.7 | 0.0 | 0.0 | 100.0 | 0.0 | 25.0 | 75.0 |
| 6. | Kobierzyce | 5 | 0.0 | 20.0 | 80.0 | 0.0 | 0.0 | 100.0 | 0.0 | 0.0 | 100.0 |
| 7. | Kąty Wr. | 8 | 0.0 | 0.0 | 100.0 | 0.0 | 0.0 | 100.0 | 10.0 | 0.0 | 90.0 |
| 8. | Miękinia | 12 | 10.5 | 42.1 | 47.4 | 6.7 | 20.0 | 73.3 | 5.9 | 35.3 | 58.8 |
| 9. | Oborniki Śl. | 5 | 16.7 | 50.0 | 33.3 | 16.7 | 33.3 | 50.0 | 16.7 | 50.0 | 33.3 |
| 10. | Wisznia Mł. | 5 | 0.0 | 20.0 | 80.0 | 0.0 | 20.0 | 80.0 | 0.0 | 20.0 | 80.0 |
| 11. | Oleśnica | 14 | 5.9 | 35.3 | 58.8 | 6.7 | 6.7 | 86.7 | 10.0 | 35.0 | 55.0 |
| 12. | Jelcz Laskowice | 6 | 0.0 | 62.5 | 37.5 | 0.0 | 33.3 | 66.7 | 0.0 | 50.0 | 50.0 |
| 13. | Oława | 6 | 0.0 | 42.9 | 57.1 | 0.0 | 25.0 | 75.0 | 0.0 | 25.0 | 75.0 |
| 17. | Sobótka | 5 | 0.0 | 0.0 | 100.0 | 0.0 | 0.0 | 100.0 | 0.0 | 0.0 | 100.0 |
| 24. | Trzebnica | 8 | 11.1 | 44.4 | 44.4 | 20.0 | 30.0 | 50.0 | 20.0 | 40.0 | 40.0 |
| 43. | Lubin | 4 | 28.6 | 57.1 | 14.3 | 28.6 | 42.9 | 28.6 | 16.7 | 50.0 | 33.3 |
Notes: 1 ATU—analyzed territorial unit (description in text).
Table 3.
Percentage changes in the shares of the particular means of transport.
| ATU 1 | Trough- and Pre-Pandemic (%) | Post-and Pre- Pandemic (%) | |||||
|---|---|---|---|---|---|---|---|
| No. | Name | PB | T | CM | PB | T | CM |
| 1. | Wrocław | −0.1 | –15.4 | 15.5 | 2.2 | –7.3 | 5.2 |
| 2. | Długołęka | 0.2 | –4.9 | 4.7 | 2.6 | –2.6 | 0.0 |
| 3. | Czernica | 0.2 | –6.9 | 6.7 | –0.2 | –3.1 | 3.3 |
| 4. | Siechnice | –6.6 | –5.9 | 12.5 | –3.2 | –2.8 | 6.0 |
| 5. | Żórawina | 0.0 | –33.3 | 33.3 | 0.0 | –8.3 | 8.3 |
| 6. | Kobierzyce | 0.0 | –20.0 | 20.0 | 0.0 | –20.0 | 20.0 |
| 7. | Kąty Wr. | 0.0 | 0.0 | 0.0 | 10.0 | 0.0 | –10.0 |
| 8. | Miękinia | –3.9 | –22.1 | 26.0 | –4.6 | –6.8 | 11.5 |
| 9. | Oborniki Śl. | 0.0 | –16.7 | 16.7 | 0.0 | 0.0 | 0.0 |
| 10. | Wisznia Mł. | 0.0 | 0.0 | 0.0 | 0.0 | 0.0 | 0.0 |
| 11. | Oleśnica | 0.8 | –28.6 | 27.8 | 4.1 | –0.3 | –3.8 |
| 12. | Jelcz Laskowice | 0.0 | –29.2 | 29.2 | 0.0 | –12.5 | 12.5 |
| 13. | Oława | 0.0 | –17.9 | 17.9 | 0.0 | –17.9 | 17.9 |
| 17. | Sobótka | 0.0 | 0.0 | 0.0 | 0.0 | 0.0 | 0.0 |
| 24. | Trzebnica | 8.9 | –14.4 | 5.6 | 8.9 | –4.4 | –4.4 |
| 43. | Lubin | 0.0 | –14.3 | 14.3 | –11.9 | –7.1 | 19.0 |
| Average changes: | 0.0 | –17.7 | 17.7 | 0.6 | –7.2 | 6.6 | |
Notes: 1 ATU—analyzed territorial unit (description in text).
Table 4.
The share of public transport arranged from the highest to the lowest value.
| ATU 1 | Name | Percentage of Employees Using Public Transport (%) | ||
|---|---|---|---|---|
| No. | Pre-Pandemic | Through-Pandemic | Post-Pandemic | |
| 12. | Jelcz Laskowice | 62.5 | 33.3 | 50.0 |
| 43. | Lubin | 57.1 | 42.9 | 50.0 |
| 9. | ObornikiŚl. | 50.0 | 33.3 | 50.0 |
| 24. | Trzebnica | 44.4 | 30.0 | 40.0 |
| 13. | Oława | 42.9 | 25.0 | 25.0 |
| 8. | Miękinia | 42.1 | 20.0 | 35.3 |
| 11. | Oleśnica | 35.3 | 6.7 | 35.0 |
| 1. | Wrocław | 33.5 | 18.0 | 26.2 |
| 5. | Żórawina | 33.3 | 0.0 | 25.0 |
| 4. | Siechnice | 20.7 | 14.8 | 17.9 |
| 6. | Kobierzyce | 20.0 | 0.0 | 0.0 |
| 10. | WiszniaMł. | 20.0 | 20.0 | 20.0 |
| 2. | Długołęka | 12.8 | 7.9 | 10.3 |
| 3. | Czernica | 12.2 | 5.3 | 9.1 |
| 7. | KątyWr. | 0.0 | 0.0 | 0.0 |
| 17. | Sobótka | 0.0 | 0.0 | 0.0 |
Notes: 1 ATU—analyzed territorial unit (description in text).
Publisher’s Note: MDPI stays neutral with regard to jurisdictional claims in published maps and institutional affiliations. |
© 2022 by the authors. Licensee MDPI, Basel, Switzerland. This article is an open access article distributed under the terms and conditions of the Creative Commons Attribution (CC BY) license (https://creativecommons.org/licenses/by/4.0/).
Share and Cite
MDPI and ACS Style
Szczepanek, W.K.; Kruszyna, M. The Impact of COVID-19 on the Choice of Transport Means in Journeys to Work Based on the Selected Example from Poland. Sustainability 2022, 14, 7619. https://doi.org/10.3390/su14137619
AMA Style
Szczepanek WK, Kruszyna M. The Impact of COVID-19 on the Choice of Transport Means in Journeys to Work Based on the Selected Example from Poland. Sustainability. 2022; 14(13):7619. https://doi.org/10.3390/su14137619
Chicago/Turabian StyleSzczepanek, Wojciech Kazimierz, and Maciej Kruszyna. 2022. "The Impact of COVID-19 on the Choice of Transport Means in Journeys to Work Based on the Selected Example from Poland" Sustainability 14, no. 13: 7619. https://doi.org/10.3390/su14137619
Note that from the first issue of 2016, this journal uses article numbers instead of page numbers. See further details here.