Effect of Population Migration and Socioeconomic Factors on the COVID-19 Epidemic at County Level in Guangdong, China
 Jianhui Xu
 Yingbin Deng1
  Yingwei Yan
 Yichun Xie
- 1Southern Marine Science and Engineering Guangdong Laboratory (Guangzhou), Guangdong Province Engineering Laboratory for Geographic Spatio-temporal Big Data, Key Laboratory of Guangdong for Utilization of Remote Sensing and Geographical Information System, Guangzhou Institute of Geography, Guangdong Academy of Sciences, Guangzhou, China
- 2Department of Geography, National University of Singapore, Singapore, Singapore
- 3Institute for Geospatial Research and Education, Eastern Michigan University, Ypsilanti, MI, United States
Coronavirus disease 2019 (COVID-19) has become a major public health concern worldwide. In this study, we aimed to analyze spatial clusters of the COVID-19 epidemic and explore the effects of population emigration and socioeconomic factors on the epidemic at the county level in Guangdong, China. Data on confirmed cases, population migration, and socioeconomic factors for 121 counties were collected from 1 December 2019 to 17 February 2020, during which there were a total of 1,328 confirmed cases. County-level infected migrants of Guangdong moving from Hubei were calculated by integrating the incidence rate, population migration data of Baidu Qianxi, and the resident population. Using the spatial autocorrelation method, we identified high-cluster areas of the epidemic. We also used a geographical detector to explore infected migrants and socioeconomic factors associated with transmission of COVID-19 in Guangdong. Our results showed that: 1) the epidemic exhibited significant positive global spatial autocorrelation; high–high spatial clusters were mainly distributed in the Pearl River Estuary region; 2) city-level population migration data corroborated with the incidence rate of each city in Hubei showed significant association with confirmed cases; 3) in terms of potential factors, infected migrants greatly contributed to the spread of COVID-19, which has strong ability to explain the COVID-19 epidemic; besides, the companies, transport services, residential communities, restaurants, and community facilities were also the dominant factors in the spread of the epidemic; 4) the combined effect produced by the intersecting factors can increase the explanatory power. The infected migrant factor interacted strongly with the community facility factor with the q value of 0.895. This indicates that the interaction between infected migrants and community facilities played an important role in transmitting COVID-19 at the county level.
Introduction
The COVID-19 epidemic has spread worldwide, becoming a pandemic. It affects a large number of people, regardless of nationality, ethnicity, gender, or age. To contain the spread of COVID-19, the harshest measures were employed by the Chinese government, including a lockdown of all cities in Hubei province and launch of a first-level public health response (State Council, 2020), to protect people from the epidemic. These measures have effectively curbed the spread of COVID-19 and eased the growth of confirmed cases in China (Jin et al., 2020; Tian et al., 2020; Zhou et al., 2020). With urgent and effective control measures, the daily new confirmed cases gradually decreased since 14 February 2020 (Tian et al., 2020). As of 20 April 2020, a cumulative total of 84,250 confirmed cases and 4,642 deaths were reported in China, with 2,230,384 confirmed cases and 153,205 deaths in over 200 countries globally, outside China, with a rapid growth of confirmed cases in North America and Europe. The research studies have been indicating that the travel may have accelerated the spread of the COVID-19 epidemic within China and internationally (Deeb and Jalloul 2020; Gibbs et al., 2020). The travel restrictions may significantly affect the COVID-19 epidemic trajectory, which leads to a high reduction of COVID-19 transmission (Chinazzi et al., 2020; Docquier et al., 2021). However, a relaxation of travel restrictions would increase the spread risk of the COVID-19 epidemic (Deeb and Jalloul 2020; Geng et al., 2021). At present, the epidemic has been effectively controlled in China because China adopted the restricted measures; however, it has been accelerating globally.
COVID-19 has attracted global attention and has been analyzed and explored in terms of clinical diagnosis (Huang C. et al., 2020; Guan et al., 2020), transmission, prediction (Hu et al., 2020a; Chen 2020; Liu et al., 2020; Wu et al., 2020), and the effects of control strategies (Huang S. et al., 2020; Lin et al., 2020). SIR (susceptible–infected–recovered), SEIR (susceptible–exposed–infectious–recovered), and their improved models have been implemented in predicting the spread and confirmed cases of the epidemic (Wang 2015; Avilavales and Cervantesperez 2019; Chen X. et al., 2020; Hu et al., 2020b; Zhao and Chen 2020) and the transmission of COVID-19 by integrating population migration data (Yang et al., 2020a; Chen Y. et al., 2020; Kraemer et al., 2020; Zhong et al., 2020). Some researchers developed online epidemic maps with daily statistical data, enabling governments and people to objectively understand the spatiotemporal patterns and spread of COVID-19 (Dong et al., 2020). Integrating the multiple data of population migration data, traffic network data, service provision, residents’ distribution, and community facilities, the spatiotemporal statistics methods were applied to further explore the spatiotemporal characteristics and spatial risk factors of COVID-19 transmission (Li W. et al., 2020; Li X. et al., 2020; Chen Z. et al., 2020; Pourghasemi et al., 2020; Xia et al., 2020).
The spatiotemporal statistics have been demonstrated to be practical methods to investigate spatial correlation and clustering, the transmission network, and characteristics of epidemics, such as SARS of 2003 (Wu et al., 2005; Reynolds et al., 2008; Cao et al., 2010; Hu et al., 2013; Cao et al., 2016). Cui et al. (2021) have compared the spatial and temporal transmission differences between SARS and COVID-19 and analyzed their influence factors. The results indicated that both SARS transmission and COVID-19 transmission have obvious spatial aggregation and proximity propagation characteristics, and their spatial transmissions were more susceptible to traffic network, population migration, population density, and service facilities (Cao et al., 2008). However, the COVID-19 epidemic showed greater transmission intensity and range than SARS. Wang and Zhao (2020) analyzed the spatiotemporal distribution pattern of the COVID-19 epidemic of urban agglomerations in China at city level by using the spatial autocorrelation and the geographic detector methods. The results indicated that the COVID-19 epidemic has significant spatial agglomeration characteristics at city level. The socioeconomic factors, including population density, urban and rural construction, and transportation, were closely related to the spread of the COVID-19 epidemic (Zhang and Schwartz 2020), and their interactions may have strong effect on the epidemic. Furthermore, other spatial risk factors, for e.g., commercial facilities, subway stations, restaurants, hotels, and tourist attractions, also presented significant influence on the COVID-19 epidemic severity (Li X. et al., 2020; Zhu and Sun 2020). Some of the influence factors could be extracted and calculated from the points of interest (POIs). The global and local Moran’s I statistics have been used to explore the spatiotemporal pattern of COVID-19 in different countries (Kim and Castro 2020; Vaz 2021). El Deeb (2021) studied the spatial spread of the COVID-19 infection in Lebanon using the univariate Moran’s I statistics. The results showed that clustering of new COVID-19 infections occurred starting on different dates between July and August. Xiong et al. (2020) used spatial autocorrelation and Pearson correlation approaches to explore factors influencing the epidemic in Hubei province. The results showed that the cumulative COVID-19 confirmed cases had a significant global spatial autocorrelation at the county level and were significantly related to the prefecture-city scale with the Baidu migration data and population density.
In general, the previous results showed that the detection of transmission relations among the population migration data has become the key to the research of the COVID-19 epidemic, and the transmission had typical network characteristics. Furthermore, the COVID-19 epidemic showed significant temporal and spatial heterogeneity in the spatiotemporal distribution (Zhang et al., 2020; Pei et al., 2021) and had been significantly related to different spatial risk factors. Due to differences in epidemic locations, population density, population migration characteristics, and prevention and control policies, the COVID-19 epidemic showed different spatial distribution patterns with different spatial scales, including the community, county, city, and country scales (Xiong et al., 2020; Pei et al., 2021).
Guangdong Province with relatively high degrees of economic development, large population densities, large migrant population, and developed transportation is the key region associated with the spread of the COVID-19 epidemic, which has become the second most affected COVID-19 province in China. As the largest foreign trade province in China, Guangdong Province has been closely linked with the outside world in the fields of education, science and technology, culture, tourism, and economy trade. In particular, people-to-people contacts have also been very close. The spread of the COVID-19 epidemic within the counties of Guangdong Province was representative. Exploring the spatiotemporal clustering characteristics of COVID-19 and analyzing the influencing factors of epidemic transmission at the county level may provide reference for the domestic and international epidemic prevention and control. Some researchers have focused on the spatiotemporal analysis of COVID-19 spread and risk at the city level in Guangdong by mainly using population migration (Xing et al., 2020; Ye et al., 2020). To reveal the risk factors and aggregation characteristics at the county level, we choose Guangdong as a case study to explore spatial agglomeration patterns and the effects of population migration and socioeconomic factors on the epidemic. Here, we used the spatial autocorrelation and geographical detector methods to investigate spatial autocorrelation characteristics and potential factors influencing the epidemic at county level. The objectives include 1) calculating county-level population migration of Guangdong from Hubei province; 2) capturing the spatial agglomeration and heterogeneity of the epidemic; and 3) investigating the effects of population migration and socioeconomic factors on the epidemic.
Materials and Methods
Study Area and Data
Study Area
Located on the southern coast of the People’s Republic of China, Guangdong Province borders Hong Kong and Macao and is adjacent to Southeast Asian countries (Figure 1). It contains 21 cities including Guangzhou, Shenzhen, Dongguan, Zhuhai, Foshan, Zhongshan, and Jiangmen, with an area of 179,700 km2 and contains 121 counties (Figure 1). Here, we focused on analyzing the factors influencing the COVID-19 epidemic at county scale. Guangdong is a relatively highly urbanized province of China, with an urbanization rate of 70.70%. Guangdong Province has the largest gross domestic product (GDP) among all Chinese provinces: 10.77 trillion yuan in 2019. As the southern Chinese manufacturing hub, Guangdong has the country’s largest transient population; over 24 million are migrants from other regions, while another 10.6 million have relocated from the province.
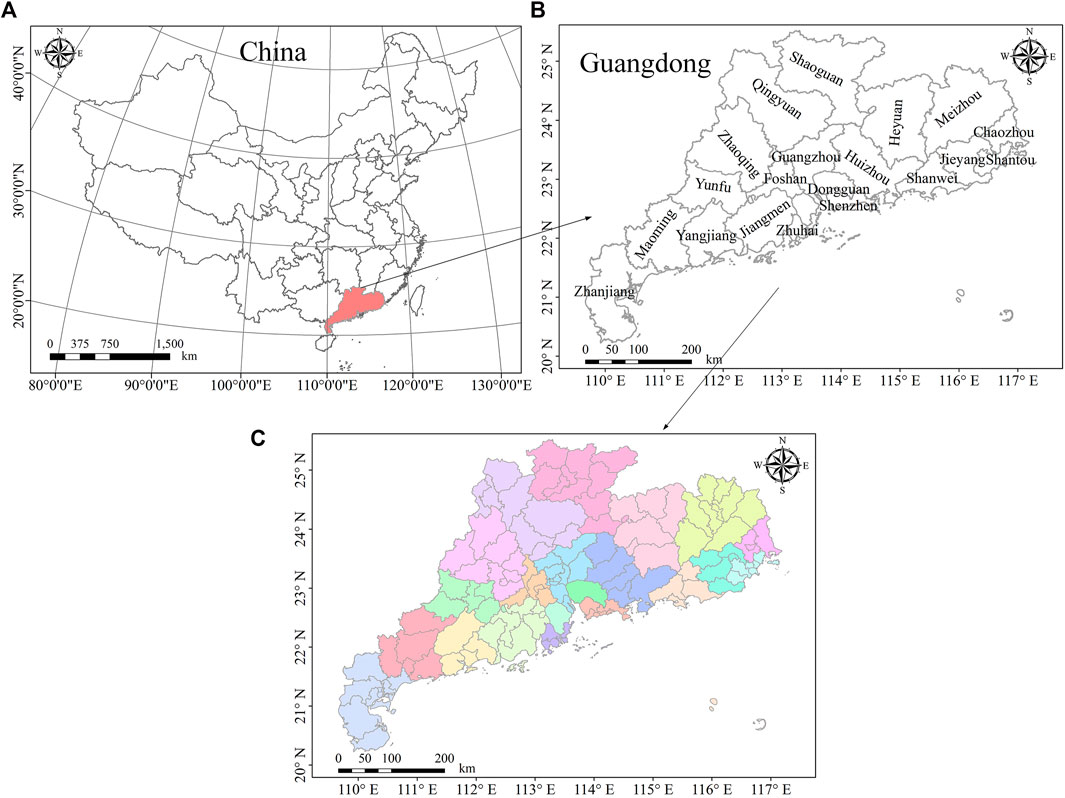
FIGURE 1. Study area.
Epidemiological Data
Here, we mainly considered and analyzed confirmed cases of COVID-19; daily data on confirmed cases from 1 December 2019 to 17 February 2020 were mainly collected from official reports of the Chinese provincial, municipal, or national health departments. Data were accumulated for all cities and counties of Hubei province and Guangdong at the city and county scales, respectively. The total confirmed cases were matched with officially reported data from the Chinese government. However, a small portion of the data on confirmed cases was discarded before the county-scale summation because such cases involved people who traveled to Guangdong Province and were confirmed at bus, railroad stations, and airports and were immediately rushed to COVID-19–designated hospitals. Such cases cannot aptly identify the county where they belonged.
Population Migration Data
The population migration (PopM) data were collected from Baidu map service (http://qianxi.baidu.com/) and analyzed for their correlation with confirmed cases, represented by the Baidu migration index data. As one of the most popular map service providers in China, the Baidu migration index data provide historical indicative daily volume of travelers to/from and between 367 cities in China, which is used to indicate the intensity of population migration. Although it cannot capture all migrants as it is based on the big data system recording movements of smartphone users, it is useful to conduct the comparisons among different cities in general migration patterns (Wei and Wang 2020). The Baidu migration data have been applied for the analysis of the population flow network and its effect on the spread of COVID-19 during the COVID-19 epidemic in China (Yang et al., 2020b; Wei and Wang 2020). Here, we collected two kinds of information about population migration: first, a series of daily migration data for movement out of each city of Hubei province from January 1 to 27, 2020, the days before the Spring Festival; second, the proportions of daily population migration data, bound from each city of Hubei province to that of each city of Guangdong Province, for the same period. However, Baidu Qianxi gave the proportions of population migration for only the top 100 cities.
Socioeconomic Data
Here, county-scale socioeconomic data of Guangdong Province were also taken into consideration to explore their influence on COVID-19 transmission. It included resident population, residential communities, enterprises, community facilities, restaurants, transport services, and traffic network. In this study, the traffic network was represented with rail and main roadways. The detailed explanation of socioeconomic data is shown in Table 1.
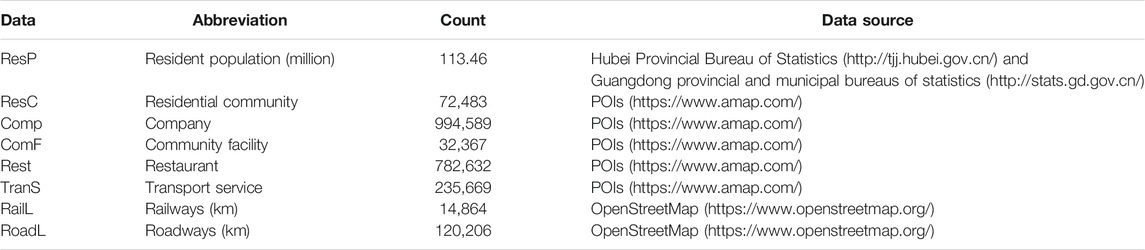
TABLE 1. Abbreviations of the socioeconomic data used in this study.
ResP: According to the sixth national population census of China, the resident population mainly consists of two groups: the local hukou-registered population and long-term migrants, both who stayed in a city for over six months. Here, data for 2018 on the city-scale resident population of Hubei and Guangdong provinces and the county-scale resident population of Guangdong province were collected from the provincial and municipal bureaus of statistics: Data for Hubei cities were collected from the Hubei Provincial Bureau of Statistics (http://tjj.hubei.gov.cn/), which were used to calculate the city-scale incidence rate of COVID-19; data for Guangdong cities and counties were collected from the Guangdong provincial and municipal bureaus of statistics (http://stats.gd.gov.cn/). Last, the county-scale population migration from each city of Hubei and the counties of Guangdong was estimated by integrating the city and county-scale resident population data and the total population migration.
POIs: Points of interest (POIs) were obtained from Gaode Map Services (https://www.amap.com/), a well-known location-based service (LBS) application. The Gaode Map classified these POIs into 23 first-level, 264 second-level, and 869 third-level categories. Five categories, the factors influencing the COVID-19 epidemic in Guangdong, were selected in this study: residential community (ResC), companies (Comp), community facilities (ComF), restaurants (Rest), and transport services (TraS). The transport services include airport, railway station, subway station, bus station, and parks. Table 1 presents these five categories and the number of POIs for each category. A total of 2,117,740 POIs located in Guangdong were used as auxiliary variables to analyze the relationship between COVID-19 transmission and the socioeconomic factors. The number of POIs for each category falling in Guangdong’s counties was counted using the “count points in polygon” function of QGIS Desktop 3.2.2.
RailL: Railway vector data (rail length) were obtained from OpenStreetMap (OSM, https://www.openstreetmap.org/) which collected enormous amounts of free spatial data. The total rail lengths of each county in Guangdong Province were calculated with the railway vector data using ArcGIS Desktop 10.2. Only rail, light-rail, and subway-railways were selected.
RoadL: Roadway (road length) data of each county in Guangdong Province were calculated with road vector data using ArcGIS Desktop 10.2. Such data were also downloaded from OpenStreetMap. Only major roads were selected to calculate county-scale road lengths, including motorways, trunk, primary, secondary, and tertiary roads.
Methods
Estimation of County-Scale Population Migration Data
The distribution of COVID-19 in China was highly correlated with population emigration from Hubei, especially from Wuhan. To explore the county-level spatial distribution of the epidemic in Guangdong, county-level population emigration from Hubei to Guangdong was estimated using Baidu Qianxi’s daily population migration data. The county-level population migration of Guangdong was estimated by integrating the total confirmed COVID-19 cases of Hubei, the population migration data from Hubei to Guangdong, and the resident population data of Hubei and Guangdong. First, we calculated the COVID-19 incidence rate of each city in Hubei using the following mathematical expression:
where “i” represents the number of cities of Hubei province, confirmed casesi represents the total confirmed COVID-19 cases, and populationi is the resident population of city “i.” Combining the incidence rate of COVID-19 and the total population migration data from each city of Hubei with other cities of Guangdong, we estimated the possible number of infected migrants as follows:
where “i” and “j” represent the number of cities of Hubei and Guangdong provinces, respectively, infected migrantsj is a summation of the possible number of infected migrants traveling from Hubei to cities “j” of Guangdong, while infected migrantsj is the number of possible infected migrants from city “i” of Hubei to city “j” of Guangdong, and migranti,j stands for total population migration from city “i” of Hubei to city “j” of Guangdong, obtained from the population migration data from Baidu Qianxi. Last, the county-level, possibly infected migrants from Hubei to Guangdong were estimated using the following formula:
where “j” and “k” represent the cities and counties of Guangdong Province,
Spatial Autocorrelation Analysis of the COVID-19 Epidemic
Spatial autocorrelation can always be used to measure spatial similarities between nearby observations; it describes the degree to which observations of a variable (e.g., epidemic disease) are similar to each other at a given spatial scale. Here, a global and local spatial autocorrelation analyses were applied to analyze the spatial agglomeration pattern of the confirmed COVID-19 cases at the county level in Guangdong, including the global and local Moran’s I indices. The global Moran’s I index was applied as shown in Eq. 6 (Moran 1950).
where n indicates the number of counties in Guangdong,
Furthermore, the local indicator of spatial association (LISA) (Anselin 2010) was also applied to reflect the spatial correlation between the COVID-19 cases of a county and its adjacent counties. The LISA index was defined by (Anselin 2010):
where m indicates the number of counties geographically adjacent to county “j.” LISA consists of five types of local spatial autocorrelation: high–high clusters (high number of COVID-19 cases surrounded by the same), low–low clusters (low number of COVID-19 cases surrounded by the same), high–low clusters (high number of COVID-19 cases surrounded by low number of cases), low–high clusters (low number of COVID-19 cases surrounded by high number of cases), and spatial randomness (no significant spatial patterns). In this study, the spatial autocorrelation analysis of the COVID-19 epidemic was implemented by using GeoDa software (Anselin et al., 2006).
Geographical Detector
Because of its advantages (without assuming linearity between geographical phenomenon and the driving factors and without being affected by multicollinearity), the geographical detector (Wang and Xu 2017) has been widely applied to detect spatial variation of geographical phenomena and reveal their potential driving forces; it contains four detectors: factor, risk, ecological, and interaction. The geographical detector was implemented using GeoDetector software (http://www.sssampling.org/Excel-Geodetector). An essential assumption of this method is that the spatial distribution of COVID-19 transmission is similar to that of its potential driving forces. Here, only the factor and interaction detector were involved in the driving force analysis.
Here, the factor detector was used to quantitatively measure the relative importance of the factors influencing COVID-19 transmission, which could be expressed with the power determinant (q). The mathematical expression of PD is as follows (Wang et al., 2010):
where m is the grade number of potential driving factors (j = 1, 2, … , m). n and nj are the number of counties in the whole area and the j grade, respectively, and
Furthermore, the interaction detector was used to investigate the interactive effects of two different factors x1 and x2 on COVID-19 transmission, which was assessed by comparing the values of
where
Nine factors, in terms of population migration and socioeconomic data at the county level in Guangdong, were selected. In particular, the socioeconomic data were represented by infected migrants (InfM), resident population (ResP), residential communities (ResC), companies (Comp), community facilities (ComF), restaurants (Rest), transport services (TranS), railways (RailL), and roadways (RoadL). According to the input requirements of the geographical detector, these factors were categorized on considering prior information as well as the range and distribution of the data. The number of categorized types of each factor is shown in Figure 2.
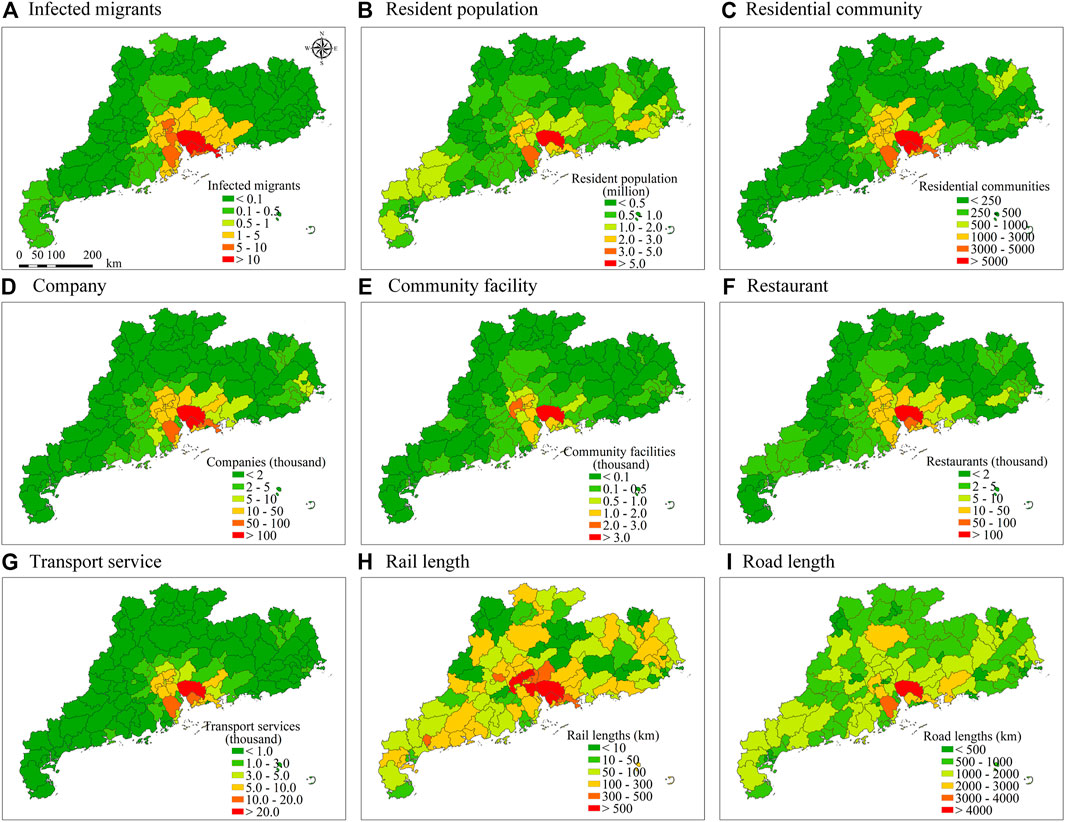
FIGURE 2. Categorized maps of nine factors in relation to the COVID-19 epidemic at the county level in Guangdong Province.
Results and Discussion
Spatial Distribution of Confirmed COVID-19 Cases
Figure 3 shows the spatial distribution of cumulative confirmed cases from 1 December 2019 to 17 February 2020 at the city level in Hubei and Guangdong. Cumulative confirmed cases of Hubei and Guangdong were up to 59,989 and 1,328, respectively. However, 24 cases in Shenzhen city of Guangdong Province that were confirmed at railroad stations and airports were not considered because the infected persons were immediately rushed to COVID-19–designated hospitals. Thus, the final number of cumulative confirmed cases of Guangdong was 1,304. In Figure 3A, Wuhan showed the largest number of COVID-19 cases, accounting for most cases in Hubei. There were over 1,000 cases in seven of seventeen cities in Hubei, including Wuhan, Xiaogan, Huanggang, Jingzhou, Ezhou, Suizhou, and Xiangyang. Figure 3B indicates that Shenzhen and Guangzhou had the most confirmed cases, with 392 and 339 cases, respectively, together accounting for 56% of all cases in Guangdong. COVID-19 mainly spread across the Pearl River Delta (PRD). However, Zhanjiang City had up to 22 confirmed cases, being a tourist-city located in the southernmost part of Guangdong. This could be as many people from Hubei province might have traveled to Zhanjiang City for the Spring Festival. Only five cities in Guangdong had less than 10 confirmed cases: Jieyang, Shanwei, Chaozhou, Heyuan, and Yunfu (no cases).
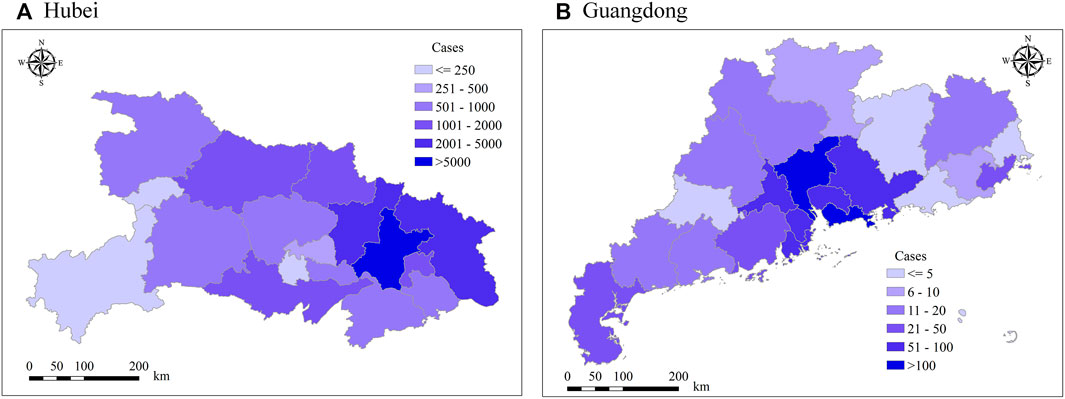
FIGURE 3. Spatial distribution of the city-level confirmed COVID-19 cases. (A) Hubei and (B) Guangdong.
The incidence rate and the corresponding confirmed cases at the city level in Hubei are shown in Figure 4A where it can be seen that the largest incidence rate of COVID-19 occurred in Wuhan with up to 38.58 cases per 10,000 people, followed by Ezhou, Xiaogan, Suizhou, and Tianmen with incidence rates of 12.42, 6.75, 5.77, and 5.18, respectively. Although Ezhou had the second largest incidence rate, its confirmed cases were less than that of Xiaogan, Huanggang, and Jingzhou. Tianmen and Xiantao showed high incidence rates with few confirmed cases, i.e., 500 and 544, ranking 14th and 13th, respectively, among 17 member cities in Hubei. Enshi had the lowest incidence rate (less than one) with 250 confirmed cases, as shown in Figure 4B. Shennongjia only had 10 confirmed cases, far less than 100, but its incidence rate was higher than one. It can be indicated from Figure 4 that most cities adjacent to Wuhan might have greater confirmed cases and higher incidence rates. This may be attributed to the population migration from Wuhan, which can be deduced from Baidu Qianxi.
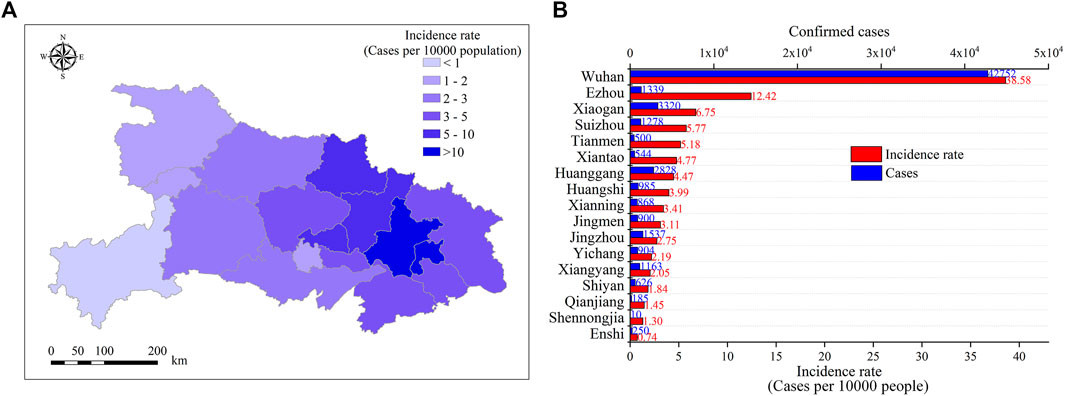
FIGURE 4. Spatial distribution of the COVID-19 incidence rate in Hubei. (A) spatial distribution; (B) the amount of COVID-19 confirmed cases and their incidence rate.
Figure 5 depicts the spatial distribution of confirmed COVID-19 cases of each county in Guangdong. The epidemic mainly occurred in the PRD region, an economically developed area, with a good flow of people and convenient transportation. Among 121 counties of Guangdong province, only Bao’an District of Shenzhen city had confirmed cases greater than 100. In addition, eight counties had confirmed cases greater than 50, including Dongguan city; Nanshan, Futian, and Longgang districts of Shenzhen; Baiyun and Haizhu districts of Guangzhou city; Zhongshan city; and Xiangzhou District of Zhuhai city. These high-risk areas were mainly distributed in the Pearl River estuaries, except for Nansha District of Guangzhou city. In this study, Dongguan and Zhongshan cities have no county administrative units. Thus, counties in Dongguan and Zhongshan cities were not considered.
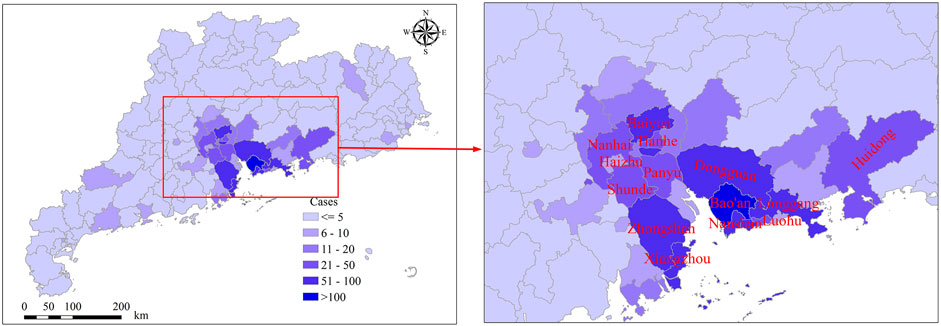
FIGURE 5. Spatial distribution of county-level COVID-19 confirmed cases in Guangdong.
To examine the spatial autocorrelation of the COVID-19 epidemic at the county level in Guangdong, the global and local Moran’s I indices were estimated using the confirmed cases of each county. Figure 6 shows that the global Moran’s I value was 0.66 with a p-value of <0.0001, indicating significant positive autocorrelation with the COVID-19 epidemic. Furthermore, the local Moran’s I values at the county level were calculated using Eq. 9; the results represented detailed local clusters and local spatial outliers in relation to confirmed cases. Figure 7 shows cluster maps identified with the local Moran’s I values and significance of p < 0.05. High–high spatial clusters were mainly concentrated in the central Guangdong Province, along the Pearl River estuaries. Out of 121 counties, 15 showed significant high–high clusters, including five counties of Shenzhen, five of Guangzhou, two of Foshan, one of Zhuhai, one of Dongguan, and one of Zhongshan. However, other counties showed no significant spatial clustering patterns, thus illustrating a spatial stochastic distribution of the COVID-19 epidemic.
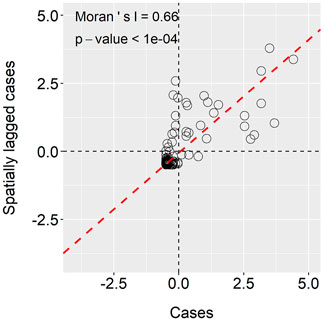
FIGURE 6. Global Moran’s I index of county-level COVID-19 confirmed cases in Guangdong.
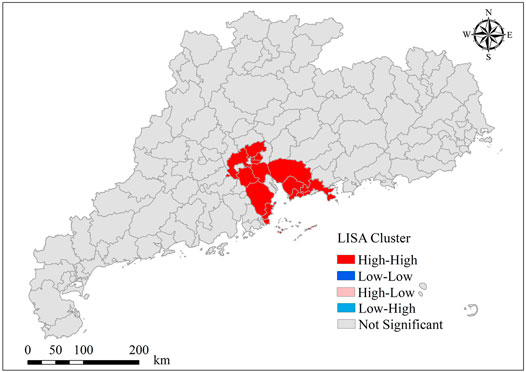
FIGURE 7. Spatial distribution of local Moran’s I at the county level in Guangdong.
Spatial Distribution of the Population Migration
Integrating the COVID-19 incidence rate of Hubei, the population migration data of Baidu Qianxi, and the resident population of Guangdong, the county-level population migration from Hubei to each county of Guangdong was calculated using Eqs 1–5. First, the possible number of COVID-19 infected migrants from each Hubei City to that of Guangdong was calculated using Eqs 1, 3, shown in Tables 2, 3, from which it can be seen that most of the infected migrants traveled from Wuhan City in Hubei into Guangdong, especially the Pearl River cities. Most of the infected migrants moved into Shenzhen, Guangzhou, Dongguan, Foshan, Zhuhai, Huizhou, and Zhongshan. Shenzhen and Guangzhou had up to 39 infected migrants, followed by Dongguan and Foshan with about 10. However, cities such as Jieyang, Maoming, Yunfu, Chaozhou, Shanwei, and Yangjiang had fewer infected migrants from Wuhan or other Hubei cities. The results may be reliable since these cities are economically underdeveloped. In general, many people would tend to migrate to developed cities with convenient transportation while some would tend to travel to the PRD and tourist cities of Guangdong over the Spring Festival. However, the results are subject to the limited population migration data; Baidu Qianxi provided data only for the top 100 cities.
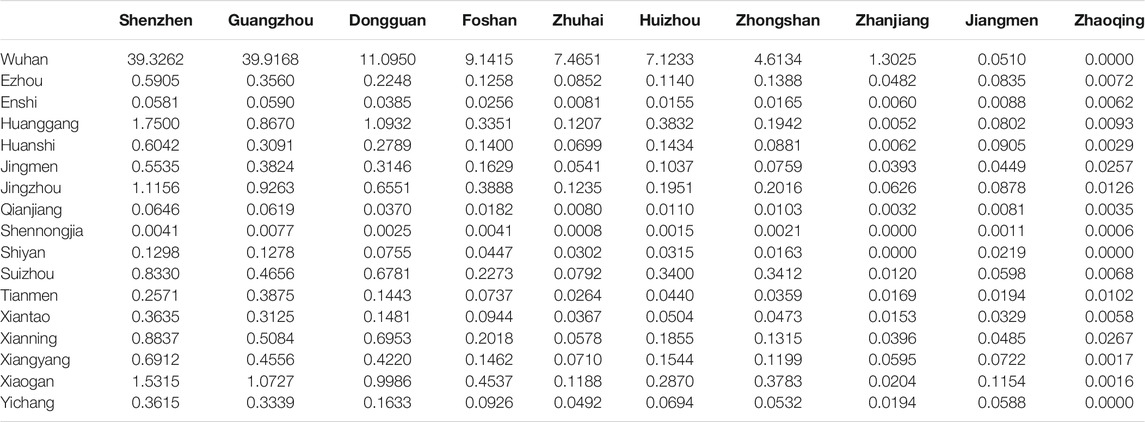
TABLE 2. COVID-19 infected migrants from each city of Hubei to that of Guangdong.
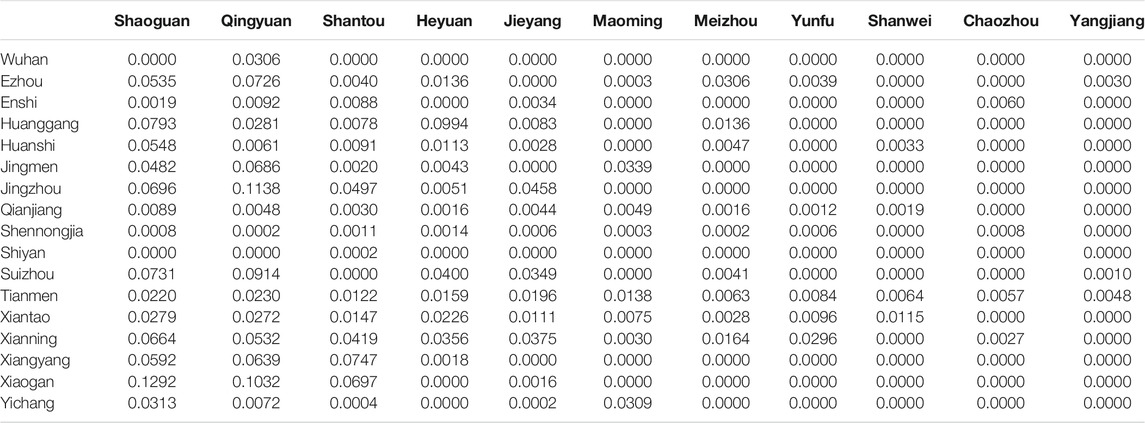
TABLE 3. Continuation to Table 2.
Then, the cumulative infected migrants from Hubei to each city of Guangdong Province were calculated using Eq. 2, as shown in Figure 8A, which showed that 4 out of 21 cities had >10 infected migrants, while 13 cities had <1. The highest number of infected migrants mainly occurred in the PRD, including Shenzhen, Guangzhou, Dongguan, Foshan, Huizhou, Zhuhai, and Zhongshan. However, Zhanjiang had 1.66 infected migrants, distant from that of the PRD, possibly as Zhanjiang is a tourist city that would attract many people during the Spring Festival.
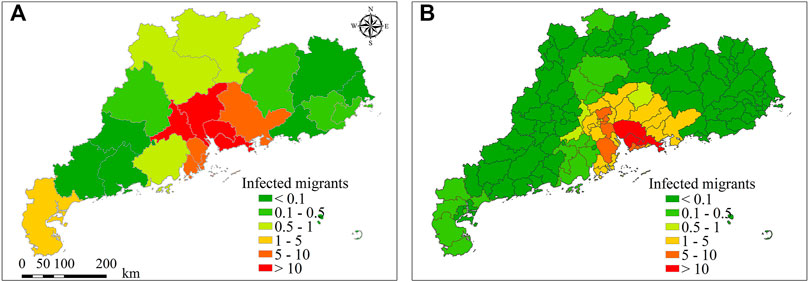
FIGURE 8. Spatial distribution of possible COVID-19 infected migrants in Guangdong at the city (A) and county (B) levels.
Figure 9 shows the relationship between confirmed COVID-19 cases and population migration at the city level; the coefficient of determination of the regressive equation between the infected migrants and confirmed cases was as high as 0.981 with statistical significance larger than that of the regressive equation between the migrants and confirmed cases. This could be as Figure 9A considered not only the Baidu Qianxi migration data but also the risk of COVID-19 infection of each Hubei City. Figure 9B estimated the number of migrants using only the Baidu Qianxi migration data and assumed identical risk of infection for each Hubei City. However, this was unreasonable. In general, a high incidence rate could represent high risk of infection, i.e., migrants from Wuhan (with the highest incidence rate) should have the highest risk of infection, while migrants from Enshi (with a low incidence rate) should have a lower risk of infection.
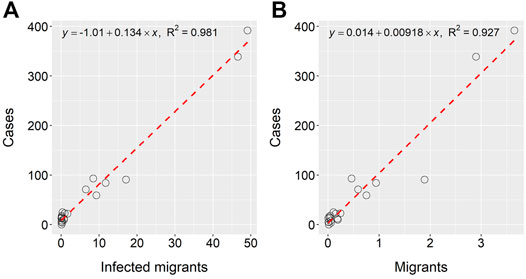
FIGURE 9. Relationship between confirmed COVID-19 cases and population migration. (A) Number of infected migrants calculated using the Baidu Qianxi migration data and incidence rate and (B) number of migrants calculated directly using the Baidu Qianxi migration data.
Last, based on city-level infected migrants and the resident population, the county-level infected migrants from Hubei to Guangdong were estimated using Eqs 4, 5. County-level infected migrants in Guangdong are shown in Figure 8B. Dongguan city and Longgang and Bao’an counties of Shenzhen city showed the largest number of infected migrants, being >13, followed by eight counties from Guangzhou and Shenzhen cities with >5 infected migrants. In summary, 29 counties (located mainly in the PRD) had >1 infected migrants, and 22 counties (mainly in eastern and southwestern Guangdong) had <0.01 infected migrants. However, due to a lack of actual population migration data between counties of Guangdong Province, shortcomings exist in calculating the number of county-level infected migrants. In the future, population migration data between counties can be accurately estimated by integrating location data from mobile phones and social media.
Related Factors Analysis
Using the geographical detector technique, the power of determinant (q) values were calculated to evaluate the intensity of factors significantly influencing COVID-19 transmission (Table 4). As shown in Table 4, the q values of these factors were ranked as follows: from the highest to the lowest: infected migrants, company, transport services, residential communities, restaurants, community facilities, and railways and each of the p values was <0.01. The results indicated that infected migrants, companies, transport services, residential communities, restaurants, and community facilities had significantly promoted the spread of the COVID-19 epidemic, among which infected migrants had the greatest impact. These spatial risk factors can predominantly help interpret the spatial heterogeneity of the epidemic in Guangdong. Railways proved to have a weak association with the epidemic. Furthermore, the q value of roadways was 0.333 with a p value > 0.05, indicating that it had no significant correlation with COVID-19 transmission. Except the infected migrant factor, the company and transport service factors showed the second and third highest explanatory power in predicting the spread risk of the epidemic, respectively. This may be reasonable that these places of companies and transport services were a place of people gathering, where these persons may be across many locations. These may increase the risk of COVID-19 transmission. The transport services, including airport, railway station, subway station, bus station, and parks, were the essential components of traffic network, where some of the infected migrants from Hubei province may across to Guangdong Province to work or travel by car, train, and plane. A small gathering with the infected patients was also unsafe for other people, who may gather at the places of residential communities, restaurants, and community facilities. This may be because that the infected patients may pass on their infection to others through direct contact or close proximity. Thus, these places also belonged to high-risk areas, which may contribute to the result that the spread risk was high in the county.

TABLE 4. Power of determinant (q) for the eight factors influencing the COVID-19 epidemic transmission.
The interaction detector was used to investigate the interactive effects of any two factors on COVID-19 transmission (Table 5). As roadway was not significantly related to COVID-19 transmission, it was not considered in this analysis. Table 5 shows that the interactive effects between any two factors were all bi-enhanced as compared to their independent influence. The geospatial risk of COVID-19 transmission was intricate and complicated by multiple spatial risk factors. According to the interaction detector analysis, we found that there were interactions between different factors. Among them, the infected migrant factor interacted strongly with the community facility factor and the company factor, and their q values were 0.895 and 0.891, respectively. This indicated that the combined effect produced by the intersecting infected migrant, community facility, and company factors had a strong explaining capacity on the COVID-19 transmission at the county level. Besides, Tables 4, 5 also demonstrated the interaction of infected migrants with restaurant, transport service, residential community, and railway factors could enhance the ability to explain the spatial distribution of the COVID-19 epidemic because they all had a high q value greater than 0.880. The places of company, restaurant, transport service, residential community, and railway were the public places of big population density and strong fluidity, which were important places for clustering transmission (Yang Z. et al., 2020). If the infected people carrying the COVID-19 virus gathered at these public places and were in close contact with other persons, which may make the healthy persons be exposed to the virus. This may result in accelerating the COVID-19 transmission. Furthermore, the combined effect produced by the intersecting railway and transport service factors may increase the explanatory power to the COVID-19 epidemic. The railway and transport services were a part of traffic network, which may increase the risk of the large-scale spread of COVID-19. Residents’ feasting, shopping, and other activities may increase the chances of contact between people, and there may be the possibility of mutual infection. Thus, to reduce the risk of COVID-19 transmission, measures such as social distancing, reducing crowds, reduce visits, and limit travel may be necessary (Hellewell et al., 2020; Linka et al., 2020; Fowler et al., 2021; Pei et al., 2021). Companies, restaurants, transport services, and other places were closely related to the spread of the virus; thus, disinfection should be carried out, and the humans should be reminded to pay attention to their own protection.
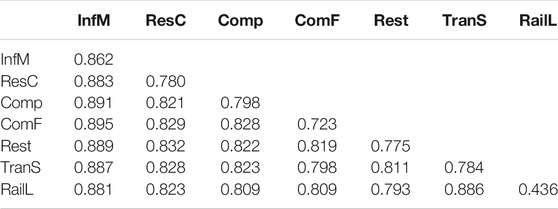
TABLE 5. Interaction among these factors on the COVID-19 epidemic transmission.
In general, this study quantitatively analyzed the spatial distribution characteristics of the COVID-19 epidemic at county scale by using a series of confirmed cases, population migration, and socioeconomic factors before the Spring Festival. The spatial risk factors of the COVID-19 epidemic were also summarized at the county level. The results showed that the regions with more community facilities, companies, and restaurants may have high-risk of COVID-19 transmission. Before the Spring Festival, although a large-scale population moved out of Guangdong to go home for the Spring Festival, most of the infected migrant population may still be back from a business trip and travel to Guangdong for the Spring Festival with their family and loved ones through Hubei. These infected migrant populations may mainly gather in companies, community facilities, and restaurants, and their high mobility also increased the chances of their contact to other persons. This may significantly increase the COVID-19 risk. These places with more community facilities and companies, where the infected migrant population have visited, should been paid close attention to and could be monitored by integrating the trajectory population-data from mobile phones and social media. However, limited by data-availability, only population migration and a few socioeconomic factors were used here, which may result in lack of in-depth research of spatiotemporal transmission mechanisms of COVID-19. Besides, the Baidu migration data may have a certain bias in the sample statistics, which may introduce potential errors in the estimation of the infected migrant population. In future, the mobile phone data will be integrated to adjust the Baidu migration data to improve the accuracy of the potential number of infected migrant population. Then, the spatiotemporal transmission process of COVID-19 and its mechanisms at county (even street) levels can be analyzed and mined by integrating spatiotemporal social, environmental, and economic data and big data of social media (Xiong et al., 2020; Zhou et al., 2020). Furthermore, to better understand the consistent relationship between the spatial risk factors and the COVID-19 epidemic situation, a more detailed spatiotemporal analysis approach may be conducted by integrating the infected population and the cross-regional migrant population.
Conclusion
This study analyzed the spatial distribution of the COVID-19 epidemic at county level in Guangdong, China, from 1 December 2019 to 17 February 2020. Our results showed that the COVID-19 epidemic had significant positive autocorrelation at county level. The high–high spatial clusters of confirmed cases were detected and mainly concentrated in the Pearl River Estuary region. Based on the incidence rate, Baidu population migration data, and the resident population, the number of county-level infected migrants of Guangdong, moving from Hubei, was calculated and analyzed. The regions with migrants from cities with high- and low-incidence rates may have high-and low-epidemic risks, respectively. Furthermore, we used the geographical detector technique to analyze the effect of potential risk factors, including infected migrants and socioeconomic factors, on the transmission of COVID-19. The results showed that the infected migrants greatly influenced the spread of COVID-19. Companies and transport services affected the spread of COVID-19 more than residential communities, restaurants, and community facilities. Although the power determinant (q) value of community facilities was small, once it was coupled with infected migrants, it significantly enhanced its influence on the transmission of COVID-19 at the county level, with the largest q (infected migrants ∩ community facility) value of 0.895. In other words, infected migrants gathered at places with more community facilities may increase the transmission risk of COVID-19.
Data Availability Statement
The original contributions presented in the study are included in the article/Supplementary Material; further inquiries can be directed to the corresponding author.
Author Contributions
Conceptualization, JX and JY; methodology, JX and JY; validation, YD; formal analysis, JX and YD; resources, WH and YY; writing—original draft preparation, JX.; writing—review and editing, YX, YL, and WJ.; funding acquisition, JX and JY.
Funding
This work was supported by the Science and Technology Program of Guangzhou (grant number 202102080286), the Key Special Project for Introduced Talents Team of Southern Marine Science and Engineering Guangdong Laboratory (Guangzhou) (grant number GML2019ZD0301), the Guangdong Innovative and Entrepreneurial Research Team Program (grant number 2016ZT06D336), the National Natural Science Foundation of China (grant number 41901330), and the GDAS’ Project of Science and Technology Development (grant number 2020GDASYL-20200103005).
Conflict of Interest
The authors declare that the research was conducted in the absence of any commercial or financial relationships that could be construed as a potential conflict of interest.
Publisher’s Note
All claims expressed in this article are solely those of the authors and do not necessarily represent those of their affiliated organizations, or those of the publisher, the editors, and the reviewers. Any product that may be evaluated in this article, or claim that may be made by its manufacturer, is not guaranteed or endorsed by the publisher.
Acknowledgments
We would like to thank the reviewers and the editor for providing valuable suggestions and comments, which have greatly improved this manuscript. We also thank the Geographical Science Data Center of the Greater Bay Area for providing the relevant data in this study.
References
Anselin, L. (2010). Local Indicators of Spatial Association-LISA. Geographical Anal. 27, 93–115. doi:10.1111/j.1538-4632.1995.tb00338.x
Anselin, L., Syabri, I., and Kho, Y. (2006). GeoDa: An Introduction to Spatial Data Analysis. Geographical Anal. 38, 5–22. doi:10.1111/j.0016-7363.2005.00671.x
Avila-Vales, E. J., and Cervantes-Pérez, Á. G. (2019). Global Stability for SIRS Epidemic Models with General Incidence Rate and Transfer from Infectious to Susceptible. Bol. Soc. Mat. Mex. 25, 637–658. doi:10.1007/s40590-018-0211-0
Cao, C., Chen, W., Zheng, S., Zhao, J., Wang, J., and Cao, W. (2016). Analysis of Spatiotemporal Characteristics of Pandemic SARS Spread in Mainland China. Biomed. Res. Int. 2016, 7247983. doi:10.1155/2016/7247983
Cao, Z., Wang, J., Gao, Y., Han, W., Feng, X., and Zeng, G. (2008). Risk Factors and Autocorrelation Characteristics on Severe Acute Respiratory Syndrome in Guangzhou. Acta Geographica Sinica 63, 981–993.
Cao, Z., Zeng, D., Zheng, X., Wang, Q., Wang, F., Wang, J., et al. (2010). Spatio-temporal Evolution of Beijing 2003 SARS Epidemic. Sci. China Earth Sci. 53, 1017–1028. doi:10.1007/s11430-010-0043-x
Chen, J. (2020). Pathogenicity and Transmissibility of 2019-nCoV-A Quick Overview and Comparison with Other Emerging Viruses. Microbes Infect. 22, 69–71. doi:10.1016/j.micinf.2020.01.004
Chen, X., Huang, Y., Li, J., Wang, S., and Pei, T. (2020a). Clustering Characteristics of COVID-19 Cases and Influencing Factors in Chongqing Municipality. Prog. Geogr. 39, 1798–1808. doi:10.18306/dlkxjz.2020.11.002
Chen, Y., Lu, P., and Chang, C. (2020b). A Time-dependent SIR Model for COVID-19. arXiv: Populations and Evolution.
Chen, Z., Zhang, Q., Lu, Y., Guo, Z., Zhang, X., Zhang, W., et al. (2020c). Distribution of the 2019-nCoV Epidemic and Correlation with Population Emigration from Wuhan. China. doi:10.1101/2020.02.10.20021824
Chinazzi, M., Davis, J. T., Ajelli, M., Gioannini, C., Litvinova, M., Merler, S., et al. (2020). The Effect of Travel Restrictions on the Spread of the 2019 Novel Coronavirus (COVID-19) Outbreak. Science 368, 395–400. doi:10.1126/science.aba9757
Cui, M., Yao, X., Fang, H., Zhang, Y., Yang, D., and Pei, T. (2021). Spatial and Temporal Transmission Differences between SARS and COVID- 19 and Analysis of Influence Factors. J. Geo- Inf. Sci. 23, 1910–1923. doi:10.12082/dqxxkx.2021.210133
Docquier, F., Golenvaux, N., and Schaus, P. (2021). Are Travel Bans the Answer to Stopping the Spread of COVID-19 Variants? Lessons from a Multi-Country SIR Model. arXiv:2112.09929v1.
Dong, E., Du, H., and Gardner, L. (2020). An Interactive Web-Based Dashboard to Track COVID-19 in Real Time. Lancet Infect. Dis. 20 (5), 533–534. doi:10.1016/S1473-3099(20)30120-1
El Deeb, O., Jalloul, M., and Jalloul, M. (2020). The Dynamics of COVID-19 Spread: Evidence from Lebanon. Math. biosciences Eng. : MBE 17, 5618–5632. doi:10.3934/mbe.2020302
El Deeb, O. (2021). Spatial Autocorrelation and the Dynamics of the Mean Center of COVID-19 Infections in Lebanon. Front. Appl. Mathematics Stat. 6, 1080. doi:10.3389/fams.2020.620064
Fowler, J. H., Hill, S. J., Levin, R., and Obradovich, N. (2021). Stay-at-home Orders Associate with Subsequent Decreases in COVID-19 Cases and Fatalities in the United States. PloS one 16, e0248849. doi:10.1371/journal.pone.0248849
Geng, X., Katul, G. G., Gerges, F., Bou-Zeid, E., Nassif, H., and Boufadel, M. C. (2021). A Kernel-Modulated SIR Model for Covid-19 Contagious Spread from County to Continent. Proc. Natl. Acad. Sci. United States America 118, e2023321118. doi:10.1073/pnas.2023321118
Gibbs, H., Liu, Y., Pearson, C. A. B., Jarvis, C. I., Grundy, C., Quilty, B. J., et al. (2020). Changing Travel Patterns in China during the Early Stages of the COVID-19 Pandemic. Nat. Commun. 11, 5012. doi:10.1038/s41467-020-18783-0
Guan, W.-j., Ni, Z.-y., Hu, Y., Liang, W.-h., Ou, C.-q., He, J.-x., et al. (2020). Clinical Characteristics of 2019 Novel Coronavirus Infection in China. medRxiv. doi:10.1101/2020.02.06.20020974
Hellewell, J., Abbott, S., Gimma, A., Bosse, N. I., Jarvis, C. I., Russell, T. W., et al. (2020). Feasibility of Controlling COVID-19 Outbreaks by Isolation of Cases and Contacts. Lancet Glob. Health 8, e488–e496. doi:10.1016/s2214-109x(20)30074-7
Hu, B., Gong, J., Zhou, J., Sun, J., Yang, L., Xia, Y., et al. (2013). Spatial-temporal Characteristics of Epidemic Spread In-Out Flow-Using SARS Epidemic in Beijing as a Case Study. Sci. China Earth Sci. 56, 1380–1397. doi:10.1007/s11430-012-4479-z
Hu, Z., Cui, Q., Han, J., Wang, X., Sha, W. E. I., and Teng, Z. (2020a). Evaluation and Prediction of the COVID-19 Variations at Different Input Population and Quarantine Strategies, a Case Study in Guangdong Province, China. Int. J. Infect. Dis. 95, 231–240. doi:10.1016/j.ijid.2020.04.010
Hu, Z., Ge, Q., Jin, L., and Xiong, M. (2020b). Artificial Intelligence Forecasting of Covid-19 in China. arXiv: Other Quantitative Biology.
Huang, C., Wang, Y., Li, X., Ren, L., Zhao, J., Hu, Y., et al. (2020a). Clinical Features of Patients Infected with 2019 Novel Coronavirus in Wuhan, China. The Lancet 395, 497–506. doi:10.1016/s0140-6736(20)30183-5
Huang, S., Peng, Z., and Jin, Z. (2020b). Studies of the Strategies for Controlling the COVID-19 Epidemic in China:Estimation of Control Efficacy and Suggestions for Policy Makers. Scientia Sinica Mathematica 50, 1.
Jin, G., Yu, J., Han, L., and Duan, S. (2020). The Impact of Traffic Isolation in Wuhan on the Spread of 2019-nCov. doi:10.1101/2020.02.04.20020438
Kim, S., and Castro, M. C. (2020). Spatiotemporal Pattern of COVID-19 and Government Response in South Korea (As of May 31, 2020). Int. J. Infect. Dis. 98, 328–333. doi:10.1016/j.ijid.2020.07.004
Kraemer, M. U. G., Yang, C.-H., Gutierrez, B., Wu, C.-H., Klein, B., Pigott, D. M., et al. (2020). The Effect of Human Mobility and Control Measures on the COVID-19 Epidemic in China. Science 368, 493–497. doi:10.1126/science.abb4218
Li, W., Zhao, S., Ji, X., and Ma, J. (2020a). Impact of Traffic Exposure and Land Use Patterns on the Risk of COVID-19 Spread at the Commnunity Level. China J. Highw. Transport 33, 43–54.
Li, X., Zhou, L., Jia, T., Wu, H., Zhou, Y., and Qin, K. (2020b). Influence of Urban Factors on the COVID-19 Epidemic: A Case Study of Wuhan City. Geomatics Inf. Sci. Wuhan Univ. 45, 826–835.
Lin, Q., Zhao, S., Gao, D., Lou, Y., Yang, S., Musa, S. S., et al. (2020). A Conceptual Model for the Coronavirus Disease 2019 (COVID-19) Outbreak in Wuhan, China with Individual Reaction and Governmental Action. Int. J. Infect. Dis. 93, 211–216. doi:10.1016/j.ijid.2020.02.058
Linka, K., Peirlinck, M., Sahli Costabal, F., and Kuhl, E. (2020). Outbreak Dynamics of COVID-19 in Europe and the Effect of Travel Restrictions. Computer Methods Biomech. Biomed. Eng. 23, 710–717. doi:10.1080/10255842.2020.1759560
Liu, T., Hu, J., Xiao, J., He, G., Kang, M., Rong, Z., et al. (2020). Time-varying Transmission Dynamics of Novel Coronavirus Pneumonia in China. bioRxiv. doi:10.1101/2020.01.25.919787
Moran, P. A. P. (1950). Notes on Continuous Stochastic Phenomena. Biometrika 37, 17–23. doi:10.1093/biomet/37.1-2.17
Pei, T., Wang, X., Song, C., Liu, Y., Huang, Q., Shu, H., et al. (2021). Review on Spatiotemporal Analysis and Modeling of COVID-19 Pandemic. J. Geo-information Sci. 23, 188–210. doi:10.12082/dqxxkx.2021.200434
Pourghasemi, H. R., Pouyan, S., Heidari, B., Farajzadeh, Z., Fallah Shamsi, S. R., Babaei, S., et al. (2020). Spatial Modeling, Risk Mapping, Change Detection, and Outbreak Trend Analysis of Coronavirus (COVID-19) in Iran (Days between February 19 and June 14, 2020). Int. J. Infect. Dis. 98, 90–108. doi:10.1016/j.ijid.2020.06.058
Reynolds, D. L., Garay, J. R., Deamond, S. L., Moran, M. K., Gold, W., and Styra, R. (2008). Understanding, Compliance and Psychological Impact of the SARS Quarantine Experience. Epidemiol. Infect. 136, 997–1007. doi:10.1017/s0950268807009156
State Council, (2020). State council. Available at: (in Chinese) http://www.gov.cn/xinwen/2020-01/23/content_5471751.htm/ (accessed January 23, 2020).
Tian, H., Liu, Y., Li, Y., Wu, C.-H., Chen, B., Kraemer, M. U. G., et al. (2020). An Investigation of Transmission Control Measures during the First 50 Days of the COVID-19 Epidemic in China. Science 368, 638–642. doi:10.1126/science.abb6105
Vaz, E. (2021). COVID-19 in Toronto: A Spatial Exploratory Analysis. Sustainability 13, 498. doi:10.3390/su13020498
Wang, J. F., Li, X. H., Christakos, G., Liao, Y. L., Zhang, T., Gu, X., et al. (2010). Geographical Detectors‐Based Health Risk Assessment and its Application in the Neural Tube Defects Study of the Heshun Region, China. Int. J. Geographical Inf. Sci. 24, 107–127. doi:10.1080/13658810802443457
Wang, J., and Xu, C. (2017). Geodetector: Principle and Prospective. Acta Geographica Sinica 72, 116–134. doi:10.11821/dlxb201701010
Wang, L., and Zhao, J. (2020). Spatiotemporal Distribution Pattern of the COVID-19 Epidemic and Geographical Detection. Acta Ecologica Sinica 40, 6788–6800.
Wang, X. (20152015). An SIRS Epidemic Model with Vital Dynamics and a Ratio-dependent Saturation Incidence Rate. Discrete Dyn. Nat. Soc. 2015, 1–9. doi:10.1155/2015/720682
Wei, S., and Wang, L. (2020). Examining the Population Flow Network in China and its Implications for Epidemic Control Based on Baidu Migration Data. Humanities Soc. Sci. Commun. 7, 509. doi:10.1057/s41599-020-00633-5
Wu, J. T., Leung, K., and Leung, G. M. (2020). Nowcasting and Forecasting the Potential Domestic and International Spread of the 2019-nCoV Outbreak Originating in Wuhan, China: a Modelling Study. The Lancet 395, 689–697. doi:10.1016/s0140-6736(20)30260-9
Wu, J., Wang, J., Meng, B., and Liu, X. (2005). Spatial Association Analysis on Epidemic of SARS in Beijing, 2003. Hangzhou: Journal of Zhejiang University Agriculture and Life Sciences.
Xia, J., Zhou, Y., Li, Z., Li, F., Yue, Y., Cheng, T., et al. (2020). COVID-19 Risk Assessment Driven by Urban Spatiotemporal Big Data: a Case Study of Guangdong-Hong Kong-Macao Greater Bay Area. Acta Geodaetica et Cartographica Sinica 49, 671–680. doi:10.11947/j.AGCS.2020.20200080
Xing, G.-R., Li, M.-T., Li, L., and Sun, G.-Q. (2020). The Impact of Population Migration on the Spread of COVID-19: A Case Study of Guangdong Province and Hunan Province in China. Front. Phys. 8, 2000398. doi:10.3389/fphy.2020.587483
Xiong, Y., Wang, Y., Chen, F., and Zhu, M. (2020). Spatial Statistics and Influencing Factors of the COVID-19 Epidemic at Both Prefecture and County Levels in Hubei Province, China. Int. J. Environ. Res. Public Health 17, 3903. doi:10.3390/ijerph17113903
Yang, H., Hu, S., Zheng, X., Wu, Y., Lin, X., Xie, L., et al. (2020a). Population Migration, Confirmed COVID-19 Cases, Pandemic Prevention, and Control: Evidence and Experiences from China. Z. Gesundh Wiss 1, 1–7. doi:10.1007/s10389-020-01403-y
Yang, H., Xu, J., Li, Y., Liang, X., Jin, Y., Chen, S., et al. (2020b). The Preliminary Analysis on the Characteristics of the Cluster for the Corona Virus Disease. Chin. J. Epidemiol. 41, 623–628. doi:10.3760/cma.j.cn112338-20200223-00153
Yang, Z., Zeng, Z., Wang, K., Wong, S.-S., Liang, W., Zanin, M., et al. (2020c). Modified SEIR and AI Prediction of the Epidemics Trend of COVID-19 in China under Public Health Interventions. J. Thorac. Dis. 12, 165–174. doi:10.21037/jtd.2020.02.64
Ye, Y., Wang, C., Zhang, H. o., Yang, J., Liu, Z., Wu, K., et al. (2020). Spatiotemporal Analysis of COVID-19 Risk in Guangdong Province Based on Population Migration. J. Geogr. Sci. 30, 1985–2001. doi:10.1007/s11442-020-1823-7
Zhang, C. H., and Schwartz, G. G. (2020). Spatial Disparities in Coronavirus Incidence and Mortality in the United States: An Ecological Analysis as of May 2020. J. Rural Health 36, 433–445. doi:10.1111/jrh.12476
Zhang, Y., Li, Y., Wang, L., Li, M., and Zhou, X. (2020). Evaluating Transmission Heterogeneity and Super-spreading Event of COVID-19 in a Metropolis of China. Int. J. Environ. Res. Public Health 17, 3705. doi:10.3390/ijerph17103705
Zhao, S., and Chen, H. (2020). Modeling the Epidemic Dynamics and Control of COVID-19 Outbreak in China. medRxiv. doi:10.1101/2020.02.27.20028639
Zhong, P., Guo, S., and Chen, T. (2020). Correlation between Travellers Departing from Wuhan before the Spring Festival and Subsequent Spread of COVID-19 to All Provinces in China. J. Trav. Med. 27, taaa036. doi:10.1093/jtm/taaa036
Zhou, C., Su, F., Pei, T., Zhang, A., Du, Y., Luo, B., et al. (2020). COVID-19: Challenges to GIS with Big Data. Geogr. Sustainability 1, 77–87. doi:10.1016/j.geosus.2020.03.005
Keywords: COVID-19, population migration, socioeconomic factors, county-scale spatial analysis, geographical detection
Citation: Xu J, Deng Y, Yang J, Huang W, Yan Y, Xie Y, Li Y and Jing W (2022) Effect of Population Migration and Socioeconomic Factors on the COVID-19 Epidemic at County Level in Guangdong, China. Front. Environ. Sci. 10:841996. doi: 10.3389/fenvs.2022.841996
Received: 23 December 2021; Accepted: 10 January 2022;
Published: 09 February 2022.
Edited by:
Marco Casazza, University of Salerno, ItalyReviewed by:
Mahsa Jahangiri-rad, Islamic Azad University, IranSuraj Kumar Singh, Gyan Vihar University, India
Omar El Deeb, Lebanese American University, Lebanon
Copyright © 2022 Xu, Deng, Yang, Huang, Yan, Xie, Li and Jing. This is an open-access article distributed under the terms of the Creative Commons Attribution License (CC BY). The use, distribution or reproduction in other forums is permitted, provided the original author(s) and the copyright owner(s) are credited and that the original publication in this journal is cited, in accordance with accepted academic practice. No use, distribution or reproduction is permitted which does not comply with these terms.
*Correspondence: Ji Yang, yangji@gdas.ac.cn