
The COVID-19 Pandemic and Overconfidence Bias: The Case of Cyclical and Defensive Sectors
by
 and
and
Md Qamar Azam
1, 
Nazia Iqbal Hashmi
2,*,
Iqbal Thonse Hawaldar
3,*,
Md Shabbir Alam
4,* and
Mirza Allim Baig
1 1
Department of Economics, Faculty of Social Sciences, Jamia Millia Islamia (A Central University), New Delhi 110025, India
2
Department of Finance, College of Business Administration, Prince Sultan University, Riyadh 66833, Saudi Arabia
3
Department of Accounting & Finance, College of Business Administration, Kingdom University, Riffa 40434, Bahrain
4
Department of Economics and Finance, College of Business Administration, University of Bahrain, Sakhir 32038, Bahrain
*
Authors to whom correspondence should be addressed.
Risks 2022, 10(3), 56; https://doi.org/10.3390/risks10030056
Submission received: 5 February 2022
/
Revised: 26 February 2022
/
Accepted: 1 March 2022
/
Published: 3 March 2022
Abstract
:This research paper analyses the impact of COVID-19 to investigate the overconfidence bias in 12 cyclical and defensive sectors in pre- and during COVID-19 periods using daily data from 1 January 2015 to 31 December 2020. The results of VAR show that in the pre COVID-19 phase overconfidence bias is more prevalent in all the cyclical sectors; in particular, MEDIA, METAL and REALTY have highly significant coefficients . In the defensive sectors, the VAR outcomes are not as strong as we expected, except for SERVICES. During the COVID-19 period, the investor shifted their focus to COVID-19-related opportunities, leading to a surge in the IT and PHARMA sectors. In both phases, METAL, MEDIA and REALTY exhibit overconfidence-driven stock trading behaviour. ENERGY is the only sector in both the phases that does not witness overconfidence bias.
1. Introduction
One of the most common behavioural anomalies is overconfidence bias. It is regarded to be a primary source of excessive trading, which results in severe fluctuation in financial markets (Abbes 2013; Gupta et al. 2018). Such disturbances produce an economic mirage, causing healthy markets to collapse, with severe repercussions for both regulators at home and abroad. These behavioural fallacies are more visible during times of high stress, instability, or crisis, such as the recent COVID-19 outbreak. On 31 December 2019, China confirmed its first ever case of coronavirus, causing a worldwide uproar (Corbet et al. 2020). The negative effect of the virus is felt over the world, leading the World Health Organisation (WHO) to declare it a pandemic on 11 March 2020.
Further, several restrictions were put into place by the different governments of the world, such as quarantine and limited mobility of the labour force, to curb the spread of the virus. This led to the slowdown of economies. Several sectors/industries were hit badly, such as automobile, aviation, realty, tourism, and health care (Mazur et al. 2021). In addition, many world economies experienced growing unemployment and shrinking GDPs (Shen et al. 2020). According to a study, India’s national unemployment rate hit its greatest level since 1991 in 2020, when the coronavirus outbreak brought the economy to a standstill (BusinessToday 2021).
During the COVID-19 pandemic, a plethora of studies have been conducted in behavioural finance, which examines the abnormal market trends, sentiment, mood and emotions of the investors (for example, Bouri et al. 2021; Chen et al. 2020; Cheema et al. 2020; Dhall and Singh 2020; Naseem et al. 2021; Salisu and Vo 2020; Shen et al. 2020; Sun et al. 2021). Some of the studies found the negative impact of COVID-19 cases and deaths on the stock market performance (Ashraf 2020; Al-Awadhi et al. 2020; Xu 2021). It has wreaked havoc on important business sectors such as automobile, real estate, services, and manufacturing, causing supply chain interruptions and mobility restrictions (Partner 2020; Mazur et al. 2021). Moreover, Górowski et al. (2022) concluded that the law implementation has had an impact on the financial health of the industries’ (gas, oil, energy and industry) assets and liabilities.
There are number of studies that have analysed the COVID-19 pandemic and overconfidence bias at the market level (Shrotryia and Kalra 2021; Phan et al. 2020; Liu et al. 2021), but the disadvantage of analysing the impact at the market level is that it assumes a homogeneous influence on sectoral performance, which indicates that COVID-19 has the same impact across all sectors. According to Narayan and Sharma (2011), sectors are heterogeneous and so react differently to market shocks. With the given gaps, we tried to answer some research questions, such as whether overconfidence bias impacts both the cyclical and defensive sectors alike; how the outbreak of COVID-19 affected the trading activity of different sectors; and whether the contemporaneous relationship between market volume and market returns differs pre and during COVID-19. Thus, this study intends to investigate the overconfidence bias in 12 major sectors of the economy both in pre- and during COVID-19 phases using vector autoregression (VAR) along with impulse response functions (IRFs) for the time period spanning from 1 January 2015 to 31 December 2020.
Our findings for cyclical and defensive sectors in the pre-COVID-19 and during COVID-19 phases are as follows: Firstly, the VAR results show that overconfidence bias is more prevalent in all the cyclical sectors; in particular, MEDIA, METAL and REALTY have highly significant coefficients in the pre-COVID-19 phase. Secondly, the relationship for the defensive sectors appears weak and insignificant except for ENERGY and PHARMA. Thirdly, during the COVID-19 period, the investor has shifted their focus to COVID-19-related opportunities, leading to a surge in the IT and PHARMA sectors. This study has relevant implications for investors, governments, and market regulators during times of market instability, such as the COVID-19 epidemic.
2. Related Literature and Hypothesis Development
In the literature, the existence of overconfidence bias is a well-known topic. According to Daniel et al. (1998), overconfident investors overstate their abilities while making an estimate.
Gender as a proxy has been used by Barber and Odean (2001) to analyse investors’ overconfidence from February 1991 to January 1997 using data of 35,000 households. The study finds that men trade 45 percent more than women. The difference between turnover and market return performance is even more noticeable between single men and single women. Moving on, Kansal and Singh (2018) and Alam and Alam (2021) find no link between the investor’s gender and overconfidence in India. Trejos et al. (2019) use a novel qualitative comparison technique to show that gender significantly impacts biased trading behaviour. Baker et al. (2017) also find that male investors are more likely to be biased than female investors (Burlea-Schiopoiu et al. 2021).
Statman et al. (2006), in a seminal work, details the testable after-effects of overconfidence-driven trade behaviour. They examine how overconfidence leads to increased trade volume using monthly data from August 1962 to December 2002. They conclude that the amount of trading rose; consequently, successful investment increases the degree of overconfidence. Furthermore, trading volume increases during a bull market and is positively correlated with prior stock returns. This supports the overconfidence hypothesis by demonstrating the lead–lag connection theory. Griffin et al. (2007) employ VAR to link present trading activity to past returns in 46 nations. They reveal that market volume and past return have a positive association. Using similar econometric modelling, Zaiane (2013) found that there is a positive association in trading volume and lag market return in the Chinese stock market. Zia et al. (2017) found a similar result in the Pakistan stock market.
Metwally and Darwish (2015), using daily data for the Egyptian stock market, found strong overconfident trading behaviour during the bullish phase, while the Tunisian and Thai stock market show no indication of overconfidence bias (Zaiane and Abaoub 2009; Phan et al. 2020). In the Indian stock market, Prosad et al. (2017) also found overconfidence bias in the Nifty 50 stocks, both at the market and security level. Moreover, Mushinada and Veluri (2018) investigated the overconfidence bias from April 2004 to March 2012 in the Bombay Stock Exchange (BSE). They discovered that overconfident investors overreact to private information and under-react to public information.
Previous studies on pandemics, for instance, the Severe Acute Respiratory Syndrome(SARS) epidemic, Ebola Virus Disease (EVD), Zika, and H1N1, as well as HIV/AIDS, have provided empirical evidence of epidemic impact, risks, and costs on the stock market (Haacker 2004; Hoffman and Silverberg 2018; Liu et al. 2020; Loh 2006; Pendell and Cho 2013). The ongoing COVID-19 pandemic has wreaked global economies, slowed stock market performance, and soured investor sentiment (Choi et al. 2020; Yarovaya et al. 2020). Alam et al. (2021) analysed the severity of the lockdown impact on the Indian stock market in the pre- and post-lockdown periods using data from BSE. The study found evidence of positive abnormal return during the lockdown period, confirming that the lockout has a favourable impact on stock market performance.
Albaity et al. (2022) found the impact of COVID-19-related cases, deaths and COVID sentiment on the stock return of the banking sector of 16 Middle Eastern and North African countries. The study found a negative impact of COVID cases and deaths, while pandemic sentiment did not have an effect. Moreover, according to Utomo and Hanggraeni (2021), the daily increase in COVID-19 confirmed cases has a negative impact on stock returns in the Indonesian stock market. Liu et al. (2021) constructed a fear index to assess the impact of COVID-19 for the Shanghai Stock Exchange (SSE). The study reveals that the higher the sentiment index value, the greater the influence of the pandemic on the stock market.
During the COVID-19 period, the stock markets exhibited different characteristics, such as fluctuation in stock prices and index values in most sectors and countries (e.g., Ashraf 2020; Baker et al. 2017; Mazur et al. 2021; Sharif et al. 2020). Shrotryia and Kalra (2021) investigated overconfidence bias in 46 global stock market indexes (developed, emerging, and frontier economies) during the pre-and post-COVID-19 periods in their work for 2014–2020 using daily data on market volume and adjusted closing prices. According to the study, the overconfidence bias is more prominent in the pre-COVID-19 period in the Japanese, United States, Chinese, and Vietnamese stock markets. It is more prevalent in the Chinese, Taiwanese, Turkish, Jordanian, and Vietnamese stock markets during the turmoil period. The most striking conclusion is that the Indian stock market stays aloof from overconfidence bias in both phases. According to Talwar et al. (2021), COVID-19 is seen as a lucrative buy opportunity by those examining financial data and news.
The pandemic also served as a blessing and provided a platform for investors to buy the rising stocks. Mazur et al. (2021) used data from US financial market during March 2020 assess the impact on sectoral analysis caused by COVID-19. They found that stock prices in the food, natural gas, technology and healthcare industries have surged. According to them, the losers’ stocks have much asymmetric volatility. Using an event study method, Alam et al. (2020) analysed the impact of eight sectors of the Australian stock market. The results reveal that due to the announcement of the COVID-19 date in Australia, the indices of sectors such as food, pharmaceuticals and healthcare exhibit positive returns. Moreover, satisfactory performance is shown by telecommunications, pharmaceuticals and healthcare, while the transportation industry demonstrates bad performance. Kuranchie-Pong and Forson (2021) employs Granger Causality to test the presence of overconfidence bias in pre- and during COVID-19 pandemic periods in Ghana Stock Exchange (GSE). The findings show that there is an overconfidence bias in GSE during the COVID-19 phase, which contributes to excessive volatility.
It has also lowered investor overconfident in the stock market (Liu et al. 2020). Baek et al. (2020) used the Markov Switching AR (1) model to investigate the influence of COVID-19 on stock market volatility in the United States for thirty main industries. The results show that industries such as petroleum and natural gas, restaurants, and hotels face greater risk during the COVID-19 period, but industries such as food production, beer, and liquor face smaller or minimum changes. Despite the significance of overconfidence bias and its impact on trading volume, market return and volatility, empirical research on numerous sectors (cyclical and defensive) for the overconfidence bias is scarce in the Indian equity market, making it difficult to diagnose the implications and link such trade with overconfidence bias. Therefore, the hypotheses of the research are as follows:
Hypothesis 1:
There is significant observed overconfidence bias in the cyclical and defensive sector during the regular (pre-COVID-19) period.
Hypothesis 2:
There is significant observed overconfidence bias in the cyclical and defensive sectors during the COVID-19 period.
3. Materials and Methods
3.1. Data
To examine the overconfidence bias, this study uses daily data on variables such as market volume, return and volatility for the study period: 1 January 2015–31 December 2020. The data are obtained from the official NSE website. The sectoral indices of NSE depict the collective performance of stocks in the respective sectoral index. The sectoral indices are classified into cyclical and defensive sectors, as per the Morgan Stanley Capital International (MSCI) list (November 2018). Table A1 (see Appendix A) shows the sample for the study, which includes the industry index with their industry name and the number of firms that make up the industry index. Thus, we have 8 cyclical sectors (AUTO, BANK, FIN, IT, MEDIA, METAL, REALTY and INFRA) and 4 defensive sectors (FMCG, PHARMA, ENERGY and SERVICES).
The WHO declared COVID-19 a pandemic on 11 March 2020. According to the report released from the Ministry of Health and Family Welfare, Government of India, the first positive case of COVID-19 was found on 30 January 2020, (Narasimhan 2020). Furthermore, there are no market shocks prior to COVID-19, such as a worldwide collapse or a sovereign debt crisis. Moreover, the government is stable, meaning that it is a good moment to examine the impact of overconfidence bias and COVID-19 and differentiate the results from a pandemic scenario. The two subsamples are as follows:
- 1
- Pre-COVID-19 phase: 1 January 2015 to 29 January 2020.
- 2
- COVID-19 phase: 30 January 2020 to 31 December 2020.
The daily market return is the log difference of today and the previous day’s closing prices (Shrotryia and Kalra 2021).
where is index return on day, is closing price on day, and is closing price on day .
The natural log of volume has been taken as market volume In addition, market volatility is used as a control variable (Karpoff 1987). In the financial market, it is considered a measurement of risk. It is calculated from the daily high and low index values (Prosad et al. 2017).
3.2. The Model
Statman et al.’s (2006) methodology is employed to test the overconfidence bias in the chosen industry indices. The lead–lag relationship between lagged observed returns and current trading volume is the basis of this methodology. The endogeneity problem is addressed in this approach by allowing the two different endogenous variables to interact with one another.
The current VAR model depicts how one endogenous variable is a function of past values of itself, other endogenous variables, and residual term after controlling for the exogenous variable (volatility). Controlling for volatility further adds to the significance of the return–turnover relationship (Griffin et al. 2007). Finally, the following bivariate VAR model is presented below:
where is an n×l vector of endogenous variables—market volume and market return—in time interval t, and is an exogenous variable (market volatility); and are the coefficients of endogenous and exogenous variables, respectively. is a residual term at day t. The relationship of endogenous variables over time is shown through the impulse response function (Hamilton 1994). Moreover, it graphically explains the impact of one variable on another; it becomes a useful tool to examine the empirical causal analysis. Therefore, Equation (1) is written in expanded form for our study as:
Equation (2) explains that the change in residuals t impacts the current value of market volume and market returns and affects the future value. Similar interpretation runs for other variables. Thus, to test the market prediction of the overconfidence hypothesis, we give one standard deviation shock to the residual of market returns to notice the response in market turnover over time t. Akaike Information Criteria (AIC) is used to determine the optimal lag length (K). Then, for each of the sectors, individual VAR is estimated.
4. Results
4.1. Descriptive Statistics
The descriptive statistics for the pre-COVID-19 and during COVID-19 periods are shown in Table 1. All relevant series are stationary at the level for all sectors, according to the ADF test. The stationary test is not reported due to brevity purpose. As a result, we can employ the unrestricted VAR model rather than the vector error correction model (VECM).In the pre-COVID-19 period, the FIN sector has the greatest average market return of 0.001 and 0.002 for PHARMA, and IT has highest average return, respectively, in the COVID-19 period. It is also worth noting that, during the COVID-19 phase, all sectors have positive mean returns. In the pre-COVID and COVID-19 periods, the REALTY sector has the largest return deviation (0.018) with an average volatility of 0.023, whereas the banking sector has the largest return deviation (0.029) with a mean volatility of 0.031. From Table 1, it is seen that the market return distributions are skewed and heavily dispersed, with kurtosis values greater than 3.
4.2. Pre-COVID-19: VAR and IRFs
Table 2 shows the pre-COVID-19 coefficients for cyclical and defensive sectors, respectively. The statistical significance is provided at 1, 5, and 10%, respectively. The market trading volume is autocorrelated with itself. All the sectors show the largest coefficient values at the initial lag and then decreasing coefficient values as the lags increases. However, during the first lag, the REALTY sector has the largest autocorrelation coefficient (t-value = 18.152). Furthermore, the market volume shows a positive serial correlation in industries such as FMCG, INFRA, METAL, PHARMA, and SERVICES; however, it shows a declining trend in the other sectors.
For most lags, as seen from the Table 2, there is a positive relationship between the market volume and the market return. This contemporaneous relationship, on the other hand, is found to be significant for AUTO (lags = 1 and 2 days), BANK (lags = 1, 2 and 5 days), FIN (lags = 1 and 2 days), FMCG (lags = 1 and 13 days), INFRA (lags = 2 and 7 days), IT (lags = 1, 2, 5 and 14 days), MEDIA (lags = 1, 3, 4, 6, 8 and 11 days), and for METAL (lags = 1, 2, 3 and 7 days). This supports the hypothesis that there is a lead–lag relationship between volume and return, indicating excessive trading by the investors. For defensive sectors, ENERGY and PHARMA, the coefficient values for these sectors are statistically insignificant; therefore, they do not reveal overconfident trading behaviour, and SERVICES coefficients at lags = 2, 5, and 11 days are significant, explaining overconfident trading behaviour in the pre-COVID-19 phase, respectively. Among all the cyclical sectors, MEDIA, METAL AND REALTY sector coefficient values are highly significant because investors are optimistic about the rise in market return and showing interest in these sectors (Table 2). Further, there is a positive correlation between trading volume and market volatility for all the sectors in the study (Statman et al. 2006).
As a whole, VAR findings suggest that overconfidence bias is more prevalent in all the cyclical sectors, particularly MEDIA, METAL and REALTY, which have highly significant coefficients in the pre period. In the defensive sectors, the VAR outcomes are not as strong as we expected, except for SERVICES. We also found that the investors are underconfident concerning investing in the FMCG (t-value = −1.652) sector at the third lag. This can highlight that the defensive sectors may not provide adequate liquidity to enable investors’ fast and exorbitant trading. Another possible explanation includes exhibiting lower volatility resulting in low return and lower trading cost because the businesses of defensive sectors are not much dependent on economic activities.
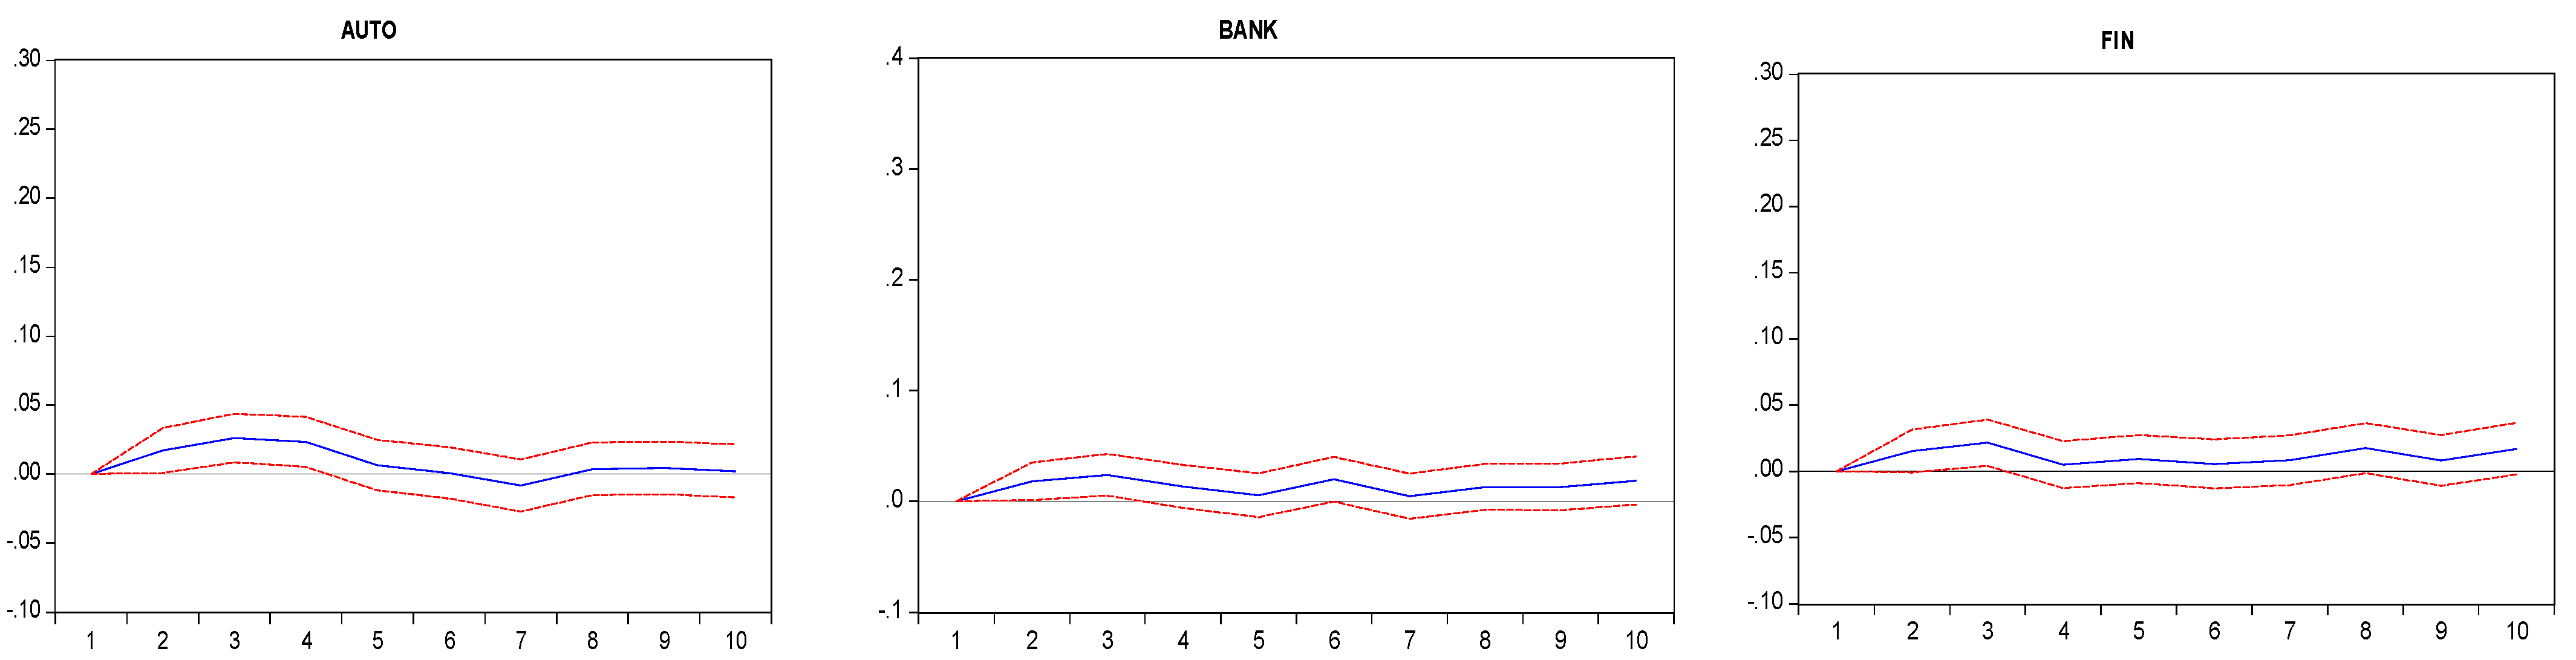
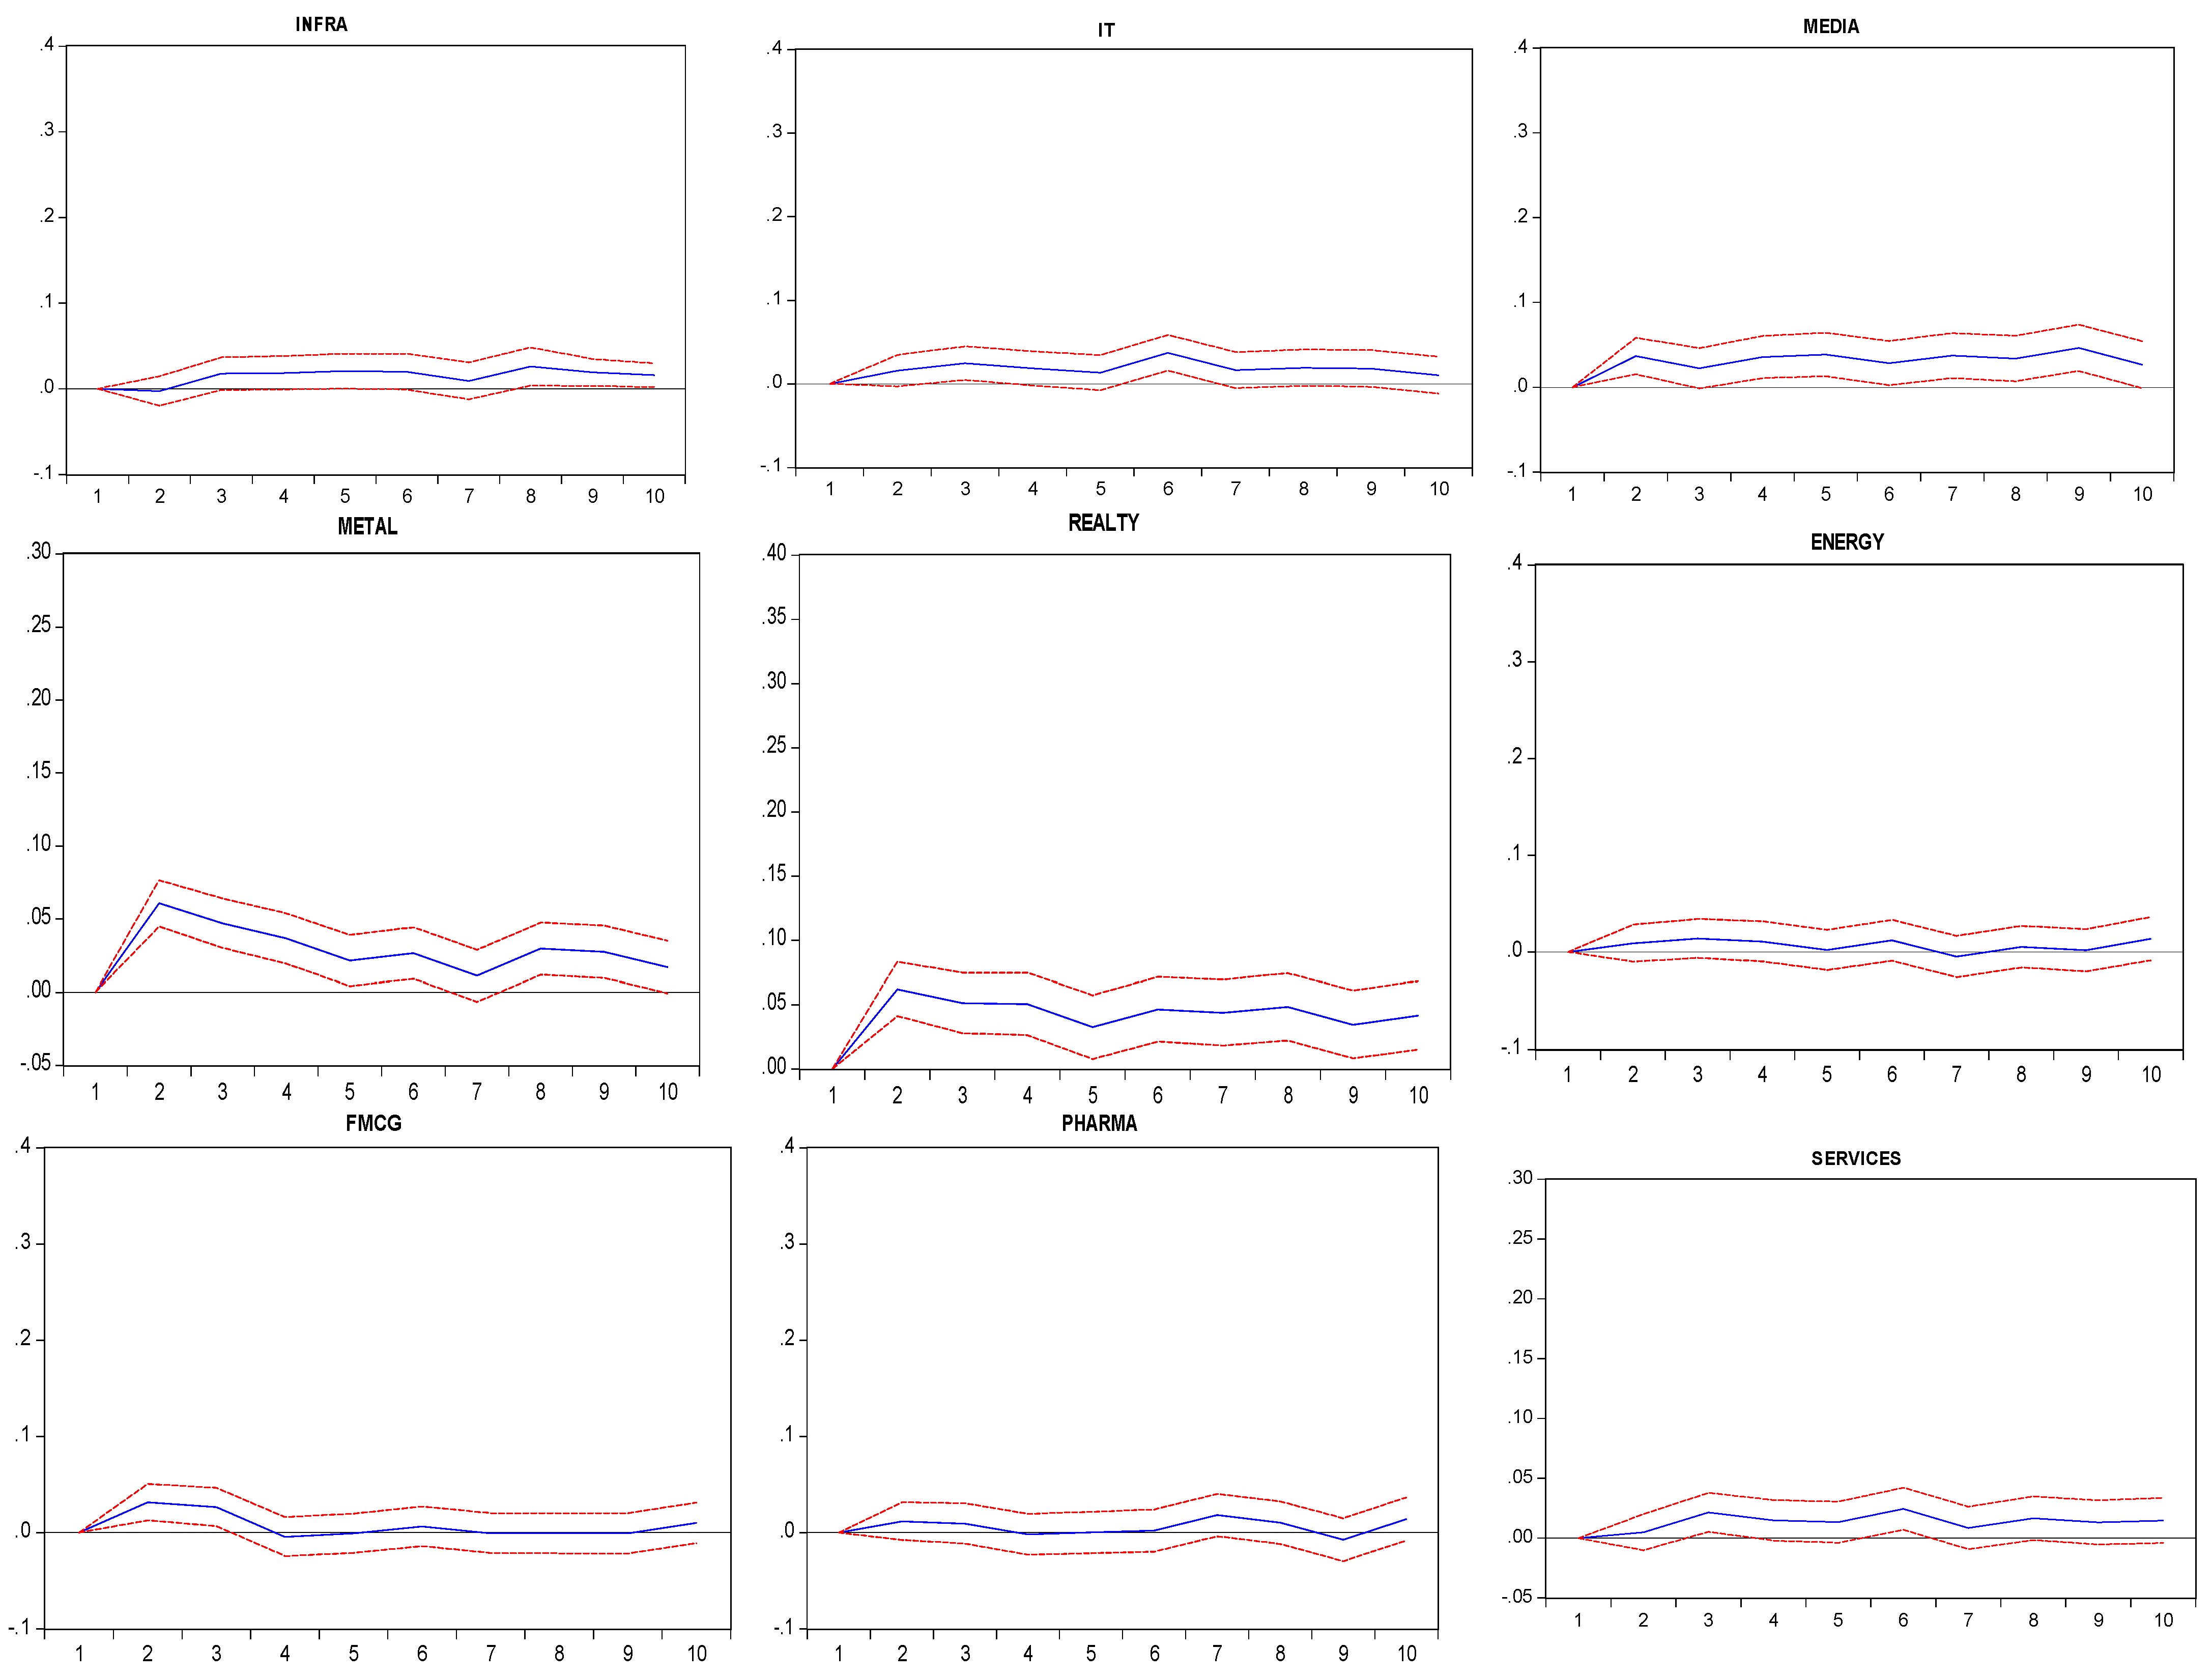
Moving forward, IRFs (Figure 1) have been plotted for 10 days for all the sectors to best gauge the overconfident trading. Here, Figure 1 only depicts the market volume responses to market return shocks only for brevity purposes. It shows that one standard deviation (SD) in market return shock leads to an increase in volume of 0.017, 0.026, 0.018, 0.024, 0.009, 0.014, 0.015, 0.022, 0.032, 0.027, 0.016, 0.025, 0.037, 0.022, 0.061, 0.047, 0.012, 0.009, 0.062, 0.051, 0.005 and 0.022% in the subsequent two days for AUTO, BANK, ENERGY, FIN, FMCG, IT, MEDIA, METAL, PHARMA, REALTY and SERVICES. The response of market volume at the first day to market return shock is not visible since the values are close to zeroes. Furthermore, for some sectors, the positive impulse responses remain over the course of 10 days (BANK, FIN, IT, MEDIA, METAL, REALTY and SERVICES). The MEDIA sector received the highest cumulative response of 0.306%, followed by the METAL sector 0.277%.
4.3. COVID-19: VAR and IRFs
The COVID-19 VAR estimation for cyclical and defensive sectors is shown in Table 3 The market volume is autocorrelated with itself for all the sectors. In addition, the relationship in volume–volatility documented in literature holds true in most cases. In the case of cyclical sectors, the VAR holds significantly positive for the automobile, banking and media sectors (lags = 1 day), FIN (lags = 1, 2, 3 and 6 days), IT (lags= 1, 2 and 5 days), Metal (lags = 1 and 2 days) and realty sectors (lags = 1 and 2 days). ENERGY is the only sector witnessing no overconfidence bias in the defensive sectors. FMCG exhibits low significant value at the 5th lags and at the 9th lag shows the underconfident trading behaviour of the investors. PHARMA sees noticeable overconfidence-driven stock trading at lags = 1 and 2 days, which are highly significant, and SERVICES (lags = 6 day) is found to be weak with low a coefficient value significant at 10%.
Overall, the investor has shifted their focus to COVID-19-related opportunities, leading to a surge in the IT and PHARMA sectors. One of the main reasons for investing in pharmaceutical industries is that most of the stock in the PHARMA sector gave positive returns during 2020, as it was characterised as essential services, meaning lesser disruptions caused during the lockdown period. In the case of the IT sector, the adoption of digital technologies during the COVID-19 surge led to the increase in market return.
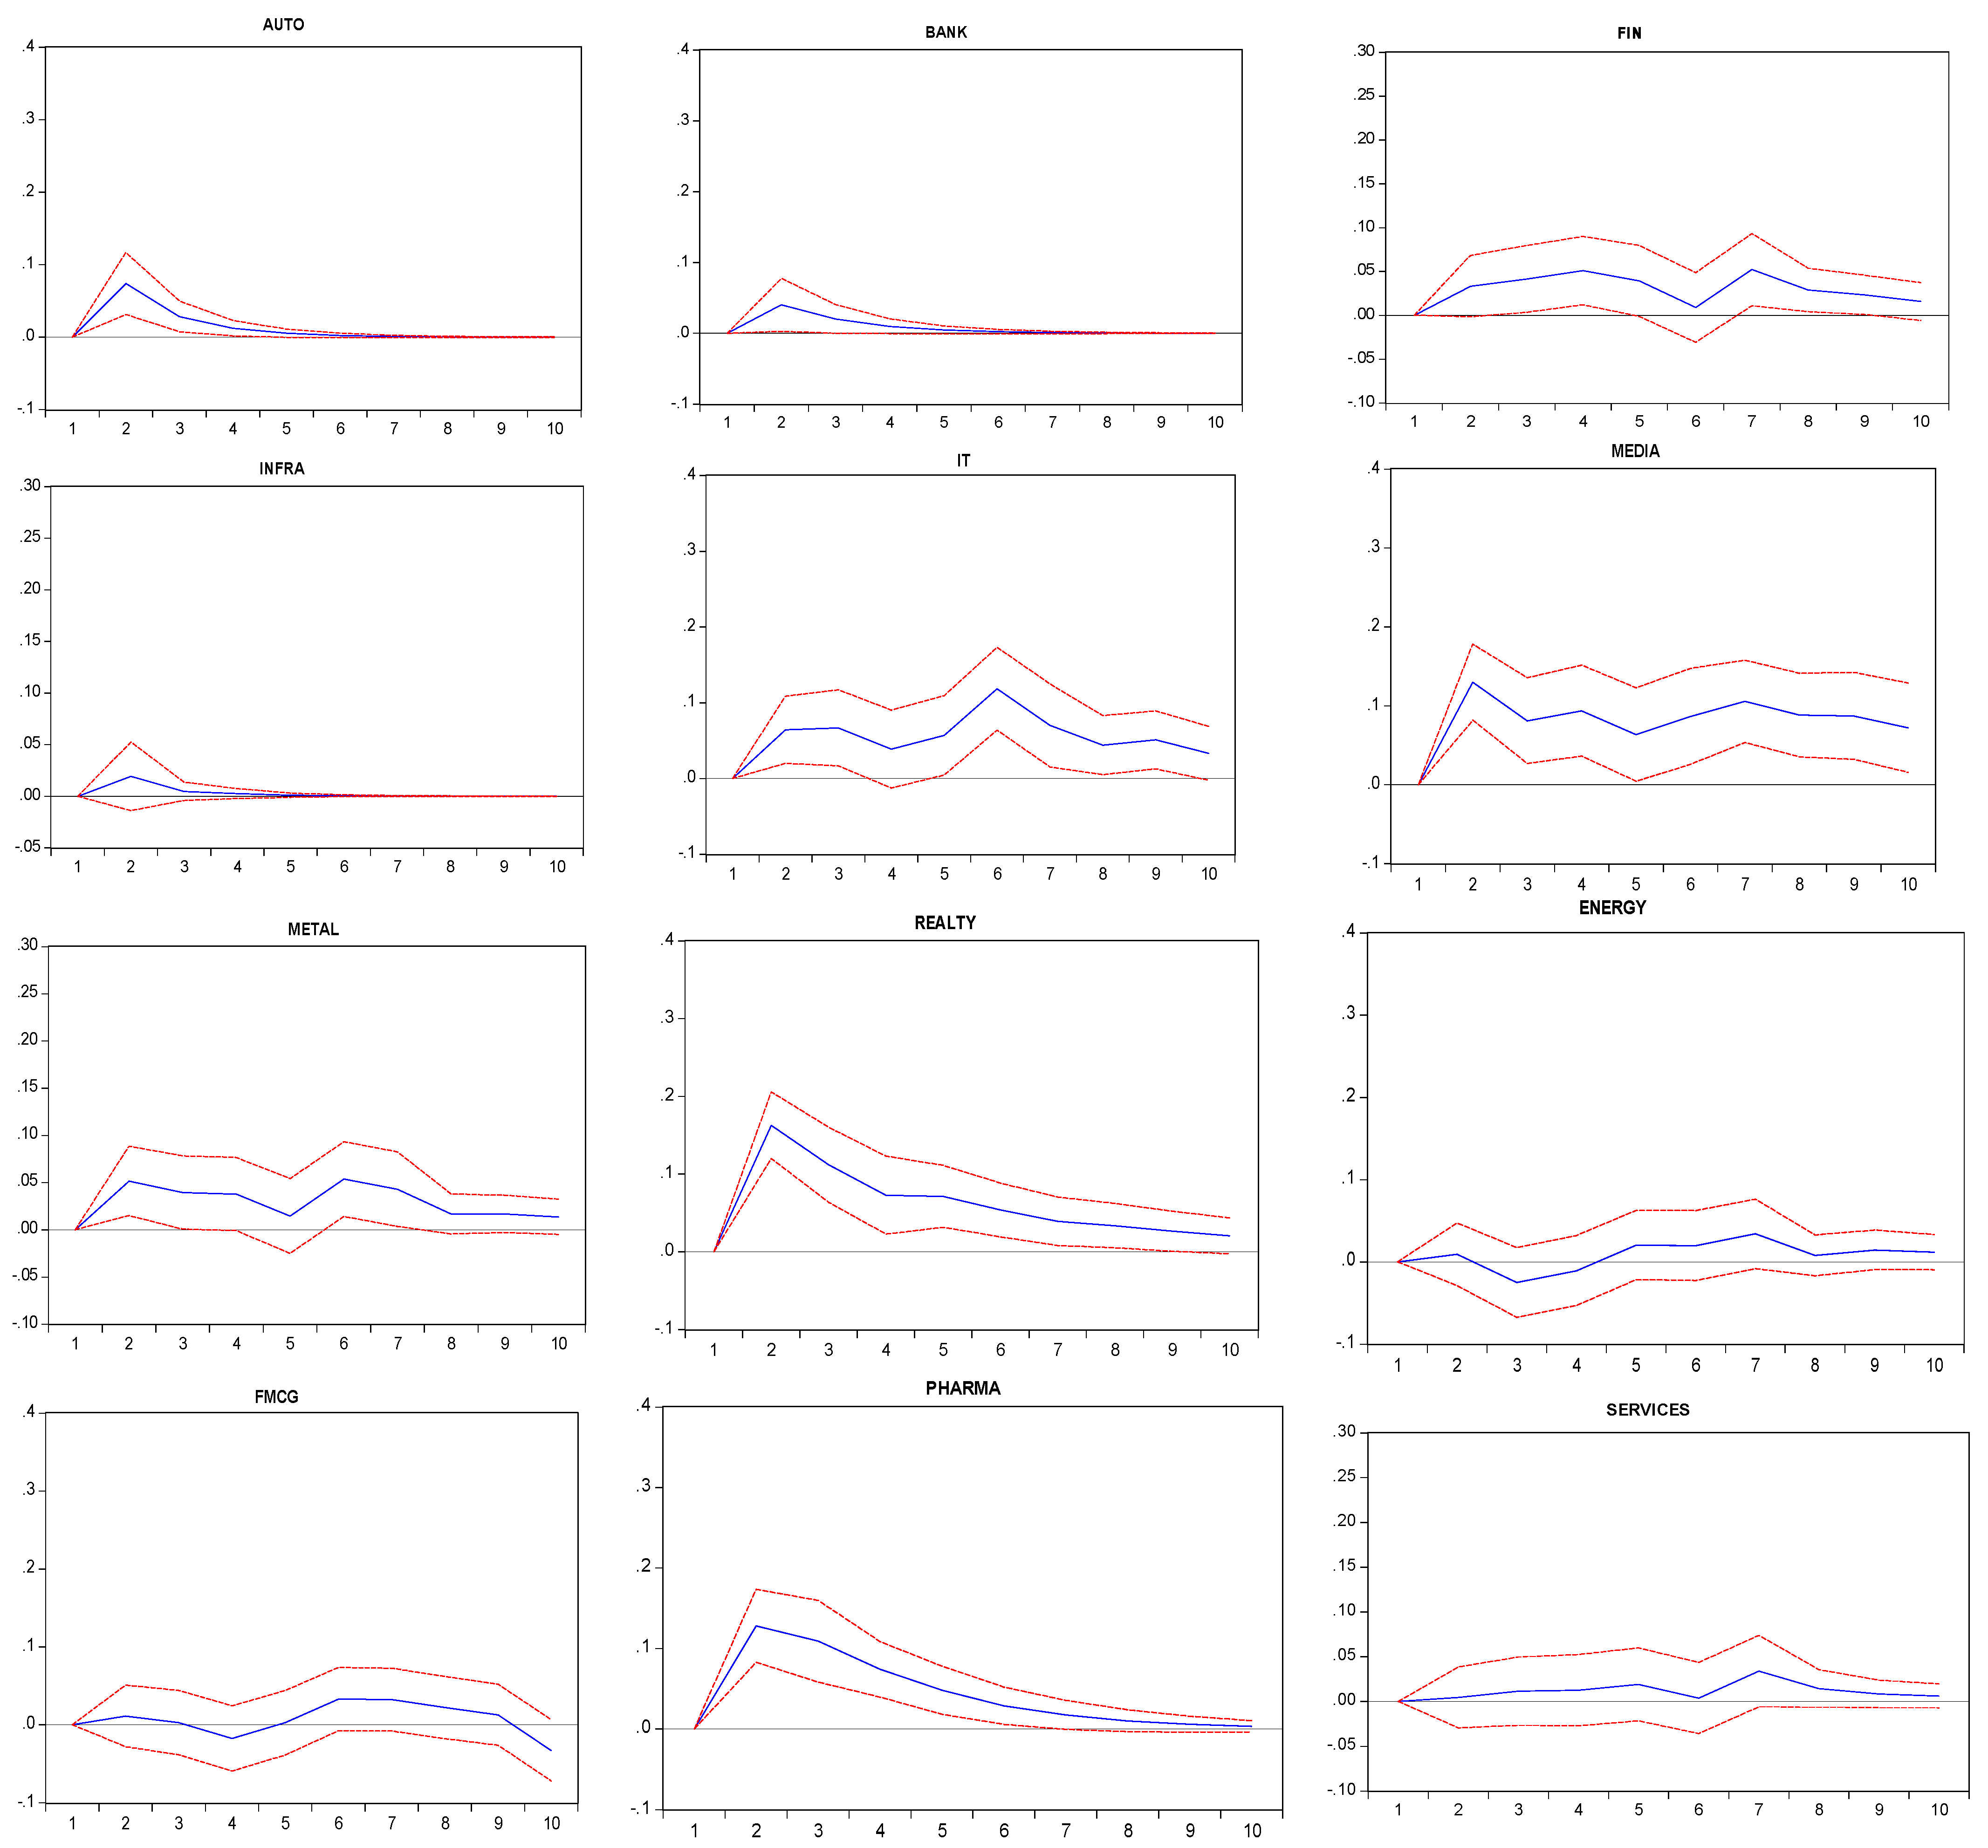
The IRFs have been plotted for all the sectors during the COVID-19 period (Figure 2). This demonstrates that for 1SD in market return, market volume increases by 0.074, 0.028, 0.040, 0.020, 0.033,0.042, 0.064, 0.067, 0.130, 0.081, 0.052, 0.039, 0.128, 0.109, 0.163, and 0.112% for AUTO, BANK, FIN, IT, MEDIA, METAL, PHARMA and REALTY, respectively, in the subsequent 2 days. It is also observed that market return shocks bring out a negative response in market volume for the energy sector on the third and fourth days, and it is declining for infrastructure for all the 10 days. The largest accumulated responses have been recorded for media (0.808%), followed by the realty sector (0.591%). The responses have been recorded as the lowest for infrastructure (0.028%) and energy (0.081%).
5. Policy Implications
This study is significant for investors, governments, and market regulators during times of market instability, such as the COVID-19 pandemic. The role of overconfidence bias in stock selection must be considered for fair appraisal of financial assets. Individual investors can make more informed and effective financial decisions in the face of the COVID-19 pandemic if they are aware of overconfidence behaviour at the industry level. This is because over confidence amongst investors encourages investing in more risky assets that give more return, which may fuel the market volatility. This study provides investors with easily accessible and quality information in the selection of risky assets (cyclical sector).
The COVID-19 pandemic poses a considerable crisis to the health market, including the pharmaceutical sector; identifying this effect may guide policymakers in making informed planning to overcome the challenges. Money managers should educate investors on how to hold a well-diversified portfolio to reduce transaction costs and risk in the long run. To build positive industry sentiments, the government should provide relief to various worst-affected industries in tax benefits and try to strengthen market conditions. In addition, certain policy measures, such as quantitative easing and reductions in margin requirements may be implemented to ensure a consistent money supply, boosting consumption and investment.
6. Conclusions
The primary objective of this paper was to delve into the overconfidence bias of cyclical and defensive sectors, during regular and pandemic periods.
Using VAR and IRFs, we show that there is a relationship between market return and volume for all the cyclical sectors in the pre-COVID-19 era because the relevant coefficients are positive and significant for most lagged market returns. MEDIA, METAL and REALTY exhibit higher significant coefficients among cyclical sectors, and we do not find any significant coefficients for the ENERGY and PHARMA sectors, which are part of defensive sectors in the pre-COVID-19 period. In the COVID-19 period, all the cyclical sectors exhibit overconfident trading behaviour, except INFRA. In the case of defensive sectors, overconfidence of the investors is more pronounced in the PHARMA sector. ENERGY is the only sector that stays unaffected from overconfidence bias in both the periods.
These findings could indicate that some cyclical and defensive sectors have a disposition effect, in addition to overconfidence bias (or optimism).This suggests that behavioural finance can explain the abnormal market behaviours produced by the current outbreak in the Indian stock market. Similar results have been shown in the US market (Statman et al. 2006) at the market level. Similar to Mushinada and Veluri (2018) and Prosad et al. (2017), the current findings imply the presence of an overconfidence bias in the Indian equity market.
The current pandemic provided an opportunity for some sectors to grow and prosper while being disastrous to some industries. The pharmaceutical companies in the defensive sector and infrastructure in the cyclical sector see uptrend and downtrend movement in their market volume, respectively. COVID-19 provided a significant opportunity for the Indian pharmaceutical industry to generate short-term profit due to the recent rise in the price and share of imports from China and the pick-up in demand for COVID-19 drugs.
The sector had shown resilience in the face of numerous economic shocks, as evidenced by India’s more than 18% increase in pharmaceutical exports during 2020–2021, a pandemic-hit year when world output and trade dropped (Business Standard 2021). According to a study by Moody’s Investors Service, India’s first and second coronavirus waves caused varying degrees of damage to the country’s infrastructure sectors and underperformance in the market due to a decline in volume (Beniwal 2021). According to an analysis by the Statistics Ministry, construction of everything from roads to ports was three and a half years behind schedule.
The current study explores only one pandemic to investigate the overconfidence bias. However, the other bias-like disposition effect and herding bias should be examined for all the sectors to make the findings more robust. Moreover, this research should be extended by examining other pandemics, such as SARS and EVD.
Author Contributions
Conceptualization, M.Q.A. and M.A.B.; methodology, M.Q.A. and M.A.B.; software, I.T.H. and M.A.B.; validation, M.Q.A. and M.A.B.; formal analysis, M.Q.A. and M.A.B.; investigation, M.Q.A. and M.A.B.; resources, M.S.A.; data curation, M.S.A.; writing-original draft preparation, M.Q.A.; writing-review and editing, M.S.A. and N.I.H.; visualization, I.T.H. and M.A.B.; supervision, M.S.A. and M.A.B.; project administration, M.S.A. and N.I.H.; funding acquisition, I.T.H. and N.I.H. All authors have read and agreed to the published version of the manuscript.
Funding
This research received no external funding.
Institutional Review Board Statement
Not applicable.
Informed Consent Statement
Not applicable.
Data Availability Statement
The datasets used and analyzed during the current study are available by the corresponding authors on reasonable request.
Conflicts of Interest
The authors declare no conflict of interest.
Appendix A

Table A1.
Sectoral Indices of NSE.
| Indices | Industry/Sector | Abbreviations | N |
|---|---|---|---|
| Nifty Auto Index | Automobile | AUTO | 15 |
| Nifty Bank Index | Banking | BANK | 12 |
| Nifty Financial Services Index | Financial services | FIN | 20 |
| Nifty FMCG Index | Fast-moving consumer goods | FMCG | 15 |
| Nifty IT Index | Information technology | IT | 10 |
| Nifty Media Index | Media and entertainment | MEDIA | 14 |
| Nifty Metal Index | Metal | METAL | 15 |
| Nifty Pharma Index | Pharmaceutical | PHARMA | 10 |
| Nifty Realty Index | Real estate | REALTY | 10 |
| Nifty Energy Index | Energy | ENERGY | 10 |
| Nifty Services Index | Services | SERVICES | 30 |
| Nifty Infra Index | Infrastructure | INFRA | 30 |
Source: Obtained from NSE website. N: Represents the number of companies in the constituents in an index.
References
- Abbes, Mouna Boujelbène. 2013. Does Overconfidence Bias Explain Volatility During the Global Financial Crisis? Transition Studies Review 19: 291–312. [Google Scholar] [CrossRef]
- Alam, Md Mahmudul, Haitian Wei, and Abu NM Wahid. 2021. COVID-19 outbreak and sectoral performance of the Australian stock market: An event study analysis. Australian Economic Papers 60: 482–95. [Google Scholar] [CrossRef] [PubMed]
- Alam, Md Qaiser, and Md Shabbir Alam. 2021. Financial development, economic growth, and poverty reduction in India. Etikonomi: Jurnal Ekonomi 20: 13–22. [Google Scholar] [CrossRef]
- Alam, Mohammad Noor, Md Shabbir Alam, and Kavita Chavali. 2020. Stock market response during COVID-19 lockdown period in India: An event study. The Journal of Asian Finance, Economics, and Business 7: 131–37. [Google Scholar] [CrossRef]
- Al-Awadhi, Abdullah, Khaled Alsaifi, Ahmad Al-Awadhi, and Salah Alhammadi. 2020. Death and contagious infectious diseases: Impact of the COVID-19 virus on stock market returns. Journal of Behavioral and Experimental Finance 27: 1–8. [Google Scholar] [CrossRef]
- Albaity, Mohamed, Ray Saadaoui Mallek, and Hasan Mustafa. 2022. Bank Stock Return Reactions to the COVID-19 Pandemic: The Role of Investor Sentiment in MENA Countries. Risks 10: 43. [Google Scholar] [CrossRef]
- Ashraf, Badar Nadeem. 2020. Stock markets’ reaction to COVID-19: Cases or fatalities? Research in International Business and Finance 54: 1–7. [Google Scholar] [CrossRef]
- Baek, Seungho, Sunil K. Mohanty, and Mina Glambosky. 2020. COVID-19 and stock market volatility: An industry level analysis. Finance Research Letters 37: 101748. [Google Scholar] [CrossRef]
- Baker, H. Kent, Greg Filbeck, and Victor Ricciardi. 2017. Chapter 1: Financial behavior: An overview. In Financial Behavior: Players, Services, Products, and Markets. New York: Oxford University Press. [Google Scholar]
- Barber, Brad M., and Terrance Odean. 2001. Boys will be boys: Gender, overconfidence, and common stock investment. Quarterly Journal of Economics 116: 261–92. [Google Scholar]
- Beniwal, Vrishti. 2021. Covid deepens Indian infra sector’s troubles, flagship projects among casualties. The Economic Times, July 31. [Google Scholar]
- Bouri, Elie, Riza Demirer, Rangan Gupta, and Jacobus Nel. 2021. COVID-19 pandemic and investor herding in international stock markets. Risks 9: 168. [Google Scholar] [CrossRef]
- Burlea-Schiopoiu, Adriana, Simina Brostescu, and Liviu Popescu. 2021. The Impact of Foreign Direct Investment on the Economic Development of Emerging Countries of the European Union. International Journal of Finance and Economics. Available online: https://onlinelibrary.wiley.com/doi/10.1002/ijfe.2530 (accessed on 25 February 2022). [CrossRef]
- Business Standard. 2021. India’s Pharma Market Rebounds in April, Clocks. Available online: https://www.business-standard.com/article/companies/india-s-pharma-market-rebounds-in-april-clocks-51-5-sales-growth-121050701414_ (accessed on 21 May 2021).
- BusinessToday. 2021. India’s Unemployment in 2020 at Worst Level in 29 Years, Shows Study. BusinessToday. 2020–2021. Available online: https://www.businesstoday.in/sectors/jobs/india-unemployment-in-2020-at-worst-level-in-29-years-shows-study/story/440262.html (accessed on 25 September 2021).
- Cheema, Muhammad A., Yimei Man, and Kenneth R. Szulczyk. 2020. Does investor sentiment predict the near-term returns of the Chinese stock market? International Review of Finance 20: 225–33. [Google Scholar] [CrossRef]
- Chen, Conghui, Lanlan Liu, and Ningru Zhao. 2020. Fear Sentiment, Uncertainty, and Bitcoin Price Dynamics: The Case of COVID-19. Emerging Markets Finance and Trade 56: 2298–309. [Google Scholar] [CrossRef]
- Choi, Yukyung, Glenn Levine, and Samuel W. Malone. 2020. The Coronavirus (COVID-19) Pandemic: Assessing the Impact on Corporate Credit Risk. Moody’s Analytics. pp. 1–17. Available online: https://www.moodysanalytics.com/articles/2020/coronavirus-assessing-the-impact-on-corporate-credit-risk (accessed on 4 February 2022).
- Corbet, Shaen, Charles Larkin, and Brian Lucey. 2020. The contagion effects of the COVID-19 pandemic: Evidencefrom gold and cryptocurrencies. Finance Research Letters 35: 101–554. [Google Scholar] [CrossRef]
- Daniel, Kent, David Hirshleifer, and Avanidhar Subrahmanyam. 1998. Investor psychology and security market under- and overreactions. Journal of Finance 53: 1839–85. [Google Scholar] [CrossRef] [Green Version]
- Dhall, Rosy, and Bhanwar Singh. 2020. The COVID-19 Pandemic and Herding Behaviour: Evidence from India’s Stock Market. Millennial Asia 11: 366–90. [Google Scholar] [CrossRef]
- Górowski, Ireneusz, Bartosz Kurek, and Marek Szarucki. 2022. The Impact of a New Accounting Standard on Assets, Liabilities and Leverage of Companies: Evidence from Energy Industry. Energies 15: 1293. [Google Scholar] [CrossRef]
- Griffin, John M., Federico Nardari, and René M. Stulz. 2007. Do investors trade more when stocks have performed well? evidence from 46 countries. Review of Financial Studies 20: 905–51. [Google Scholar] [CrossRef]
- Gupta, Suman, Vinay Goyal, Vinay Kumar Kalakbandi, and Sankarshan Basu. 2018. Overconfidence, trading volume and liquidity effect in Asia’s Giants: Evidence from pre-, during- and post-global recession. Decision 45: 235–57. [Google Scholar] [CrossRef]
- Haacker, Mr Markus. 2004. Front matter. In The macroeconomics of HIV/AIDS. Washington, DC: International Monetary Fund. [Google Scholar]
- Hamilton, James Douglas. 1994. Time Series Analysis. Princeton: Princeton University Press. [Google Scholar]
- Hoffman, Steven J., and Sarah L. Silverberg. 2018. Delays in global disease outbreak responses: Lessons from H1N1, Ebola, and Zika. American Journal of Public Health 108: 329–33. [Google Scholar] [CrossRef]
- Kansal, Priya, and Seema Singh. 2018. Determinants of overconfidence bias in Indian stock market. Qualitative Research in Financial Markets 10: 381–394. [Google Scholar] [CrossRef]
- Karpoff, Jonathan M. 1987. The Relation Between Price Changes and Trading Volume: A Survey. The Journal of Financial and Quantitative Analysis 22: 109. [Google Scholar] [CrossRef]
- Kuranchie-Pong, Raphael, and Joseph Ato Forson. 2021. Overconfidence bias and stock market volatility in Ghana: Testing the rationality of investors in the COVID-19 era. African Journal of Economic and Management Studies 13: 147–61. [Google Scholar] [CrossRef]
- Liu, HaiYue, Aqsa Manzoor, CangYu Wang, Lei Zhang, and Zaira Manzoor. 2020. The COVID-19 outbreak and affected countries stock markets response. International Journal of Environmental Research and Public Health 17: 2800. [Google Scholar] [CrossRef] [PubMed] [Green Version]
- Liu, Zhifeng, Toan Luu Duc Huynh, and Peng-Fei Dai. 2021. The impact of COVID-19 on the stock market crash risk in China. Researchin international Business and Finance 57: 1–10. [Google Scholar] [CrossRef]
- Loh, Elaine. 2006. The impact of SARS on the performance and risk profile of airline stocks. International Journal of Transport Economics 33: 401–22. [Google Scholar]
- Mazur, Mieszko, Man Dang, and Miguel Vega. 2021. COVID-19 and the march 2020 stock market crash. Evidence from S&P1500. Finance Research Letters 38: 101690. [Google Scholar]
- Metwally, Ayman H., and Omneya Darwish. 2015. Evidence of the Overconfidence Bias in the Egyptian Stock Market in Different Market States. The Business and Managment Review 6: 178–98. [Google Scholar]
- Mushinada, Venkata Narasimha Chary, and Venkata Subrahmanya Sarma Veluri. 2018. Investors overconfidence behaviour at Bombay Stock Exchange. International Journal of Managerial Finance 14: 613–32. [Google Scholar] [CrossRef]
- Narasimhan, T. E. 2020. India’s First Coronavirus Case: Kerala Student in Wuhan Tested Positive. Business Standard India. Available online: https://www.business-standard.com/article/current-affairs/india-s-first-coronavirus-case-kerala-student-in-wuhan-tested-positive (accessed on 29 October 2021).
- Narayan, Paresh Kumar, and Susan Sunila Sharma. 2011. New evidence on oil price and firm returns. Journal of Banking & Finance 35: 3253–62. [Google Scholar]
- Naseem, Sobia, Muhammad Mohsin, Wang Hui, Geng Liyan, and Kun Penglai. 2021. The investor psychology and stock market behavior during the initial era of COVID-19: A study of China, Japan, and the United States. Frontiers in Psychology 12: 16. [Google Scholar] [CrossRef]
- Partner, K. 2020. COVID-19 Impact on Indian Industry. New Delhi: The Associated Chambers of Commerce and Industry of India (ASSOCHAM), April. [Google Scholar]
- Pendell, Dustin L., and Chulgu Cho. 2013. Stock market reactions to contagious animal disease outbreaks: An event study in korean foot-and-mouth disease outbreak. Agribusiness 29: 455–68. [Google Scholar] [CrossRef]
- Phan, Dzung Tran Trung, Van Hoang Thu Le, and Thanh Thi Ha Nguyen. 2020. Overconfidence bias, comparative evidences between Vietnam and selected ASEAN countries. Journal of Asian Finance, Economics, and Business 7: 101–13. [Google Scholar] [CrossRef]
- Prosad, Jaya M., Sujata Kapoor, Jhumur Sengupta, and Saurav Roychoudhary. 2017. Overconfidence and Disposition Effect in Indian Equity Market: An Empirical Evidence. Global Business Review 19: 1303–21. [Google Scholar] [CrossRef]
- Salisu, Afees A., and Xuan Vinh Vo. 2020. Predicting stock returns in the presence of COVID-19 pandemic: The role of health news. International Review of Financial Analysis 71: 101546. [Google Scholar] [CrossRef]
- Sharif, Arshian, Chaker Aloui, and Larisa Yarovaya. 2020. COVID-19 pandemic, oil prices, stock market, geopolitical risk and policy uncertainty nexus in the US economy: Fresh evidence from the wavelet-based approach. International Review of Financial Analysis 70: 101496. [Google Scholar] [CrossRef]
- Shen, Huayu, Mengyao Fu, Hongyu Pan, Zhongfu Yu, and Yongquan Chen. 2020. The Impact of the COVID-19 Pandemic on Firm Performance. Emerging Markets Finance and Trade 56: 2213–30. [Google Scholar] [CrossRef]
- Shrotryia, Vijay Kumar, and Himanshi Kalra. 2021. COVID-19 and overconfidence bias: The case of developed, emerging and frontier markets. International Journal of Emerging Markets. [Google Scholar] [CrossRef]
- Statman, Meir, Steven Thorley, and Keith Vorkink. 2006. Investor overconfidence and trading volume. Review of Financial Studies 19: 1531–65. [Google Scholar] [CrossRef]
- Sun, Yunchuan, Mengyuan Wu, Xiaoping Zeng, and Zihan Peng. 2021. The impact of COVID-19 on the Chinese stock market: Sentimental or substantial? Finance Research Letters 38: 1–13. [Google Scholar] [CrossRef]
- Talwar, Manish, Shalini Talwar, Puneet Kaur, Naliniprava Tripathy, and Amandeep Dhir. 2021. Has financial attitude impacted the trading activity of retail investors during the COVID-19 pandemic? Journal of Retailing and Consumer Services 58: 102341. [Google Scholar]
- Trejos, Cristian, Adrian van Deemen, Yeny E. Rodríguez, and Juan M. Gomez. 2019. Overconfidence and disposition effect in the stock market: A micro world based setting. Journal of Behavioral and Experimental Finance 21: 61–69. [Google Scholar] [CrossRef]
- Utomo, Christian Damara, and Dewi Hanggraeni. 2021. The Impact of COVID-19 Pandemic on Stock Market Performance in Indonesia. The Journal of Asian Finance, Economics and Business 8: 777–84. [Google Scholar]
- Xu, Libo. 2021. Stock Return and the COVID-19 pandemic: Evidence from Canada and the US. Finance Research Letters 38: 1–7. [Google Scholar] [CrossRef]
- Yarovaya, Larisa, Roman Matkovskyy, and Akanksha Jalan. 2020. The effects of a’Black Swan’event (COVID-19) on herding behavior in cryptocurrency markets: Evidence from cryptocurrency USD, EUR, JPY and KRW Markets. EUR, JPY and KRW Markets, April 27. [Google Scholar]
- Zaiane, Salma, and Ezzeddine Abaoub. 2009. Investor overconfidence and trading volume: Thecase of an emergent market. International Review of Business Research Papers 5: 213–22. [Google Scholar]
- Zaiane, Salma. 2013. Overconfidence, trading volume and the disposition effect: Evidence from the Shenzhen Stock Market of China. Journal Issues ISSN 2350: 157X. [Google Scholar]
- Zia, Lubna, Muzammal Ilyas Sindhu, and Shujahat Haider Hashmi. 2017. Testing overconfidence bias in Pakistani stock market. Cogent Economics and Finance 5: 1289656. [Google Scholar] [CrossRef]
Figure 1.
Market volume responses to market return shocks for the cyclical and defensive sectors (pre-COVID-19 period).
Figure 1.
Market volume responses to market return shocks for the cyclical and defensive sectors (pre-COVID-19 period).


Figure 2.
Response of market volume to market return shocks for the cyclical and defensive sectors (during the COVID-19 period).
Figure 2.
Response of market volume to market return shocks for the cyclical and defensive sectors (during the COVID-19 period).

Table 1.
Descriptive Statistics.
| Pre COVID-19 | During COVID-19 | ||||||||||
|---|---|---|---|---|---|---|---|---|---|---|---|
| Time Periods | Lags | 1 January 2015–29 January 2020 | Lags | 30 January 2020–31 December 2020 | |||||||
| Parameters | Indices | Mean | Std Dev | Skewness | Kurtosis | Mean | Std Dev | Skewness | Kurtosis | ||
| Mkt return | AUTO | 10 | 0.000 | 0.012 | 0.049 | 7.532 | 1 | 0.001 | 0.024 | −1.077 | 11.669 |
| Mkt volume | 17.55 | 0.49 | 0.533 | 3.705 | 18.776 | 0.379 | −0.203 | 5.159 | |||
| Volatility | 0.015 | 0.008 | 2.796 | 21.845 | 0.026 | 0.019 | 3.354 | 21.264 | |||
| Mkt return | BANK | 11 | 0.000 | 0.012 | 0.151 | 6.841 | 1 | 0.000 | 0.029 | −1.378 | 10.95 |
| Mkt volume | 18.554 | 0.671 | 0.492 | 3.084 | 19.719 | 0.36 | −0.128 | 8.649 | |||
| Volatility | 0.014 | 0.008 | 2.561 | 16.538 | 0.031 | 0.023 | 2.796 | 14.144 | |||
| Mkt return | ENERGY | 10 | 0.000 | 0.012 | −0.805 | 8.327 | 6 | 0.000 | 0.021 | −0.673 | 8.682 |
| Mkt volume | 17.644 | 0.569 | 0.112 | 3.968 | 18.878 | 0.343 | 0.462 | 4.125 | |||
| Volatility | 0.015 | 0.007 | 2.739 | 16.906 | 0.023 | 0.018 | 4.843 | 41.09 | |||
| Mkt return | FIN | 11 | 0.001 | 0.011 | 0.042 | 6.481 | 6 | 0.000 | 0.027 | −1.458 | 10.905 |
| Mkt volume | 18.12 | 0.449 | 0.256 | 4.454 | 19.19 | 0.389 | −0.774 | 6.585 | |||
| Volatility | 0.013 | 0.007 | 2.495 | 15.062 | 0.028 | 0.022 | 3.034 | 15.789 | |||
| Mkt return | FMCG | 13 | 0.000 | 0.01 | −0.211 | 6.723 | 9 | 0.000 | 0.017 | −0.737 | 15.717 |
| Mkt volume | 16.807 | 0.457 | −0.17 | 5.593 | 17.762 | 0.355 | 0.335 | 5.683 | |||
| Volatility | 0.013 | 0.007 | 3.107 | 24.628 | 0.019 | 0.015 | 3.416 | 21.694 | |||
| Mkt return | INFRA | 7 | 0.000 | 0.011 | −0.232 | 5.669 | 1 | 0.000 | 0.02 | −1.457 | 12.995 |
| Mkt volume | 18.846 | 0.49 | 0.297 | 4.217 | 19.452 | 0.296 | −0.047 | 5.943 | |||
| Volatility | 0.014 | 0.007 | 2.057 | 10.378 | 0.02 | 0.018 | 4.349 | 32.734 | |||
| Mkt return | IT | 11 | 0.000 | 0.011 | −0.128 | 4.854 | 6 | 0.002 | 0.022 | −0.77 | 8.626 |
| Mkt volume | 16.733 | 0.576 | 0.106 | 3.921 | 17.475 | 0.467 | 0.075 | 7.138 | |||
| Volatility | 0.014 | 0.007 | 1.908 | 8.854 | 0.023 | 0.017 | 4.257 | 31.804 | |||
| Mkt return | MEDIA | 11 | 0.000 | 0.015 | −1.203 | 18.751 | 5 | 0.000 | 0.025 | −0.931 | 5.578 |
| Mkt volume | 16.757 | 0.75 | 0.54 | 3.288 | 17.613 | 0.485 | −0.269 | 4.817 | |||
| Volatility | 0.021 | 0.013 | 5.145 | 66.149 | 0.032 | 0.018 | 2.137 | 11.243 | |||
| Mkt return | METAL | 13 | 0.000 | 0.016 | −0.008 | 4.464 | 6 | 0.001 | 0.026 | −1.04 | 6.826 |
| Mkt volume | 18.01 | 0.46 | −0.43 | 4.154 | 18.769 | 0.317 | −0.25 | 6.188 | |||
| Volatility | 0.021 | 0.01 | 1.599 | 7.342 | 0.030 | 0.019 | 4.881 | 45.373 | |||
| Mkt return | PHARMA | 14 | 0.000 | 0.012 | −0.294 | 5.063 | 2 | 0.002 | 0.02 | −0.153 | 7.84 |
| Mkt volume | 16.465 | 0.536 | 0.295 | 4.178 | 17.53 | 0.451 | 0.057 | 5.311 | |||
| Volatility | 0.017 | 0.009 | 2.578 | 17.525 | 0.026 | 0.018 | 3.757 | 27.953 | |||
| Mkt return | REALTY | 14 | 0.000 | 0.018 | −0.515 | 7.635 | 3 | 0.000 | 0.026 | −1.026 | 6.237 |
| Mkt volume | 17.597 | 0.801 | −0.36 | 2.826 | 16.67 | 0.422 | 1.013 | 4.799 | |||
| Volatility | 0.023 | 0.012 | 2.188 | 11.242 | 0.031 | 0.019 | 2.371 | 11.07 | |||
| Mkt return | SERVICE | 11 | 0.000 | 0.009 | −0.249 | 6.163 | 6 | 0.001 | 0.023 | −1.65 | 11.741 |
| Mkt volume | 18.992 | 0.52 | 0.615 | 4.236 | 19.921 | 0.321 | −0.547 | 12.26 | |||
| Volatility | 0.011 | 0.006 | 2.36 | 13.533 | 0.022 | 0.019 | 3.763 | 23.774 | |||
Author’s Estimation.
Table 2.
VAR results for pre-COVID-19 periods.
| Cyclical Sector | Defensive Sector | |||||||||||
|---|---|---|---|---|---|---|---|---|---|---|---|---|
| Parameters | AUTO | BANK | FIN | INFRA | IT | MEDIA | METAL | REALTY | ENERGY | FMCG | PHARMA | SERVICES |
| Mkt vol (−1) | 0.364 *** | 0.444 *** | 0.372 *** | 0.451 *** | 0.354 *** | 0.461 *** | 0.285 *** | 0.468 *** | 0.320 *** | 0.338 *** | 0.366 *** | 0.397 *** |
| Mkt vol (−2) | 0.080 *** | 0.093 *** | 0.088 *** | 0.054 * | 0.104 *** | 0.105 *** | 0.069 *** | 0.057 ** | 0.103 *** | 0.075 *** | 0.096 *** | 0.118 *** |
| Mkt vol (−3) | 0.063 ** | 0.016 | 0.072 *** | 0.151 *** | 0.083 *** | 0.074 *** | 0.052 ** | 0.064 ** | 0.067 ** | 0.058 * | 0.092 *** | 0.035 |
| Mkt vol (−4) | 0.071 *** | 0.091 *** | 0.097 *** | 0.032 | 0.050 * | 0.003 | 0.069 *** | 0.051 * | 0.080 *** | 0.100 *** | 0.044 | 0.078 *** |
| Mkt vol (-5) | 0.075 *** | 0.064 ** | 0.071 *** | 0.093 *** | 0.042 | 0.033 | 0.091 *** | 0.058 ** | 0.090 *** | −0.002 | 0.032 | 0.071 *** |
| Mkt vol (−6) | −0.003 | 0.051 * | −0.007 | 0.068 ** | 0.025 | 0.054 * | 0.028 | 0.047 | 0.065 ** | 0.044 | 0.029 | 0.066 ** |
| Mkt vol (−7) | 0.022 | 0.022 | 0.025 | 0.047 * | 0.023 | 0.047 | 0.021 | −0.017 | 0.059 ** | 0.043 | 0.037 | 0.003 |
| Mkt vol (−8) | 0.086 *** | 0.083 *** | 0.053 * | 0.019 | 0.015 | 0.005 | 0.025 | 0.050 * | 0.022 | 0.048 * | 0.076 *** | |
| Mkt vol (−9) | −0.016 | −0.010 | −0.005 | −0.010 | 0.033 | 0.048 * | 0.032 | 0.013 | 0.040 | −0.027 | 0.031 | |
| Mktvol (−10) | 0.119 *** | 0.010 | 0.031 | −0.013 | 0.012 | 0.057 ** | 0.037 | 0.078 *** | 0.063 ** | 0.066 *** | 0.006 | |
| Mktvol (−11) | 0.092 *** | 0.083 *** | 0.043 | 0.070 *** | 0.057 ** | 0.024 | 0.015 | 0.065 *** | ||||
| Mktvol (−12) | 0.033 | 0.002 | −0.012 | 0.012 | ||||||||
| Mktvol (−13) | 0.049 * | 0.097 *** | 0.057** | 0.070 *** | ||||||||
| Mktvol (−14) | −0.001 | 0.032 | ||||||||||
| Mktvol (−15) | 0.057 ** | |||||||||||
| Mktvol (−16) | 0.052 ** | |||||||||||
| Mktrtn (−1) | 1.384 ** | 1.576 ** | 1.412 ** | −0.237 | 1.505 * | 2.404 *** | 3.787 *** | 3.445 *** | 0.789 | 3.219 *** | 0.952 | 0.567 |
| Mktrtn (−2) | 1.500 ** | 1.308 * | 1.386 * | 1.744 ** | 1.827 ** | 0.336 | 1.781 *** | 1.077 ** | 0.913 | 1.433 | 0.355 | 2.180 *** |
| Mktrtn (−3) | 0.903 | 0.054 | −0.441 | 0.884 | 0.788 | 1.422 ** | 1.252 *** | 1.281 ** | 0.410 | −1.551 * | −0.532 | 0.536 |
| Mktrtn (−4) | −0.451 | −0.227 | 0.458 | 1.039 | 0.343 | 1.221 * | 0.313 | 0.008 | −0.346 | −0.122 | −0.059 | 0.518 |
| Mktrtn (−5) | −0.450 | 1.276 * | −0.139 | 0.542 | 2.742 *** | 0.423 | 0.567 | 1.296 ** | 0.782 | 0.341 | 0.081 | 1.842 ** |
| Mktrtn (−6) | −1.017 | −0.656 | 0.281 | −0.418 | −0.090 | 1.182 * | −0.331 | 0.575 | −0.959 | −0.440 | 1.354 | −0.591 |
| Mktrtn (−7) | 0.355 | 0.663 | 1.126 | 1.439 * | 0.685 | 0.602 | 1.053 ** | 0.843 | 0.418 | −0.133 | 0.164 | 0.955 |
| Mktrtn (−8) | 0.111 | 0.224 | −0.169 | 0.467 | 1.487 ** | 0.544 | −0.247 | −0.184 | −0.259 | −1.128 | 0.211 | |
| Mktrtn (−9) | −0.163 | 0.611 | 0.897 | −0.188 | −0.167 | 0.093 | 0.769 | 0.904 | 0.917 | 1.173 | 0.407 | |
| Mktrtn (−10) | 0.651 | 0.459 | −0.193 | 0.030 | 1.068 | 0.016 | 0.329 | 0.143 | 0.308 | 0.790 | 0.740 | |
| Mktrtn (−11) | 0.630 | 0.722 | 0.852 | 1.235 * | 0.078 | 0.244 | −0.690 | 1.432 * | ||||
| Mktrtn (−12) | 1.048 | 0.167 | −0.147 | 1.917 ** | ||||||||
| Mktrtn (−13) | −0.512 | 0.295 | 0.712 | 1.088 | ||||||||
| Mktrtn (−14) | 1.821 ** | 1.021 * | ||||||||||
| Mktrtn (−15) | 0.529 | |||||||||||
| Mktrtn (−16) | −0.759 | |||||||||||
| Constt | 2.241 *** | 0.635 *** | 1.989 *** | 1.840 *** | 1.247 *** | 1.297 *** | 1.858 *** | 0.965 *** | 1.155 *** | 1.817 *** | 3.280 *** | 0.891 *** |
| Volatility | 13.355 *** | 13.077 *** | 14.415 *** | 8.192 *** | 18.809 *** | 11.533 *** | 13.607 *** | 15.745 *** | 11.193 *** | 19.193 *** | 18.028 *** | 13.430 *** |
The table reports coefficients from market VAR analysis, which contains the natural log of volume (Mkt vol), market return (Mkt rtn), constant (Constt) and volatility at different lags specifications. ***, ** and * indicate significant values at 1, 5 and 10% levels, respectively.
Table 3.
VAR result for COVID-19 period.
| Cyclical Sector | Defensive Sector | |||||||||||
|---|---|---|---|---|---|---|---|---|---|---|---|---|
| Parameters | AUTO | BANK | FIN | INFRA | IT | MEDIA | METAL | REALTY | ENERGY | FMCG | PHARMA | SERVICES |
| Mkt vol (−1) | 0.453 *** | 0.527 *** | 0.305 *** | 0.414 *** | 0.320 *** | 0.410 *** | 0.241 *** | 0.311 *** | 0.309 *** | 0.344 *** | 0.355 *** | 0.435 *** |
| Mkt vol (−2) | 0.064 | 0.112 * | 0.125 * | −0.008 | 0.121 ** | 0.175 *** | 0.122 * | 0.125 ** | 0.075 | |||
| Mkt vol (−3) | 0.021 | 0.125 * | −0.017 | 0.034 | 0.214 *** | −0.070 | 0.023 | −0.024 | ||||
| Mkt vol (−4) | 0.103 | −0.012 | 0.041 | 0.134 ** | 0.085 | −0.069 | 0.030 | |||||
| Mkt vol (−5) | 0.131 ** | −0.036 | 0.201 | −0.091 | 0.006 | 0.082 | 0.043 | |||||
| Mkt vol (−6) | 0.081 | 0.118 ** | 0.140 ** | 0.126 ** | −0.120 * | 0.069 | ||||||
| Mkt vol (−7) | 0.004 | |||||||||||
| Mkt vol (−8) | 0.075 | |||||||||||
| Mkt vol (−9) | −0.117 * | |||||||||||
| Mkt vol (−10) | ||||||||||||
| Mkt rtn (−1) | 3.078 *** | 1.405 ** | 1.272 ** | 0.979 | 3.156 *** | 5.226 *** | 2.048 *** | 6.432 *** | 0.452 | 0.751 | 6.486 *** | 0.220 |
| Mkt rtn (−2) | 1.202 * | 2.717 ** | 0.883 | 1.295 * | 2.045 *** | −1.324 | 0.099 | 3.435 *** | 0.459 | |||
| Mkt rtn (−3) | 1.435 ** | 0.611 | 1.281 | 0.973 | 0.216 | −0.478 | −1.339 | 0.361 | ||||
| Mkt rtn (−4) | 0.799 | 0.914 | −0.013 | 0.013 | 1.447 | 0.183 | 0.614 | |||||
| Mkt rtn (−5) | −0.395 | 4.256 *** | 1.271 | 1.453 ** | 1.026 | 2.340 * | −0.204 | |||||
| Mkt rtn (−6) | 1.196 * | 1.539 | 0.943 | 1.254 | 1.758 | 1.356 * | ||||||
| Mkt rtn (−7) | 0.891 | |||||||||||
| Mkt rtn (−8) | 0.121 | |||||||||||
| Mkt rtn (−9) | −3.298 *** | |||||||||||
| Mkt rtn (−10) | ||||||||||||
| Constt | 10.165 *** | 9.203 *** | 5.494 *** | 11.311 *** | 6.259 *** | 3.973 *** | 10.099 *** | 5.702 *** | 6.843 *** | 11.539 *** | 8.921 *** | 7.298 *** |
| Volatility | 4.066 *** | 3.778 *** | 6.002 *** | 4.106 *** | 9.895 *** | 7.446 *** | 7.043 *** | 6.702 *** | 5.443 *** | 7.103 *** | 7.188 *** | 4.033 *** |
This table reports coefficients from market VAR analysis, which contains the natural log of volume (Mkt vol), market return (Mkt rtn), constant (Constt) and volatility at different lag specifications. Note: ***, ** and * indicate significant values at 1, 5 and 10% levels, respectively.
Publisher’s Note: MDPI stays neutral with regard to jurisdictional claims in published maps and institutional affiliations. |
© 2022 by the authors. Licensee MDPI, Basel, Switzerland. This article is an open access article distributed under the terms and conditions of the Creative Commons Attribution (CC BY) license (https://creativecommons.org/licenses/by/4.0/).
Share and Cite
MDPI and ACS Style
Azam, M.Q.; Hashmi, N.I.; Hawaldar, I.T.; Alam, M.S.; Baig, M.A. The COVID-19 Pandemic and Overconfidence Bias: The Case of Cyclical and Defensive Sectors. Risks 2022, 10, 56. https://doi.org/10.3390/risks10030056
AMA Style
Azam MQ, Hashmi NI, Hawaldar IT, Alam MS, Baig MA. The COVID-19 Pandemic and Overconfidence Bias: The Case of Cyclical and Defensive Sectors. Risks. 2022; 10(3):56. https://doi.org/10.3390/risks10030056
Chicago/Turabian StyleAzam, Md Qamar, Nazia Iqbal Hashmi, Iqbal Thonse Hawaldar, Md Shabbir Alam, and Mirza Allim Baig. 2022. "The COVID-19 Pandemic and Overconfidence Bias: The Case of Cyclical and Defensive Sectors" Risks 10, no. 3: 56. https://doi.org/10.3390/risks10030056
Note that from the first issue of 2016, this journal uses article numbers instead of page numbers. See further details here.