
NKG2A Expression among CD8 Cells Is Associated with COVID-19 Progression in Hypertensive Patients: Insights from the BRACE CORONA Randomized Trial

 , , , , , , , and
Abstract
:1. Introduction
2. Materials and Methods
2.1. Population and Design
2.2. Outcomes
2.3. Clinical and Laboratory Data
2.4. Peripheral Blood Mononuclear Cell Isolation
2.5. Flow Cytometry
2.6. Statistical Analysis
3. Results
3.1. Outcomes
3.2. Immune Cell Profiles and Biomarkers
3.3. Predictive Model
4. Discussion
5. Conclusions
Supplementary Materials
Author Contributions
Funding
Institutional Review Board Statement
Informed Consent Statement
Data Availability Statement
Acknowledgments
Conflicts of Interest
References
- Peng, M.; He, J.; Xue, Y.; Yang, X.; Liu, S.; Gong, Z. Role of Hypertension on the Severity of COVID-19: A Review. J. Cardiovasc. Pharmacol. 2021, 78, e648. [Google Scholar] [CrossRef] [PubMed]
- Palaiodimos, L.; Ali, R.; Teo, H.O.; Parthasarathy, S.; Karamanis, D.; Chamorro-Pareja, N.; Kokkinidis, D.G.; Kaur, S.; Kladas, M.; Sperling, J. Obesity, Inflammation, and Mortality in COVID-19: An Observational Study from the Public Health Care System of New York City. J. Clin. Med. 2022, 11, 622. [Google Scholar] [CrossRef] [PubMed]
- Palaiodimos, L.; Chamorro-Pareja, N.; Karamanis, D.; Li, W.; Zavras, P.D.; Chang, K.M.; Mathias, P.; Kokkinidis, D.G. Diabetes is associated with increased risk for in-hospital mortality in patients with COVID-19: A systematic review and meta-analysis comprising 18,506 patients. Hormones 2021, 20, 305–314. [Google Scholar] [CrossRef] [PubMed]
- Palaiodimos, L.; Kokkinidis, D.G.; Li, W.; Karamanis, D.; Ognibene, J.; Arora, S.; Southern, W.N.; Mantzoros, C.S. Severe obesity, increasing age and male sex are independently associated with worse in-hospital outcomes, and higher in-hospital mortality, in a cohort of patients with COVID-19 in the Bronx, New York. Metabolism 2020, 108, 154262. [Google Scholar] [CrossRef]
- Guerson-Gil, A.; Palaiodimos, L.; Assa, A.; Karamanis, D.; Kokkinidis, D.; Chamorro-Pareja, N.; Kishore, P.; Leider, J.M.; Brandt, L.J. Sex-specific impact of severe obesity in the outcomes of hospitalized patients with COVID-19: A large retrospective study from the Bronx, New York. Eur. J. Clin. Microbiol. Infect. Dis. 2021, 40, 1963–1974. [Google Scholar] [CrossRef]
- Norlander, A.E.; Madhur, M.S.; Harrison, D.G. The immunology of hypertension. J. Exp. Med. 2018, 215, 21–33. [Google Scholar] [CrossRef]
- Caillon, A.; Schiffrin, E.L. Role of inflammation and immunity in hypertension: Recent epidemiological, laboratory, and clinical evidence. Curr. Hypertens. Rep. 2016, 18, 1–9. [Google Scholar] [CrossRef]
- Mehta, P.; McAuley, D.F.; Brown, M.; Sanchez, E.; Tattersall, R.S.; Manson, J.J. COVID-19: Consider cytokine storm syndromes and immunosuppression. The Lancet. 2020, 395, 1033–1034. [Google Scholar] [CrossRef]
- Lowenstein, C.J.; Solomon, S.D. Severe COVID-19 is a microvascular disease. Circulation 2020, 142, 1609–1611. [Google Scholar] [CrossRef]
- Wan, S.; Yi, Q.; Fan, S.; Lv, J.; Zhang, X.; Guo, L.; Lang, C.; Xiao, Q.; Xiao, K.; Yi, Z. Relationships among lymphocyte subsets, cytokines, and the pulmonary inflammation index in coronavirus (COVID-19) infected patients. Br. J. Haematol. 2020, 189, 428–437. [Google Scholar] [CrossRef]
- Moll-Bernardes, R.; De Sousa, A.S.; Macedo, A.V.S.; Lopes, R.D.; Vera, N.; Maia, L.C.R.; Feldman, A.; Arruda, G.; Castro, M.J.C.; Pimentel-Coelho, P.M. IL-10 and IL-12 (P70) Levels Predict the Risk of COVID-19 Progression in Hypertensive Patients: Insights From the BRACE-CORONA Trial. Front. Cardiovasc. Med. 2021, 18, 820. [Google Scholar] [CrossRef] [PubMed]
- Varchetta, S.; Mele, D.; Oliviero, B.; Mantovani, S.; Ludovisi, S.; Cerino, A.; Bruno, R.; Castelli, A.; Mosconi, M.; Vecchia, M.; et al. Unique immunological profile in patients with COVID-19. Cell Mol. Immunol. 2020, 18, 604–612. [Google Scholar] [CrossRef] [PubMed]
- Chen, G.; Wu, D.; Guo, W.; Cao, Y.; Huang, D.; Wang, H.; Wang, T.; Zhang, X.; Chen, H.; Yu, H.; et al. Clinical and immunological features of severe and moderate coronavirus disease 2019. J. Clin. Investig. 2020, 130, 2620–2629. [Google Scholar] [CrossRef] [PubMed] [Green Version]
- Del Valle, D.M.; Kim-Schulze, S.; Huang, H.H.; Beckmann, N.D.; Nirenberg, S.; Wang, B.; Lavin, Y.; Swartz, T.H.; Madduri, D.; Stock, A.; et al. An inflammatory cytokine signature predicts COVID-19 severity and survival. Nat. Med. 2020, 26, 1636–1643. [Google Scholar] [CrossRef]
- Qin, C.; Zhou, L.; Hu, Z.; Zhang, S.; Yang, S.; Tao, Y.; Xie, C.; Ma, K.; Shang, K.; Wang, W. Dysregulation of immune response in patients with coronavirus 2019 (COVID-19) in Wuhan, China. Clin. Infect. Dis. 2020, 71, 762–768. [Google Scholar] [CrossRef] [PubMed]
- Yaqinuddin, A.; Kashir, J. Innate immunity in COVID-19 patients mediated by NKG2A receptors, and potential treatment using Monalizumab, Cholroquine, and antiviral agents. Med. Hypotheses 2020, 140, 109777. [Google Scholar] [CrossRef] [PubMed]
- Zheng, M.; Gao, Y.; Wang, G.; Song, G.; Liu, S.; Sun, D.; Xu, Y.; Tian, Z. Functional exhaustion of antiviral lymphocytes in COVID-19 patients. Cell. Mol. Immunol. 2020, 17, 533–535. [Google Scholar] [CrossRef] [PubMed] [Green Version]
- Haanen, J.B.; Cerundolo, V. NKG2A, a new kid on the immune checkpoint block. Cell 2018, 175, 1720–1722. [Google Scholar] [CrossRef] [Green Version]
- André, P.; Denis, C.; Soulas, C.; Bourbon-Caillet, C.; Lopez, J.; Arnoux, T.; Bléry, M.; Bonnafous, C.; Gauthier, L.; Morel, A. Anti-NKG2A mAb is a checkpoint inhibitor that promotes anti-tumor immunity by unleashing both T and NK cells. Cell 2018, 175, 1731–1743.e1713. [Google Scholar] [CrossRef] [Green Version]
- Lopes, R.D.; Macedo, A.V.S.; de Barros, E.S.P.G.M.; Moll-Bernardes, R.J.; Feldman, A.; D’Andrea Saba Arruda, G.; de Souza, A.S.; de Albuquerque, D.C.; Mazza, L.; Santos, M.F.; et al. Continuing versus suspending angiotensin-converting enzyme inhibitors and angiotensin receptor blockers: Impact on adverse outcomes in hospitalized patients with severe acute respiratory syndrome coronavirus 2 (SARS-CoV-2)--The BRACE CORONA Trial. Am. Heart J. 2020, 226, 49–59. [Google Scholar] [CrossRef]
- Lopes, R.D.; Macedo, A.V.S.; de Barros, E.S.P.G.M.; Moll-Bernardes, R.J.; Dos Santos, T.M.; Mazza, L.; Feldman, A.; D’Andrea Saba Arruda, G.; de Albuquerque, D.C.; Camiletti, A.S.; et al. Effect of Discontinuing vs Continuing Angiotensin-Converting Enzyme Inhibitors and Angiotensin II Receptor Blockers on Days Alive and Out of the Hospital in Patients Admitted With COVID-19: A Randomized Clinical Trial. JAMA 2021, 325, 254–264. [Google Scholar] [CrossRef]
- World, H.O. WHO R&D Blueprint: COVID-19 Therapeutic Trial Synopsis. Published February. 2020. Available online: https://www.who.int/blueprint/priority-diseases/key-action/COVID-19_Treatment_Trial_Design_Master_Protocol_synopsis_Final_18022020.pdf (accessed on 20 October 2020).
- Francone, M.; Iafrate, F.; Masci, G.M.; Coco, S.; Cilia, F.; Manganaro, L.; Panebianco, V.; Andreoli, C.; Colaiacomo, M.C.; Zingaropoli, M.A.; et al. Chest CT score in COVID-19 patients: Correlation with disease severity and short-term prognosis. European Radiology. 2020, 30, 6808–6817. [Google Scholar] [CrossRef] [PubMed]
- Yang, R.; Li, X.; Liu, H.; Zhen, Y.; Zhang, X.; Xiong, Q.; Luo, Y.; Gao, C.; Zeng, W. Chest CT severity score: An imaging tool for assessing severe COVID-19. Radiol. Cardiothorac. Imaging 2020, 2, e200047. [Google Scholar] [CrossRef] [PubMed] [Green Version]
- Antonioli, L.; Fornai, M.; Pellegrini, C.; Blandizzi, C. NKG2A and COVID-19: Another brick in the wall. Cell. Mol. Immunol. 2020, 17, 672–674. [Google Scholar] [CrossRef] [PubMed]
- Taefehshokr, N.; Taefehshokr, S.; Hemmat, N.; Heit, B. COIVD-19: Perspectives on innate immune evasion. Front. Immunol. 2020, 11, 580641. [Google Scholar] [CrossRef] [PubMed]
- Li, F.; Wei, H.; Wei, H.; Gao, Y.; Xu, L.; Yin, W.; Sun, R.; Tian, Z. Blocking the natural killer cell inhibitory receptor NKG2A increases activity of human natural killer cells and clears hepatitis B virus infection in mice. Gastroenterology 2013, 144, 392–401. [Google Scholar] [CrossRef]
- Zhang, C.; Wang, X.-m.; Li, S.-r.; Twelkmeyer, T.; Wang, W.-h.; Zhang, S.-y.; Wang, S.-f.; Chen, J.-z.; Jin, X.; Wu, Y.-z. NKG2A is a NK cell exhaustion checkpoint for HCV persistence. Nat. Commun. 2019, 10, 1–11. [Google Scholar] [CrossRef] [Green Version]
- Cho, J.-H.; Kim, H.-O.; Webster, K.; Palendira, M.; Hahm, B.; Kim, K.-S.; King, C.; Tangye, S.G.; Sprent, J. Calcineurin-dependent negative regulation of CD94/NKG2A expression on naive CD8+ T cells. Blood J. Am. Soc. Hematol. 2011, 118, 116–128. [Google Scholar] [CrossRef] [Green Version]
- Jinushi, M.; Takehara, T.; Tatsumi, T.; Kanto, T.; Miyagi, T.; Suzuki, T.; Kanazawa, Y.; Hiramatsu, N.; Hayashi, N. Negative regulation of NK cell activities by inhibitory receptor CD94/NKG2A leads to altered NK cell-induced modulation of dendritic cell functions in chronic hepatitis C virus infection. J. Immunology. 2004, 173, 6072–6081. [Google Scholar] [CrossRef]
- Ma, Q.; Dong, X.; Liu, S.; Zhong, T.; Sun, D.; Zong, L.; Zhao, C.; Lu, Q.; Zhang, M.; Gao, Y. Hepatitis B e antigen induces NKG2A+ natural killer cell dysfunction via regulatory T cell-derived interleukin 10 in chronic hepatitis B virus infection. Front. Cell Dev. Biol. 2020, 8, 421. [Google Scholar] [CrossRef]
- Sun, C.; Xu, J.; Huang, Q.; Huang, M.; Wen, H.; Zhang, C.; Wang, J.; Song, J.; Zheng, M.; Sun, H. High NKG2A expression contributes to NK cell exhaustion and predicts a poor prognosis of patients with liver cancer. Oncoimmunology 2017, 6, e1264562. [Google Scholar] [CrossRef] [PubMed]
- Creelan, B.C.; Antonia, S.J. The NKG2A immune checkpoint—a new direction in cancer immunotherapy. Nat. Rev. Clin. Oncol. 2019, 16, 277–278. [Google Scholar] [CrossRef] [PubMed]


| Clinical Conditions | Total | Non-Severe Cases (n = 145/156) | Severe Cases * (n = 11/156) | Fisher’s Exact Test p-Value |
|---|---|---|---|---|
| n | n(%) | n(%) | ||
| Sex | ||||
| Male | 102 | 93 (91.2) | 9 (8.8) | 0.332 |
| Female | 54 | 52 (96.3) | 2 (3.7) | |
| Age | ||||
| <60 years old | 108 | 100 (92.6) | 8 (7.4) | 1.000 |
| 60 and older | 48 | 45 (93.8) | 3 (6.3) | |
| Signs of pulmonary involvement | ||||
| O2 sat > 93% and CT ≤ 50% † | 124 | 121 (97.6) | 3 (2.4) | <0.001 |
| O2 sat ≤ 93% or CT > 50% | 32 | 24 (75.0) | 8 (25.0) | |
| Obesity | ||||
| No (BMI < 30 kg/m²) | 75 | 74 (98.7) | 1 (1.3) | 0.010 |
| Yes (BMI ≥ 30 kg/m²) | 81 | 71 (87.7) | 10 (12.3) | |
| Diabetes | ||||
| No | 116 | 115 (99.1) | 1 (0.9) | <0.001 |
| Yes | 40 | 30 (75.0) | 10 (25.0) | |
| Asthma/COPD | ||||
| No | 153 | 142 (92.8) | 11 (7.2) | 1.000 |
| Yes | 3 | 3 (100.0) | 0 (0.0) | |
| Dyslipidemia | ||||
| No | 131 | 122 (93.1) | 9 (6.9) | 0.690 |
| Yes | 25 | 23 (92.0) | 2 (8.0) | |
| Coronary artery disease | ||||
| No | 153 | 142 (92.8) | 11 (7.2) | 1.000 |
| Yes | 3 | 3 (100.0) | 0 (0.0) | |
| All (n = 156) | Non-Severe Cases † (n = 145) | Severe Cases ‡ (n = 11) | |||||||
|---|---|---|---|---|---|---|---|---|---|
| Median | Mean | SD | Median | Mean | SD | Median | Mean | SD | |
| CRP, mg/L | 2.37 | 4.62 | 5.38 | 2.12 | 4.14 | 5.01 | 11.49 | 10.97 | 6.25 |
| Total lymphocyte count, ×10−6/L | 1395 | 1521 | 758 | 1450 | 1529 | 670 | 800 | 1416 | 1559 |
| Total monocyte count, ×10−6/L | 230 | 369 | 383 | 230 | 357 | 323 | 100 | 525 | 863 |
| Total B lymphocyte count, ×10−6/L | 107 | 153 | 161 | 105 | 149 | 145 | 126 | 209 | 308 |
| Total B lymphocytes % | 8.0 | 10.2 | 8.5 | 7.8 | 9.8 | 8.1 | 15.8 | 15.3 | 11.1 |
| NK cell count, ×10−6/L | 159 | 199 | 180 | 159 | 197 | 175 | 137 | 217 | 246 |
| NK cells, % * | 10.8 | 14.3 | 11.2 | 10.6 | 14.1 | 11.4 | 16.6 | 15.9 | 8.1 |
| NK-NKG2A, % ** | 30.7 | 34.1 | 16.5 | 30.6 | 33.8 | 16.4 | 39.2 | 37.7 | 18.0 |
| NK-NKG2A MFI ** | 2.039 | 2.209 | 831 | 2.019 | 2.200 | 840 | 2.200 | 2.325 | 725 |
| Total T lymphocyte count, ×10−6/L | 1.031 | 1.150 | 633 | 1.088 | 1.165 | 591 | 520 | 954 | 1.059 |
| Total T lymphocytes, % | 78.0 | 74.3 | 14.8 | 78.2 | 74.9 | 14.2 | 64.9 | 65.7 | 19.9 |
| CD4+ T cell count, ×10−6/L | 549 | 651 | 443 | 564 | 660 | 406 | 241 | 522 | 805 |
| CD4+ T cells, % | 56.5 | 54.8 | 14.8 | 56.9 | 55.6 | 14.5 | 40.7 | 44.4 | 15.6 |
| CD8+ T cell count, ×10−6/L | 377 | 433 | 255 | 381 | 437 | 254 | 310 | 379 | 280 |
| CD8+ T cells, % | 37.7 | 39.0 | 14.2 | 36.9 | 38.4 | 13.9 | 42.6 | 46.8 | 16.5 |
| CD4/CD8 * | 1.51 | 1.76 | 1.06 | 1.55 | 1.79 | 1.05 | 0.73 | 1.25 | 1.05 |
| CD8+ CD38+ T cells, % * | 8.7 | 14.4 | 15.7 | 8.1 | 14.4 | 16.2 | 17.4 | 14.4 | 8.2 |
| CD8+ CD38+ T cells MFI * | 4035 | 4463 | 2453 | 4067 | 4511 | 2533 | 3893 | 3840 | 626 |
| CD8+ HLADR+ T cells, % * | 15.3 | 20.3 | 18.8 | 14.9 | 20.1 | 18.5 | 19.6 | 22.7 | 23.5 |
| CD8+ HLADR+ T cells MFI * | 939 | 1282 | 944 | 909 | 1252 | 936 | 1341 | 1678 | 1000 |
| CD8+ NKG2A+ T cells, % | 4.6 | 8.0 | 8.7 | 4.7 | 8.0 | 8.8 | 4.2 | 7.3 | 7.8 |
| CD8+ NKG2A+ T cells MFI | 2153 | 2154 | 804 | 2137 | 2130 | 819 | 2293 | 2480 | 460 |
| CD8+ HLADR+ CD38- T cells, % * | 7.9 | 14.2 | 16.2 | 8.2 | 14.0 | 15.6 | 7.2 | 16.6 | 23.0 |
| CD8+ HLADR+ CD38+ T cells, % * | 3.6 | 6.1 | 6.7 | 3.5 | 6.1 | 6.9 | 4.6 | 6.1 | 4.3 |
| CD8+ HLADR- CD38+ T cells, % * | 4.2 | 8.3 | 12.5 | 4.2 | 8.3 | 12.9 | 8.7 | 8.3 | 6.0 |
| CD8+ HLADR- CD38- T cells, % * | 76.6 | 71.4 | 21.3 | 76.6 | 71.6 | 21.3 | 75.4 | 69.0 | 21.7 |
| Area under Curve | p-Value | Cut-off for 90% Sensitivity | |
|---|---|---|---|
| CRP | 0.827 | <0.001 | 2.73 |
| CD4+ T cells, % * | 0.718 | 0.016 | 64.8 |
| Total lymphocytes * | 0.702 | 0.026 | 2100 |
| CD4/CD8 * | 0.692 | 0.034 | 3.23 |
| CD8+ HLADR T cell MFI | 0.670 | 0.060 | 624 |
| CD8+ T cells, % | 0.659 | 0.079 | 22.2 |
| CD8+ NKG2A T cell MFI | 0.650 | 0.097 | 2054 |
| Monocytes | 0.644 | 0.112 | ** |
| B lymphocytes | 0.643 | 0.115 | ** |
| T lymphocytes | 0.636 | 0.132 | ** |
| NK cells | 0.601 | 0.265 | ** |
| CD8+ HLADR- CD38+ T cells | 0.597 | 0.283 | ** |
| CD8+ CD38+ T cells | 0.592 | 0.312 | ** |
| CD8+ HLADR+ CD38+ T cells | 0.585 | 0.350 | ** |
| NK-NKG2A cells | 0.570 | 0.438 | ** |
| NK-NKG2A cell MFI | 0.567 | 0.459 | ** |
| CD8+ NKG2A+ T cells | 0.554 | 0.549 | ** |
| CD8+ CD38+ T cell MFI | 0.551 | 0.577 | ** |
| CD8+ HLADR- CD38- T cells | 0.548 | 0.596 | ** |
| CD8+ HLADR+ T cells | 0.541 | 0.651 | ** |
| CD8+ HLADR+ CD38- T cells | 0.534 | 0.707 | ** |
| Variables in the Equation | β | p-Value | Odds Ratio | |
|---|---|---|---|---|
| Step 1 | Diabetes | 3.64 | 0.001 | 38.0 |
| Step 2 | Diabetes | 3.37 | 0.002 | 29.2 |
| Lung involvement † | 2.29 | 0.003 | 9.9 | |
| Step 3 | Diabetes | 3.74 | 0.001 | 42.0 |
| Lung involvement | 2.39 | 0.006 | 10.9 | |
| CD8+ NKG2A T cell MFI > 2054 | 2.78 | 0.020 | 16.0 | |
| Step 4 (Final model) * | Diabetes | 3.71 | 0.002 | 40.9 |
| Lung involvement | 2.59 | 0.008 | 13.3 | |
| CD8+ NKG2A T cell MFI > 2054 | 2.65 | 0.037 | 14.2 | |
| Obesity | 2.63 | 0.040 | 13.8 | |
| CD8+ NKG2A+ T Cell MFI | ||
|---|---|---|
| ≤2054 * | >2054 | |
| No clinical risk factor † | 0.0% | 0.1% |
| Diabetes only | 0.2% | 3.3% |
| Obesity only | 0.1% | 1.1% |
| Lung involvement only ‡ | 0.1% | 1.1% |
| Diabetes + obesity | 3.2% | 31.9% |
| Diabetes + lung involvement | 3.1% | 31.1% |
| Obesity + lung involvement | 1.1% | 13.2% |
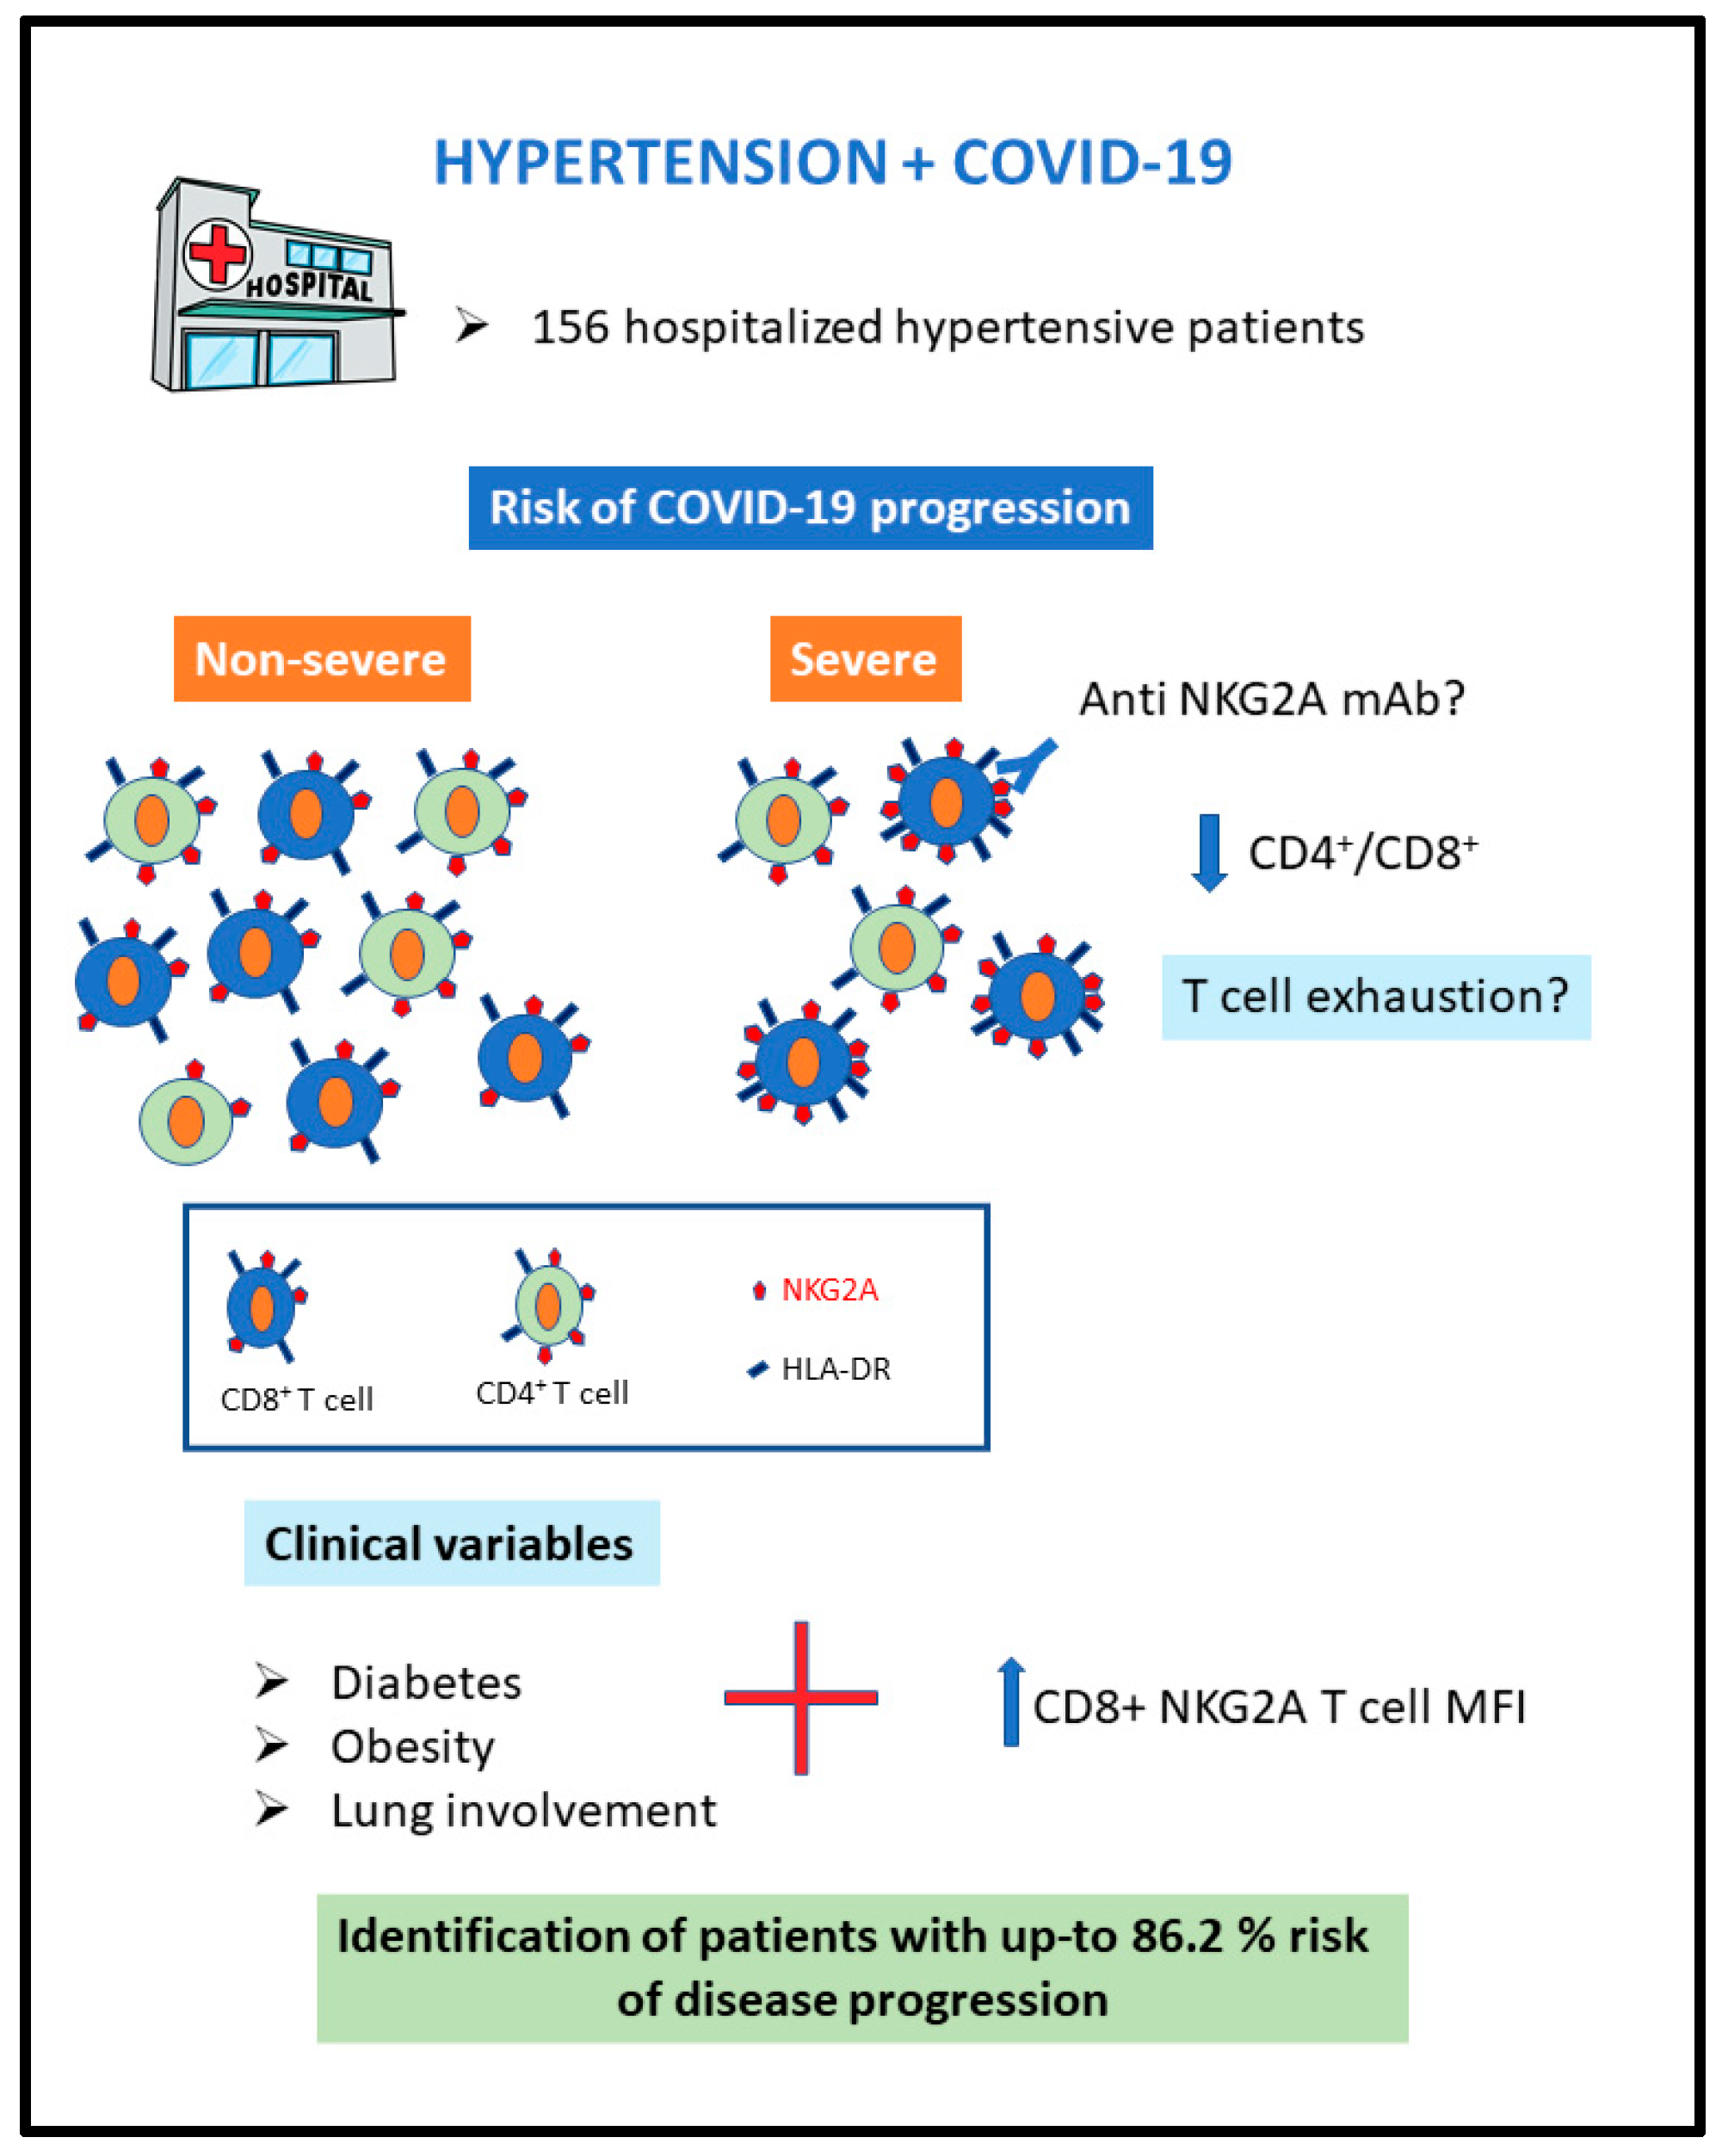
| Diabetes + obesity + lung involvement | 30.6% | 86.2% |
Publisher’s Note: MDPI stays neutral with regard to jurisdictional claims in published maps and institutional affiliations. |
© 2022 by the authors. Licensee MDPI, Basel, Switzerland. This article is an open access article distributed under the terms and conditions of the Creative Commons Attribution (CC BY) license (https://creativecommons.org/licenses/by/4.0/).
Share and Cite
Moll-Bernardes, R.; Fortier, S.C.; Sousa, A.S.; Lopes, R.D.; Vera, N.; Conde, L.; Feldman, A.; Arruda, G.; Cabral-Castro, M.; Albuquerque, D.C.; et al. NKG2A Expression among CD8 Cells Is Associated with COVID-19 Progression in Hypertensive Patients: Insights from the BRACE CORONA Randomized Trial. J. Clin. Med. 2022, 11, 3713. https://doi.org/10.3390/jcm11133713
Moll-Bernardes R, Fortier SC, Sousa AS, Lopes RD, Vera N, Conde L, Feldman A, Arruda G, Cabral-Castro M, Albuquerque DC, et al. NKG2A Expression among CD8 Cells Is Associated with COVID-19 Progression in Hypertensive Patients: Insights from the BRACE CORONA Randomized Trial. Journal of Clinical Medicine. 2022; 11(13):3713. https://doi.org/10.3390/jcm11133713
Chicago/Turabian StyleMoll-Bernardes, Renata, Sérgio C. Fortier, Andréa S. Sousa, Renato D. Lopes, Narendra Vera, Luciana Conde, André Feldman, Guilherme Arruda, Mauro Cabral-Castro, Denílson C. Albuquerque, and et al. 2022. "NKG2A Expression among CD8 Cells Is Associated with COVID-19 Progression in Hypertensive Patients: Insights from the BRACE CORONA Randomized Trial" Journal of Clinical Medicine 11, no. 13: 3713. https://doi.org/10.3390/jcm11133713