Article

Assess the Impact of the COVID-19 Pandemic and Propose Solutions for Sustainable Development for Textile Enterprises: An Integrated Data Envelopment Analysis-Binary Logistic Model Approach

1
Faculty of Economics, Thu Dau Mot University, Number 6, Tran Van On Street, Phu Hoa Ward, Thu Dau Mot 590000, Vietnam
2
Graduate Training Institute, Thu Dau Mot University, Number 6, Tran Van On Street, Phu Hoa Ward, Thu Dau Mot 590000, Vietnam
*
Author to whom correspondence should be addressed.
J. Risk Financial Manag. 2021, 14(10), 465; https://doi.org/10.3390/jrfm14100465
Submission received: 22 August 2021 / Revised: 25 September 2021 / Accepted: 26 September 2021 / Published: 2 October 2021
(This article belongs to the Special Issue Economic and Financial Implications of COVID-19)

Abstract

:
The COVID-19 pandemic impacted many socio-economic areas of countries around the world. It has made the production and business situations of enterprises face substantial difficulties. In this study, the authors used data envelopment analysis (DEA) models to assess the impact of the COVID-19 pandemic on Vietnam’s textile and garment enterprises. The authors have used the binary logistic model to determine the factors affecting employees’ decision to change jobs in the textile industry. The research results showed that the COVID-19 pandemic greatly affected the business performance of the textile and garment enterprises in Vietnam. Moreover, the results helped identify the factors affecting employee turnover and proposed solutions to help businesses stabilize their personnel situation and develop sustainable businesses in the post-COVID-19 era.

1. Introduction

In Vietnam, the textile and garment industry has been the second-largest export value industry for many consecutive years. In 2019, the total export amount reached 39.6 billion USD, and the trade surplus was 16.6 billion USD with an increase of 2.25 billion USD, equivalent to 7.55% compared to 2018. Compared to the year 1999, the export turnover in 2019 increased over 22 times from 1.75 billion USD in 1999 to 39 billion USD. The trade surplus in 2019 reached 17.7 billion USD, which was up 106.5 times compared to 185 million USD in 1999 (Nguyen 2019). In 2020, due to the heavy impact of the COVID-19 epidemic, Vietnam’s textile and garment industry faced many challenges, including breaking the supply chain of raw materials. The supply chain, in terms of human resources, was also greatly affected. Orders dropped significantly when Vietnam implemented social distancing. By the end of 2020, the entire Vietnam textile and garment industry achieved an export turnover of 35.29 billion USD, down 10.91% compared to 2019 (show in Figure 1) (Quynh 2021).
Statistical results show that the export growth of the textile and garment industry in 2018 reached 16.5%; however, by the end of 2019, the COVID-19 pandemic caused the export growth to decrease to 8%. The prolonged epidemic situation caused this growth to drop deeply in 2020 (show in Figure 2). The export turnover of textiles and garments in the first 11 months of 2020 reached 26.73 billion USD (down 10.5% compared to 2019). Vietnam’s GDP decreased from 7.02% in 2019 to 2.91% in 2020.
Industry scale: In 2019, Vietnam rose to the 3rd largest in the top 5 largest textile and garment exporting countries in the world. These included China, Bangladesh, Vietnam, India, and Pakistan (shown in Figure 3) (Hai 2019).
In terms of the strong attraction of foreign direct investment (FDI) inflows, he cost of labor and operating costs were low, and FDI inflows were increasingly strong in emerging economies such as Indonesia, Vietnam, and Bangladesh. In Vietnam, by the end of 2017, the total registered and additional capital was 15.89 billion USD, an increase of about 10%. This number jumped to 18.69 billion USD in 2018. The proportion of FDI capital was 70% in Vietnam’s textile and garment industry (Linh 2020).
With regard to industry structure, the US, EU, Japan, Korea, and China are the largest export markets for Vietnam’s textile and garment industry (see Figure 4).
More than three million employees work for nearly 7000 enterprises in Vietnam’s textile and garment industry, with low average salaries compared to other countries (Le 2019). Due to the salary and welfare regimes of textile enterprises, they are not attractive to workers. Many potential workers lack industrial experience and do not meet the needs of the job, but require high wages. Because of this, businesses are facing great difficulties in recruiting skilled workers. Meanwhile, the number of textile enterprises is increasing, which has created even greater competition in the labor market.
Unique features of this labor market add to the recruitment problem. The industry employees are low-income, work overtime, and have related health problems. The majority of garment workers are female and require more personal time to take care of their families. Therefore, the turnover in the textile and garment enterprises is continuous. Stabilizing the human resource picture helps textile enterprises to be more proactive when difficulties arise. At the same time, stabilizing human resources helps companies maintain product quality. For textile enterprises, human resources have a particularly important meaning when developing business strategies. The question is, how does the COVID-19 pandemic affect the production and business situation of Vietnam’s textile and garment enterprises? What factors affect the decision of employees to job- -hop in textile enterprises? What solutions are needed to recruit suitable personnel for employment positions in textile enterprises to stabilize the production and business situation? This study focuses on these issues.

2. Research Development

2.1. Literature Review

Tamatam et al. (2019) used DEA models to estimate the relative efficiency of domestic Indian banks for the period 2008–2017. This study evaluated the performance of banks based on their ownership and size and studied their productivity trends. In the same year, Mahdiloo et al. (2014) used DEA models to evaluate supplier performance against benchmarks when several factors played a dual role in both inputs and outputs. This study used the DEA model for the first time to consider factors with dual roles. The results of this study gave a complete ranking of suppliers in the system. Abbas et al. (2015) used DEA models to evaluate efficiency and productivity, in Islamic and conventional banks, to compare their performance over the period 2005–2009. The results showed that, for religious reasons, Islamic banks, with their patronage, have been showing tremendous growth around the world. Lee et al. (2017) used DEA models to measure the comparative performance of 18 Korean commercial banks in the presence of negative observations and examined the difference in performance among these banks. Seth et al. (2021) used DEA models to explore the predictors of working capital management performance and their influence on firm performance. The results of this study evaluated the impact of various exogenous variables on the efficiency of working capital management and the performance of companies.
Virginia et al. (2017) used binary logistic models to study substance abuse treatment outcomes. The researchers followed more than 30 subjects, determined relapse rates, and identified factors that could predict the re-use of addictive substances. Sanchez-Varela et al. (2021) used binary logistic models to evaluate position loss predictions on positioning drilling operations. The results demonstrated that position loss is more likely to occur when more generators are used and drilling takes place in shallower water in adverse weather conditions. Omondi-Ochieng (2021) used Binary logistic models to evaluate the financial performance of the United Kingdom’s (UK) national non-profit sports federations. The results of this study predicted the financial performance of the UK’s national non-profit sports federations.
DEA models and binary logistic models have been widely used and applied in many fields of science, engineering, and the world economy (Kwon 2014; Wong and Wong 2007; Ashuri et al. 2019; Pourmahmoud and Azad 2021; Aparicio 2016). However, no scientific study has combined DEA and Binary logistic models to assess the impact of the COVID-19 pandemic and to identify sustainable development solutions for textile enterprises. This is the first study that uses combination of these models to assess the impact of the pandemic on the production and business situation of textile and garment enterprises and the factors that have contributed to the decision of employees to change jobs in textile enterprises.

2.2. Research Process

The goal is to assess the impact of the COVID-19 pandemic on the production and business situation of textile and garment enterprises in Vietnam and find solutions to help these enterprises recover and develop sustainably in the post-COVID-19 period. The authors have undertaken an extensive literature review to choose the right analysis methods, models, and tools that are accurate and bring the best results. After reading and studying many modern tools and models, the authors found that DEA models and Binary logistic models are the most suitable for carrying out this study.
DEA is a linear programming method for measuring the effectiveness of multiple decision-making units (DMUs) when a production process presents the structure of multiple inputs and outputs. This method relies on the past business data of the enterprise to construct the production boundary in the non-parametric plane (production boundary).
A Binary logistic model is used to study the probability of occurrence of a binary-dependent variable (there are only two values: 0 and 1). When the dependent variable is in binary form, we cannot do the analysis with normal linear regression, because the model will violate the regression assumptions and invalidate the system statistics of the tests in the regression, leading to inaccurate results. Binary logistic regression does not necessarily satisfy these assumptions. Therefore, in this study, the authors use the binary logistic model to determine the factors affecting the decision of workers to change jobs in the textile industry.
The procedure for carrying out this study is described in detail in Figure 5.
To assess the impact of the COVID-19 pandemic on the production and business situation of textile and garment enterprises in Vietnam, the authors used DEA models, taking the following steps in turn:
The authors collected data on the production and business condition of leading enterprises in Vietnam for the period 2016–2020 through the website of the general statistics office of Vietnam (Statistics 2021). From data on the production and business condition of Vietnamese textile and garment enterprises, the author selected five input factors including Total assets (F1), Equity (F2), Cost of goods sold (F3), Selling expenses (F4), Enterprise management cost (F5); and two output factors: Net revenue (F6), Profit after tax (F7) (Unit: 1000 USD). These factors fully reflected on the production and business situation of textile and garment enterprises.
After collecting the above data, the authors checked the correlation of input and output factors to ensure that these factors were closely correlated with each other, following the criteria of analysis conditions of the DEA models. If the correlation of the inputs and outputs was not guaranteed, the authors reselected the input and output factors to ensure the conditions of the DEA models. The number of inputs and outputs has no correlation to the number of DMUs, just the correlation of inputs and outputs.
After testing the correlation between the input factors and the output factors, the conditions for analysis were ensured. The authors used the super-efficiency model to assess the overview of the production and business situation of Vietnamese textile and garment enterprises in the period 2016–2020. By analyzing the efficiency score of Vietnamese textile and garment enterprises and the ranking score of Vietnamese enterprises in this period, the authors could see the change in the production and business efficiency of the enterprises during the pandemic.
After assessing the overview of the production and business situation of Vietnamese textile and garment enterprises in the period 2016–2020, the authors used the malmquist productivity index to analyze and evaluate each criterion of enterprises. Specifically, the authors evaluated the effectiveness of technology investment, the efficiency of technical investment, and the efficiency of production and business activities of Vietnam’s textile and garment enterprises with the period 2017–2020 serving as the basis for the results. This offered a solid basis for analyzing and assessing the impact of the COVID-19 pandemic on the production and business situation of Vietnamese textile and garment enterprises in the period 2016–2020.
In fact, human resources determine the success of the business by ensuring the creation of a creative source in the enterprise. Human resources with dynamic, creative, and intellectual activities create useful values in en enterprise’s development strategy. One of the biggest difficulties that Vietnamese textile and garment enterprises often face is the situation of workers’ job hopping. Textile and garment enterprises require qualified and technical human resources in production to create high quality products. When human resources are unstable, it affects the quality of textile products, thereby affecting the production and business efficiency of textile enterprises. Therefore, textile enterprises that want to achieve good business performance need to stabilize human resources to ensure the production situation. To help textile enterprises generate solutions to stabilize the situation of human resources, the authors used a Binary logistic model to consider the factors affecting the decision of employees in textile enterprises to switch jobs. Specifically, in this study, the authors analyzed the following factors: worker’s age (AG), education level (ED), income (IN), working seniority (SE), and distance (DI) to determine the level of impact of these factors on a worker’s ability to switch jobs in textile enterprises. In this study, the authors consider the following hypotheses:
Hypothesis 1 (H1).
The age of workers is related to the decision about job-hopping.
Hypothesis 2 (H2).
The education level of workers in the textile and garment industry is related to the decision to switch jobs.
Hypothesis 3 (H3).
The distance from the employee’s place of residence to the workplace has an impact on the decision to change jobs.
Hypothesis 4 (H4).
The number of years of experience of an employee is related to the employee’s decision to switch jobs.
In the textile and garment industry, stabilizing the personnel situation will stabilize the production situation and help enterprises develop sustainably. In order to determine how these factors affect employees’ job-switching ability in textile and garment enterprises, the authors have built a survey with the above factors described in Table 1:
The survey was conducted through the association of textile enterprises. The authors processed the obtained results on the software SPSS 20.0. From there, solutions were proposed to recruit personnel compatible with the characteristics of enterprises to improve the personnel situation. This in turn improves the production and business situation and guarantees the quality of products of Vietnamese textile enterprises to help them develop sustainably.

2.3. Data Description

In this study, the authors relied on reports of enterprise business results and studies using the DEA model, which have achieved many successes in the field of economics (as Table 2). In this study, the authors used five inputs and two outputs to assess the impact of the COVID-19 pandemic on production and the business situation of textile enterprises in Vietnam. These were:
Total assets of an enterprise (F1) were the entire set of assets, finance, valuable papers in cash, and property rights under the legal ownership or right to use the enterprise used for production and business activities of the enterprise.
Equity (F2) is the total net assets of the business, owned by shareholders. Equity is made up of charter capital, undistributed profits, and other sources.
Cost of goods sold (F3) of an enterprise includes costs of purchasing machinery, raw materials, production costs of goods, labor costs, administrative expenses, etc. The cost of goods sold depends on the cost of goods contract with a supplier or type of business.
Selling expenses (F4) are expenses incurred in the process of consuming products, goods, and services of an enterprise. Selling expenses include expenses such as the cost of the sales staff, materials, packaging, tools, supplies, product warranty, outsourced services, and other monetary expenses.
Administration expenses (F5) are the expenses that an enterprise uses to operate its operations including all production and business activities of the enterprise that cannot be separated for each specific activity.
Net revenue (F6) is the income earned by the enterprise after deducting all deductions such as import and export tax, sales discounts, excise tax, returned sales, and trade discounts.
Profit after tax (F7) is the last remaining part of the production and business activities of the enterprise. Profit after tax is the amount obtained after taking total sales revenue minus all expenses for production. The product yield includes corporate income tax.
These financial indicators reflect the entire production and business situation of a textile enterprise.
In this study, the actual data source on enterprises from 2016 to 2020 is used to assess the impact of the COVID-19 pandemic on the production and business situation of Vietnamese textile and garment enterprises. To ensure the use conditions of the Super Slacks-Based Model and Malmquist Productivity Index, the sampling process used in this study is carried out based on the following conditions: identification of enterprises whose main products are textiles and garments; large-scale enterprises occupying a large share of the market; enterprises of a similar size; and businesses that have been in the industry for more than 10 years. Small businesses with very little share of the market are not used as samples in this study. Company names have been compiled and coded as shown in Table 3 below:
Data was collected and aggregated in Table 4, Table 5, Table 6, Table 7 and Table 8 below:
Vietnamese textile and garment enterprises have faced many difficulties in the production and business process. One of the factors that greatly affects the unstable situation in production is unstable human resources. In this study, the authors use a binary logistic model to solve this problem to help businesses stabilize their human resources. The binary logistic model has been used in prominent studies, such as Cristian et al. (2020), to study the factors affecting the feasibility and competitive advantage of enterprises in the field of transportation and supply chains. Their study used five independent factors: risks related to pressure on transport prices; existence of own sales department; transport carried out mainly in the EU; existence of own dispatcher department; and the usage of online transport freight exchanges, affecting the decision to choose a transport company. The results of their study indicated that the most important factor when choosing a digital freight forwarder is the existence of both sales and dispatch departments. Nguyen (2021a, 2021b) used the binary logistic model to study the factors affecting the probability of early withdrawal from deposits at a commercial bank, using three independent variables: age, educational attainment, and monthly income. The researchers identified that depositors’’ education level and age affected the decision to withdraw capital ahead of time. In this study, the binary logistic model was used to assess the factors affecting employees’ decision to change jobs in textile enterprises in Vietnam. The authors used the following factors: worker’s age (AG), education level (ED), income (IN), working seniority (SE), and distance (DI) to build a binary logistic model to help managers in textile enterprises identify the factors that affect employees’ decision to switch jobs, and the degree of impact of these factors on job-hopping decisions, helping managers in the Vietnamese textile and garment enterprises to develop appropriate personnel recruitment plans.; to choose suitable personnel for the job position and propose and implement policies that incentivize employees to remain with the enterprise for a long time, thereby stabilizing the personnel situation and to stabilize the production and business situation for the enterprise.

3. Research Methodology

3.1. Super Slacks-Based Model

DEA is a data-oriented approach to evaluate the business performance of businesses. Business performance is graded on multiple metrics. According to the DEA, these performance metrics are expressed as inputs and outputs. DEA is widely used to evaluate the business performance of manufacturing enterprises associated with production theories in economics. Besides, DEA is also used to evaluate the business performance of enterprises in service businesses and social sectors. In this study, the authors adopted the super-efficiency model of Tone (2001). The super-efficiency model can distinguish reliable efficiency scores of enterprises. This model evaluates the performance of businesses and ranks their performance. These performance scores are an important indicator of the health of the business. The super-efficiency model was introduced by Tone in fraction form as follows:
Min ρ = 1 1 m i = 1 m s i x i 0 1 + 1 s r = 1 s s r + y r 0
( s .   t :   x 0 = j = 1 n X j λ j + s ;   y 0 = j = 1 n Y j λ j s + ;   λ s ;   λ 0 ;   s 0 ;   s + 0 ) .
In the above model, the number of inputs and outputs is constant, the number of inputs and outputs always varies with scale, so the above model has been developed as follows (Tone 2001):
Min ρ = 1 1 | DI | + | UO | ( S i D I x i 0 D I + S i U O y i 0 U O ) 1 1 | DI | + | UO | ( S r D 0 y r 0 D O + S i U O y i 0 U O )
s .   t :   Y 0 D O = j = 1 n Y j D O λ j s D O ;
Y 0 U O = j = 1 n Y j U O λ j + s U O ;
X 0 D I = j = 1 n X j D I λ j + s D I ;
X 0 U I = j = 1 n X j U I λ j   s U I ;
( s U I 0 ;   s D I 0 ;   s D O 0 ;   s U O 0 ;   λ     S ) .
The units are still invariant, and the scores are in the range [0, 1]. The scientists continued their research, involving inputs and outputs that varied depending on scale, and inputted the aforementioned formula into the following model (Tone 2001):
Min ρ = 1 1 | DI | + | UO | ( S i D I x i 0 D I + S i U O y i 0 U O ) 1 1 | DI | + | UO | ( S i D 0 y i 0 D O + S i U I x i 0 U I )
s .   t :   Y 0 D O = j = 1 n Y j D O λ j s D O ;
Y 0 U O = j = 1 n Y j U O λ j s U O ;
X 0 D I = j = 1 n X j D I λ j + s D I ;
X 0 U I = j = 1 n X j U I λ j s U I ;
α Y 0 U O = j = 1 n Y j U O λ j ;
α Y 0 D O = j = 1 n Y j D O λ j ;
( s D I 0 ;   s U I 0 ;   λ 1 ;   λ S ) .
The researchers replaced X0, Y0 in Tone’s structure by P 0 ,   P 0 + . In which P 0 = x 0 z i ;   P 0 + = w r y 0 ;   ( z i = min x i j ;   w r = max y r j ) to have a super-efficiency model (24):
Min ρ = 1 1 m i = 1 m s i p i 0 1 + 1 s r = 1 s s r + p r 0 +
( s .   t :   X 0 = j = 1 n X j λ j + s ;   Y 0 = j = 1 n Y j λ j s + ;   λ s ;   s 0 ;   s + 0 ) .
The above model can be applied to the case where all inputs and outputs change at scale following the actual situation of enterprises today.

3.2. Malmquist Productivity Index

The Malmquist productivity index (M) was first introduced by Caves et al. (1982) in performance research. The Malmquist productivity index is used in economics to evaluate the performance of a business between two phases including t and t + 1. The Malmquist productivity index is the result of changes in a business’s technology in t and t + 1. Catch-up (C) measures the changes in technical efficiency in t and t + 1 of the business. Frontier-shift (F) measures the changes of technological efficiency in t and t + 1 of the business. The authors marked the efficient point of DMU0 at t is ( x 0 t ,   y 0 t ) and at t + 1 is ( x 0 t + 1 ,   y 0 t + 1 ) . The efficient point of technology of DMU0 at ( x 0 t ,   y 0 t ) the time of t with δ t [ ( x 0 ,   y 0 ) t ] , and at ( x 0 t + 1 ,   y 0 t + 1 ) in the time of t + 1 with δ t + 1 [ ( x 0 ,   y 0 ) t + 1 ] . At that time, the Malmquist productivity index is presented as:
Malmquist productivity index (M) = catch-up (C) x frontier-shift (F)
in which:
Catch - up   ( C ) ( t ,   t + 1 ) = δ t + 1 [ ( x 0 , y 0 ) t + 1 ] δ t [ ( x 0 , y 0 ) t ]
Frontier - shift   ( F ) ( t ,   t + 1 ) = [ δ t [ ( x 0 , y 0 ) t + 1 ] δ t + 1 [ ( x 0 , y 0 ) t + 1 ] × δ t [ ( x 0 , y 0 ) t ] δ t + 1 [ ( x 0 , y 0 ) t ] ] 1 2
( M ) ( t ,   t + 1 ) = [ δ t [ ( x 0 , y 0 ) t + 1 ] δ t + 1 [ ( x 0 , y 0 ) t + 1 ] × δ t [ ( x 0 , y 0 ) t ] δ t + 1 [ ( x 0 , y 0 ) t ] ] 1 2 × [ δ t + 1 [ ( x 0 , y 0 ) t + 1 ] δ t [ ( x 0 , y 0 ) t ] ]
If the indexes (C), (F), and (M) > 1, it reflects that the production and business activities of the enterprise in the period t + 1 achieved better efficiency than in the period t.
If the indexes (C), (F), and (M) = 1, it reflects that the production and business activities of the enterprise in the period t + 1 correspond to the period t.
If the indexes (C), (F), and (M) < 1, it reflects that the production and business activities of the enterprise in the period t + 1 have not been effective compared to the period t.

3.3. Binary Logistic Model

In this study, the authors studied the binary variable that is the decision to change jobs of employees in the textile and garment enterprises in Vietnam.
The Binary logistic binary regression equation has the form Christina et al. (2021):
Odds = p 1 p = probability   of   eventoccurence probabilitry   of   eventnotoccuring
Ln ( Odds ) = Ln [ p 1 p ]
Logit ( p ) = Ln [ p 1 p ] = β 0 + β 1 χ 1 + β 2 χ 2 + β 3 χ 3 + + β k χ k
Probability = { p   if   y i = 1 1 p   if   y i = 0
L ( β 0 , β ) = p ( x i ) y i [ 1 p ( x i ) ] 1 y i
L ( β 0 , β ) = y i log p ( x i ) + ( 1 y i ) log 1 p ( x i )
L ( β 0 , β ) = i = 1 n y i log [ p ( x i ) 1 p ( x i ) ] + i = 1 n log 1 p ( x i )
L ( β 0 , β ) = i = 1 n y i ( β 0 + x i β ) + i = 1 n log 1 + e β 0 + x i β
To study and evaluate the factors affecting the decision to change jobs by employees in the textile and garment enterprises in Vietnam, the authors studied the job change decisions through two expressions: the case where the employee does not jump is coded to 0, and the case where the employee does jump is coded to 1.

4. Results

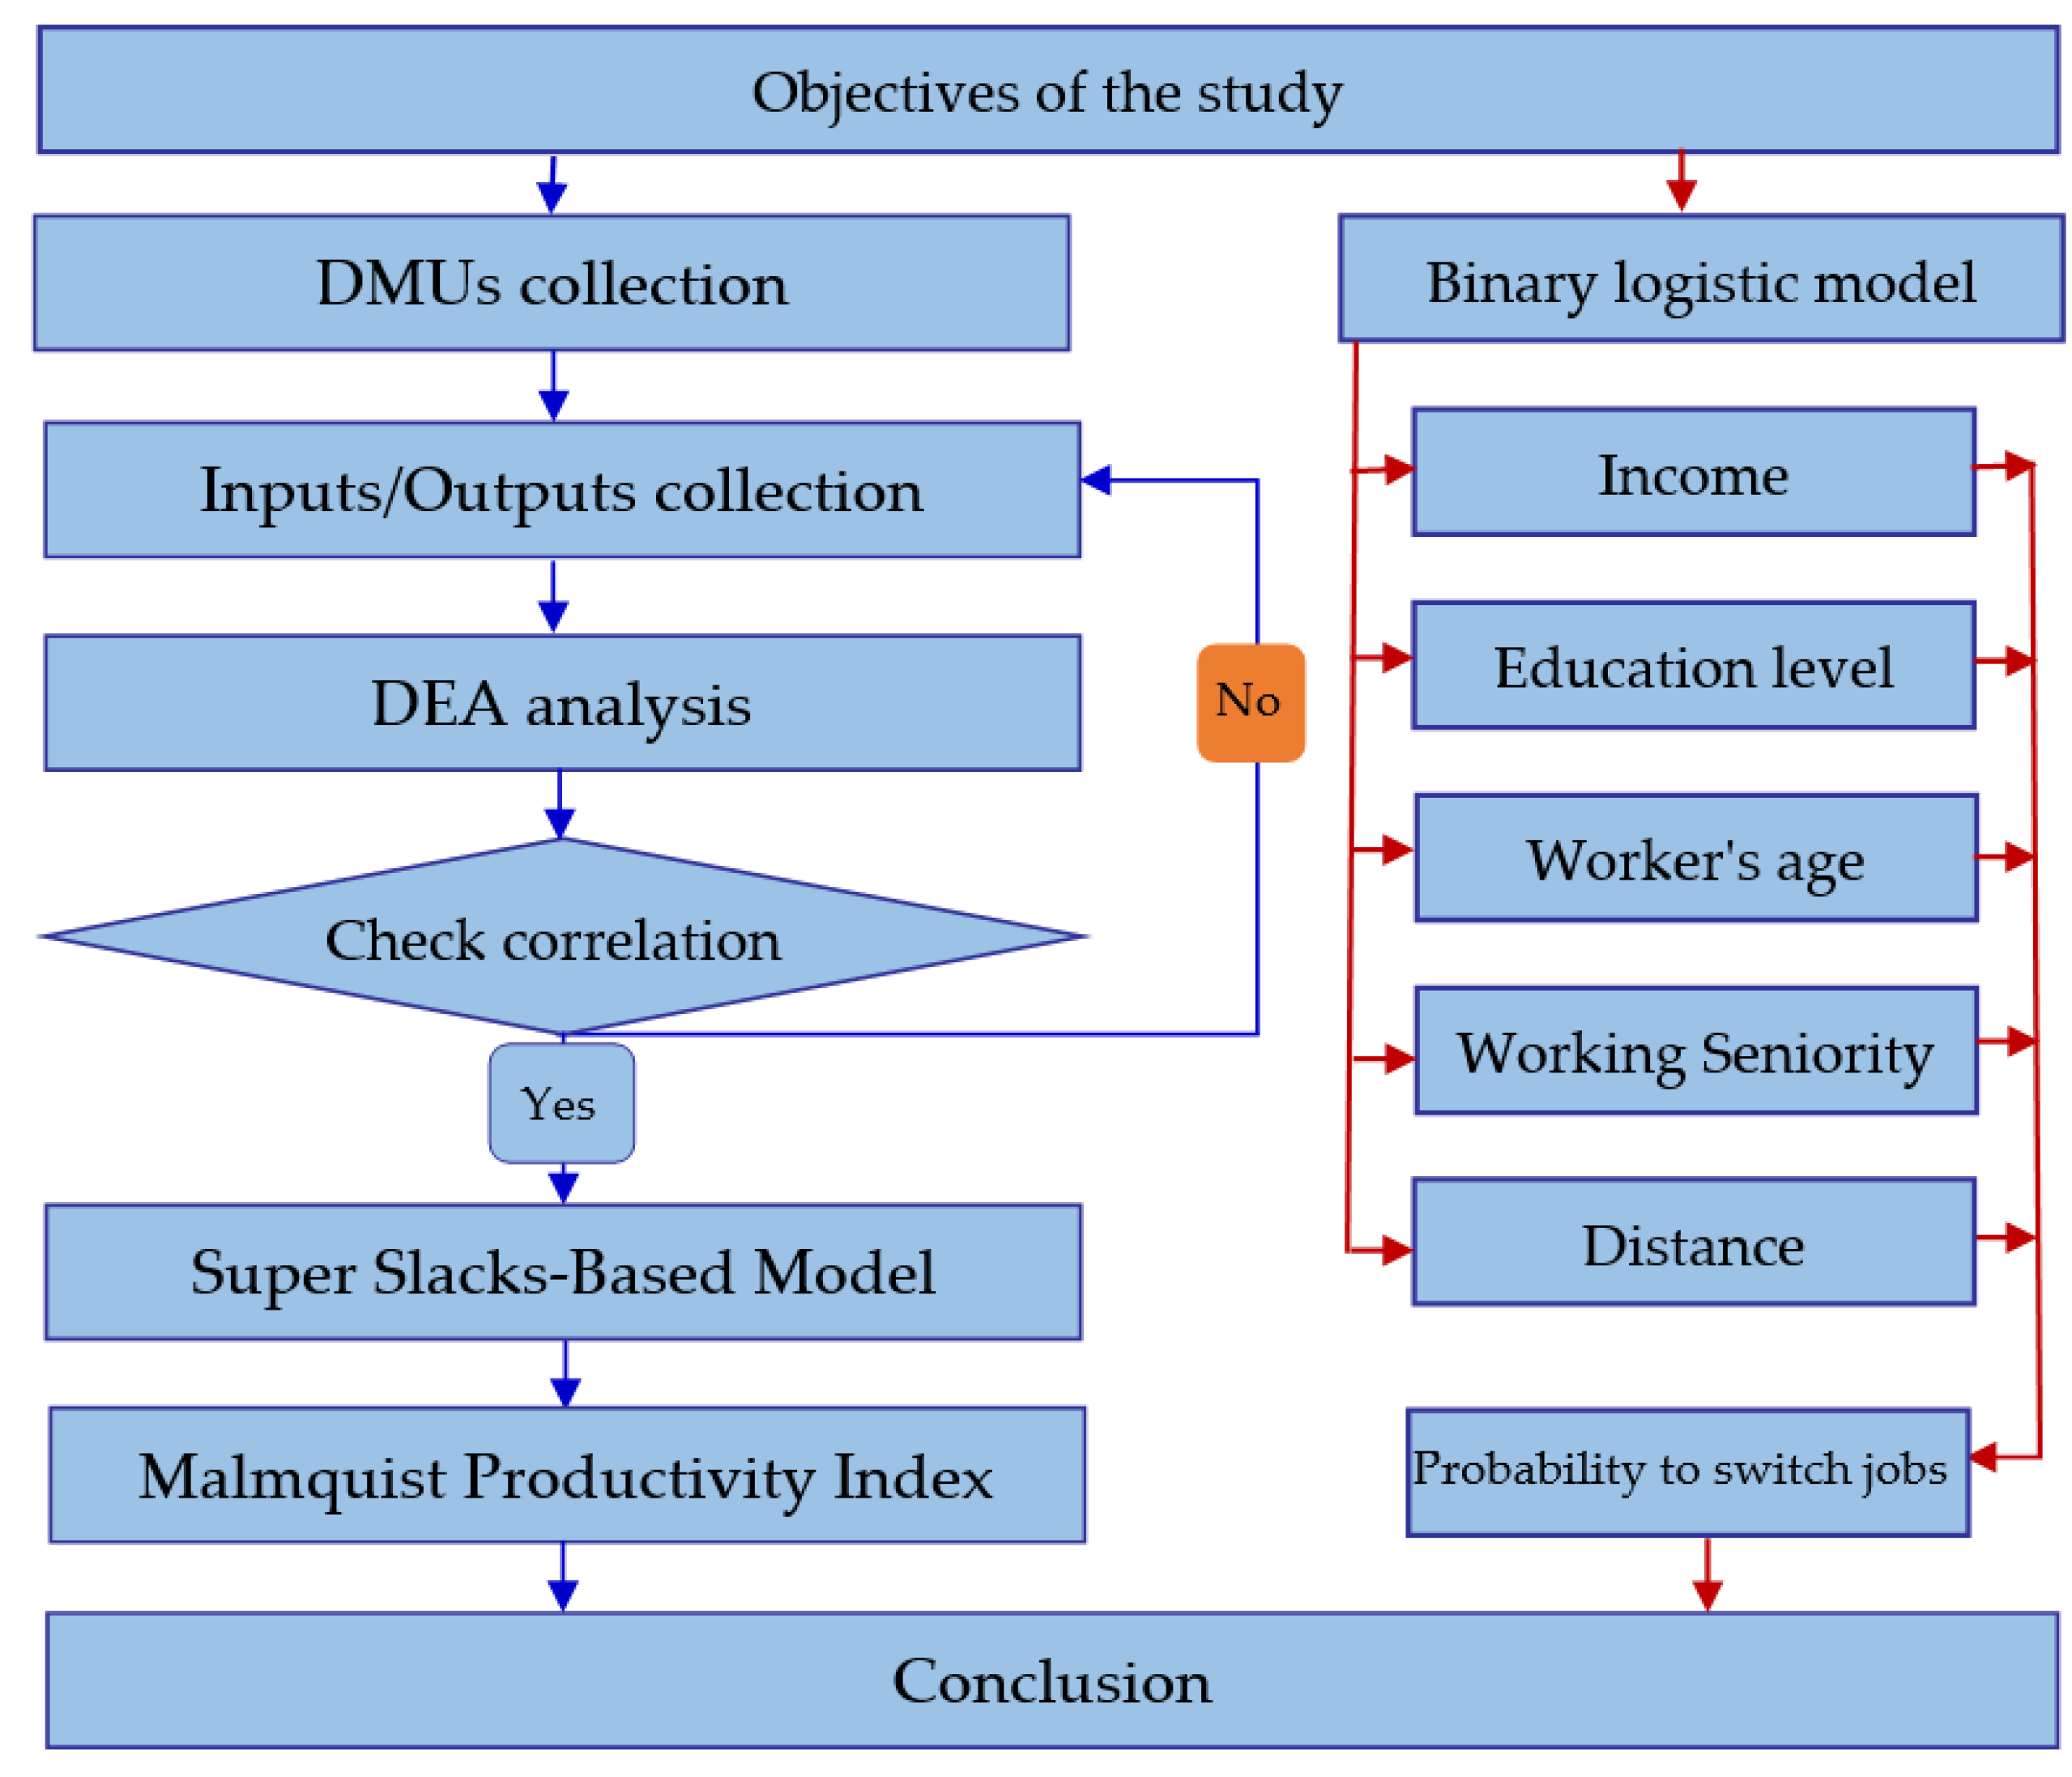
4.1. Super Slacks-Based Model Results

The Pearson correlation is the condition when using the DEA model that the inputs and outputs must be correlated. The correlation coefficient has a value in the range [−1, 1]. If the value of the correlation coefficient in the range [−1, 0) reflects the negative correlation between the factors, and if the value of the correlation coefficient in the range (0, 1] reflects the positive correlation between the factors, together, a coefficient of zero (0) reflects that the factors have no correlation. The results of the correlation coefficient test in this study are shown in Table 9 and Table 10 below:
The results of the correlation coefficient shown in Table 9 and Table 10 obtained from the DEA model in this study have positive values (>0). That reflects that the factors used for analysis in this study were positively correlated with each other. That is, when the value of one element increases, the value of the other also increases; when the value of one element decreases, the value of the other also decreases. In particular, the results in the above tables show that the correlation coefficients in this study all have results greater than 0.7 (some results of correlation coefficient equal to 1) that reflect that the factors used in this study are strongly correlated. This means that any change in one factor will affect the change in another. Therefore, the use of these factors in the analysis and assessment of the impact of the COVID-19 pandemic on the production and business situation in the Vietnamese textile and garment enterprises between 2016–2020 was appropriate and highly reliable.
The results of Table 11, also obtained from the DEA model, showed that the ranking of Vietnam’s textile and garment enterprises fluctuated substantially in the rankings in the period 2016–2020. Among them, DMU5 was the enterprise with the most stable production and business situation and always maintained its leading position during the research period: Score DMU5 2016 = 2.6509; Score DMU5 2017 = 2.8658; Score DMU5 2018 = 2.6672, Score DMU5 2019 = 2.9824, Score DMU5 2020 = 2.7074. DMU3, furthermore, was able to stabilize the production and business situation of its enterprise during this period: Score DMU3 2016 = 1.3071, Score DMU3 2017 = 1.2385, Score DMU3 2018 = 1.1859, Score DMU3 2019 = 1.4924, Score DMU3 2020 = 1.4681. Some businesses had large fluctuations in their production and business situation, especially those that were greatly affected by the COVID-19 pandemic. This was reflected in the rankings of these businesses moving from the top in the rankings and then falling to the bottom. DMU11: Rank DMU11 2016 = 2; Rank DMU11 2017 = 4; Rank DMU11 2018 = 4, Rank DMU11 2019 = 6, Rank DMU11 2020 = 9. Besides, several businesses were significantly affected by the COVID-19 pandemic. DMU12: Rank DMU12 2016 = 3; Rank DMU12 2017 = 2; Rank DMU12 2018 = 3, Rank DMU12 2019 = 4, Rank DMU12 2020 = 10. The serious impacts of the COVID-19 pandemic on Vietnam’s textile and garment industry included declines in sales due to the large-scale forced closure of stores and delays in the export of goods. Strict social distancing regulations also impacted overall textile sales. Since then, it has become apparent that the COVID-19 pandemic greatly affected the production and business conditions of textile and garment enterprises in Vietnam in the 2016–2020 period.

4.2. Malmquist Productivity Index Results

In this study, the authors use the Malmquist productivity index to evaluate the business performance of Vietnamese textile and garment enterprises in the period 2016–2020. The catch-up index reflected the efficiency of technical investment in the industries. The frontier index reflected the efficiency of technology investment in textile enterprises, The Malmquist productivity index reflected the production and business efficiency of textile enterprises from 2016–2020.
The catch-up index results shown in Table 12 reflect the technical efficiency of investment in Vietnam’s textile enterprises in the period 2016–2020. Vietnam’s textile and garment enterprises maintained their technical efficiency during this period and were less affected by the COVID-19 pandemic. In the field of textiles and garments, the techniques of product design, methods of testing and evaluating the quality of textile products, methods of organization, and management of industrial garment production played an important role in the business. However, the research results showed that during this period, textile and garment enterprises in Vietnam maintained their technical efficiency. This was a good signal for Vietnamese textile and garment enterprises because maintaining technical efficiency is the foundation for enterprises to continue to invest in technology in the next period, to develop products of high quality, and to help businesses develop sustainably in the future.
The index reflecting the efficiency of the technology investment in textile and garment enterprises is shown in Table 13. Some enterprises were technologically efficient in the 2016–2020 period such as DMU3, and DMU6. The technology indexes of these enterprises were obtained as follows:
FDMU3 (2017–2018) = 1.1953; FDMU3 (2018–2019) = 1.1588; FDMU3 (2019–2020) = 1.0030.
FDMU6 (2017–2018) = 1.1790; FDMU6 (2018–2019) = 1.0017; FDMU6 (2019–2020) = 1.1308.
However, several textile and garment enterprises were severely affected by the COVID-19 pandemic, making the investment in enterprise technology ineffective. Specifically: DMU4, DMU5, DMU7, DMU9, and DMU11 had inefficient use of technology; The technology index of these enterprises is:
FDMU4 (2017–2018) = 1.1130; FDMU4 (2018–2019) = 1.0084; FDMU4 (2019–2020) = 0.7832.
FDMU5 (2017–2018) = 1.1445; FDMU5 (2018–2019) = 1.0237; FDMU5 (2019–2020) = 0.7122.
FDMU7 (2017–2018) = 1.2378; FDMU7 (2018–2019) = 0.9949; FDMU7 (2019–2020) = 0.7228.
FDMU9 (2017–2018) = 1.4965; FDMU9 (2018–2019) = 1.3437; FDMU9 (2019–2020) = 0.4645.
FDMU11 (2017–2018) = 1.3901; FDMU11 (2018–2019) = 0.7634; FDMU11 (2019–2020) = 0.6282.
Technology played a huge role in helping businesses change production methods, altering the entire value chain of textile products, from product research to product development, which helps reduce production costs, transportation costs, and increases labor productivity, production, and the business efficiency of textile and garment enterprises. However, the results showed that from 2019 to 2020, Vietnam’s textile and garment enterprises were severely affected by the COVID-19 pandemic. Using technology to improve efficiency was ineffective in textile and garment enterprises during this period.
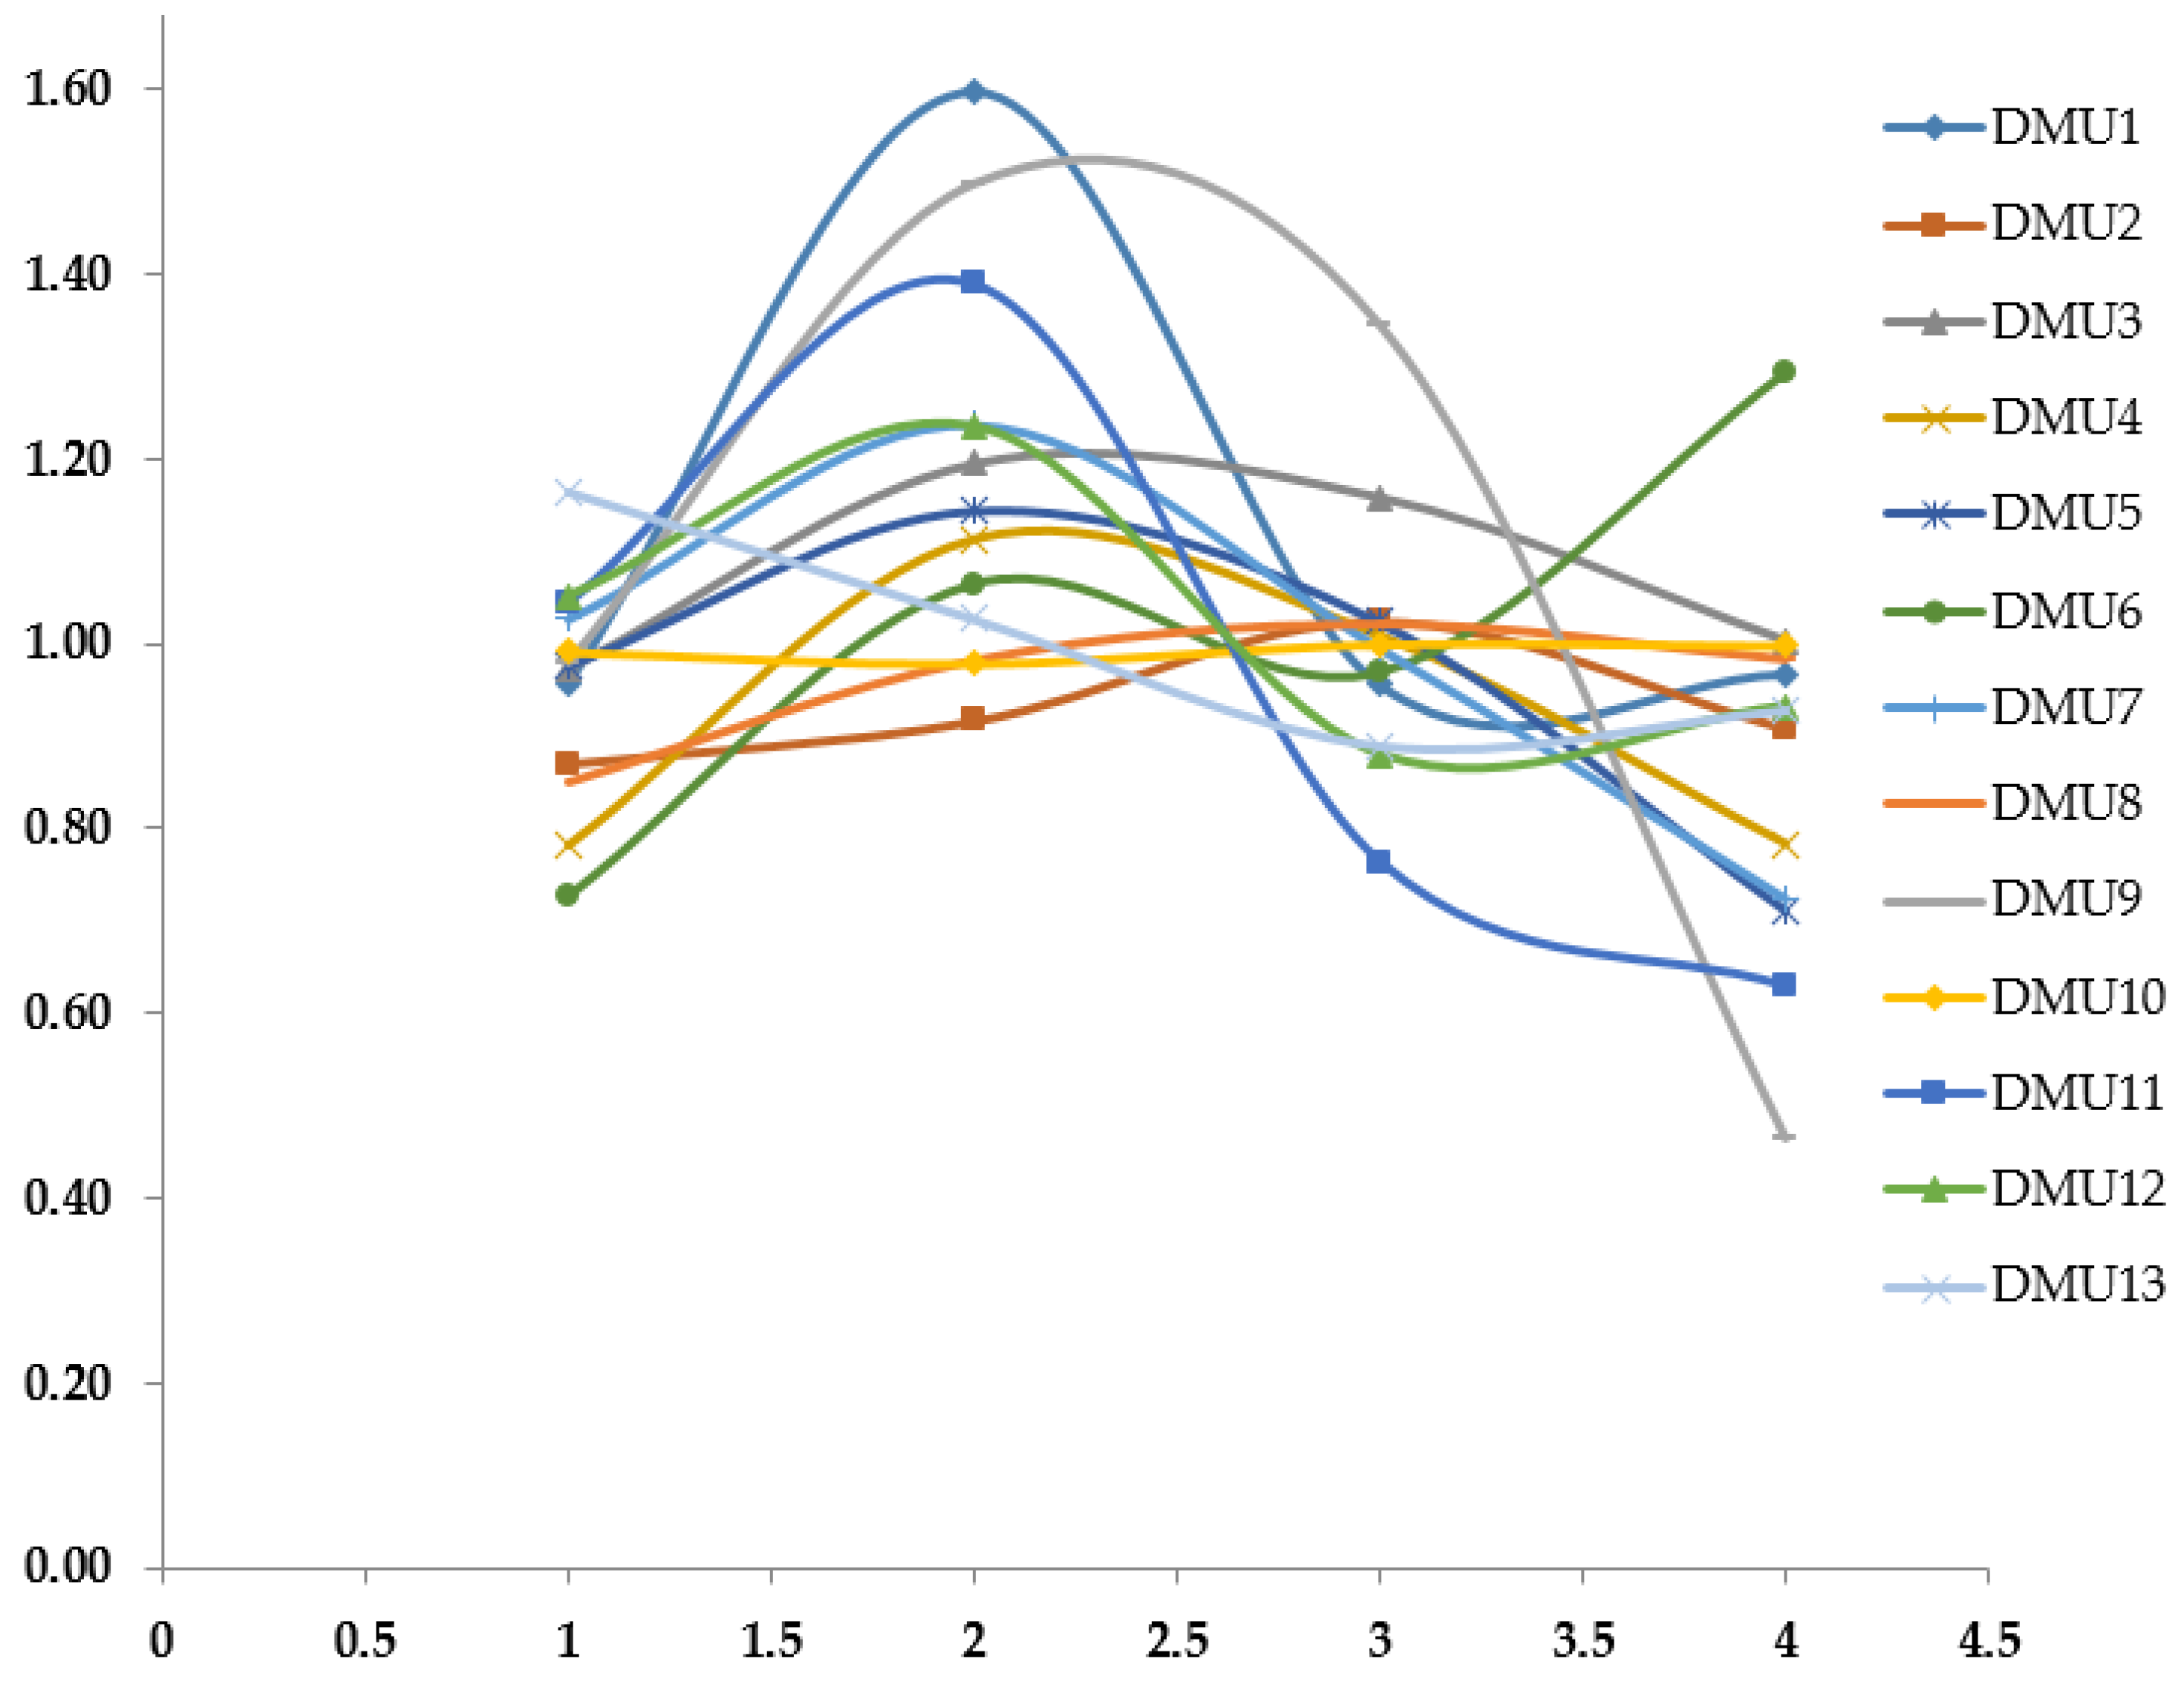
The results of the malmquist productivity index, shown in Table 14 and Figure 6, revealed that during the height of the pandemic, DMU5, DMU7, DMU9, DMU11, DMU12, and DMU13 were seriously distressed, with no signs that production and business situations were going to recover. In particular, the production and business efficiency scores of these enterprises were affected. These scores were MDMU5 (2017–2018) = 1.1445; MDMU5 (2018–2019) = 1.0237; MDMU5 (2019–2020) = 0.7122. This result showed that before the COVID-19 pandemic, business performance was good (M = 1.1445), but at the end of 2019 when the COVID-19 pandemic occurred, business performance had declined to M = 1.0237. Then as COVID-19 began to spread rapidly in Vietnam and around the world, business dropped precipitously to M = 0.7122. The results are also reflected in DMU5’s revenue index in 2019 of 210,217.91 (1000 USD), which decreased to 174,843.00 (1000 USD) in 2020. As a result, revenue decreased by 17%, making profit 42% lower than that of DMU5 prior to the COVID-19 pandemic.
MDMU7 (2017–2018) = 1.2378; MDMU7 (2018–2019) = 0.9949; MDMU7 (2019–2020) = 0.7228. This result reflects that before the COVID–19 pandemic, business performance was good (M = 1.2378), but at the end of 2019 when COVID-19 had spread in China, business performance decreased (M = 0.9949). As the pandemic spread in Vietnam and the world, business results dropped dramatically (M = 0.7228). The results are also reflected in the revenue index of DMU7 in 2019, which is 184,939.43 (1000 USD), down to 141,576.70 (1000 USD) in 2020. As a result, revenue decreased by 23%, and profit decreased by 47% compared to before the pandemic.
MDMU9 (2017–2018) = 1.4965; MDMU9 (2018–2019) = 1.3437; MDMU9 (2019–2020) = 0.4645. This result reflects that before the COVID-19 pandemic, business performance was good (M = 1.4965), but at the end of 2019 when the COVID-19 pandemic began, business performance decreased (M = 1.3437). As the pandemic ran rampant in 2020, business results dropped even further (M = 0.4645). For example, DMU9 was an enterprise that before COVID-19 was well-situated (M = 1.4965). But DMU9 was hard hit by the COVID-19 pandemic (M = 1.4965). The results are also reflected in DMU9’s revenue index in 2019 of 191,793.61 (1000 USD), which decreased to 165,800.39 (1000 USD) in 2020. As a result, revenue decreased by 14% and profit decreased by 48% compared to before the pandemic.
Textile enterprises, in particular, faced many difficulties during the pandemic. To maintain production, business activities, and labor participation, textile enterprises had to rearrange production lines and factories, and streamline stages in the production process. Workers left textile and garment enterprises to go to other jobs. Until the COVID-19 epidemic has been brought under control and the market recovers, it will be difficult to entice them back to resume production. To overcome difficulties, textile and garment enterprises have had to actively regulate production and, at the same time, acquire the flexibility to adjust production orders following delivery time and the number of employees on leave to stabilize production and business.

4.3. Binary Logistic Model Results

The textile and garment industry depends greatly on the skills of its well-trained workers to improve product quality and productivity. However, workers in these enterprises change jobs often, creating some human resource instability, which has a substantial impact on garment enterprises. In this study, the authors used a Binary logistic model to find the factors affecting the job-hopping phenomenon in Vietnamese textile and garment enterprises. From there, managers in Vietnamese textile and garment enterprises must recruit the right people for positions in the enterprise and have a strong employee retention policy in effect.
To learn about the factors affecting the decision of employees to change jobs in textile and garment enterprises, the authors surveyed 686 employees working in textile enterprises (shown in Table 15). The survey participants provided sufficient information and met the requirements of the survey, and no survey participants provided insufficient information. Therefore, this data source was achieved with high reliability and accuracy in the analysis according to the Binary logistic model.
The results in Table 16 show that the binary logistic model used in this study is statistically significant because of Sig.Step = 0.000; Sig.Block = 0.000; Sig.Model = 0.000 (<0.05). Therefore, the results from the study are completely reliable to analyze and evaluate the factors affecting the job change of employees in the textile enterprises in Vietnam.
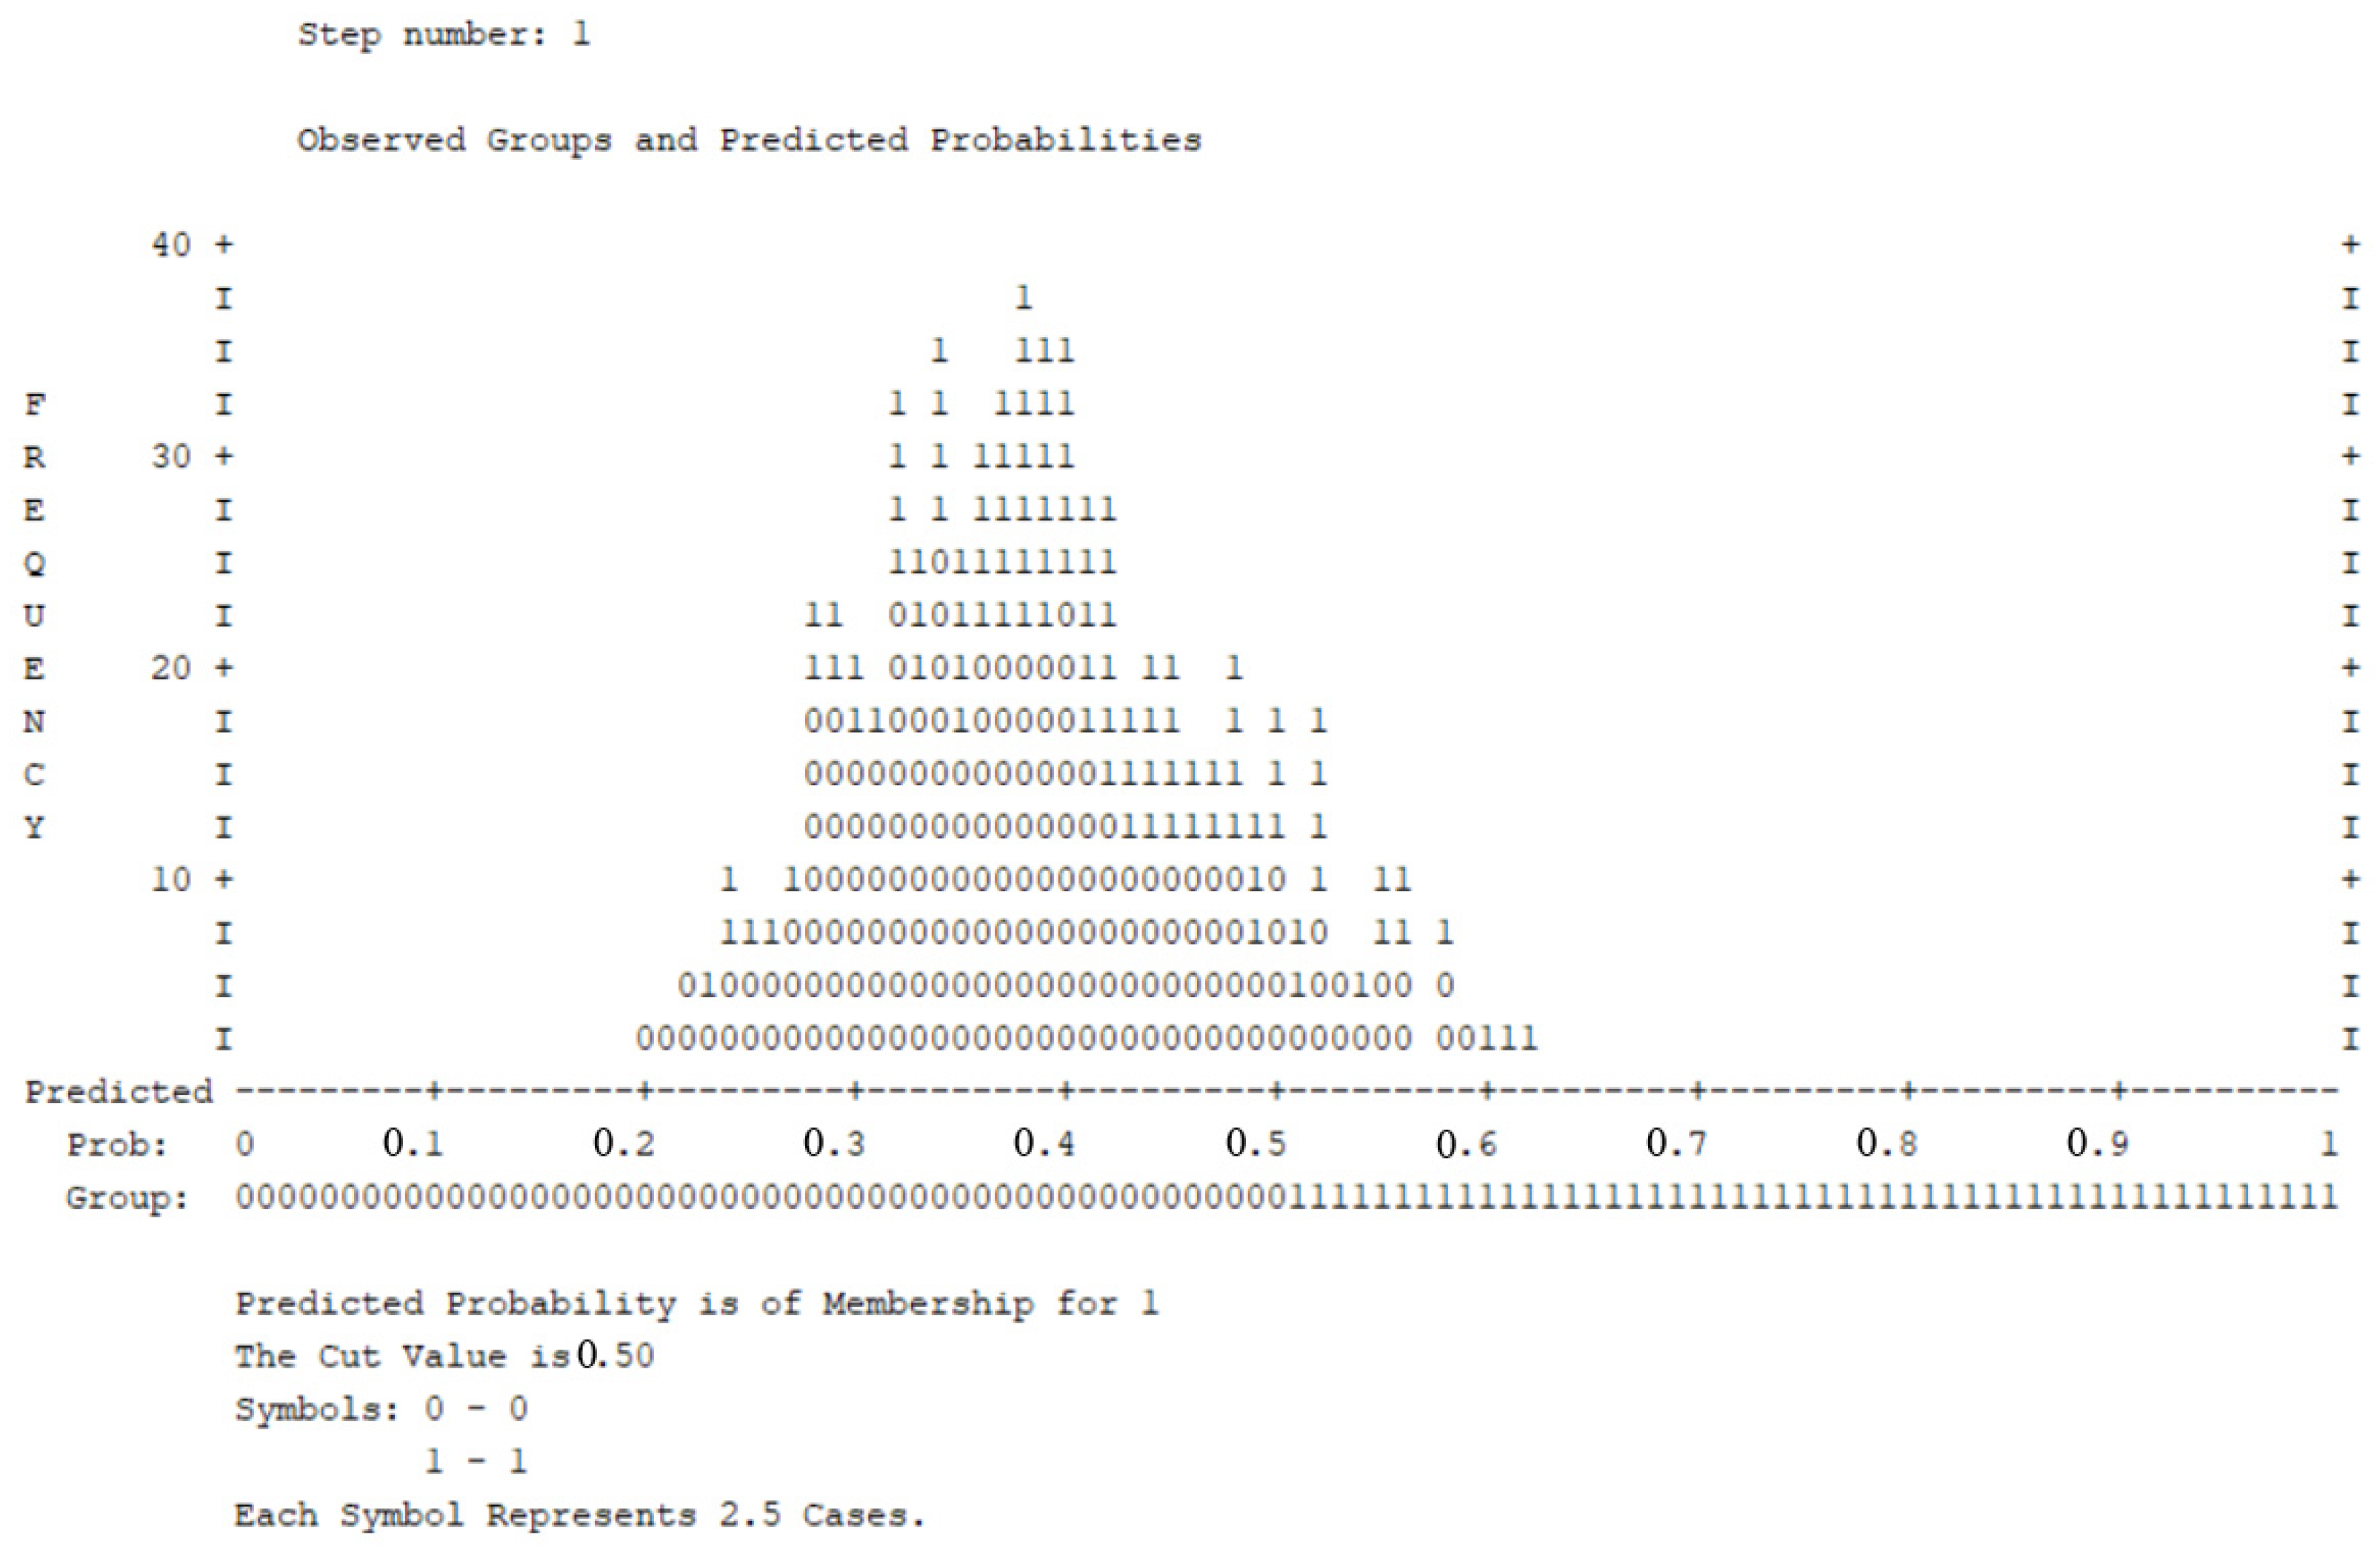
The 686 people surveyed in this study were divided into two criteria: No job-hopping (0) and job-hopping (1). Of the 423 people who did not change jobs, it is estimated that 387 people in the process of working did not change jobs. The odds of correct prediction are 91.5%. Out of the 263 job-hopping people, the correct prediction rate is 13.8%. The average correct predictive result for both subjects was 61.13% job-hopping and no job-hopping (show in Table 17 and Figure 7).
The results of Table 18 show that, out of the five surveyed factors, the Sig coefficients of four factors are: Sig.AG = 0.004; Sig.ED = 0.014; Sig.IN = 0.049; Sig.SE = 0.045 (<0.05). This result reflects that the factors AG, ED, IN, SE had an impact on the decision to change jobs in the textile enterprises. Coefficient Sig.DI = 0.726 > 0.05. This reflects that it was not reliable enough to confirm that the DI factor had an impact on the decision to change jobs of employees in the textile and garment enterprises in Vietnam. All coefficients VIF < 2, showing that the factors AG, ED, IN, SE, DI used in this study do not have multicollinearity (these variables are not linearly dependent on each other).
According to the results of Table 18, the authors built a Binary logistic model that reflected the factors that affected the decision to change jobs of employees in the textile and garment enterprises in Vietnam:
log e = [ P i 1 P i ] = 1.172 0.033 AG + 0.139 ED   0.35 IN   + 0.056 SE
The binary logistic model showed that two factors, ED and SE, of employees had a positive correlation to the decision to switch jobs. Thus, the more educated the workers were, the more they sought new environments to have the opportunity to practice and develop their capabilities and earn higher incomes. Therefore, the more experienced workers in the textile and garment industry brought a higher risk of turnover, reflecting a real problem in today’s society and economy. The employees with long-term experience in the textile industry are recruited by many other textile enterprises with attractive policies and salaries, which has stimulated their job-hopping. The results show that, for workers with high income and high age, the probability of changing jobs is low. From the results of this study, the author proposes solutions to help textile enterprises achieve stability in the post-pandemic period.
Human resources: It is necessary to recruit workers with professional qualifications suitable to the employment positions of enterprises. Develop appropriate salary and remuneration policies to maintain stable human resources, production and business. This gives the company a competitive advantage. Moreover, it is necessary to provide managerial and technical talent in textile enterprises with appropriate knowledge to improve labor productivity.
Technology: Research and apply new technologies from developed countries, including environmentally-friendly materials, to create new products that are suitable for the needs of current customers. Apply simulation technologies to manage design, production, and quality of textile and garment products. Focus on automation technology to save time and costs and create a foundation for adapting to the fast-changing trends of the market post-pandemic.
Supply chains: It is necessary to link raw material suppliers, textile accessory suppliers, manufacturing enterprises, and product distribution businesses to form a closed-loop supply chain, stabilizing the production and consumption situation.
The modeling method used in this study reflected the main factors affecting the production and business results of the textile and garment enterprises in reality. The use of these models can be extended to consider and evaluate other factors in the business activities of textile enterprises to help managers have a multidimensional view and propose optimal solutions for businesses, thereby helping businesses stabilize production and achieve strategic goals.

5. Conclusions and Discussion

5.1. Conclusions

In this study, the Malmquist Productivity Index results showed that, from 2016 to 2020, textile and garment enterprises achieved technical efficiency, but their technological efficiency and business results were not very good. The results from the Super Slacks-Based Model show the continuous change in business rankings, indicating that Vietnam’s textile and garment market is a potential market with fierce competition. Therefore, each business needs to focus on the main product to increase its share in the market. In addition, the results from the Binary Logistic Model help managers in textile enterprises to select suitable job positions to stabilize the human resource situation for the business. Due to product characteristics in the textile industry, which are directly processed by workers, the availability of human resources in textile enterprises has a major influence on product quality, production, and the business situation of enterprises. The labor competition among enterprises in the industry and between textile enterprises and other fields is very fierce. Furthermore, when foreign enterprises invest in the textile and garment industry, they have an advantage because they attract good workers by giving them high salaries, and they have attractive remuneration policies. These include both skilled laborers and middle-level managers such as line leaders and vice presidents, group leaders and deputies. The main reason workers change jobs in the textile industry is for higher incomes, a better working environment, and development opportunities. When faced with these situations, managers in enterprises should invest in more automated machinery to replace the reduced number of workers and, at the same time, train workers to improve their skills and productivity. To prepare for the shortage of labor post-COVID-19, each textile and garment enterprise needs to be innovative in its management and invest in new machinery, equipment, and technology to automate the production process. In addition, managers must implement a more lucrative remuneration policy, creating a stable source of income to attract and maintain employees.

5.2. Discussion

Based on the results of this study, managers in textile and garment enterprises can develop recruitment criteria suitable for each job position and have binding conditions to ensure employees work. Having a long-term relationship with the enterprise helps to stabilize the enterprise and improve the efficiency of production and of the business. In addition, government regulatory agencies can use the results of the pandemic impact assessment model in this study to propose solutions that help textile and garment enterprises to restore production and development post-pandemic.
The decision to change jobs often depends on many variables such as seasonal factors and psychological factors. The business performance of enterprises also depends on the state’s law and tax policies. Therefore, this study has some limitations. The authors have not considered the seasonal factors, psychological factors, and demographic factors affecting the decision of workers in the textile industry to change jobs. The research methods have not been combined with the tax policy conditions or the legal policies related to the textile industry. In the future, the authors will focus on combining these factors to provide managers with the best solutions to help textile enterprises stabilize their socio-economic situation.

Author Contributions

H.-K.N. contributed to analyzed the data and wrote; M.-N.V. contributed to wrote and formatted. All authors have read and agreed to the published version of the manuscript.

Funding

This research received no external funding.

Data Availability Statement

Not applicable.

Conflicts of Interest

The authors declare no conflict of interest.

References

  1. Abbas, Muhammad, Rayan S. Hammad, Mohamed Fathy Elshahat, and Toseef Azid. 2015. Efficiency, productivity and Islamic banks: An application of DEA and Malmquist index. Humanomics 31: 118–31. [Google Scholar] [CrossRef]
  2. Aparicio, Juan. 2016. A survey on measuring efficiency through the determination of the least distance in data envelopment analysis. Journal of Centrum Cathedra 9: 143–67. [Google Scholar] [CrossRef] [Green Version]
  3. Ashuri, Baabak, Jun Wang, Mohsen Shahandashti, and Minsoo Baek. 2019. A data envelopment analysis model for building energy benchmarking. Journal of Engineering, Design and Technology 17: 747–68. [Google Scholar] [CrossRef]
  4. Caves, Douglas W., Laurits R. Christensen, and W. Erwin Diewert. 1982. Multilateral Comparisons of Output, Input, and Productivity Using Superlative Index Numbers. The Economic Journal 92: 73–86. [Google Scholar] [CrossRef]
  5. Christina, Ng, Susilawati Susilawati, Abdus Samad Kamal, and Irene Chew Mei Leng. 2021. Macroscopic Lane Change Model—A Flexible Event-Tree-Based Approach for the Prediction of Lane Change on Freeway Traffic. Smart Cities 4: 864–80. [Google Scholar] [CrossRef]
  6. Cristian, Negrutiu, Cristinel Vasiliu, and Calcedonia Enache. 2020. Sustainable Entrepreneurship in the Transport and Retail Supply Chain Sector. Journal of Risk and Financial Management 13: 267. [Google Scholar] [CrossRef]
  7. Fujii, Hidemichi, Shunsuke Managi, and Roman Matousek. 2014. Indian bank efficiency and productivity changes with undesirable outputs: A disaggregated approach. Journal of Banking & Finance 38: 41–50. [Google Scholar] [CrossRef] [Green Version]
  8. Hai, Yen. 2019. Export Surplus of 16.6 Billion USD, Vietnam’s Textile and Garment Exports Ranked 3rd in the World. Investment. December 16. Available online: https://baodautu.vn/ (accessed on 27 May 2021).
  9. Kwon, He Boong. 2014. Performance modeling of mobile phone providers: A DEA-ANN combined approach. Benchmarking: An International Journal 21: 1120–44. [Google Scholar] [CrossRef]
  10. Le, Tien Truong. 2019. Vietnam’s Textile and Garment Industry Before the Impact of the Industrial Revolution 4.0. Communist Magazine. November 18. Available online: https://www.tapchicongsan.org.vn/ (accessed on 17 May 2021).
  11. Le, Tien-Muoi, Chia-Nan Wang, and Han-Khanh Nguyen. 2020. Using the optimization algorithm to evaluate and predict the business performance of logistics companies—A case study in Vietnam. Applied Economics 52: 4196–212. [Google Scholar] [CrossRef]
  12. Lee, Yong Joo, Seong-Jong Joo, and Hong Gyun Park. 2017. An application of data envelopment analysis for Korean banks with negative data. Benchmarking: An International Journal 24: 1052–64. [Google Scholar] [CrossRef]
  13. Lin, Tzu-Yu, and Sheng-Hsiung Chiu. 2013. Using independent component analysis and network DEA to improve bank performance evaluation. Economic Modelling 32: 608–16. [Google Scholar] [CrossRef]
  14. Linh, Mai. 2020. Seize Investment Opportunities in Vietnam’s Textile and Garment Industry. Vietnam Report. August 11. Available online: https://vietnamreport.net.vn/ (accessed on 27 May 2021).
  15. Mahdiloo, Mahdi, Abdollah Noorizadeh, and Reza Farzipoor Saen. 2014. Benchmarking suppliers’ performance when some factors play the role of both inputs and outputs: A new development to the slacks-based measure of efficiency. Benchmarking: An International Journal 21: 792–813. [Google Scholar] [CrossRef]
  16. Nguyen, Han-Khanh. 2020. Combining DEA and ARIMA Models for Partner Selection in the Supply Chain of Vietnam’s Construction Industry. Mathematics 8: 866. [Google Scholar] [CrossRef]
  17. Nguyen, Han Khanh. 2021a. Application of Mathematical Models to Assess the Impact of the COVID-19 Pandemic on Logistics Businesses and Recovery Solutions for Sustainable Development. Mathematics 9: 1977. [Google Scholar] [CrossRef]
  18. Nguyen, Han-Khanh. 2021b. Applications Optimal Math Model to Solve Difficult Problems for Businesses Producing and Processing Agricultural Products in Vietnam. Axioms 10: 90. [Google Scholar] [CrossRef]
  19. Nguyen, Thanh. 2019. The US-China Conflict had A Strong Impact, Textile Exports “Missed” 40 Billion USD. Business and Customs. December 3. Available online: https://haiquanonline.com.vn/ (accessed on 27 May 2021).
  20. Omondi-Ochieng, Peter. 2021. Financial performance of the United Kingdom’s national non-profit sport federations: A binary logistic regression approach. Managerial Finance 47: 868–86. [Google Scholar] [CrossRef]
  21. Pourmahmoud, Jafar, and Maedeh Gholam Azad. 2021. Data envelopment analysis using the binary-data. Journal of Modelling in Management. [Google Scholar] [CrossRef]
  22. Quynh, Trang. 2021. Textile is Expected to Recover. Bank Times. April 21. Available online: https://thoibaonganhang.vn/ (accessed on 27 May 2021).
  23. Sanchez-Varela, Zaloa, David Boullosa-Falces, Juan Luis Larrabe Barrena, and Miguel A. Gomez-Solaeche. 2021. Prediction of Loss of Position during Dynamic Positioning Drilling Operations Using Binary Logistic Regression Modeling. Journal of Marine Science and Engineering 9: 139. [Google Scholar] [CrossRef]
  24. Seiford, Lawrence M., and Joe Zhu. 1999. Profitability and Marketability of the Top 55 U.S. Commercial Banks. Management Sciences 45: 1270–88. [Google Scholar] [CrossRef] [Green Version]
  25. Seth, Himanshu, Saurabh Chadha, Satyendra Kumar Sharma, and Namita Ruparel. 2021. Exploring predictors of working capital management efficiency and their influence on firm performance: An integrated DEA-SEM approach. Benchmarking: An International Journal 28: 1120–45. [Google Scholar] [CrossRef]
  26. Statistics. 2021. General Statistics Office of Vietnam. Available online: https://www.gso.gov.vn (accessed on 27 May 2021).
  27. Synthetic BSC. 2021. Vietnam Textile and Garment Industry Report 2021. Bank for Investment and Development of Vietnam. March 18. Available online: http://static1.vietstock.vn/ (accessed on 27 May 2021).
  28. Tamatam, Roopteja, Pankaj Dutta, Goutam Dutta, and Stefan Lessmann. 2019. Efficiency analysis of Indian banking industry over the period 2008–2017 using data envelopment analysis. Benchmarking: An International Journal 26: 2417–42. [Google Scholar] [CrossRef]
  29. To, Uyen. 2019. The Textile and Garment Industry Missed the Export Date of 40 Billion USD but Still Increased in Quality. Financial Times. December 3. Available online: http://thoibaotaichinhvietnam.vn/ (accessed on 27 May 2021).
  30. Tone, Kaoru. 2001. A slacks-based measure of efficiency in data envelopment analysis. European Journal of Operational Research 130: 498–509. [Google Scholar] [CrossRef] [Green Version]
  31. Vietstock Finance. 2021. Industry Outlook Is Good but Stock Price Is Not Attractive. Finance and Life. June 29. Available online: https://fili.vn/ (accessed on 17 August 2021).
  32. Virginia, M. Miori, Campbell Garwood Kathleen, and Cardamone Catherine. 2017. Forecasting Treatment Outcomes for the Futures Drug and Alcohol Rehabilitation Center. Advances in Business and Management Forecasting 12: 31–60. [Google Scholar] [CrossRef]
  33. Wang, Chia Nan, Hong Xuyen Thi Ho, Shih Hsiung Luo, and Tsung Fu Lin. 2017a. An Integrated Approach to Evaluating and Selecting Green Logistics Providers for Sustainable Development. Sustainability 9: 218. [Google Scholar] [CrossRef] [Green Version]
  34. Wang, Chia-Nan, Nguyen Han-Khanh, and Liao Ruei-Yuan. 2017b. Partner Selection in Supply Chain of Vietnam’s Textile and Apparel Industry: The Application of a Hybrid DEA and GM (1,1) Approach. Mathematical Problems in Engineering 2017: 7826840. [Google Scholar] [CrossRef] [Green Version]
  35. Wong, Wail Peng, and Yew Kuan Wong. 2007. Supply chain performance measurement system using data envelopment analysis modeling. Industrial Management & Data Systems 107: 361–81. [Google Scholar] [CrossRef]
  36. Yu, Ming Miin, Chung-I Lin, Kuan Chen Chen, and Li Hsueh Chen. 2021. Measuring Taiwanese bank performance: A two-system dynamic network data envelopment analysis approach. Omega 98: 102145. [Google Scholar] [CrossRef]
Figure 1. Vietnam’s textile and garment export turnover (Synthetic BSC 2021).
Jrfm 14 00465 g001
Figure 2. Export growth of textile and garment industry and GDP growth of Vietnam (Vietstock Finance 2021).
Jrfm 14 00465 g002
Figure 3. Export turnover of textiles 2017–2019 (Unit: million USD) (Hai 2019).
Jrfm 14 00465 g003
Figure 4. Export share of Vietnam’s textile and garment industry in 2019 (To 2019).
Jrfm 14 00465 g004
Figure 5. Research process.
Jrfm 14 00465 g005
Figure 6. Malmquist index results.
Jrfm 14 00465 g006
Figure 7. Observed groups predicted probabilities.
Jrfm 14 00465 g007
Table 1. The variables of the regression model.
CodeDescriptionKind of Variables
PMPossibility to change jobsDependent
AGWorker’s age (age to present)Independent
EDEducation level (years of schooling)Independent
INIncome (monthly income in million VND)Independent
SEWorking seniority (years)Independent
DIDistance (kilometers)Independent
Table 2. Factors used in previous studies.
No.AuthorsInput FactorsOutput FactorsNumber of DMUs
1Seiford and Zhu (1999)Number of employees; Total assets; EquityTurnover; Profit55
2Lin and Chiu (2013)Fixed assets; Operating expense; CapitalNon-interest income;
Interest income; Profit
30
3Fujii et al. (2014)Employees; Deposits; Fixed assetsAcquired assets; Customer loans; Bad loans24
4Wang et al. (2017a)Owner’s equity; Total assets; Cost of goods sold; Total operating expensesNet sales;
Profit after tax
16
5Wang et al. (2017b)Total assets; Cost of sold capital; Financial expenses; General and administration expensesRevenue of sales;
Profit after tax
18
6Han Khanh Nguyen (2020)Total assets; Owners’ equity; Cost of goods sold; Total operating expensesNet sales;
Profit after tax
14
7Le et al. (2020)Total assets; Equity; Cost of goods sold;Total operating costSales revenues;
Profit after tax
21
8Han Khanh Nguyen (2021a)Equity; Total asset; Cost of goods sold; General and administrative expenses; Net revenue;
Profit after tax;
10
9Yu et al. (2021)Fixed assets; Labor;
Operating expenses
Loan; Securities investment; Non-interest income22
10Han Khanh Nguyen (2021b)Total assets; Equity; Cost of goods sold; Total Operating ExpensesNet sales; Profit after tax corporate income14
Table 3. List of companies.
CODEName of Company
DMU1VT Corporation
DMU2TTH Textile Garment Joint Stock Company
DMU3SG Manufacturing Trade Joint Stock Company
DMU4TNG Investment and Trading Joint Stock Company
DMU5NB Garment Corporation Joint Stock Company
DMU6PP Textile & Garment Joint Stock Corporation
DMU7HT Textile & Garment Joint Stock Corporation
DMU8G10 Corporation Joint Stock Company
DMU9SH Garment Joint Stock Company
DMU10VN Textile & Garment Group
DMU11VT Garment Corporation
DMU12HY Garment Corporation—Joint Stock Company
DMU13TDC Garment Corporation Joint Stock Company
Table 4. Data in 2016.
F1F2F3F4F5F6F7
DMU177,731.1727,166.0093,816.522511.264854.35108,330.435165.17
DMU229,529.788950.7858,311.522269.481167.4364,274.481859.91
DMU338,411.6512,109.2658,098.002042.616447.7870,059.962651.57
DMU480,270.5722,656.9167,588.961258.356092.4882,076.043529.52
DMU5117,724.8317,142.26148,386.2613,461.5717,630.70183,280.522284.35
DMU6210,951.4870,848.78120,876.394621.5711,984.78140,773.3511,837.61
DMU783,367.1715,445.91125,314.873913.615195.83139,043.173097.57
DMU855,409.049859.74107,971.437298.399035.57127,095.742258.61
DMU995,313.4828,407.09108,526.435746.137354.52130,090.438039.52
DMU10860,627.09330,194.39598,146.3521,393.8344,495.87672,240.0425,187.91
DMU11166,634.6157,188.91287,941.4811,600.3011,277.57327,219.4317,304.43
DMU1224,820.9114,203.0013,570.433364.093665.7422,961.133572.61
DMU1313,518.134587.0432,361.611314.042600.4337,012.83726.96
Table 5. Data in 2017.
F1F2F3F4F5F6F7
DMU167,708.6530,560.7097,943.262271.614360.61110,022.703927.13
DMU228,184.179476.9665,577.222407.571731.4371,907.091765.30
DMU339,490.6113,925.2258,437.652197.226166.5269,784.702546.91
DMU496,769.1327,359.4389,199.482924.746509.13108,200.305000.65
DMU5135,800.1317,270.57145,427.9614,875.1718,390.96183,348.572538.43
DMU6230,944.7471,762.30118,885.834809.918398.70131,331.398139.96
DMU785,291.5219,027.48153,488.615083.965918.74168,499.393453.00
DMU859,327.3516,049.26112,356.837616.618804.52131,652.482282.17
DMU9103,504.3532,835.65118,170.006565.358167.57142,690.708712.43
DMU10908,963.48340,057.04689,326.3923,765.6137,847.70758,545.3929,790.17
DMU11184,771.7463,119.26324,618.8315,178.7012,061.17367,742.9617,225.96
DMU1226,327.0915,279.7015,555.003393.523282.0925,148.833997.70
DMU1313,526.524872.9127,100.481270.702857.5732,986.701674.78
Table 6. Data in 2018.
F1F2F3F4F5F6F7
DMU169,786.8732,004.0089,868.391032.963713.35101,393.744456.26
DMU234,540.359236.2269,066.872344.571922.2675,370.351281.00
DMU343942.3516,547.7072,840.872754.356791.8388,647.875234.74
DMU4112,845.0034,524.52129,213.914426.099194.09157,082.487837.39
DMU5146,519.3018,678.61170,525.6115,876.4818,697.09212,916.002953.96
DMU6235,993.3973,103.43139,336.175709.617844.96152,143.919461.43
DMU786,699.2619,331.70172,315.613806.486143.70188,908.484374.00
DMU868,238.7816,287.96109,290.307490.229269.65129,566.262422.87
DMU9109,607.7040,596.65137,275.876417.659062.57171,775.0916,079.39
DMU10951,950.48347,656.48752,194.2223,328.8338,869.35830,498.5230,548.52
DMU11204,392.9672,598.65371,601.2216,079.4814,024.00422,478.2220,755.30
DMU1228,493.5716,740.1717,657.744014.264494.9629,265.434811.48
DMU1314,322.305667.8722,161.431225.003039.5728,690.392085.17
Table 7. Data in 2019.
F1F2F3F4F5F6F7
DMU170,921.5225,467.1784,300.00958.093218.3093,811.913904.70
DMU231,427.528788.4370,048.782345.171758.3075,825.70791.65
DMU344,738.6121,018.4863,250.22918.005605.4875,990.044541.26
DMU4131,626.5246,379.17166,318.175657.0410,840.35200,531.4810,004.83
DMU5142,185.3917,531.61169,029.0415,431.2218,831.52210,217.912631.70
DMU6197,179.8366,966.83132,412.576449.358980.61145,030.098856.43
DMU777,065.2620,933.04169,812.303811.265379.43184,939.435071.87
DMU869,044.3917,003.00123,413.788607.269511.48145,688.522975.09
DMU9111,574.4353,727.96151,426.747838.0010,232.91191,793.6119,558.52
DMU10862,327.43345,202.13759,573.1723,853.8732,961.78825,478.5231,145.13
DMU11216,646.3086,792.52343,777.9116,987.8715,431.35392,850.3918,179.74
DMU1230,238.0417,542.7819,329.834328.394477.4831017.174407.13
DMU1316,729.096128.4821,488.221469.433212.0927,633.871761.65
Table 8. Data in 2020.
F1F2F3F4F5F6F7
DMU170,174.0025,764.8371,577.26763.003491.0480,746.613283.78
DMU226,181.138475.1753,424.001926.701792.5758,202.78517.61
DMU353,164.7828,627.3055,305.65546.965070.9664,111.572018.00
DMU4154,563.2649,912.17165,401.876339.879504.96194,791.306678.39
DMU5119,047.7816,833.22143,379.0413,021.4314,665.30174,843.001515.57
DMU6164,357.6570,892.9680,835.913294.876018.2291,266.6512,322.61
DMU776,140.7420,782.17130,099.393523.134761.96141,576.702706.04
DMU869,076.7817,182.13129,499.787772.139361.04149,882.742876.65
DMU9114,250.2262,704.35133,146.305953.5216,344.78165,800.3910,078.04
DMU10767,863.83341,527.65552,216.7819,082.3927,973.83607,498.7424,758.61
DMU11205,921.2683,169.43280,449.8712,096.8312,693.17309,606.916562.09
DMU1225,081.579698.5724,794.00984.651671.2228,640.96861.61
DMU1318,172.306459.5220,226.221156.703049.8325,689.651368.78
Table 9. Pearson correlation results 2016–2019.
F1F2F3F4F5F6F7F1F2F3F4F5F6F7
20162017
F11.00000.99540.94970.82920.96150.94870.87151.00000.99330.95010.82160.93530.94680.9175
F20.99541.00000.93590.79340.93920.93360.87540.99331.00000.94200.78000.90200.93640.9247
F30.94970.93591.00000.90700.93510.99960.90660.95010.94201.00000.90080.92430.99940.9503
F40.82920.79340.90701.00000.91910.91630.76430.82160.78000.90081.00000.93500.91340.8266
F50.96150.93920.93510.91911.00000.94060.80520.93530.90200.92430.93501.00000.93180.8395
F60.94870.93360.99960.91630.94061.00000.90560.94680.93640.99940.91340.93181.00000.9491
F70.87150.87540.90660.76430.80520.90561.00000.91750.92470.95030.82660.83950.94911.0000
20182019
F11.00000.99280.95040.80380.93210.94600.84171.00000.99110.96770.81700.90480.96170.8436
F20.99281.00000.94070.75840.89950.93460.86040.99111.00000.95800.77310.86260.95070.8774
F30.95040.94071.00000.87930.93120.99920.89410.96770.95801.00000.87360.91790.99890.8713
F40.80380.75840.87931.00000.93200.89260.76310.81700.77310.87361.00000.95350.88910.7522
F50.93210.89950.93120.93201.00000.93910.79190.90480.86260.91790.95351.00000.93000.7899
F60.94600.93460.99920.89260.93911.00000.89810.96170.95070.99890.88910.93001.00000.8800
F70.84170.86040.89410.76310.79190.89811.00000.84360.87740.87130.75220.78990.88001.0000
Table 10. Pearson correlation results 2020.
F1F2F3F4F5F6F7
F11.00000.99100.95280.80580.85760.94910.9222
F20.99101.00000.92880.74430.83400.92360.9416
F30.95280.92881.00000.89830.89680.99900.8355
F40.80580.74430.89831.00000.91840.90950.6615
F50.85760.83400.89680.91841.00000.91340.8079
F60.94910.92360.99900.90950.91341.00000.8360
F70.92220.94160.83550.66150.80790.83601.0000
Table 11. Score and rank of all DMUs (2016–2020).
20162017201820192020
DMUScoreRankScoreRankScoreRankScoreRankScoreRank
DMU11.0932111.186881.579761.395281.30796
DMU21.400051.290451.284881.340591.30037
DMU31.307171.238571.185991.492451.46815
DMU41.245681.0941111.0559101.0759101.056412
DMU52.650912.865812.667212.982412.70741
DMU61.339061.280160.6609130.6171132.13122
DMU71.189891.168391.304071.466171.29398
DMU81.1497101.0658121.0293111.0601111.154011
DMU91.0383121.1109101.584652.239421.87743
DMU101.0000131.0000131.0000121.0000121.000013
DMU112.066821.830441.800941.480961.28589
DMU122.012031.867321.809831.692941.224810
DMU131.761341.866232.009621.870831.61954
Table 12. Catch-up index results.
Catch-Up2016=>20172017=>20182018=>20192019=>2020Average
DMU11.00001.00001.00001.00001.0000
DMU21.00001.00001.00001.00001.0000
DMU31.00001.00001.00001.00001.0000
DMU41.00001.00001.00001.00001.0000
DMU51.00001.00001.00001.00001.0000
DMU61.00000.90330.96801.14361.0037
DMU71.00001.00001.00001.00001.0000
DMU81.00001.00001.00001.00001.0000
DMU91.00001.00001.00001.00001.0000
DMU101.00001.00001.00001.00001.0000
DMU111.00001.00001.00001.00001.0000
DMU121.00001.00001.00001.00001.0000
DMU131.00001.00001.00001.00001.0000
Average1.00000.99260.99751.01101.0003
Max1.00001.00001.00001.14361.0037
Min1.00000.90330.96801.00001.0000
SD0.00000.02680.00890.03980.0010
Table 13. Frontier index results.
Frontier2016=>20172017=>20182018=>20192019=>2020Average
DMU10.95831.59660.95550.96721.1194
DMU20.87050.91661.02430.90870.9300
DMU30.97211.19531.15881.00301.0823
DMU40.78131.11301.00840.78320.9215
DMU50.97701.14451.02370.71220.9643
DMU60.72791.17901.00171.13081.0098
DMU71.02641.23780.99490.72280.9955
DMU80.84880.98091.02030.98210.9580
DMU90.97901.49651.34370.46451.0709
DMU100.99140.97851.00000.99820.9920
DMU111.04411.39010.76340.62820.9564
DMU121.05101.23450.87940.93171.0242
DMU131.16491.02640.88900.92761.0020
Average0.95331.19151.00480.85851.0020
Max1.16491.59661.34371.13081.1194
Min0.72790.91660.76340.46450.9215
SD0.11870.20450.13830.18440.0597
Table 14. Malmquist index results.
Malmquist2016=>20172017=>20182018=>20192019=>2020Average
DMU10.95831.59660.95550.96721.1194
DMU20.87050.91661.02430.90870.9300
DMU30.97211.19531.15881.00301.0823
DMU40.78131.11301.00840.78320.9215
DMU50.97701.14451.02370.71220.9643
DMU60.72791.06510.96961.29321.0139
DMU71.02641.23780.99490.72280.9955
DMU80.84880.98091.02030.98210.9580
DMU90.97901.49651.34370.46451.0709
DMU100.99140.97851.00000.99820.9920
DMU111.04411.39010.76340.62820.9564
DMU121.05101.23450.87940.93171.0242
DMU131.16491.02640.88900.92761.0020
Average0.95331.18271.00240.87101.0023
Max1.16491.59661.34371.29321.1194
Min0.72790.91660.76340.46450.9215
SD0.11870.20750.13860.20830.0598
Table 15. Case processing summary.
Unweighted Cases aNPercent
Selected CasesIncluded in Analysis686100.0
Missing Cases00.0
Total686100.0
Unselected Cases00.0
Total686100.0
a If weight is in effect, see classification table for the total number of cases.
Table 16. Omnibus tests of model coefficients.
Chi-SquaredfSig.
Step 1Step22.16750.000
Block22.16750.000
Model22.16750.000
Table 17. Classification table a.
ObservedPredicted
PMPercentage Correct
01
Step 1PM03873691.5
12273613.7
Overall Percentage 61.7
a The cut value is 0.500.
Table 18. Variables in the equation.
BS.E.WalddfSig.Exp(B)Collinearity Statistics
ToleranceVIF
Step 1 aAG−0.0320.0118.12410.0040.9680.9961.004
ED0.1390.0576.02010.0141.1490.9931.008
IN−0.0350.0183.88710.0490.9660.9961.004
SE0.0560.0284.00410.0451.0580.9941.006
DI−0.0080.0210.12310.7260.9930.9961.004
Constant−1.1720.9251.60610.2050.3100.9961.004
a Variable(s) entered on step 1: AG, ED, IN, SE, DI.
Publisher’s Note: MDPI stays neutral with regard to jurisdictional claims in published maps and institutional affiliations.

