Design and Analysis of Highly Sensitive LSPR-Based Metal–Insulator–Metal Nano-Discs as a Biosensor for Fast Detection of SARS-CoV-2


1
Department of Mechanical and Industrial Engineering, Ryerson University, Toronto, ON M5B 2K3, Canada
2
Department of Mechanical and Industrial Engineering, University of Toronto, Toronto, ON M5S 1A1, Canada
3
Department of Electrical and Computer Engineering, University of Mohaghegh Ardabili, Ardabil 56199-13131, Iran
*
Author to whom correspondence should be addressed.
Photonics 2022, 9(8), 542; https://doi.org/10.3390/photonics9080542
Submission received: 25 May 2022
/
Revised: 20 July 2022
/
Accepted: 26 July 2022
/
Published: 3 August 2022
(This article belongs to the Topic Optical and Optoelectronic Materials and Applications)
Abstract
:For over 2 years, the coronavirus has been the most urgent challenge to humanity, and the development of rapid and accurate detection methods is crucial to control these viruses. Here, a 3D FDTD simulation of Au/SiO2/Au metal–insulator–metal (MIM) nanostructures as a biosensor was performed. The strong coupling between the two plasmonic interfaces in the Au/SiO2/Au cavity helped us to obtain relatively higher sensitivity. The attachment of SARS-CoV-2 changed the refractive index, which was used to detect SARS-CoV-2. Due to the higher overlapping of plasmonic mode with the environment of nano-discs, a higher sensitivity of 312.8 nm/RIU was obtained. The peak wavelength of the proposed structure shifted by approximately 47 nm when the surrounding medium refractive index changed from 1.35 (no binding) to 1.5 (full binding). Consequently, the SPR peak intensity variation can be used as another sensing mechanism to detect SARS-CoV-2. Finally, the previously reported refractive index changes for various concentrations of the SARS-CoV-2 S-glycoprotein solution were used to evaluate the performance of the designed biosensor.
1. Introduction
Since winter 2019, the world has been in a continuous battle with a novel disease [1]. Coronavirus Disease 2019 (COVID-19), caused by severe acute respiratory syndrome coronavirus 2 (SARS-CoV-2), has spread around the world, causing several million deaths globally as of early 2022 [2,3]. To slow down the spread of this disease, different levels of restrictions have been applied in various countries. The daily number of new cases is used as feedback by the health sector authorities to control this disease. Hence, conducting tests for detecting SARS-CoV-2 is a key factor in regulating the restriction policies and fighting this pandemic. Accurate and rapid testing is critical to identifying newly infected individuals, consequently limiting the COVID-19 outbreaks [4,5]. The common method to detect SARS-CoV-2 is reverse transcription polymerase Chain Reaction (RT-PCR) testing, which is referred to as the gold-standard method for COVID-19 diagnosis [6]. It can take several hours to produce a result [6,7]. The process includes extracting ribonucleic acid (RNA) from the collected sample (usually from the person’s throat where SARS-CoV-2 gathers). Then, reverse transcription is performed using a specific enzyme for converting the extracted RNA to deoxyribonucleic acid (DNA), which gets amplified through several cycles. RT-PCR testing requires professional laboratories and trained clinical laboratory staff, making the test highly time-consuming, laborious, and costly [8,9,10]. Hence, there is a need for a reliable and fast method for detecting SARS-CoV-2. Indeed, innovative approaches must be examined to invent novel, sensitive, and highly selective biosensing tools. Some clinical methods of diagnosis have been developed to detect this fatal virus [11,12,13,14]. Such methods suffer from low sensitivity, high cost, and complex laboratory equipment requirements [15]. High sensitivity is a crucial factor for detecting a specific virus at low concentrations [16,17].
Among various types of optical biosensors, plasmonic biosensors are relatively new and promising tools that are capable of detecting different biomarkers through the interaction between the incident light and the matter at subwavelength geometries [18,19,20,21,22,23,24]. Plasmonic resonances are a phenomenon in which an incident light stimulates resonance oscillation of the conduction electrons at the metal–dielectric interface [25,26,27]. Several biosensors have been developed using the surface plasmon resonance (SPR) sensing method for detecting different chemical substances [28,29,30,31,32,33]. An SPR-based biosensor consists of a thin layer of metal (usually gold or silver), which makes the fabrication process complex and costly. Localized surface plasmonic resonance (LSPR) is an alternative method to SPR. In LSPR-based biosensors, nanoparticles are utilized instead of a continuous metal film. In this way, the complexity and cost of the fabrication can be reduced significantly. The sensitivity factor for the SPR-based sensors is higher than for LSPR-based biosensors, but the LSPR-based biosensors have some important advantages [34]. For instance, an LSPR-based biosensor responds with high linearity. It is also less sensitive to temperature variation, and it needs simple instrumentation compared to SPR-based biosensors [34]. Therefore, increasing the sensitivity of LSPR-based biosensors will make this type of biosensor highly desirable for biosensing applications.
Various LSPR-based sensors have been proposed by different research groups for detecting microorganisms and viruses [35,36,37,38]. Due to their unique optical properties during their interaction with incident light, noble metal nanoparticles have been widely used in different applications such as biomedicine, energy, and information technology [39,40,41,42]. The basic concepts (electromagnetic interaction and dielectric constant of metals) were discussed in several studies, and the effects of near-field enhancement, shape, composition, and surrounding medium of nanoparticles on optical properties were described in detail [39,42,43,44,45,46]. The optical properties of plasma-based nanoparticles (for example, light absorption, scattering, and field enhancement) have been used to develop medical and healthcare products and technologies [46,47,48]. In this paper, a novel LSPR-based biosensor for SARS-CoV-2 detection is proposed. Au–SiO2–Au nano-discs were considered as the sensing structure of the sensor. The proposed sensor’s high accuracy and easy-to-use feature may drastically reduce the required time and cost for SARS-CoV-2 testing. There are other advantages of this sensor such as label-free detection, reusability, fast response, and low cost.
2. Sensing Methodology
2.1. Structure Design
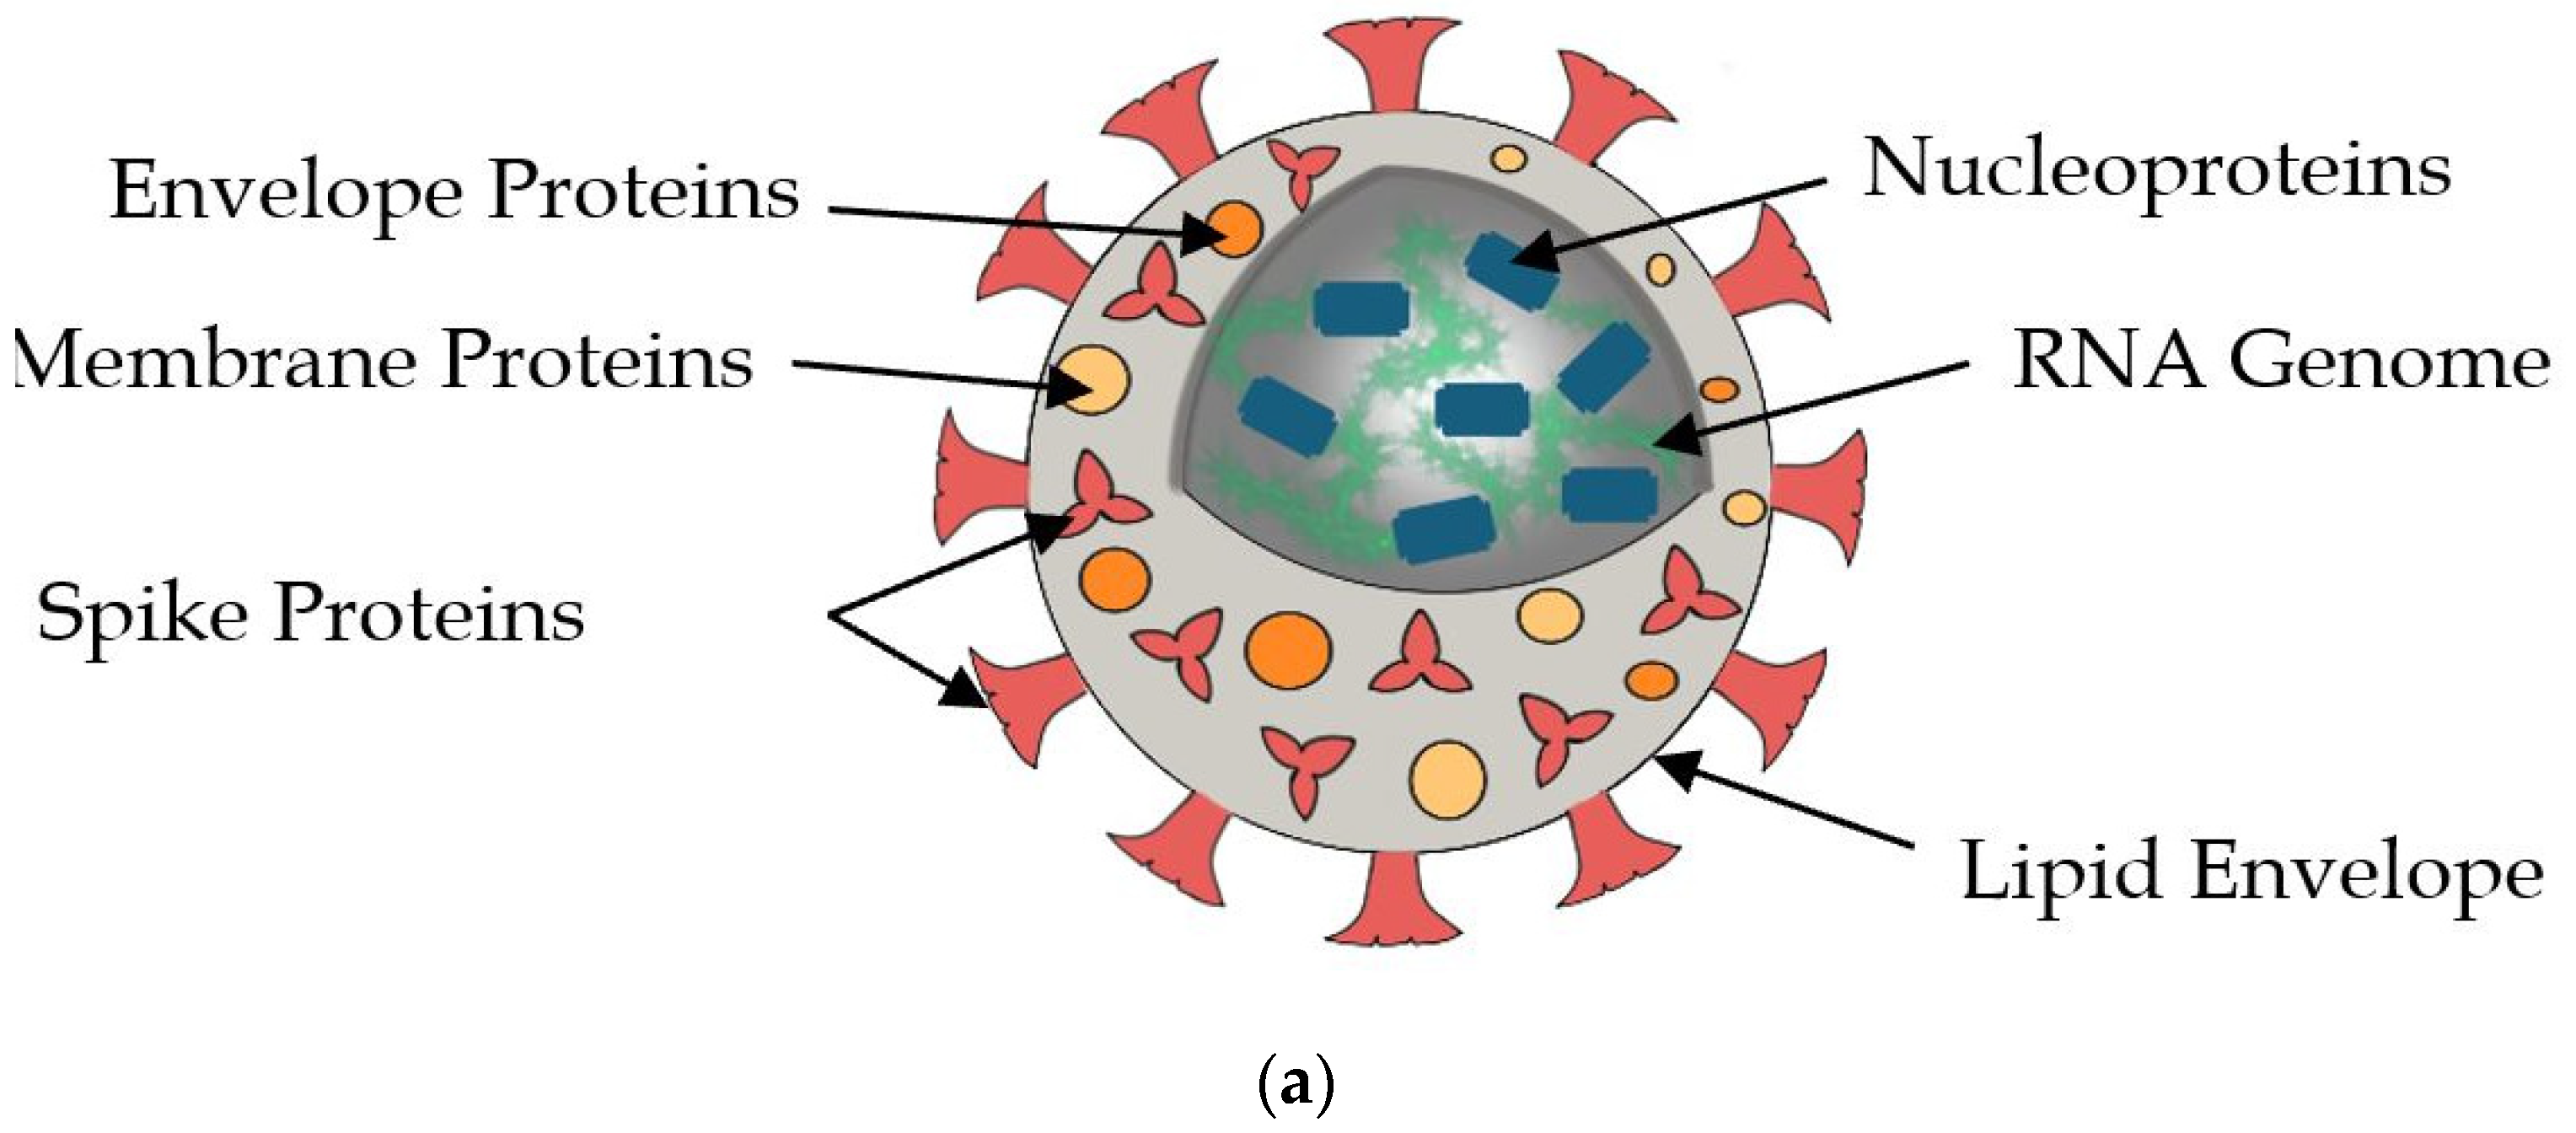
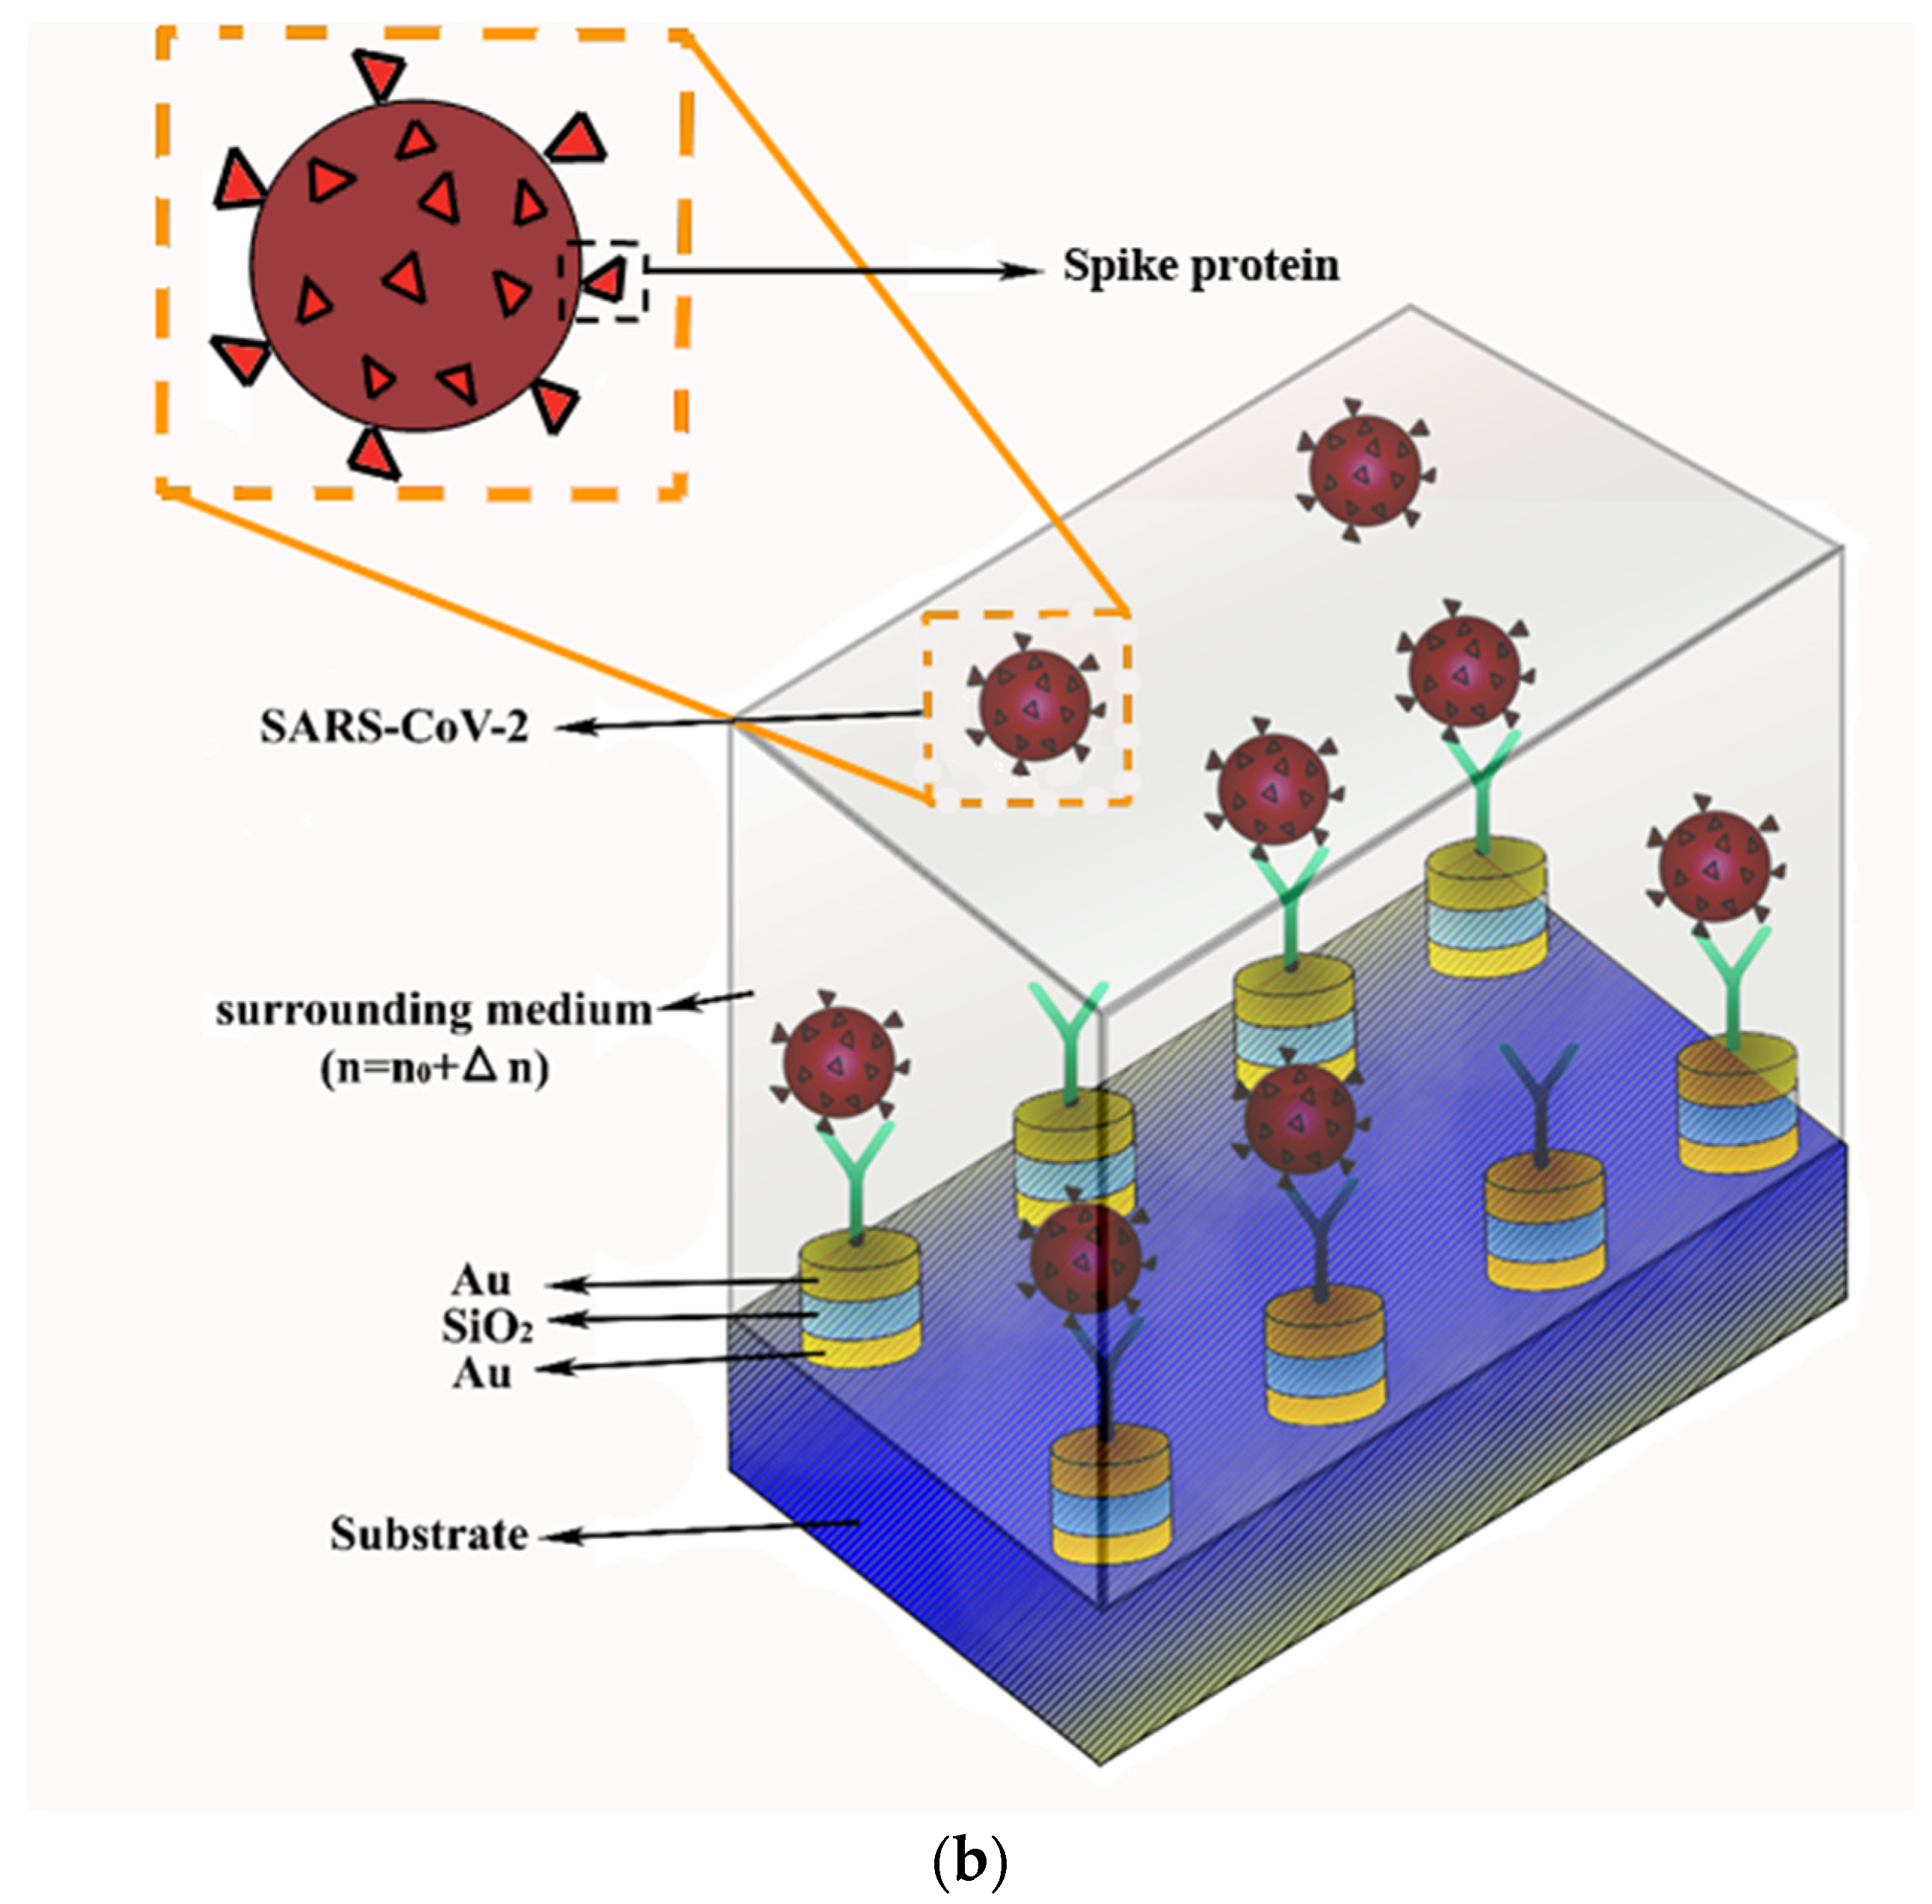
SARS-CoV-2 is roughly spherical with an average diameter of 100 nm [49]. The RNA is a single-stranded molecule containing genetic information located inside the virus [50,51]. Nucleoproteins are bound to RNA and enable viral transcription and replication [52]. The RNA and its associated nucleoproteins are encapsulated by a viral envelope, which is a layer made of lipids [53]. The viral envelope protects the genome. It also anchors different proteins needed for infecting cells. Figure 1a shows different parts of SARS-CoV-2. When SARS-CoV-2 enters the body, the immune system produces antibodies, which are Y-shaped proteins, in response to exposure to the antigen. An antibody has an antigen-binding site named a paratope which recognizes the antigen and binds specifically to it. This tagging mechanism helps the immune system fight and eliminate the antigens from the body. Antibodies are broadly used as bioreceptors in biosensors to capture the target elements. The change in physical or chemical properties caused by the binding of the target to receptors can be measured through a transducer. Hence, the target elements can be detected. Our proposed SARS-CoV-2 sensor is an immuno-biosensor that is based on the interaction between the antibody coated on the sensor’s surface and the viral antigen. Figure 1b depicts the structure of the proposed cylindrical metal–insulator–metal nanoparticle-based plasmonic biosensor. The conjugated antibody on the surface of the sensor binds to the spike proteins of the virus. Therefore, the virus can be captured and detected by the sensor. There are different conjugation methods such as adsorption process, affinity-based attachment, crosslinking, and specific covalent linking that can be used in this biosensor for antibody immobilization. Each method provides different binding sites and antibody orientation on the Au surface [54,55].
The plasmonic nanoparticle is surrounded by a medium that is filled with the substance to detect its refractive index changes due to the existence of SARS-CoV-2. The sensor mainly consists of a substrate made of silicon dioxide (SiO2), Au–SiO2–Au metal–insulator–metal nano-discs formed on the surface of the substrate, and the antibody for SARS-CoV-2 coated on the surface of the nano-discs. If viral antigens exist in a test sample, they bind with the sensor’s bioreceptors (the coated antibody). The change in effective refractive index on the sensor’s surface due to the bound viruses can be detected by measuring the resonance frequency. The measurement process includes collecting the sample analyte, usually from oropharyngeal or nasopharyngeal tracts. The sample analyte is dropped on the sensor’s surface, where the nanoparticles with immobilized antibodies are located. Then, the detection process is performed using the optical setup. It is worth mentioning that nonspecific binding is the critical bottleneck for all biosensors. Antibodies are vulnerable to cross-reactivity in which different molecules can bind to the same binding region on the sensor’s surface. There are different ways such as using blocking agents, surface engineering, and sample treatment to minimize the nonspecific binding issue in biosensors [56].
2.2. Methodes
Currently, 700–780 nm wavelength laser diodes are widely available for biomedical measurement [57], and they can be used as an optical source for the excitation of plasmonic nanostructures. In LSPR systems, the electromagnetic field is more intense and closer to the nanoparticles, and it can be approximated as decaying exponentially with distance. In modeling, an adsorption layer whose refractive indices are characterized by virus concentration is used, and an appropriate platform for the detection of SARS-CoV-2 is designed. Although some other steps are needed until the practical realization, an accurate simulation model is very necessary to realize a sensor for the detection of SARS-CoV-2. In our simulation model, SARS-CoV-2 assumed a spherical core–shell system with radii r1 and r2, respectively, containing RNA covered with a membrane protein. Thus, the effective refractive index of the SARS-CoV-2 was calculated by taking a volume-weighted sum of the two refractive indices, as shown in Equation (1).
where n1 and n2 are the refractive indices of the RNA and the membrane protein volume, and V1 and V2 are their volumes, respectively. η is 1.25 according to the average value of several measurements of transmission electron microscopy (TEM) pictures [58]. Hence, using this effective refractive index and the volume ratio, the effective refractive index for a bonding layer with a thickness of 120 nm was calculated. The value of 120 nm was selected according to the maximum diameter of the SARS-CoV-2 virus. It is important to mention that the refractive of the binding layer depends on the number of bonded viruses, and it is determined by their concentration. Here, the refractive index of 1.35 or a concentration of 0 nM was attributed to the no binding case, a refractive index of 1.43 or a concentration of 0.002 nM was attributed to the medium binding case, and a refractive index of 1.5 or a concentration of 0.001 nM was attributed to the full binding case.
Our proposed SARS-CoV-2 biosensor monitors the extinction peak shifts induced by changes in the refractive index of the surrounding environment of the nano-discs. The absorption and scattering of light by a nanoparticle can be characterized by its electrostatic polarizability. For instance, for spherical nanoparticles, the electrostatic polarizability can be written as Equation (2).
where εm(λ) is the optical permittivity of metal nanoparticles as a function of wavelength, εa(c) is the refractive index of the adsorption layer as a function of concentration, V is the volume, and r is the radius. By obtaining the integrated absorption and scattering, the extinction cross-sections can be obtained using Equation (3).
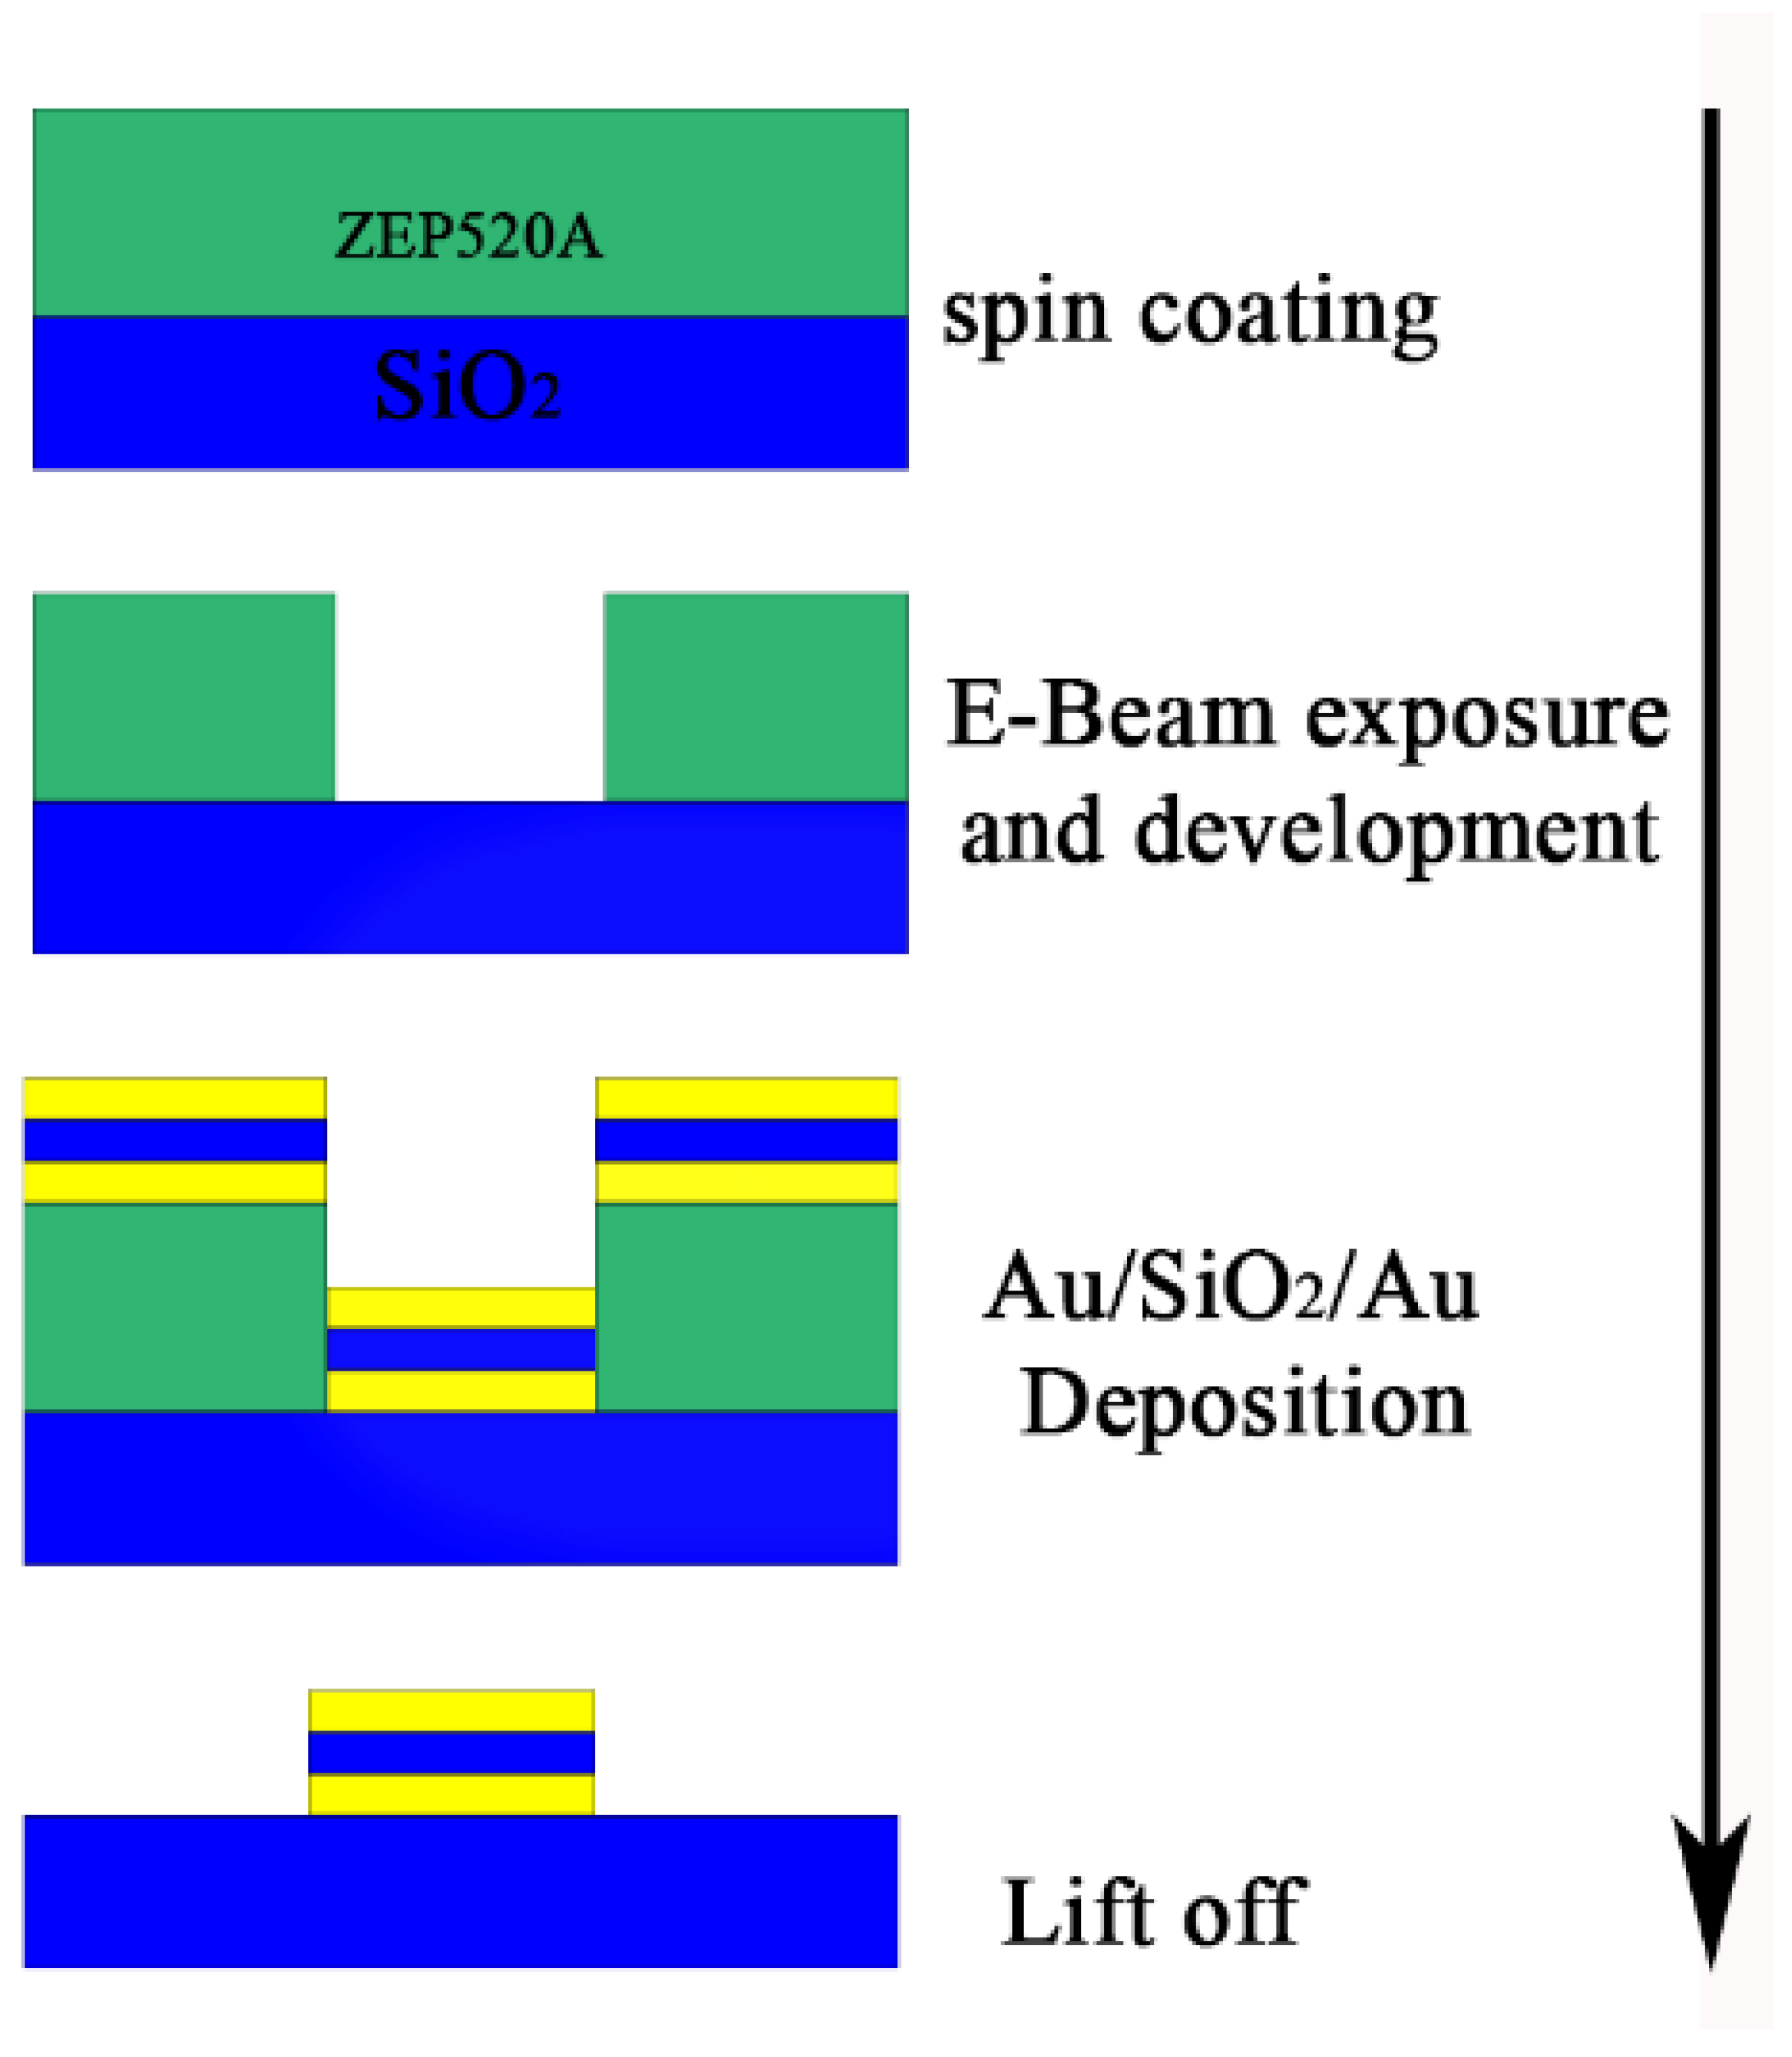
where k is the wave number (k = ). In this work, a numerical method was used, and the extinction spectra were calculated. The fabrication processes of the MIM nano-discs are shown in Figure 2, which can be applied to obtain a realistic MIM biosensor. ZEP520A is a high-performance positive electron beam (E-beam) resist which shows high resolution and dry etch resistance [59,60]. It is suitable for various E-beam processes, which can be used for fabrication of our proposed structure.
A numerical simulation using the finite difference time-domain (FDTD) method was performed to analyze the scattering efficiency of light from MIM nanoparticles. Here, we chose to work with the commercial software package Lumerical FDTD Solutions. Our simulation results showed that the LSPR modes of the proposed MIM nano-discs created a strong peak in their extinction spectra. The intensity of the resonant peak and its wavelength shift were used to identify the SARS-CoV-2 viruses in the surrounding nanoparticles. The refractive index changes were used to detect SARS-CoV-2 (n = n0 + Δn). In the detection process, the designed biosensor was composed of several layers such as the functionalization layer and bonded antibody (protein layers), as well as the bonded virus particle layer. To evaluate the specific sensing ability of the proposed structure for SARS-CoV-2 detection, the mentioned layers were simplified as a uniform layer with a thickness of 120 nm, selected according to the maximum diameter of the SARS-CoV-2 virus. It is worth mentioning that the effective refractive index of such a layer depends on the number of bonded viruses (virus concentration). From the resonance peak wavelength shift, the sensitivity is calculated using Equation (4) [61].
where is the wavelength shift of the plasmonic resonance peak, and is the refractive index change. It is important to mention that the sensitivity alone cannot describe the broadening of the plasmonic spectrum [62]. The problem arises when the sensor’s performance is compared in the wavelength and energy domains. In the field of this research area, the figure of merit (FOM) was introduced to overcome such problems. The FOM is defined in Equation (5) [63,64].
where is the sensitivity. In this equation, the is the full width at half-maximum of the corresponding reflectance spectrum.
S = Δλ/Δn,
FOM = S/FWHM,
In the final step of this work, the existing refractive indices for the SARS-CoV-2 S-glycoprotein solution were used to evaluate our designed biosensor. In [65], the refractive index changes for various concentrations of the SARS-CoV-2 S-glycoprotein solution were presented. The concentration of the SARS-CoV-2 S-glycoprotein solution was varied from 0 nM to 1 nM, and the wavelength shift, sensitivity, and FOM were calculated.
3. Results and Discussion
3.1. MIM Biosensor Desining
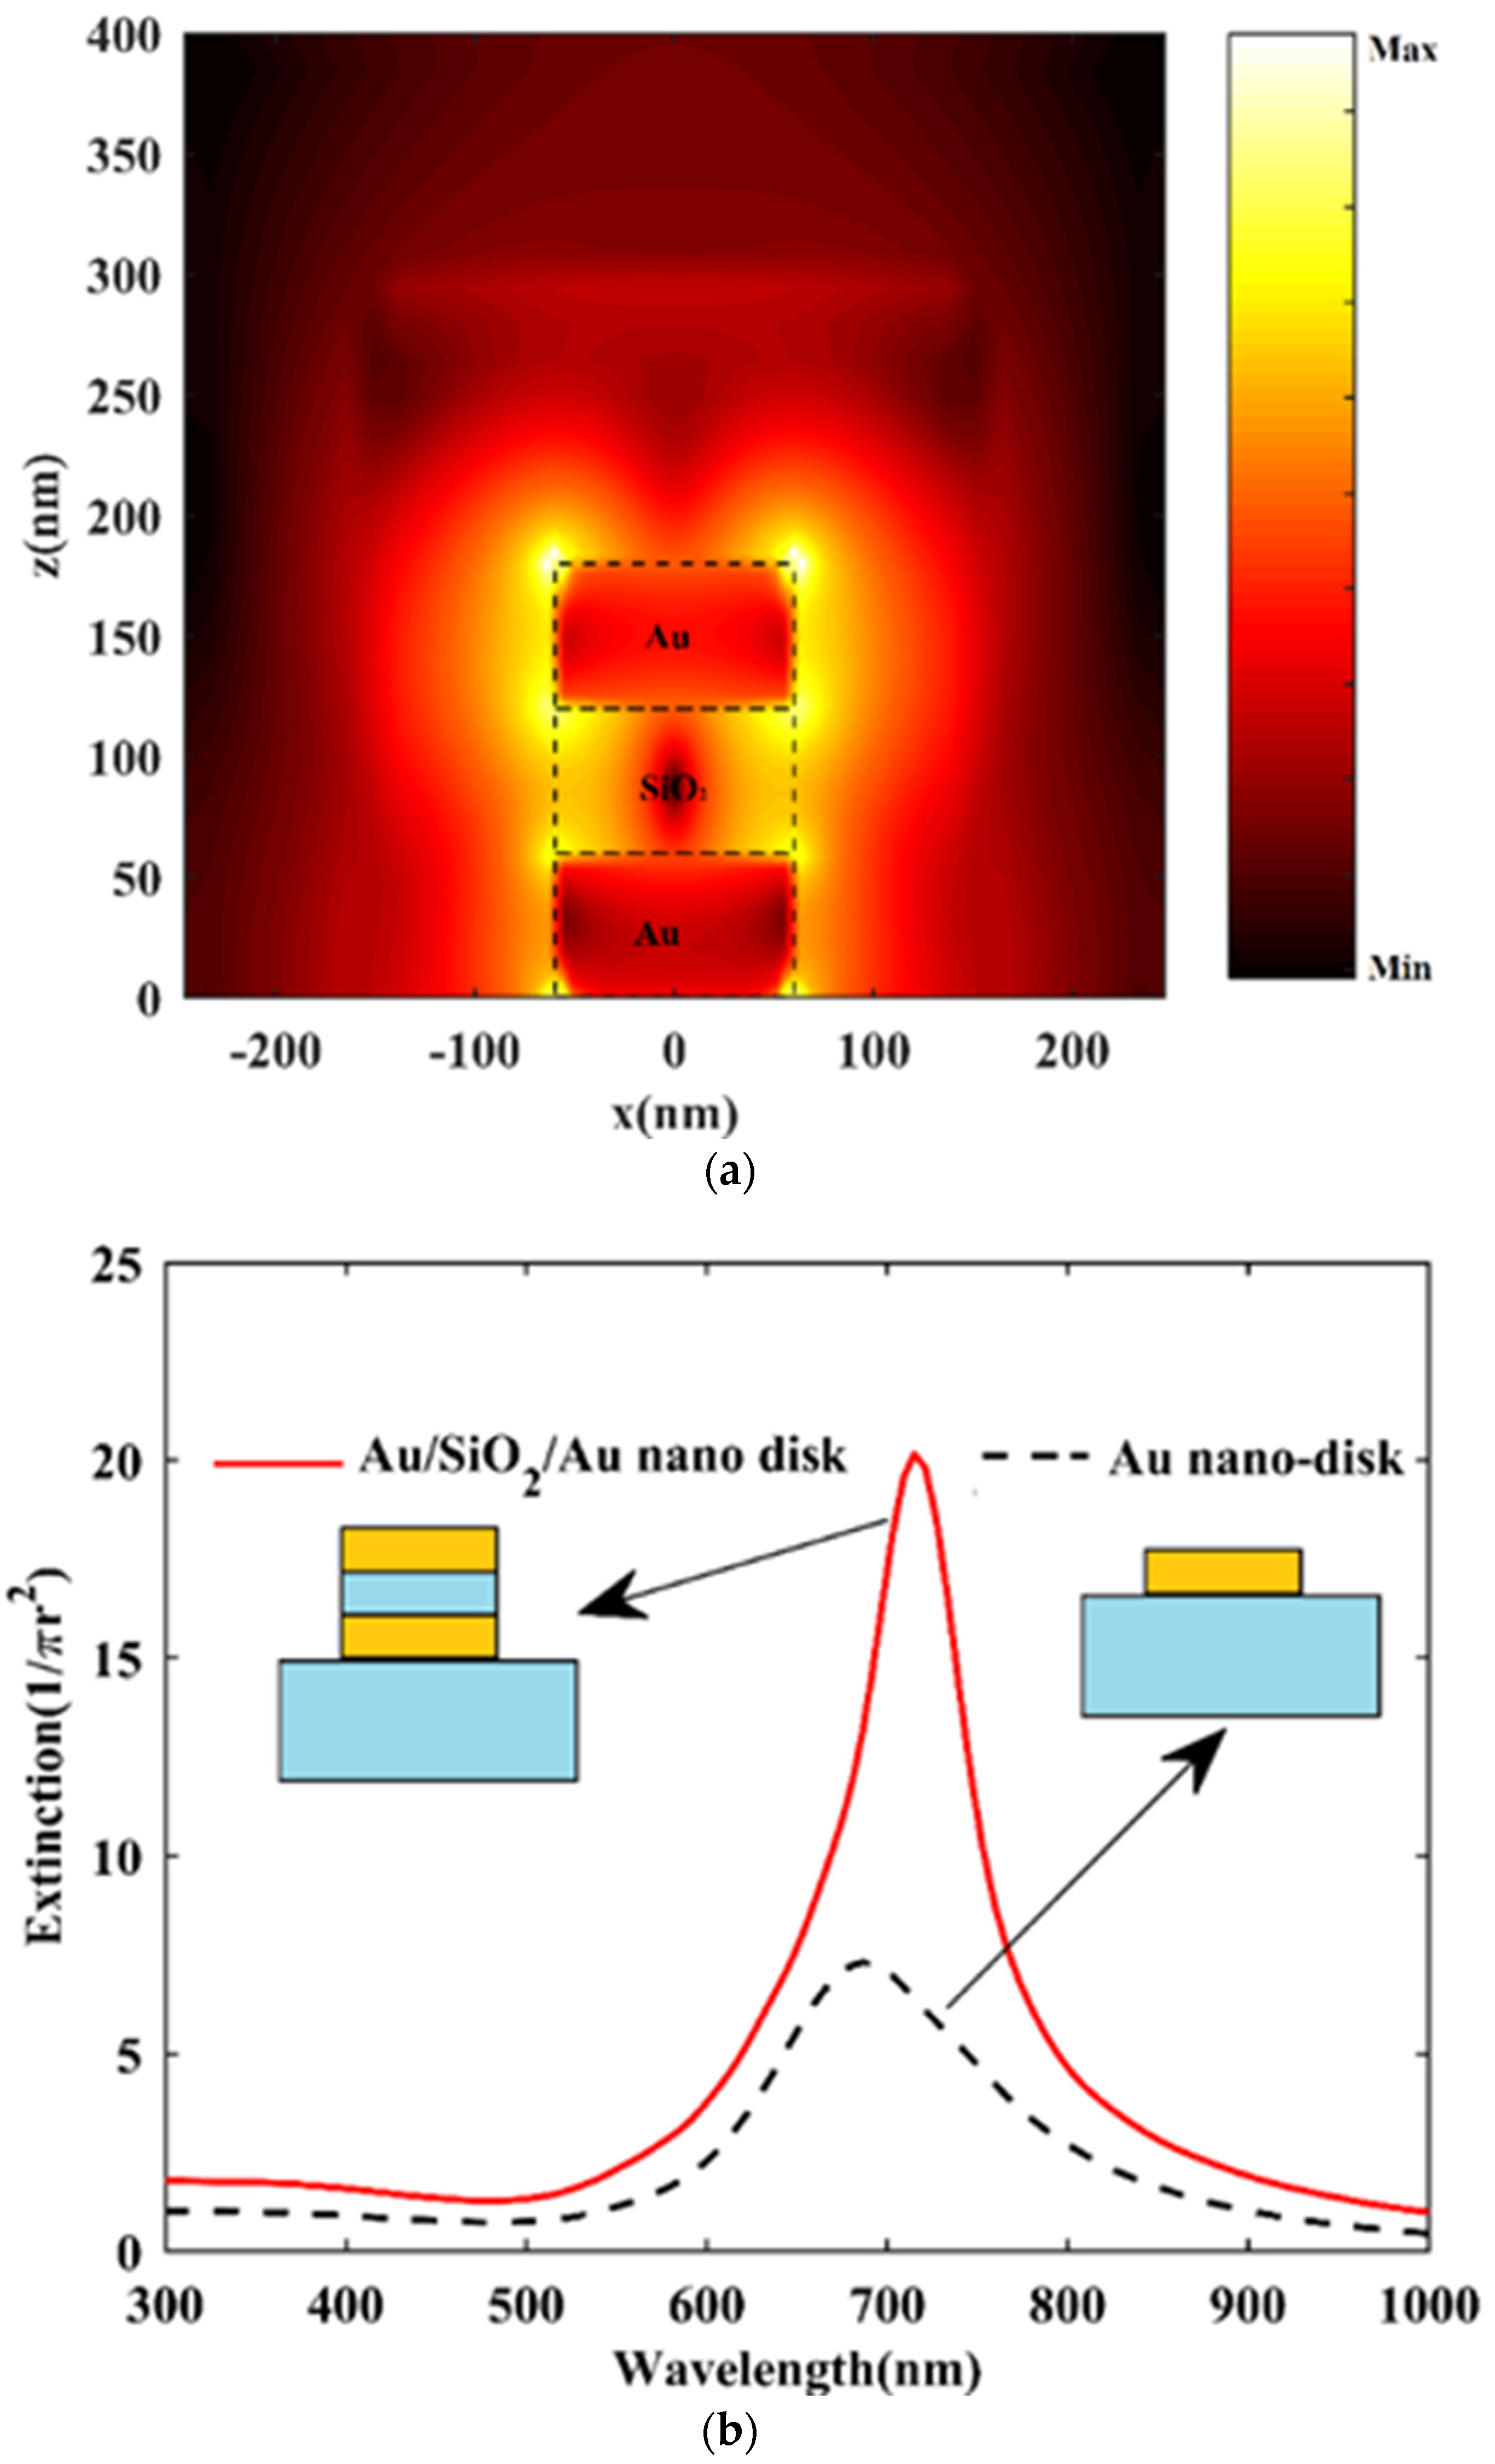
As stated earlier, the optical equipment required for LSPR-based devices is much less complex than for SPR-based devices. The main disadvantage of LSPR-based in comparison to SPR-based sensors is their lower sensitivity. This is due to the lower interaction of electromagnetic waves with nanoparticles compared to a metallic film. On the other hand, the electromagnetic decay length in LSPR-based is shorter than in SPR-based sensors, making LSPR-based sensors more suitable for biomolecular detection, such as for SARS-CoV-2. However, an improvement in the sensitivity of LSPR-based biosensors is essential for detecting bioparticles with low concentrations. Here, metal–insulator–metal cylindrical shape plasmonic nanoparticles were used to improve the sensitivity of LSPR biosensors. Then, their specific capability for SARS-CoV-2 sensing was examined. The surrounding refractive index of nanoparticles is a critical parameter for detecting biological substances. Our proposed LSPR-based sensor consisted of three MIM layers as a disc form with a radius of . The heights of the bottom and top layers were equal to and the height of the middle layers was . The intensity distribution of the electric field near the MIM nano-disc at the resonance wavelength was simulated using the FDTD method. The result of this simulation is shown in Figure 3a. As shown in this figure, the intensity was higher near the edges of the nano-disc. This is because of the plasmonic effect between the metal and the dielectric. The electrical field overlapping with the environment can also be seen in this figure. This high intensity around the nanoparticles provides a better sensitivity for detecting the resonance wavelength shift. It is worth mentioning that this distribution of the electrical field was plotted for Au/SiO2/Au thicknesses of 60 nm/60 nm/60 nm with the nano-disc radius of 60 nm. Here, MIM nano-discs were used instead of single-layer nano-discs to increase the sensitivity of the biosensor. Figure 3b shows a comparison between the extinction spectra of the Au nano-disc and Au/SiO2/Au MIM nano-disc. The two plasmonic interfaces in the Au/SiO2/Au cavity help the structure to have a strong coupling between them. Consequently, these exponentially decaying plasmonic waves at the two Au/SiO2 interfaces result in a higher resonance peak compared to the single-layer Au nano-disc form, as shown in Figure 3b.
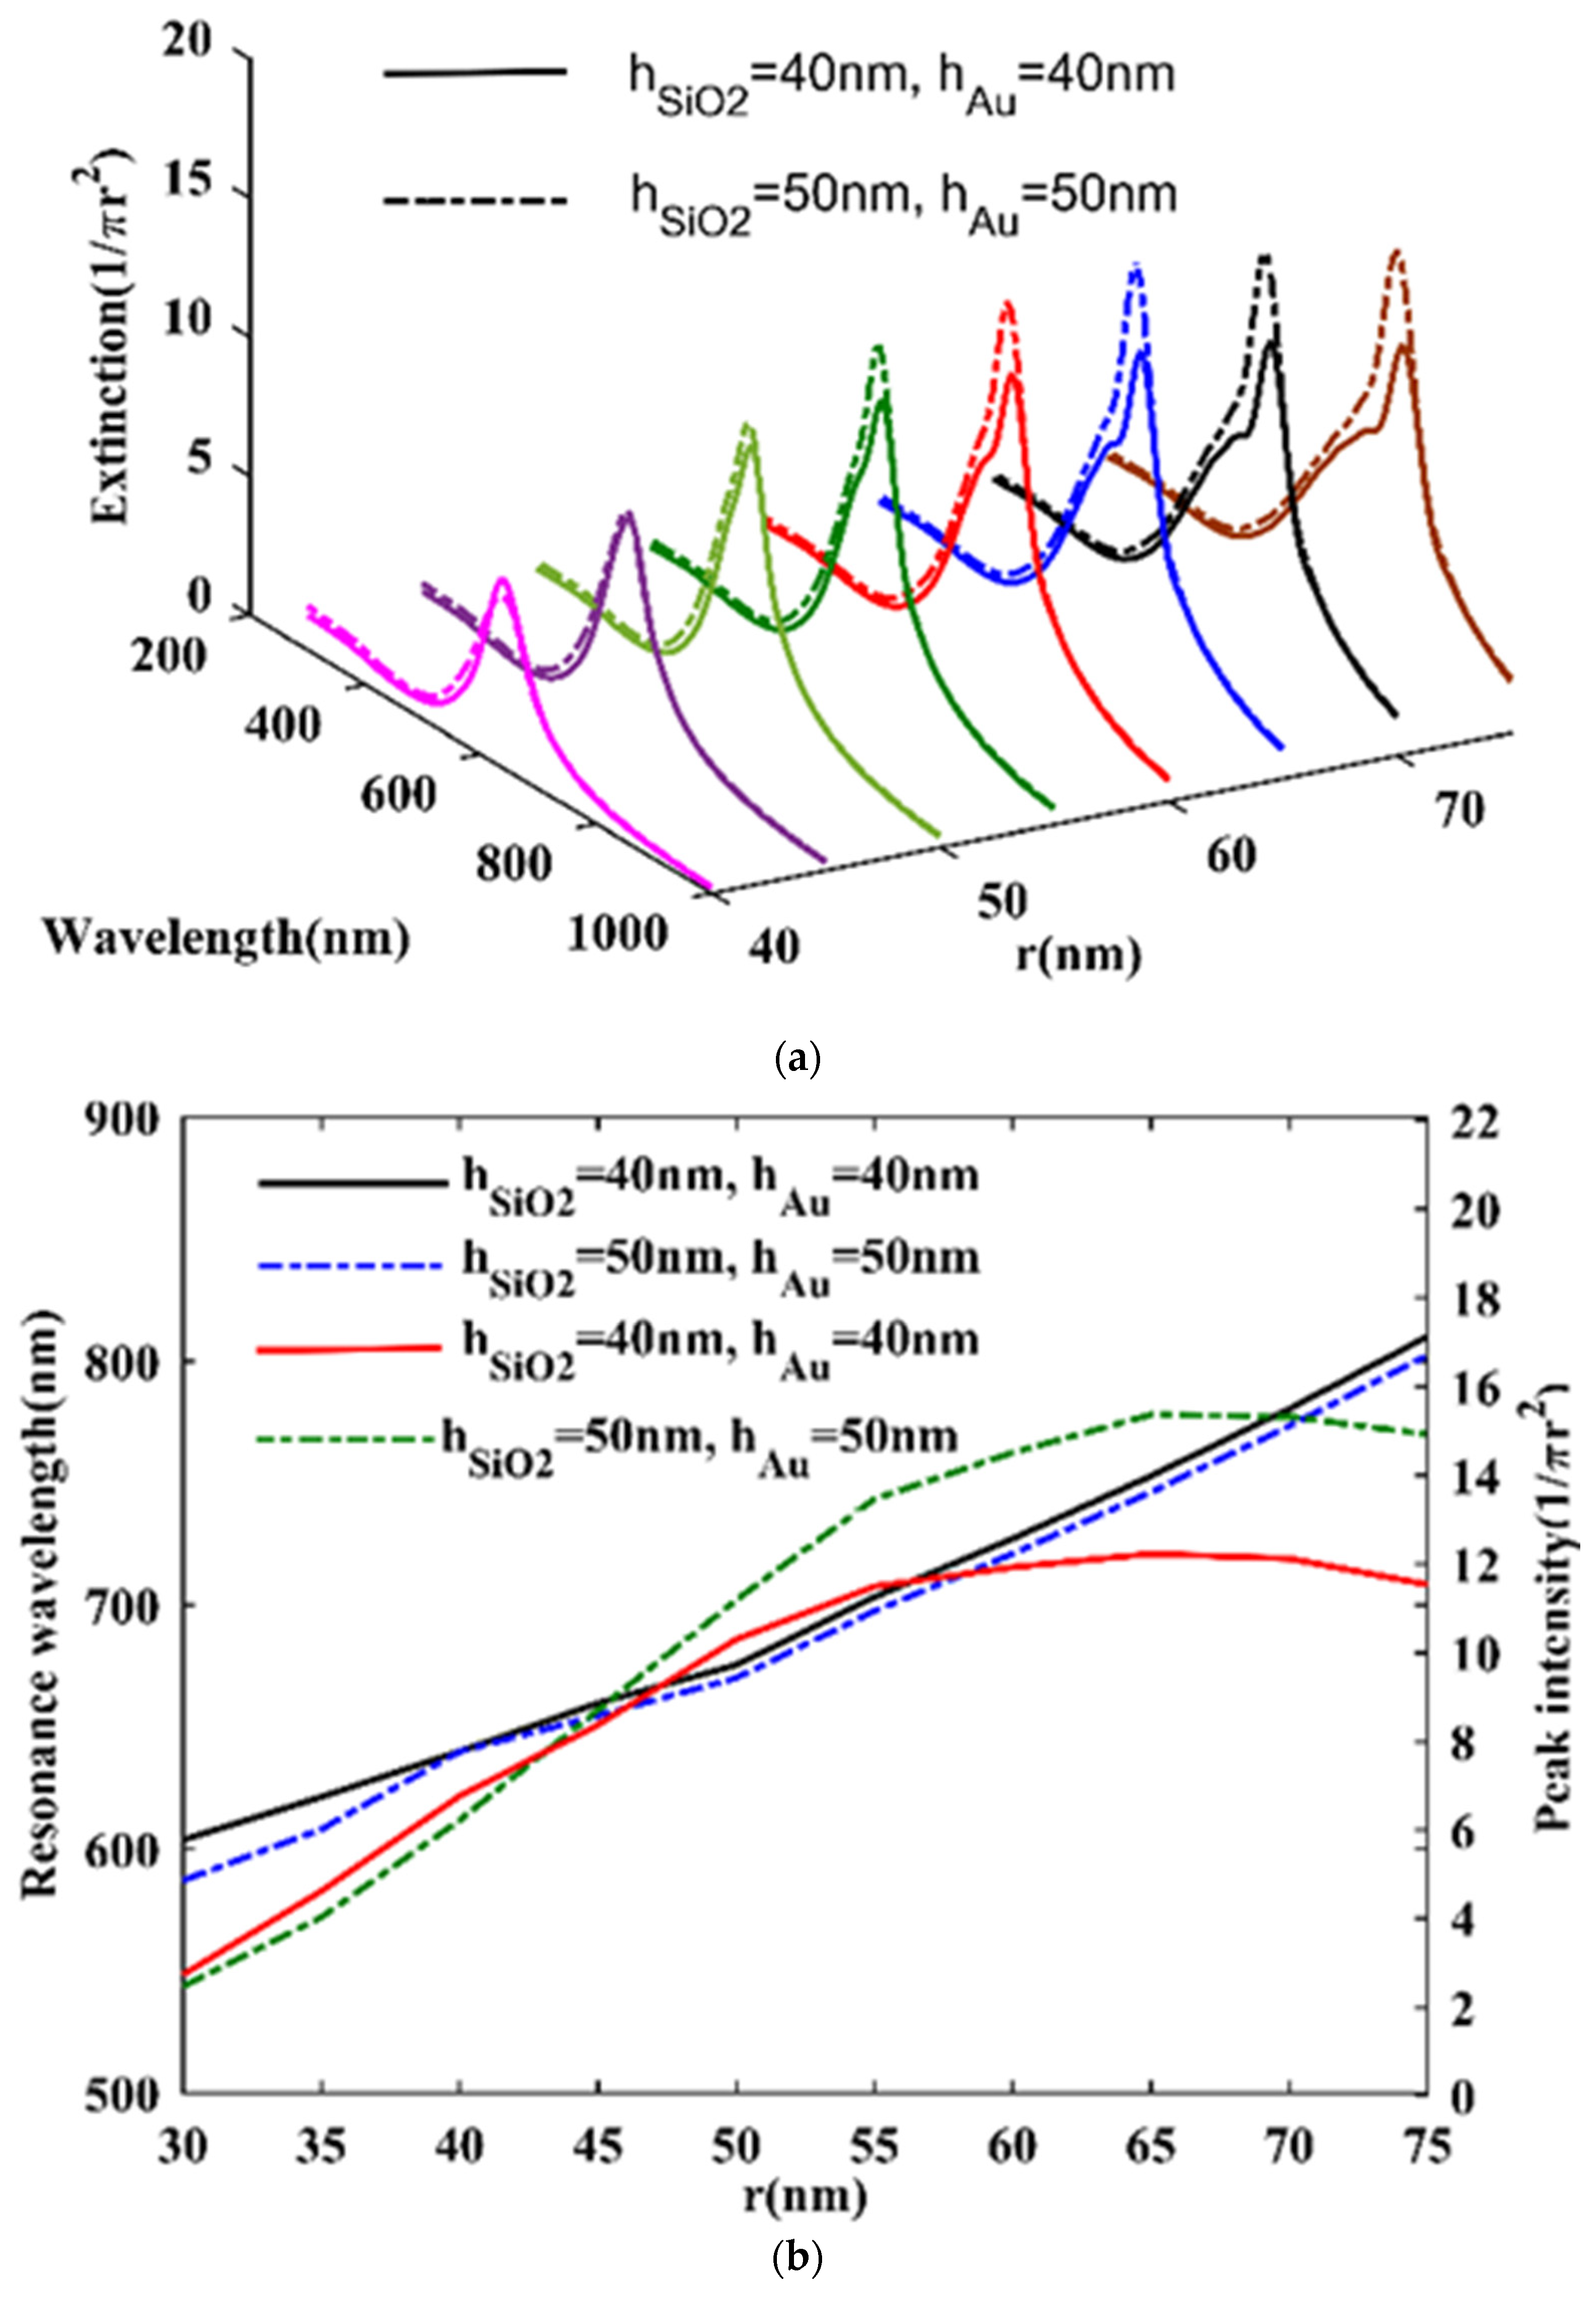
To find the suitable dimensions for the MIM layer, the extinction for was compared with that for as a function of wavelength and radius. The results are shown in Figure 4a. The wavelength and intensity of the resonance peak depend on LSPR wave confinement in the MIM disc structure. These resonance peaks are the results of the plasmonic effect. The resonance wavelengths and their peak intensity are depicted in Figure 4b. For all cases, the resonance wavelength increased with the radius of the nano-disc. The intensity of the plasmonic peak had a maximum point for each case.
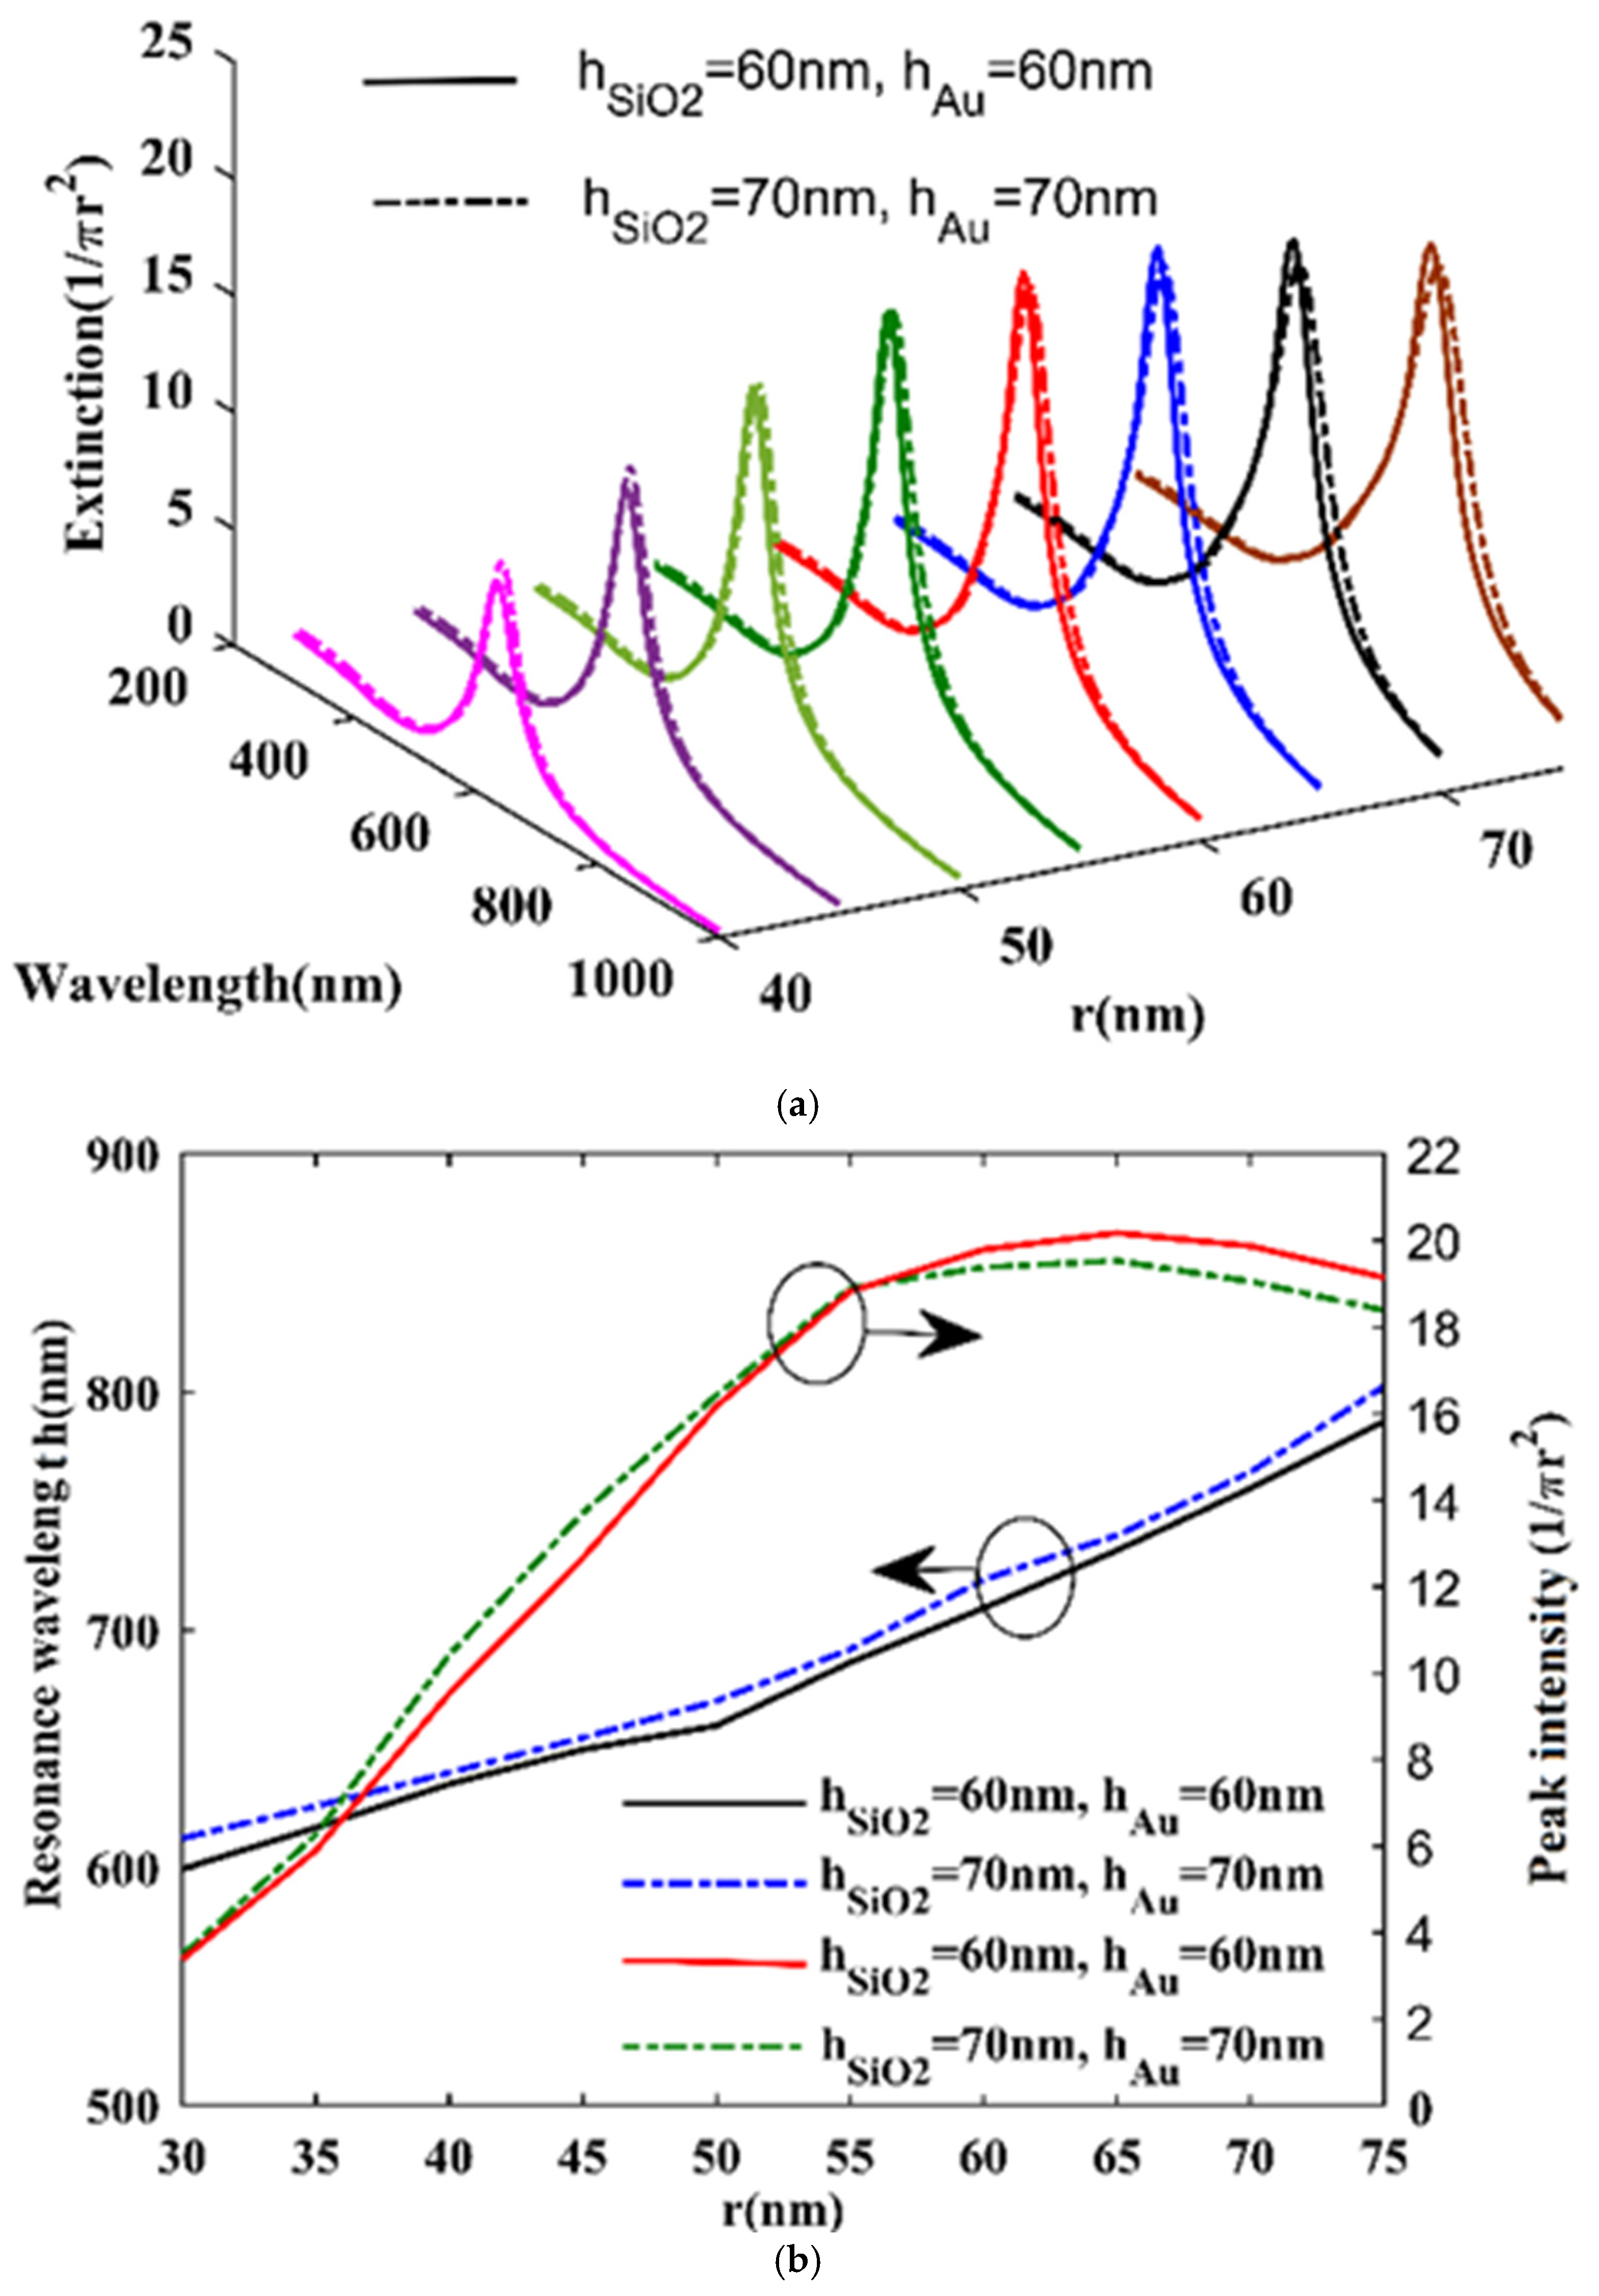
A similar comparison is depicted for and in Figure 5a,b, respectively. As seen, nano-discs with exhibited several better features compared to other cases. They had higher peak intensity than other cases, in addition to showing a narrower plasmon bandwidth, making them promising candidates for LSPR-based sensors to accurately measure the LSPR shift. The FWHM of nano-discs with was 77 nm, while it was 140 nm, 137 nm, and 80 nm for Au and SiO2 heights of 40 nm, 50 nm, and 70 nm, respectively. The FOM, as an important parameter of biosensors, can be calculated as the ratio of wavelength sensitivity to FWHM. Therefore, a lower FWHM results in a higher FOM.
3.2. SARS-CoV-2 Biosensing: Sensing Layer
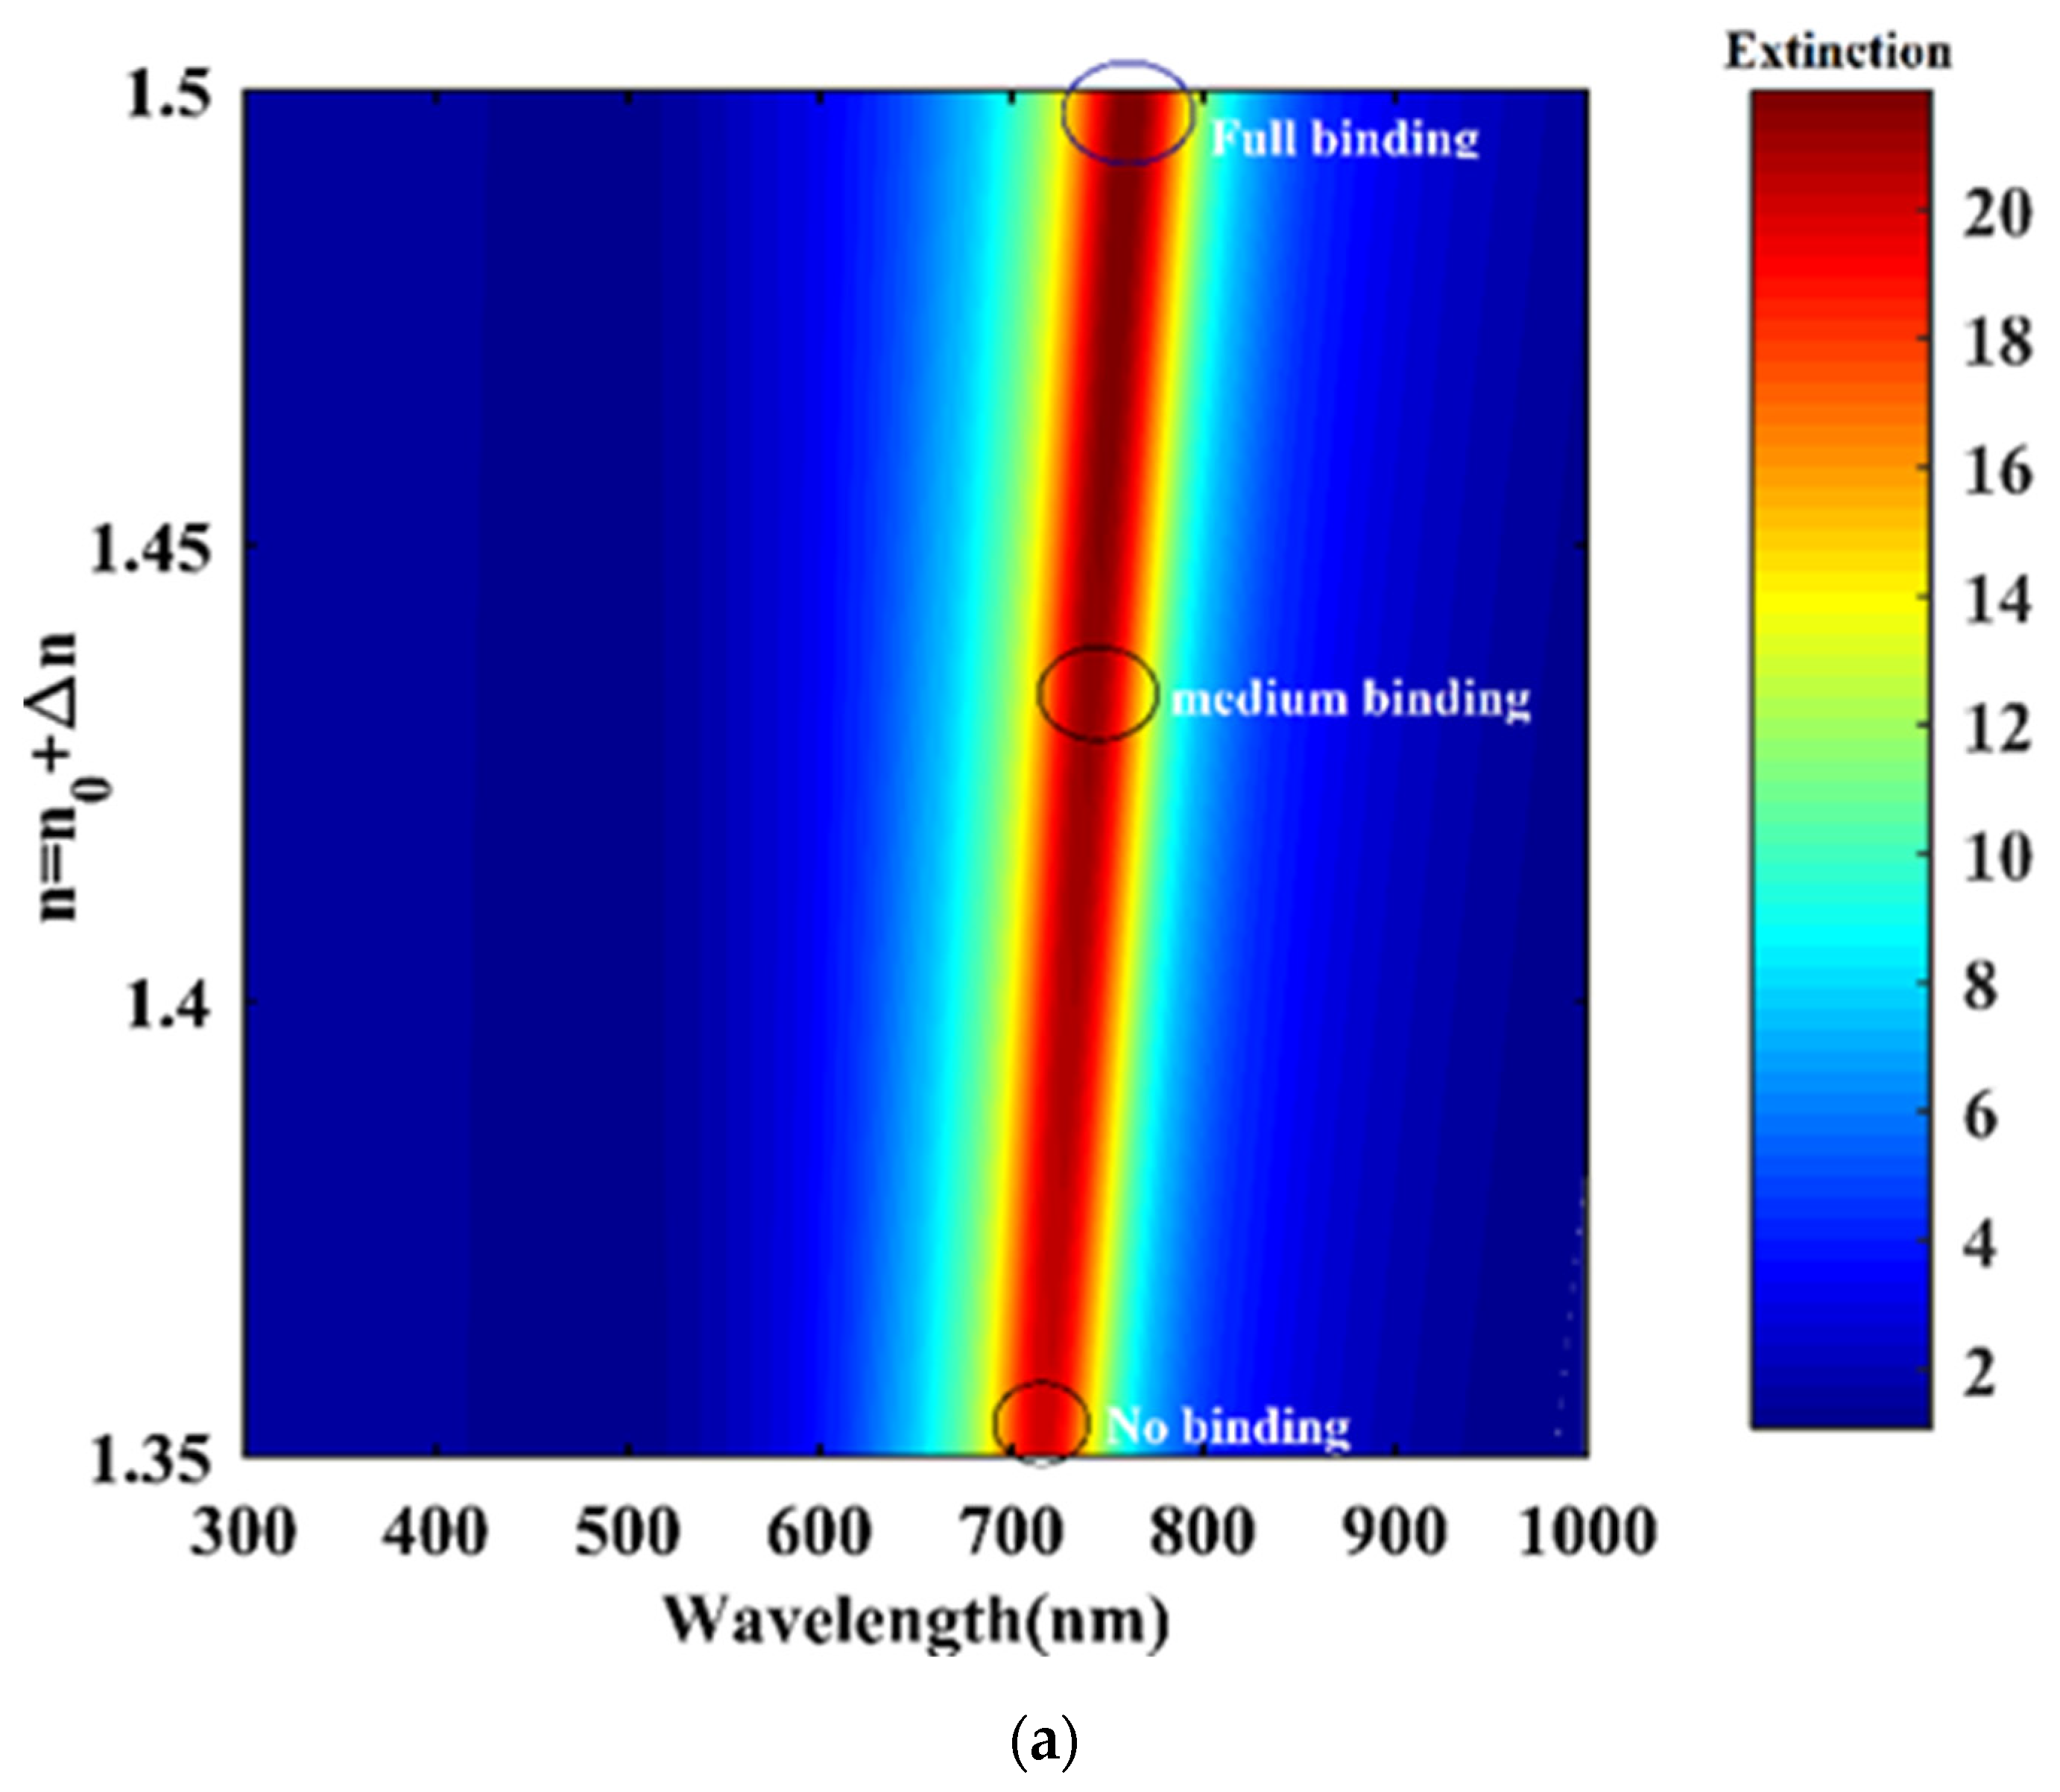
As mentioned, the sensing layer refractive indices were obtained using the SARS-CoV-2 virus effective refractive indices by considering the two volume-weighted refractive indices. Figure 6a shows the simulation results for the extinction spectrum of the designed sensor under the surrounding refractive index range of 1.35 to 1.5. Here, hAu = 60 nm, hSiO2 = 60 nm, and r = 60 nm were selected. It is important to mention that the selected sizes had an optimum extinction spectrum. When we changed only the refractive index of the medium while keeping other structural and material parameters fixed, the LSPR peak wavelength of the extinction spectrum increased. As shown in Figure 6b, there was a redshift for the LSPR peak when there was an increase in the refractive index of the bonding layer. To evaluate the sensitivity of this sensor, three binding cases of SARS-CoV-2 were considered. By adjusting the MIM layer dimensions, the absorption peak wavelength of 715 nm was obtained for a case without binding any SARS-CoV-2 viruses, as shown in Figure 6b. This wavelength was matched with the laser excitation wavelength. Therefore, the detection of SARS-CoV-2 could be achieved using the refractive index changes and measuring the amount of resonance wavelength shift. It can be seen in Figure 6b that the peak wavelength shifted from 715 nm for no binding to 739.5 nm and 759.5 nm for medium binding and full binding of SARS-CoV-2, respectively. An increase in SARS-CoV-2 concentration resulted in a larger refractive index change in the surrounding medium. Consequently, a larger shift of the resonance wavelength was observed. In addition, as shown in Figure 6b, the peak intensity amplitude of the resonance wavelength increased with the increase in SARS-CoV-2 concentration.
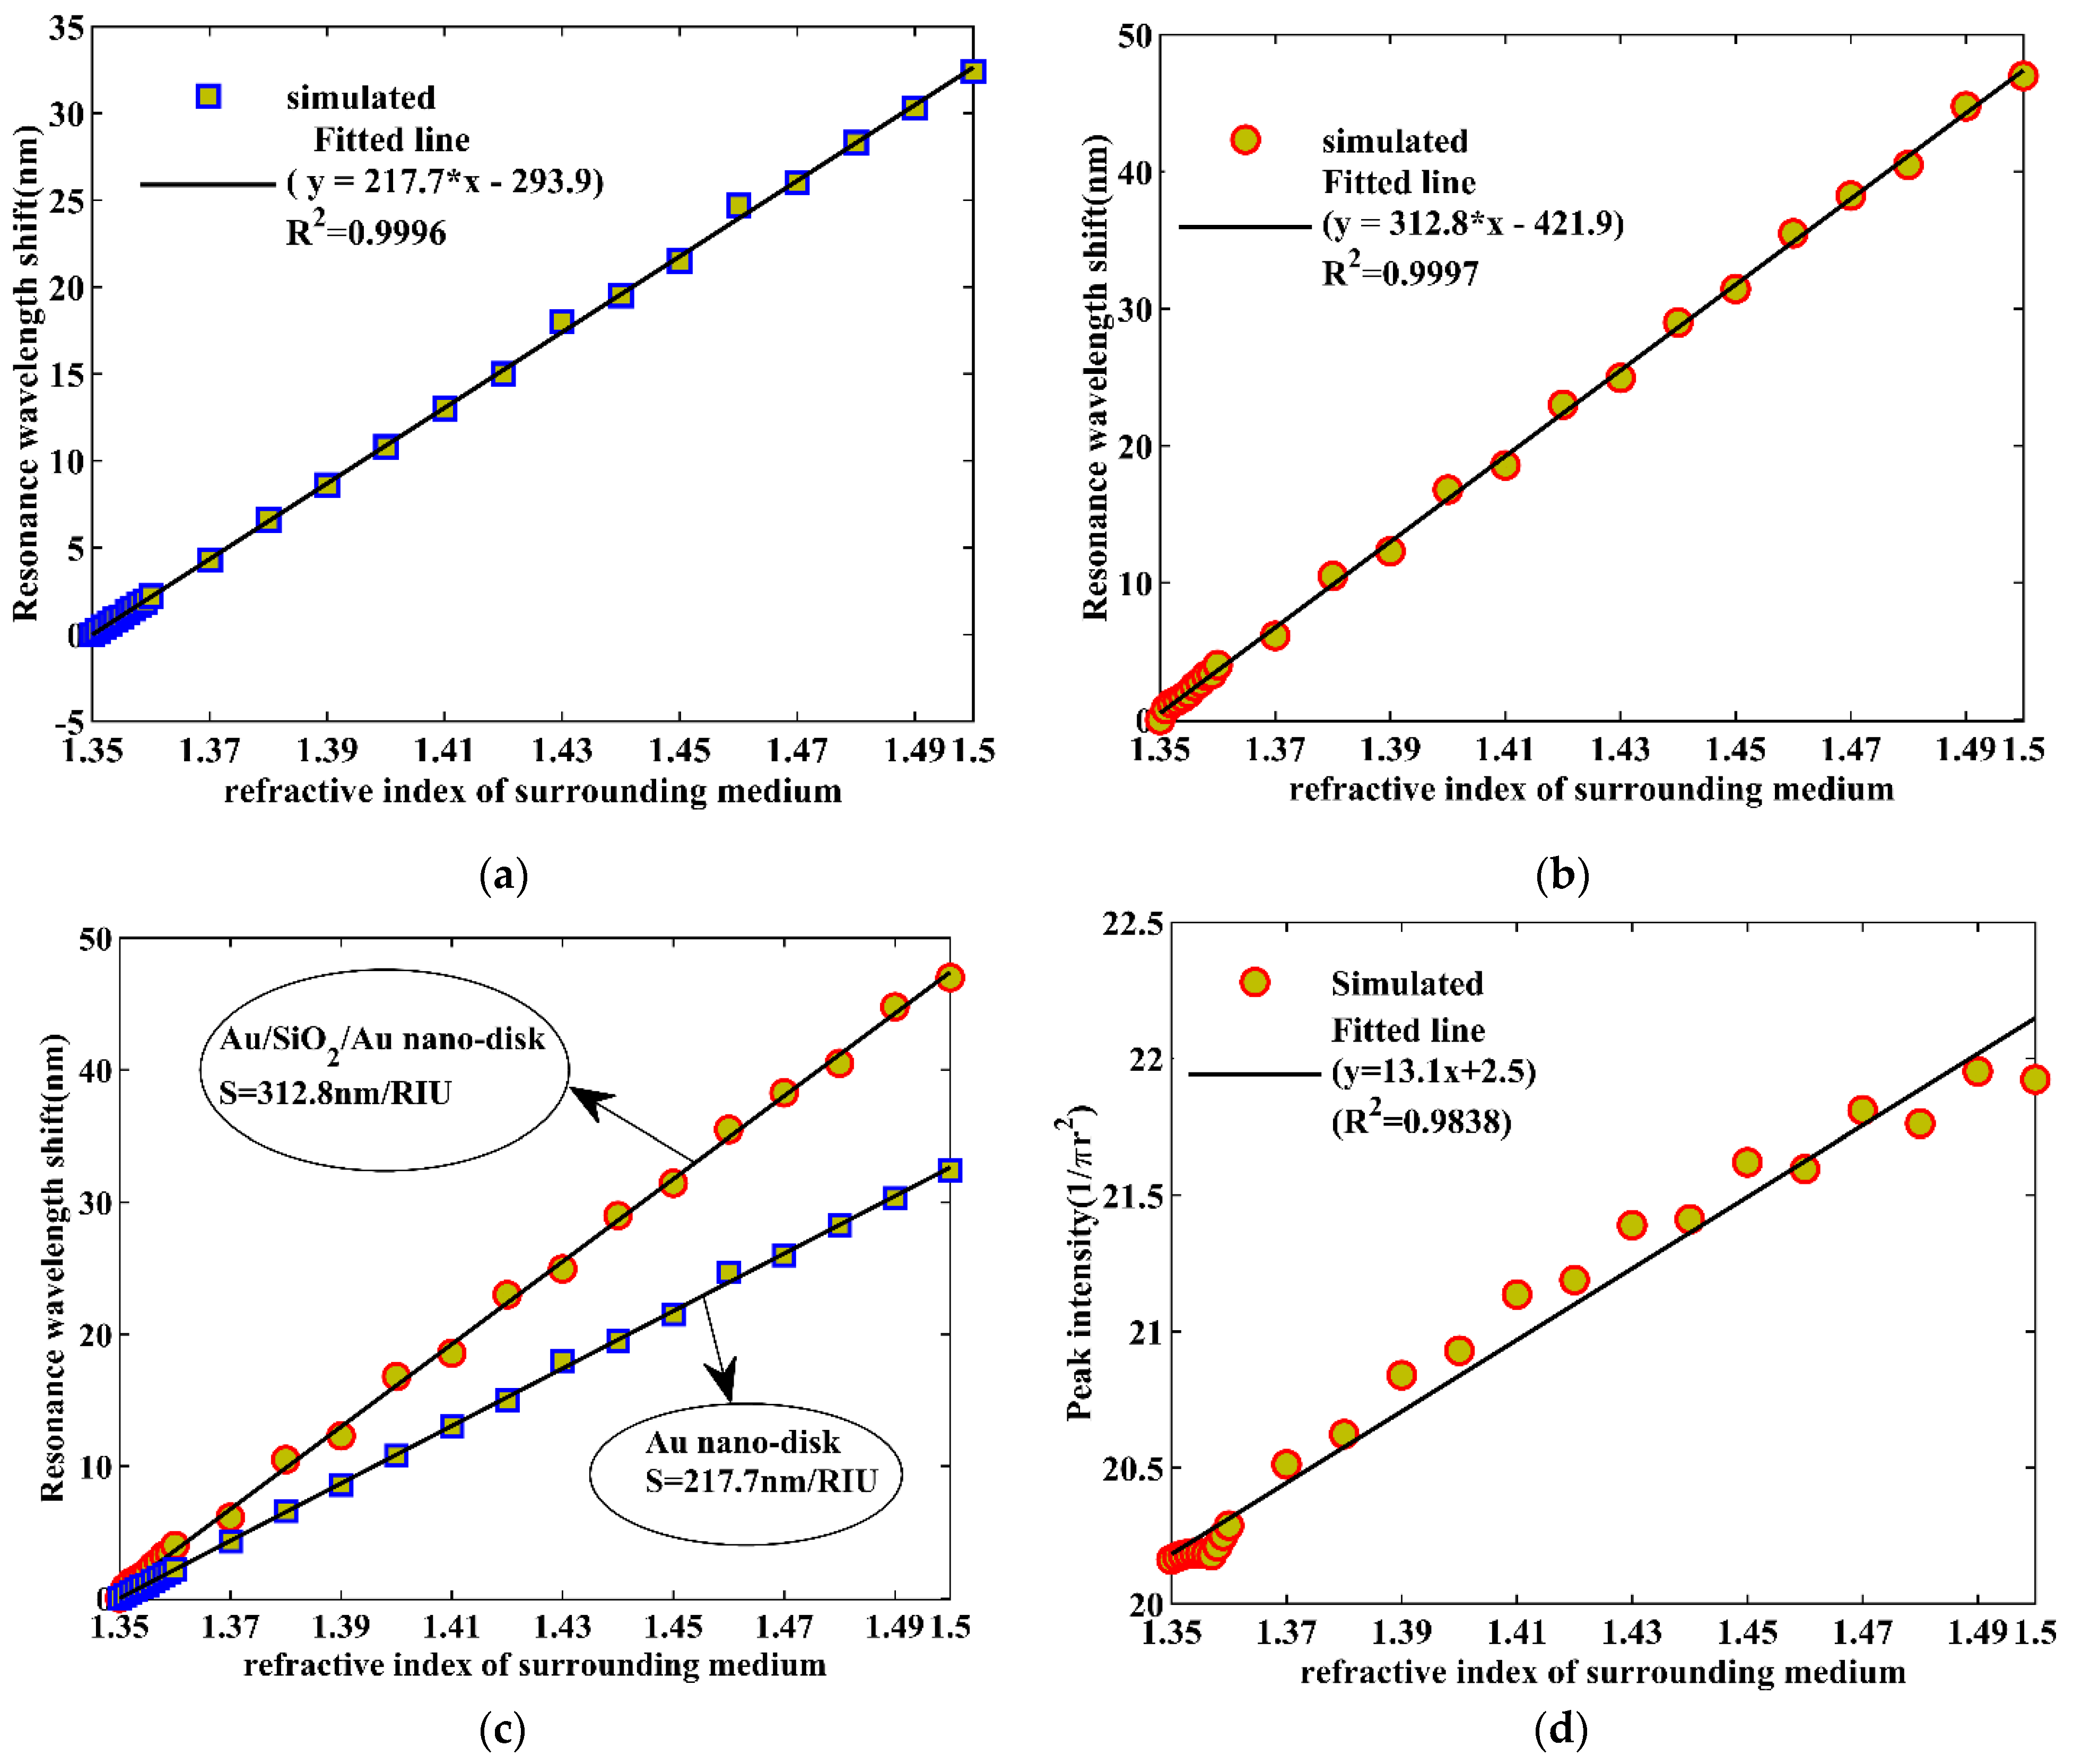
The amount of the resonance wavelength shift is proportional to the number of SARS-CoV-2 viruses present in the surrounding medium, which was modeled by the refractive index change in this work. Figure 7a,b show the wavelength shift as a function of surrounding refractive indices for a biosensor based on Au nano-discs and Au/SiO2/Au nano-discs, respectively. As seen in these figures, the resonance wavelength shift had an approximately linear relationship with the refractive index change of the surrounding medium. The progressive equation for linear fitting could be written as y = 217.7x − 293.9 for the Au nano-disc and y = 312.8x − 421.9 for the Au/SiO2/Au nano-disc, where y is the amount of wavelength shift, and x is the refractive index of the analyte. Considering the entire range of refractive index, the R-squared value was calculated as 0.9997, which shows that the designed sensor was relatively linear. The existence of some nonlinearity at some points was due to the existence of error, as the nature of the plasmonic concept does not have an entirely linear relationship with refractive index changes [66,67,68]. The peak wavelength shifted by approximately 32.4 nm and 47 nm for the Au and Au/SiO2/Au nano-discs, respectively, when the surrounding medium refractive index changed from 1.35 (no binding) to 1.5 (full binding). Figure 7c compares the wavelength shift as a function of surrounding refractive indices for a biosensor based on Au and Au/SiO2/Au nano-discs. The main sensitivity was the slope of the fitted line according to Equation (4). According to this figure, sensitivities of 217.7 nm/RIU and 312.8 nm/RIU were obtained for the biosensor based on Au and MIM (Au/SiO2/Au) nano-discs, respectively. Thus, a small change in the surrounding medium refractive index resulted in a significant shift in the resonance wavelength.
As mentioned, the designed sensor has the capability of SARS-CoV-2 detection with a refractive index in the range of 1.35 (no binding) to 1.5 (full binding). The simulation results show that the main sensitivity of the proposed biosensor was 312.8/RIU for the Au/SiO2/Au nano-disc-based sensor, while this value was around 217.7 nm/RIU for the Au nano-disc-based sensor, representing an approximately 1.5-fold increase in sensitivity. The high sensitivity of the proposed biosensor makes it an ideal choice for detecting biological analytes like SARS-CoV-2. The existence of two interfaces of Au–SiO2 instead of a single interface improved the optical performance of the designed LSPR biosensor significantly. FWHMs of 129 nm and 77 nm were calculated for the Au nano-disc and Au/SiO2/Au nano-disc, respectively. Hence, according to the sensitivity and FWHM, the FOM was 4 and 1.7 for the Au/SiO2/Au and Au nano-disc-based sensors, respectively. In this work, we demonstrated a highly sensitive optical biosensor for detecting SARS-CoV-2 by focusing on the design and optimization of the metal–insulator–metal LSPR biosensor structure. This LSPR-based biosensor with a higher sensitivity can be utilized in different biomedical applications. Alternatively, the plasmonic resonance peak intensity variation can be used as the main sensing mechanism to determine the binding of any viruses. As shown in Figure 7d, the peak intensity amplitude variation also had a relatively linear relationship with the refractive index change of the surrounding medium.
3.3. Using SARS-CoV-2 S-Glycoprotein Solution
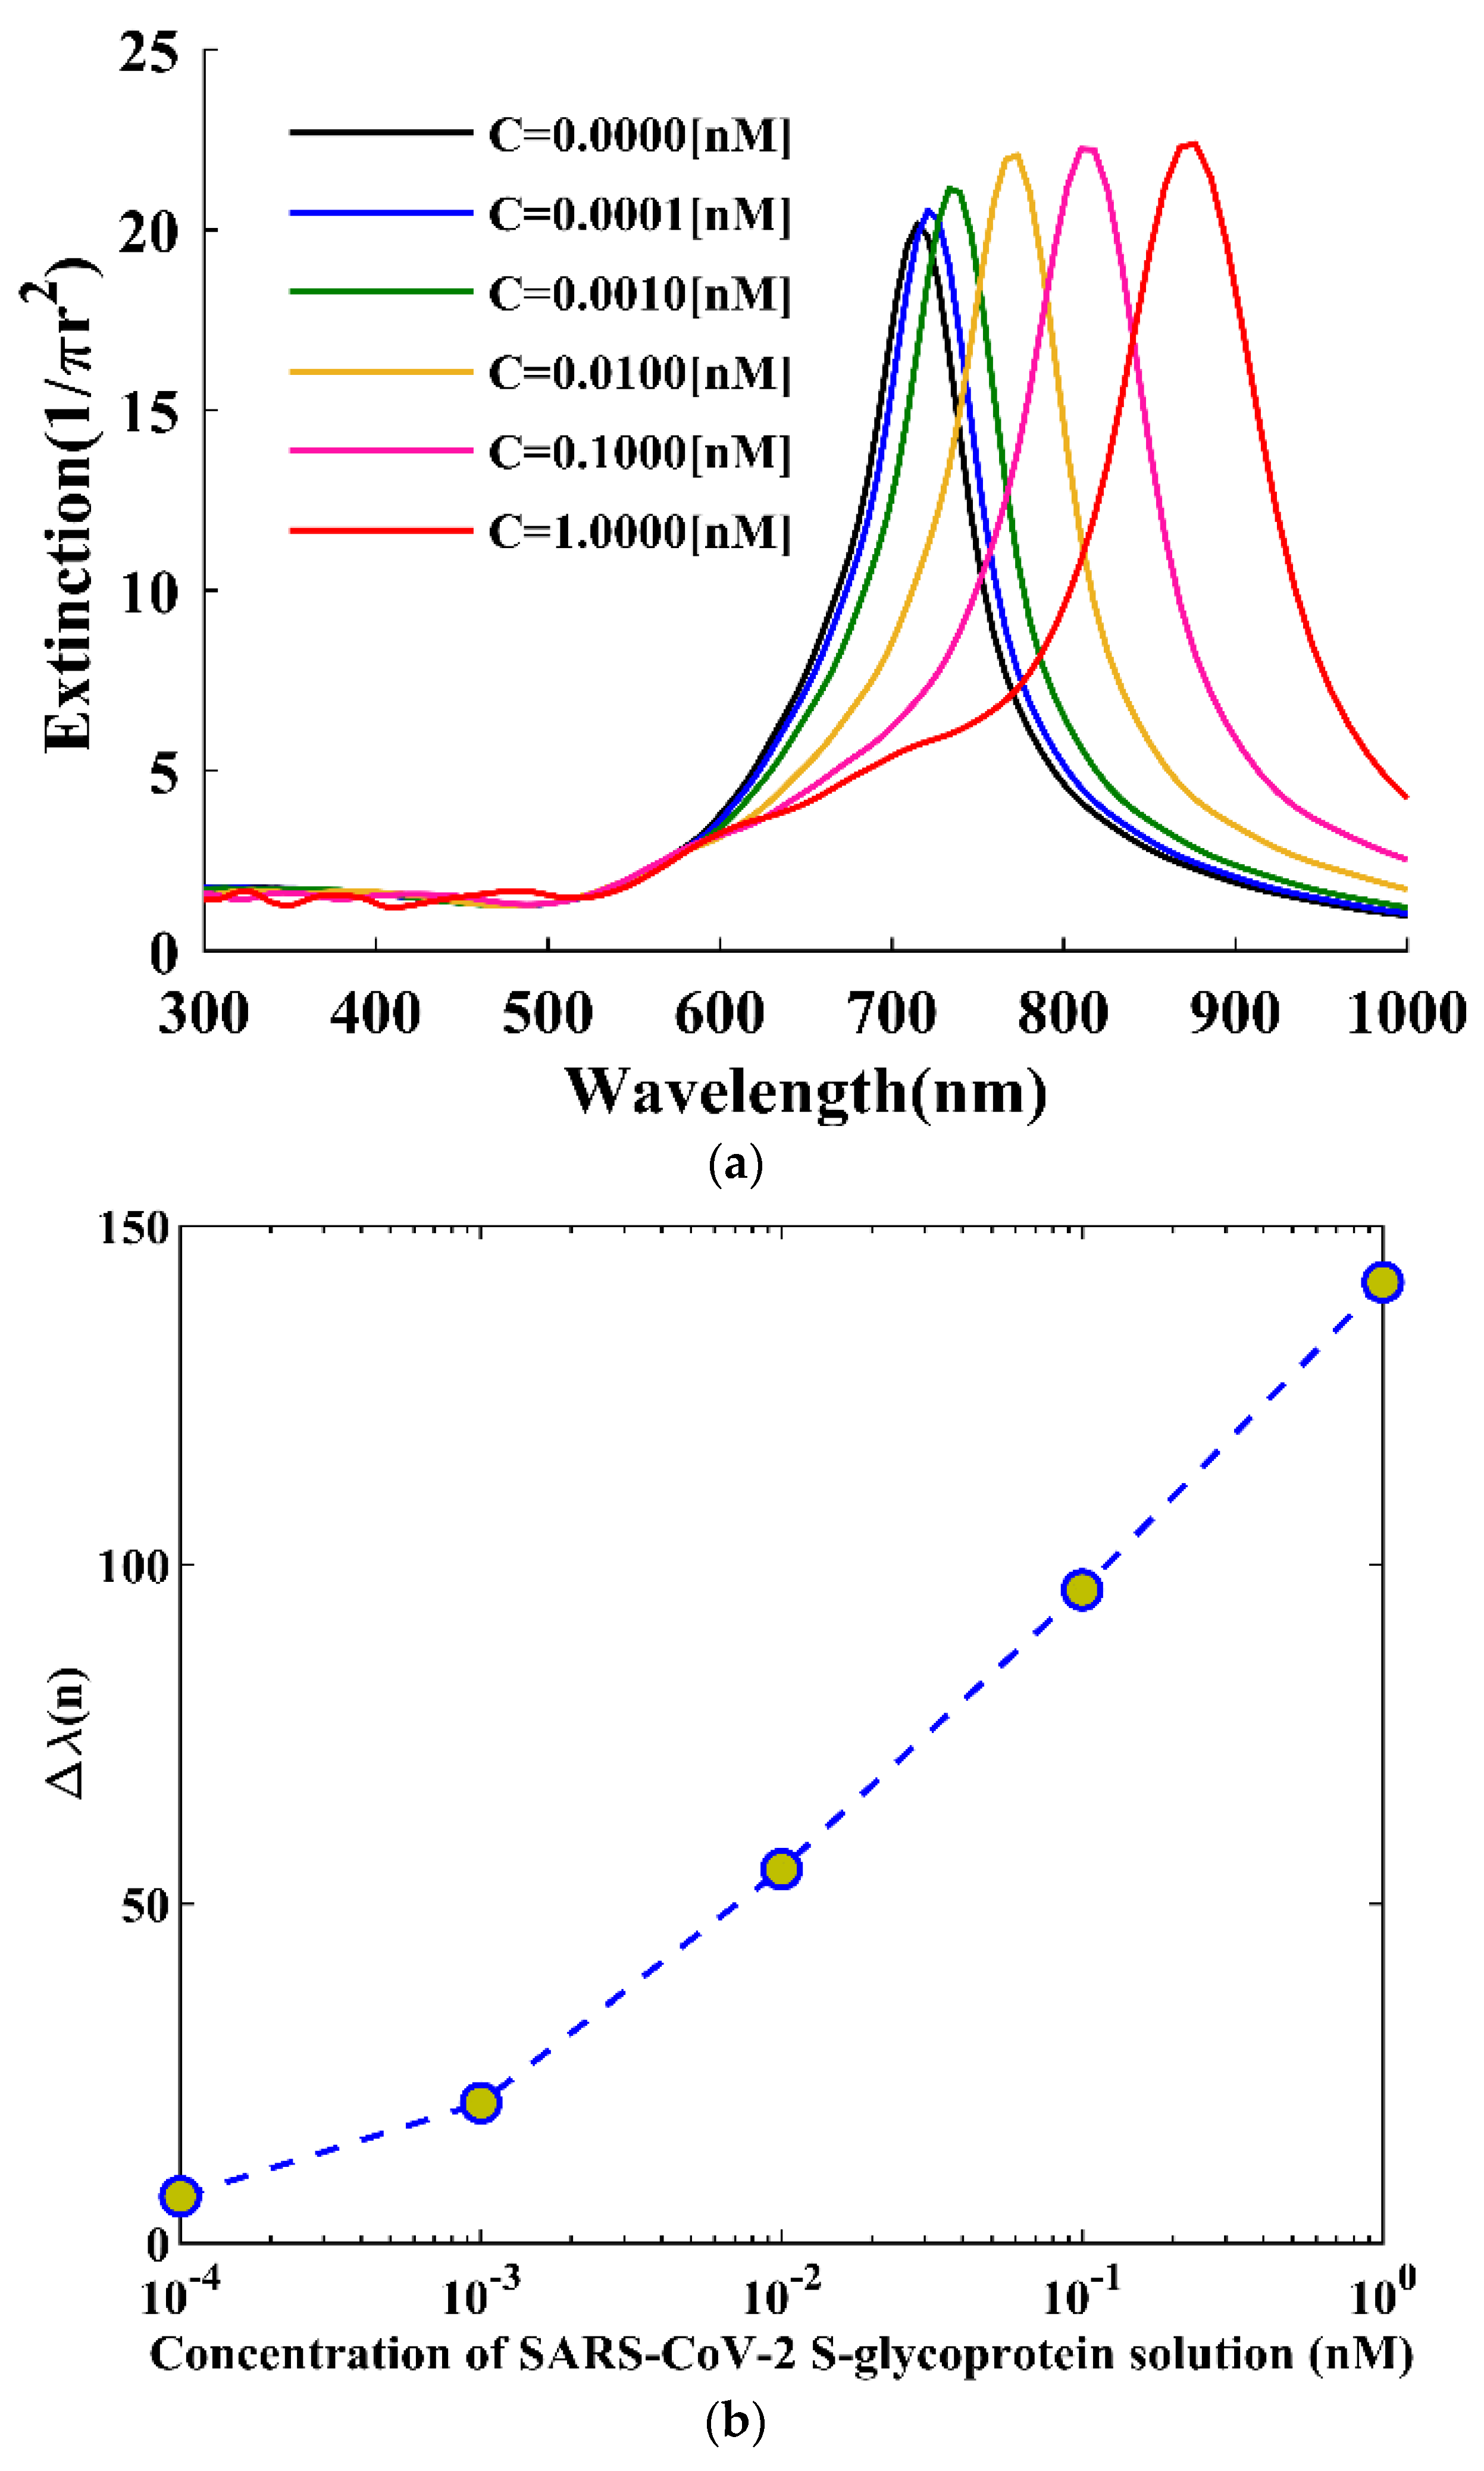
Here, refractive index changes of SARS-CoV-2 S-glycoprotein solution in different concentrations were used to analyze the performance of the designed biosensor. A change in the concentrations of the SARS-CoV-2 S-glycoprotein solution can be considered a change in the refractive index. Using these refractive index changes and applying them to our biosensor, the extinction was calculated as shown in Figure 8a for different concentrations of the SARS-CoV-2 S-glycoprotein solution. Furthermore, the wavelength shift as a function of concentration was calculated, as shown in Figure 8b. As can be seen, our designed sensor had relatively higher wavelength shifts, which helped us to detect different concentrations of SARS-CoV-2.
For a further comparison, the performance parameters of the proposed biosensor with the different concentrations of the SARS-CoV-2 S-glycoprotein solution are summarized in Table 1. The results indicate that our proposed sensor has good sensitivity and FOM.
Before comparison of our designed sensor with previously reported studies, it is important to mention that there are different cases of biosensors based on plasmonic such as fiber optics, LSPR nanoparticles, and SPR structures. Thus, a comparison of their performance parameters is somewhat difficult, as each method has some advantages and disadvantages. For instance, in the case of fiber-optic plasmonic biosensors, the fiber geometry must be modified to obtain higher sensitivity. In the case of sensitivity, SPR biosensors have a long electromagnetic field decay length compared to LSPR biosensors, which makes them less sensitive to refractive index changes [34,69]. In the case of linearity, SPR shows good linearity only at short refractive index changes, whereas, for higher refractive index changes, it has lower linearity. LSPR does not suffer from this problem, with much better linearity than the SPR sensor through the whole RI range [34,69]. Furthermore, a prism is not required to combine light for the LSPR technique, meaning the optical hardware is simpler and the system can be made more affordable and more compact [70]. The angle is not essential for LSPR, which leads to a spectral shift and not a change in angle; this makes the instrument more resistant to mechanical noise and vibration. Here, our design was based on the LSPR effect, so as to obtain higher sensitivities. As a result, we designed an LSPR-based biosensor with good linearity and higher sensitivity to detect SARS-CoV-2. It is worth mentioning that the performance of the LSPR biosensors strongly depends on the shape, size, and composition of nanoparticles. The performance parameters such as sensitivity and FOM of the proposed structure are compared with some of the previously reported studies in Table 2. The sensitivity and FOM were relatively higher in our proposed sensor compared to other sensors. The FOM revealed a high value for this sensor, making it a more desirable sensor for use in bio-analyte detection. The accuracy and repeatability of this sensor will be analyzed through experimental results as future steps of this research project.
4. Conclusions
In conclusion, we developed a highly sensitive Au/SiO2/Au metal/insulator/metal LSPR biosensor to detect SARS-CoV-2. A strong coupling between the two plasmonic interfaces in the Au/SiO2/Au enables us to design a biosensor with high sensitivity. The designed sensor provides a sensing alternative for fast detection of SARS-CoV-2. Exponentially decaying plasmonic waves at the two Au/SiO2 interfaces results in a higher resonance peak and, hence, a higher sensitivity (312.8 nm/RIU). The peak wavelength shift was 47 nm when the surrounding medium refractive index changed from 1.35 (no binding) to 1.5 (full binding). Using the previously reported refractive index changes in different concentrations of the SARS-CoV-2 S-glycoprotein solution, the sensitivity and FOM were calculated as a function of concentration. Hence, our proposed Au/SiO2/Au plasmonic biosensor has the capability of SARS-CoV-2 detection with high sensitivity.
Author Contributions
A.T. and H.H. contributed to the basic idea, conceptualization, methodology, validation, formal analysis, investigation, data curation, writing, editing, visualization, and supervision. All authors have read and agreed to the published version of the manuscript.
Funding
This research received no external funding.
Institutional Review Board Statement
Not applicable.
Informed Consent Statement
Not applicable.
Data Availability Statement
Not applicable.
Acknowledgments
The author would like to express their sincere thanks to the university of Mohaghegh Ardabili, Ryerson University, and the University of Toronto for their technical support.
Conflicts of Interest
The authors declare no conflict of interest.
References
- Anand, U.; Cabreros, C.; Mal, J.; Ballesteros, F., Jr.; Sillanpää, M.; Tripathi, V.; Bontempi, E.J. Novel coronavirus disease 2019 (COVID-19) pandemic: From transmission to control with an interdisciplinary vision. Environ. Res. 2021, 197, 111126. [Google Scholar] [CrossRef] [PubMed]
- Sallard, E.; Halloy, J.; Casane, D.; Decroly, E.; van Helden, J. Tracing the origins of SARS-CoV-2 in coronavirus phylogenies: A review. Environ. Chem. Lett. 2021, 19, 769–785. [Google Scholar] [CrossRef] [PubMed]
- Diamond, M.; Chen, R.; Xie, X.; Case, J.; Zhang, X.; VanBlargan, L.; Liu, Y.; Liu, J.; Errico, J.; Winkler, E.J. SARS-CoV-2 variants show resistance to neutralization by many monoclonal and serum-derived polyclonal antibodies. Res. Sq. 2021. [Google Scholar] [CrossRef]
- Crozier, A.; Rajan, S.; Buchan, I.; McKee, M. Put to the test: Use of rapid testing technologies for COVID-19. BMJ 2021, 372, n208. [Google Scholar] [CrossRef]
- Azhar, M.; Phutela, R.; Kumar, M.; Ansari, A.H.; Rauthan, R.; Gulati, S.; Sharma, N.; Sinha, D.; Sharma, S.; Singh, S.; et al. Rapid and accurate nucleobase detection using FnCas9 and its application in COVID-19 diagnosis. Biosens. Bioelectron. 2021, 183, 113207. [Google Scholar] [CrossRef]
- Sheridan, C. Fast, portable tests come online to curb coronavirus pandemic. Nat. Biotechnol. 2020, 38, 515–518. [Google Scholar] [CrossRef]
- Corman, V.M.; Landt, O.; Kaiser, M.; Molenkamp, R.; Meijer, A.; Chu, D.K.W.; Bleicker, T.; Brünink, S.; Schneider, J.; Schmidt, M.L.; et al. Detection of 2019 novel coronavirus (2019-nCoV) by real-time RT-PCR. Eurosurveillance 2020, 25, 2000045. [Google Scholar] [CrossRef] [Green Version]
- Augustine, R.; Hasan, A.; Das, S.; Ahmed, R.; Mori, Y.; Notomi, T.; Kevadiya, B.D.; Thakor, A.S. Loop-Mediated Isothermal Amplification (LAMP): A Rapid, Sensitive, Specific, and Cost-Effective Point-of-Care Test for Coronaviruses in the Context of COVID-19 Pandemic. Biology 2020, 9, 182. [Google Scholar] [CrossRef]
- Go, Y.Y.; Rajapakse, R.P.V.J.; Kularatne, S.A.M.; Lee, P.-Y.A.; Ku, K.B.; Nam, S.; Chou, P.-H.; Tsai, Y.-L.; Liu, Y.-L.; Chang, H.-F.G.; et al. A Pan-Dengue Virus Reverse Transcription-Insulated Isothermal PCR Assay Intended for Point-of-Need Diagnosis of Dengue Virus Infection by Use of the POCKIT Nucleic Acid Analyzer. J. Clin. Microbiol. 2016, 54, 1528–1535. [Google Scholar] [CrossRef] [Green Version]
- Quick, J.; Grubaugh, N.D.; Pullan, S.T.; Claro, I.M.; Smith, A.D.; Gangavarapu, K.; Oliveira, G.; Robles-Sikisaka, R.; Rogers, T.F.; Beutler, N.A.; et al. Multiplex PCR method for MinION and Illumina sequencing of Zika and other virus genomes directly from clinical samples. Nat. Protoc. 2017, 12, 1261–1276. [Google Scholar] [CrossRef] [Green Version]
- Broughton, J.P.; Deng, X.; Yu, G.; Fasching, C.L.; Servellita, V.; Singh, J.; Miao, X.; Streithorst, J.A.; Granados, A.; Sotomayor-Gonzalez, A.J. CRISPR–Cas12-based detection of SARS-CoV-2. Nat. Biotechnol. 2020, 38, 870–874. [Google Scholar] [CrossRef] [Green Version]
- Pan, Y.; Zhang, D.; Yang, P.; Poon, L.L.; Wang, Q. Viral load of SARS-CoV-2 in clinical samples. Lancet Infect. Dis. 2020, 20, 411–412. [Google Scholar] [CrossRef]
- Adams, E.; Ainsworth, M.; Anand, R.; Andersson, M.I.; Auckland, K.; Baillie, J.K.; Barnes, E.; Beer, S.; Bell, J.I.; Berry, T.J.M. Evaluation of antibody testing for SARS-CoV-2 using ELISA and lateral flow immunoassays. MedRxiv 2020. [Google Scholar] [CrossRef] [Green Version]
- Nguyen, T.; Bang, D.D.; Wolff, A. 2019 Novel Coronavirus Disease (COVID-19): Paving the Road for Rapid Detection and Point-of-Care Diagnostics. Micromachines 2020, 11, 306. [Google Scholar] [CrossRef] [Green Version]
- Ahmadivand, A.; Gerislioglu, B.; Ramezani, Z.; Kaushik, A.; Manickam, P.; Ghoreishi, S.A. Functionalized terahertz plasmonic metasensors: Femtomolar-level detection of SARS-CoV-2 spike proteins. Biosens. Bioelectron. 2021, 177, 112971. [Google Scholar] [CrossRef]
- Shan, J.; Li, J.; Chu, X.; Xu, M.; Jin, F.; Wang, X.; Ma, L.; Fang, X.; Wei, Z.; Wang, X. High sensitivity glucose detection at extremely low concentrations using a MoS2-based field-effect transistor. RSC Adv. 2018, 8, 7942–7948. [Google Scholar] [CrossRef] [Green Version]
- Chiu, N.-F.; Kuo, C.-T.; Lin, T.-L.; Chang, C.-C.; Chen, C.-Y. Ultra-high sensitivity of the non-immunological affinity of graphene oxide-peptide-based surface plasmon resonance biosensors to detect human chorionic gonadotropin. Biosens. Bioelectron. 2017, 94, 351–357. [Google Scholar] [CrossRef]
- Ahmadivand, A.; Gerislioglu, B.; Ahuja, R.; Mishra, Y.K. Terahertz plasmonics: The rise of toroidal metadevices towards immunobiosensings. Mater. Today 2020, 32, 108–130. [Google Scholar] [CrossRef]
- Pang, H.-H.; Ke, Y.-C.; Li, N.-S.; Chen, Y.-T.; Huang, C.-Y.; Wei, K.-C.; Yang, H.-W. A new lateral flow plasmonic biosensor based on gold-viral biomineralized nanozyme for on-site intracellular glutathione detection to evaluate drug-resistance level. Biosens. Bioelectron. 2020, 165, 112325. [Google Scholar] [CrossRef]
- Jiang, D.; Yang, C.; Fan, Y.; Leung, H.-M.P.; Inthavong, K.; Zhang, Y.; Li, Z.; Yang, M. Ultra-sensitive photoelectrochemical aptamer biosensor for detecting E. coli O157: H7 based on nonmetallic plasmonic two-dimensional hydrated defective tungsten oxide nanosheets coupling with nitrogen-doped graphene quantum dots (dWO3•H2O@ N-GQDs). Biosens. Bioelectron. 2021, 183, 113214. [Google Scholar] [CrossRef]
- Riedel, T.; Surman, F.; Hageneder, S.; Pop-Georgievski, O.; Noehammer, C.; Hofner, M.; Brynda, E.; Rodriguez-Emmenegger, C.; Dostálek, J. Hepatitis B plasmonic biosensor for the analysis of clinical serum samples. Biosens. Bioelectron. 2016, 85, 272–279. [Google Scholar] [CrossRef] [PubMed]
- Niu, L.; Cheng, K.; Wu, Y.; Wang, T.; Shi, Q.; Liu, D.; Du, Z. Sensitivity improved plasmonic gold nanoholes array biosensor by coupling quantum-dots for the detection of specific biomolecular interactions. Biosens. Bioelectron. 2013, 50, 137–142. [Google Scholar] [CrossRef] [PubMed]
- Cetin, A.E.; Topkaya, S.N. Photonic crystal and plasmonic nanohole based label-free biodetection. Biosens. Bioelectron. 2019, 132, 196–202. [Google Scholar] [CrossRef] [PubMed]
- Sugumaran, S.; Jamlos, M.F.; Ahmad, M.N.; Bellan, C.S.; Schreurs, D. Nanostructured materials with plasmonic nanobiosensors for early cancer detection: A past and future prospect. Biosens. Bioelectron. 2018, 100, 361–373. [Google Scholar] [CrossRef] [PubMed]
- Schasfoort, R.B. Handbook of Surface Plasmon Resonance; Royal Society of Chemistry: London, UK, 2017. [Google Scholar]
- Yoo, H.; Shin, J.; Sim, J.; Cho, H.; Hong, S. Reusable surface plasmon resonance biosensor chip for the detection of H1N1 influenza virus. Biosens. Bioelectron. 2020, 168, 112561. [Google Scholar] [CrossRef] [PubMed]
- Manoharan, H.; Kalita, P.; Gupta, S.; Sai, V. Plasmonic biosensors for bacterial endotoxin detection on biomimetic C-18 supported fiber optic probes. Biosens. Bioelectron. 2019, 129, 79–86. [Google Scholar] [CrossRef]
- Wang, Q.; Jing, J.-Y.; Wang, B.-T. Highly Sensitive SPR Biosensor Based on Graphene Oxide and Staphylococcal Protein A Co-Modified TFBG for Human IgG Detection. IEEE Trans. Instrum. Meas. 2018, 68, 3350–3357. [Google Scholar] [CrossRef]
- Wang, W.; Mai, Z.; Chen, Y.; Wang, J.; Li, L.; Su, Q.; Li, X.; Hong, X. A label-free fiber optic SPR biosensor for specific detection of C-reactive protein. Sci. Rep. 2017, 7, 16904. [Google Scholar] [CrossRef]
- Mudgal, N.; Yupapin, P.; Ali, J.; Singh, G. BaTiO3-Graphene-Affinity Layer–Based Surface Plasmon Resonance (SPR) Biosensor for Pseudomonas Bacterial Detection. Plasmonics 2020, 15, 1221–1229. [Google Scholar] [CrossRef]
- Hossain, B.; Islam, M.; Abdulrazak, L.F.; Rana, M.; Akib, T.B.A.; Hassan, M. Graphene-Coated Optical Fiber SPR Biosensor for BRCA1 and BRCA2 Breast Cancer Biomarker Detection: A Numerical Design-Based Analysis. Photonic Sens. 2019, 10, 67–79. [Google Scholar] [CrossRef] [Green Version]
- Zeni, L.; Perri, C.; Cennamo, N.; Arcadio, F.; D’Agostino, G.; Salmona, M.; Beeg, M.; Gobbi, M. A portable optical-fibre-based surface plasmon resonance biosensor for the detection of therapeutic antibodies in human serum. Sci. Rep. 2020, 10, 11154. [Google Scholar] [CrossRef]
- Lobry, M.; Lahem, D.; Loyez, M.; Debliquy, M.; Chah, K.; David, M.; Caucheteur, C. Non-enzymatic D-glucose plasmonic optical fiber grating biosensor. Biosens. Bioelectron. 2019, 142, 111506. [Google Scholar] [CrossRef] [Green Version]
- Liang, G.; Luo, Z.; Liu, K.; Wang, Y.; Dai, J.; Duan, Y.J. Fiber optic surface plasmon resonance–based biosensor technique: Fabrication, advancement, and application. Crit. Rev. Anal. Chem. 2016, 46, 213–223. [Google Scholar] [CrossRef]
- Chowdhury, A.D.; Nasrin, F.; Gangopadhyay, R.; Ganganboina, A.B.; Takemura, K.; Kozaki, I.; Honda, H.; Hara, T.; Abe, F.; Park, S.; et al. Controlling distance, size and concentration of nanoconjugates for optimized LSPR based biosensors. Biosens. Bioelectron. 2020, 170, 112657. [Google Scholar] [CrossRef]
- El Barghouti, M.; Akjouj, A.; Mir, A. Design of silver nanoparticles with graphene coatings layers used for LSPR biosensor applications. Vacuum 2020, 180, 109497. [Google Scholar] [CrossRef]
- Hedhly, M.; Wang, Y.; Zeng, S.; Ouerghi, F.; Zhou, J.; Humbert, G. Highly Sensitive Plasmonic Waveguide Biosensor Based on Phase Singularity-Enhanced Goos–Hänchen Shift. Biosensors 2022, 12, 457. [Google Scholar] [CrossRef]
- Yaghubi, F.; Zeinoddini, M.; Saeedinia, A.R.; Azizi, A.; Nemati, A.S. Design of Localized Surface Plasmon Resonance (LSPR) Biosensor for Immunodiagnostic of E. coli O157:H7 Using Gold Nanoparticles Conjugated to the Chicken Antibody. Plasmonics 2020, 15, 1481–1487. [Google Scholar] [CrossRef]
- Heidarzadeh, H. Analysis and simulation of a plasmonic biosensor for hemoglobin concentration detection using noble metal nano-particles resonances. Opt. Commun. 2019, 459, 124940. [Google Scholar] [CrossRef]
- Bahador, H.; Heidarzadeh, H. A New Proposal for Highly Sensitive Refractive Index Sensor Using Vertically Coupled Plasmonic Elliptic-Disk up Elliptic-Ring Nanoparticles. Plasmonics 2021, 16, 1223–1230. [Google Scholar] [CrossRef]
- Heidarzadeh, H.; Tavousi, A. Design of an LSPR-Enhanced Ultrathin CH3NH3PbX3 Perovskite Solar Cell Incorporating Double and Triple Coupled Nanoparticles. J. Electron. Mater. 2021, 50, 1817–1826. [Google Scholar] [CrossRef]
- O’Connor, D.; Zayats, A.V. The third plasmonic revolution. Nat. Nanotechnol. 2010, 5, 482–483. [Google Scholar] [CrossRef]
- Lalanne, P.; Yan, W.; Vynck, K.; Sauvan, C.; Hugonin, J.-P. Light Interaction with Photonic and Plasmonic Resonances. Laser Photonics Rev. 2018, 12, 1700113. [Google Scholar] [CrossRef] [Green Version]
- Vafaie, R.H.; Heidarzadeh, H. AC electrothermal assisted plasmonic biosensor for detection of low-concentration biological analytes. Opt. Laser Technol. 2021, 140, 107078. [Google Scholar] [CrossRef]
- Liang, Y.; Koshelev, K.; Zhang, F.; Lin, H.; Lin, S.; Wu, J.; Jia, B.; Kivshar, Y. Bound States in the Continuum in Anisotropic Plasmonic Metasurfaces. Nano Lett. 2020, 20, 6351–6356. [Google Scholar] [CrossRef]
- Gerislioglu, B.; Dong, L.; Ahmadivand, A.; Hu, H.; Nordlander, P.; Halas, N.J. Monolithic Metal Dimer-on-Film Structure: New Plasmonic Properties Introduced by the Underlying Metal. Nano Lett. 2020, 20, 2087–2093. [Google Scholar] [CrossRef]
- Calvo-Lozano, O.; Aviñó, A.; Friaza, V.; Medina-Escuela, A.; Huertas, C.S.; Calderón, E.J.; Eritja, R.; Lechuga, L.M.J.N. Fast and accurate pneumocystis pneumonia diagnosis in human samples using a label-free plasmonic biosensor. Nanomaterials 2020, 10, 1246. [Google Scholar] [CrossRef] [PubMed]
- Masson, J.-F. Surface Plasmon Resonance Clinical Biosensors for Medical Diagnostics. ACS Sens. 2017, 2, 16–30. [Google Scholar] [CrossRef] [PubMed]
- Klein, S.; Cortese, M.; Winter, S.L.; Wachsmuth-Melm, M.; Neufeldt, C.J.; Cerikan, B.; Stanifer, M.L.; Boulant, S.; Bartenschlager, R.; Chlanda, P. SARS-CoV-2 structure and replication characterized by in situ cryo-electron tomography. Nat. Commun. 2020, 11, 5885. [Google Scholar] [CrossRef] [PubMed]
- Bartas, M.; Brázda, V.; Bohálová, N.; Cantara, A.; Volná, A.; Stachurová, T.; Malachová, K.; Jagelská, E.B.; Porubiaková, O.; Červeň, J.; et al. In-depth bioinformatic analyses of nidovirales including human SARS-CoV-2, SARS-CoV, MERS-CoV viruses suggest important roles of non-canonical nucleic acid structures in their lifecycles. Front. Microbiol. 2020, 11, 1583. [Google Scholar] [CrossRef] [PubMed]
- Ziv, O.; Price, J.; Shalamova, L.; Kamenova, T.; Goodfellow, I.; Weber, F.; Miska, E.A. The short-and long-range RNA-RNA Interactome of SARS-CoV-2. Mol. Cell 2020, 80, 1067–1077.e1065. [Google Scholar] [CrossRef]
- Turrell, L.; Lyall, J.W.; Tiley, L.S.; Fodor, E.; Vreede, F.T. The role and assembly mechanism of nucleoprotein in influenza A virus ribonucleoprotein complexes. Nat. Commun. 2013, 4, 1591. [Google Scholar] [CrossRef] [Green Version]
- Mihaescu, G.; Chifiriuc, M.C.; Iliescu, C.; Vrancianu, C.O.; Ditu, L.-M.; Marutescu, L.G.; Grigore, R.; Berteșteanu, Ș.; Constantin, M.; Pircalabioru, G.G. SARS-CoV-2: From Structure to Pathology, Host Immune Response and Therapeutic Management. Microorganisms 2020, 8, 1468. [Google Scholar] [CrossRef]
- Li, Z.; Chen, G.Y. Current Conjugation Methods for Immunosensors. Nanomaterials 2018, 8, 278. [Google Scholar] [CrossRef] [Green Version]
- Gao, S.; Guisán, J.M.; Rocha-Martin, J. Oriented immobilization of antibodies onto sensing platforms—A critical review. Anal. Chim. Acta 2022, 1189, 338907. [Google Scholar] [CrossRef]
- Frutiger, A.; Tanno, A.; Hwu, S.; Tiefenauer, R.F.; Vörös, J.; Nakatsuka, N. Nonspecific Binding—Fundamental Concepts and Consequences for Biosensing Applications. Chem. Rev. 2021, 121, 8095–8160. [Google Scholar] [CrossRef]
- Singh, R.S.; Bull, D.J.; Dabkowski, F.P.; Clausen, E.M.; Chin, A.K. High-power, reliable operation of 730 nm AlGaAs laser diodes. Appl. Phys. Lett. 1999, 75, 2002–2004. [Google Scholar] [CrossRef]
- Asghari, A.; Wang, C.; Yoo, K.M.; Rostamian, A.; Xu, X.; Shin, J.-D.; Dalir, H.; Chen, R.T. Fast, accurate, point-of-care COVID-19 pandemic diagnosis enabled through advanced lab-on-chip optical biosensors: Opportunities and challenges. Appl. Phys. Rev. 2021, 8, 031313. [Google Scholar] [CrossRef]
- Hohenau, A.; Ditlbacher, H.; Lamprecht, B.; Krenn, J.R.; Leitner, A.; Aussenegg, F.R. Electron beam lithography, a helpful tool for nanooptics. Microelectron. Eng. 2006, 83, 1464–1467. [Google Scholar] [CrossRef]
- Aćimović, S.S.; Kreuzer, M.P.; González, M.U.; Quidant, R. Plasmon Near-Field Coupling in Metal Dimers as a Step toward Single-Molecule Sensing. ACS Nano 2009, 3, 1231–1237. [Google Scholar] [CrossRef]
- Rakhshani, M.R.; Mansouri-Birjandi, M.A. High sensitivity plasmonic refractive index sensing and its application for human blood group identification. Sens. Actuators B Chem. 2017, 249, 168–176. [Google Scholar] [CrossRef]
- Bahador, H.; Heidarzadeh, H. Highly sensitive refractive index sensor by floating nano-particles in the solution for the detection of glucose/fructose concentration. Opt. Quantum Electron. 2021, 53, 708. [Google Scholar] [CrossRef]
- Tavousi, A.; Mansouri-Birjandi, M.A.; Janfaza, M. Graphene Nanoribbon Assisted Refractometer Based Biosensor for Mid-Infrared Label-Free Analysis. Plasmonics 2019, 14, 1207–1217. [Google Scholar] [CrossRef]
- Qian, L.; Wang, K.; Zhu, W.; Han, C.; Yan, C. Enhanced sensing ability in a single-layer guided-mode resonant optical biosensor with deep grating. Opt. Commun. 2019, 452, 273–280. [Google Scholar] [CrossRef]
- Moznuzzaman, M.; Khan, I.; Islam, M.R. Nano-layered surface plasmon resonance-based highly sensitive biosensor for virus detection: A theoretical approach to detect SARS-CoV-2. AIP Adv. 2021, 11, 065023. [Google Scholar] [CrossRef]
- Yan, R.; Wang, T.; Yue, X.; Wang, H.; Zhang, Y.-H.; Xu, P.; Wang, L.; Wang, Y.; Zhang, J. Highly sensitive plasmonic nanorod hyperbolic metamaterial biosensor. Photonics Res. 2021, 10, 84. [Google Scholar] [CrossRef]
- Zhao, J.; Zhang, X.; Yonzon, C.R.; Haes, A.J.; Van Duyne, R.P. Localized surface plasmon resonance biosensors. Nanomedicine 2006, 1, 219–228. [Google Scholar] [CrossRef]
- Luan, J.; Xu, T.; Cashin, J.; Morrissey, J.J.; Kharasch, E.D.; Singamaneni, S. Environmental Stability of Plasmonic Biosensors Based on Natural versus Artificial Antibody. Anal. Chem. 2018, 90, 7880–7887. [Google Scholar] [CrossRef]
- Cao, J.; Galbraith, E.K.; Sun, T.; Grattan, K.T.V. Comparison of Surface Plasmon Resonance and Localized Surface Plasmon Resonance-based optical fibre sensors. J. Phys. Conf. Ser. 2011, 307, 012050. [Google Scholar] [CrossRef]
- Chorsi, H.T.; Zhu, Y.; Zhang, J.X.J. Patterned plasmonic surfaces—Theory, fabrication, and applications in biosensing. J. Microelectromech. Syst. 2017, 26, 718–739. [Google Scholar] [CrossRef]
- Martinsson, E.; Otte, M.A.; Shahjamali, M.M.; Sepulveda, B.; Aili, D. Substrate Effect on the Refractive Index Sensitivity of Silver Nanoparticles. J. Phys. Chem. C 2014, 118, 24680–24687. [Google Scholar] [CrossRef]
- Singh, M.; Datta, A. LSPR Excitation on Au Nanorings From Integrated Hybrid Plasmonic Aperture Waveguide and Its Application in Methanol Detection in the IR-Band. IEEE Sens. J. 2019, 19, 6119–6125. [Google Scholar] [CrossRef]
- Figueiredo, N.M.; Vaz, F.; Cunha, L.; Cavaleiro, A. Au-WO3 Nanocomposite Coatings for Localized Surface Plasmon Resonance Sensing. Materials 2020, 13, 246. [Google Scholar] [CrossRef] [PubMed] [Green Version]
- Huang, C.; Ye, J.; Wang, S.; Stakenborg, T.; Lagae, L. Gold nanoring as a sensitive plasmonic biosensor for on-chip DNA detection. Appl. Phys. Lett. 2012, 100, 173114. [Google Scholar] [CrossRef] [Green Version]
- Sun, Y.; Xia, Y. Increased sensitivity of surface plasmon resonance of gold nanoshells compared to that of gold solid colloids in response to environmental changes. Anal. Chem. 2002, 74, 5297–5305. [Google Scholar] [CrossRef]
- Lee, S.-W.; Lee, K.-S.; Ahn, J.; Lee, J.-J.; Kim, M.-G.; Shin, Y.-B. Highly Sensitive Biosensing Using Arrays of Plasmonic Au Nanodisks Realized by Nanoimprint Lithography. ACS Nano 2011, 5, 897–904. [Google Scholar] [CrossRef]
- Verellen, N.; Van Dorpe, P.; Huang, C.; Lodewijks, K.; VandenBosch, G.A.E.; Lagae, L.; Moshchalkov, V.V. Plasmon Line Shaping Using Nanocrosses for High Sensitivity Localized Surface Plasmon Resonance Sensing. Nano Lett. 2011, 11, 391–397. [Google Scholar] [CrossRef]
Figure 1.
(a) SARS-CoV-2 structure; (b) structure of the proposed SARS-CoV-2 biosensor based on metal–insulator–metal nanoparticles.
Figure 1.
(a) SARS-CoV-2 structure; (b) structure of the proposed SARS-CoV-2 biosensor based on metal–insulator–metal nanoparticles.


Figure 2.
Schematic illustration of the fabrication process of Au/SiO2/Au MIM nano-discs.

Figure 3.
(a) Electrical field distribution surrounding the MIM nanoparticles. (b) Comparison between the extinction spectra of Au nano-disc and Au/SiO2/Au MIM nano-disc.
Figure 3.
(a) Electrical field distribution surrounding the MIM nanoparticles. (b) Comparison between the extinction spectra of Au nano-disc and Au/SiO2/Au MIM nano-disc.

Figure 4.
Extinction, resonance wavelength, and peak intensity of MIM nanocylinders: (a) 40 nm/40 nm/40 nm and (b) 50 nm/50 nm/50 nm Au/SiO2/Au thicknesses.
Figure 4.
Extinction, resonance wavelength, and peak intensity of MIM nanocylinders: (a) 40 nm/40 nm/40 nm and (b) 50 nm/50 nm/50 nm Au/SiO2/Au thicknesses.

Figure 5.
Extinction, resonance wavelength and peak intensity of MIM nanocylinders: (a) 60 nm/60 nm/60 nm and (b) 70 nm/70 nm/70 nm Au/SiO2/Au thicknesses.
Figure 5.
Extinction, resonance wavelength and peak intensity of MIM nanocylinders: (a) 60 nm/60 nm/60 nm and (b) 70 nm/70 nm/70 nm Au/SiO2/Au thicknesses.

Figure 6.
(a) Contour plot of extinction versus wavelength and refractive index of environment. (b) Comparison of the extinction as a function of wavelength for three cases of SARS-CoV-2 concentration (no binding, medium binding, and full binding).
Figure 6.
(a) Contour plot of extinction versus wavelength and refractive index of environment. (b) Comparison of the extinction as a function of wavelength for three cases of SARS-CoV-2 concentration (no binding, medium binding, and full binding).


Figure 7.
(a) Resonance wavelength shifts as a function of the refractive index of the surrounding medium for Au nano-disc. (b) Resonance wavelength shifts as a function of the refractive index of the surrounding medium for Au/SiO2/Au nano-disc. (c) Comparison of the sensitivity for Au/SiO2/Au nano-disc- and Au nano-disc-based biosensors. (d) Peak intensity as a function of the refractive index of the surrounding medium and (c).

Figure 8.
(a) Extinction as a function of wavelength for different concentrations of the SARS-CoV-2 S-glycoprotein solution. (b) The wavelength shift as a function of concentration.
Figure 8.
(a) Extinction as a function of wavelength for different concentrations of the SARS-CoV-2 S-glycoprotein solution. (b) The wavelength shift as a function of concentration.


Table 1.
The performance parameters of the proposed biosensor for different concentrations of the SARS-CoV-2 S-glycoprotein solution.
Table 1.
The performance parameters of the proposed biosensor for different concentrations of the SARS-CoV-2 S-glycoprotein solution.
| C (nM) | Δn (RIU) | Δλ (nm) | S (nm/RIU) | FOM |
|---|---|---|---|---|
| 0.0000 | 0.0000 | - | - | - |
| 0.0001 | 0.0220 | 6.91 | 314 | 4 |
| 0.0010 | 0.0660 | 20.71 | 313.8 | 4 |
| 0.0100 | 0.1760 | 55.1 | 313.1 | 4 |
| 0.1000 | 0.3080 | 96.3 | 312.7 | 4 |
| 1.0000 | 0.4840 | 141.7 | 312.2 | 4 |
Table 2.
Comparison of the sensitivity and FOM of reported in various plasmonic nanostructures with this work.
Table 2.
Comparison of the sensitivity and FOM of reported in various plasmonic nanostructures with this work.
| Type [Reference] | Method | S (nm/RIU) | FOM |
|---|---|---|---|
| Nanosphere [69] | LSPR | 148 | 3.3 |
| Nano-cube [69] | LSPR | 204 | 3.7 |
| Nanoplate [69] | LSPR | 233 | 4.4 |
| Nanoring [70] | LSPR | 66 | 7.66 |
| Nanocomposites [71] | LSPR | 180 | 1 |
| Gold nanoring [72] | LSPR | 350 | 3.1 |
| Gold colloidal nanoparticles [73] | LSPR | 71 | - |
| Hollow gold nanoshell [73] | LSPR | 408 | - |
| Arrays of gold nano-disc [74] | LSPR | 167 | - |
| Nanocross [75] | LSPR | 1000 | 6.6 |
| Fiber optics [76] | LSPR | 783–1933 | - |
| Nanopillar arrays [77] | SPR | 675 | 112.5 |
| MIM nano-disc (This work) | 312.8 | 4 |
Publisher’s Note: MDPI stays neutral with regard to jurisdictional claims in published maps and institutional affiliations. |
© 2022 by the authors. Licensee MDPI, Basel, Switzerland. This article is an open access article distributed under the terms and conditions of the Creative Commons Attribution (CC BY) license (https://creativecommons.org/licenses/by/4.0/).
Share and Cite
MDPI and ACS Style
Taghipour, A.; Heidarzadeh, H. Design and Analysis of Highly Sensitive LSPR-Based Metal–Insulator–Metal Nano-Discs as a Biosensor for Fast Detection of SARS-CoV-2. Photonics 2022, 9, 542. https://doi.org/10.3390/photonics9080542
AMA Style
Taghipour A, Heidarzadeh H. Design and Analysis of Highly Sensitive LSPR-Based Metal–Insulator–Metal Nano-Discs as a Biosensor for Fast Detection of SARS-CoV-2. Photonics. 2022; 9(8):542. https://doi.org/10.3390/photonics9080542
Chicago/Turabian StyleTaghipour, Ata, and Hamid Heidarzadeh. 2022. "Design and Analysis of Highly Sensitive LSPR-Based Metal–Insulator–Metal Nano-Discs as a Biosensor for Fast Detection of SARS-CoV-2" Photonics 9, no. 8: 542. https://doi.org/10.3390/photonics9080542
Note that from the first issue of 2016, this journal uses article numbers instead of page numbers. See further details here.