
Association between Ambient Air Pollution and Emergency Room Visits for Pediatric Respiratory Diseases: The Impact of COVID-19 Pandemic

 , ,
, ,
Abstract
:1. Introduction
- (1)
- To evaluate the effects of short-term exposure to PM2.5 and other air pollutants on pediatric respiratory disease ED visits.
- (2)
- To explore the different hazard effects of PM2.5 and other air pollutants on pediatric respiratory diseases before and during the COVID-19 pandemic.
2. Methods
2.1. Study Population
2.2. Pollutant and Meteorological Data
2.3. Statistical Method
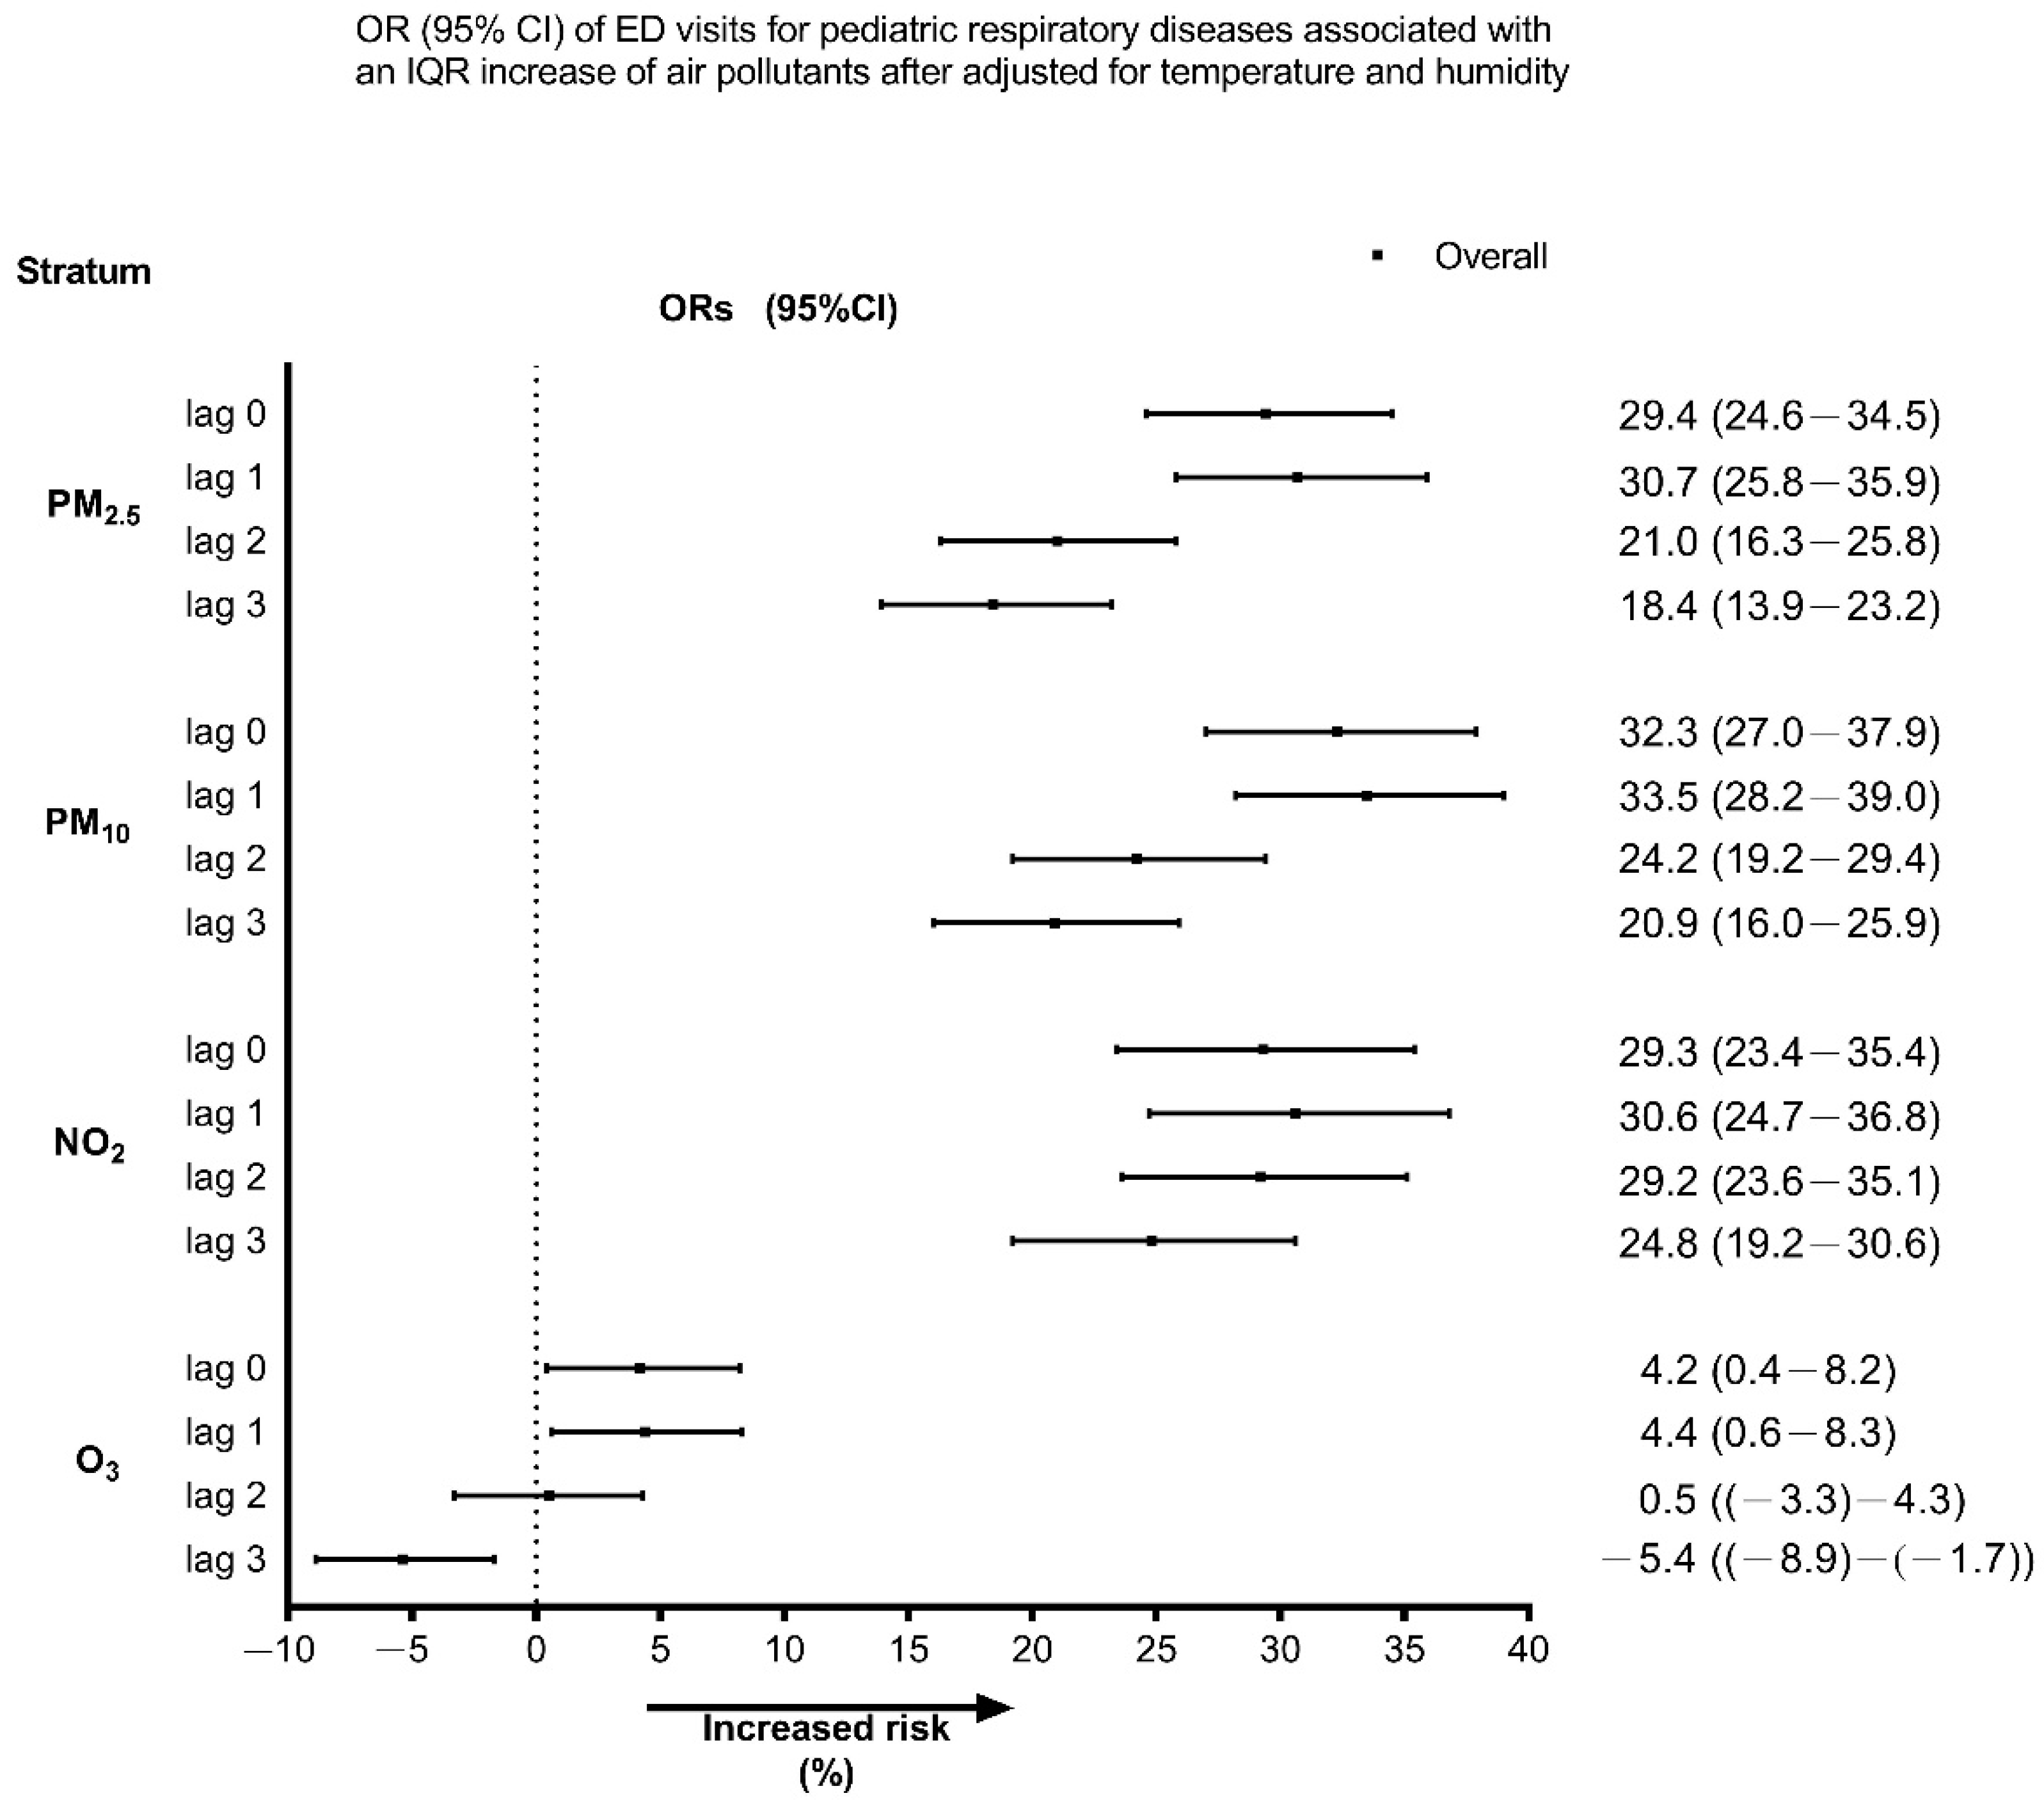
3. Results
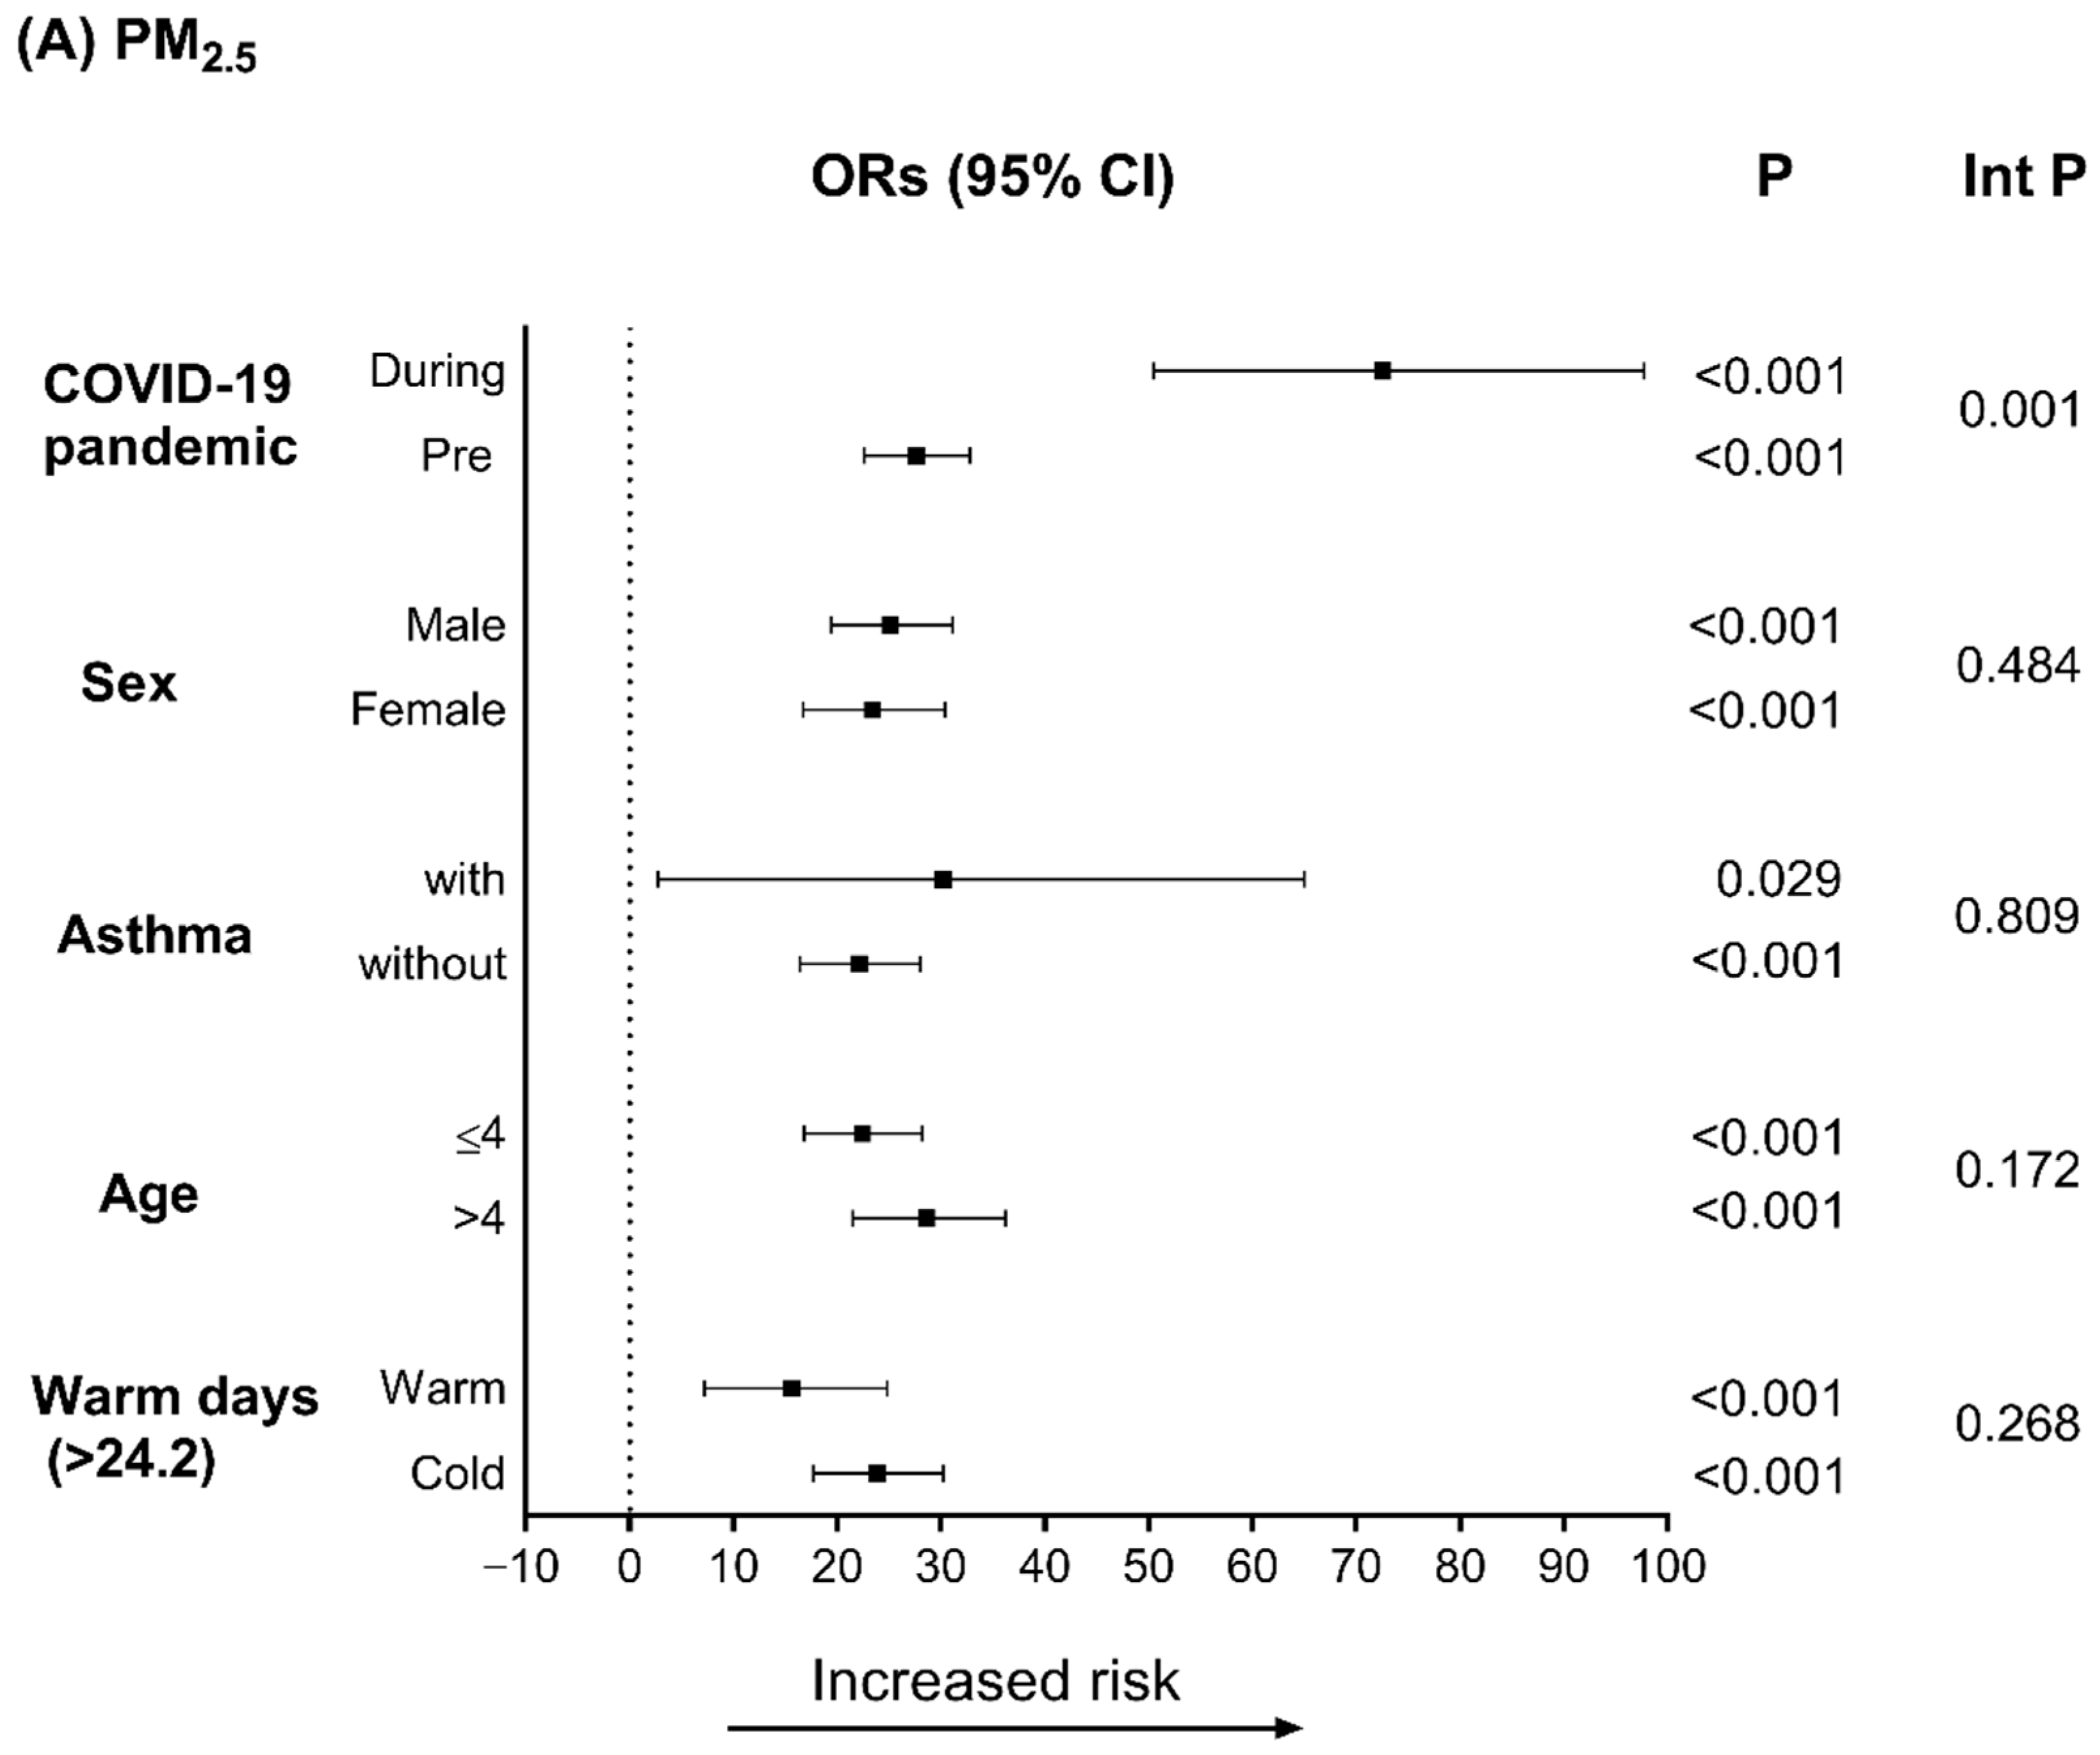
4. Discussion
5. Conclusions
Supplementary Materials
Author Contributions
Funding
Institutional Review Board Statement
Data Availability Statement
Acknowledgments
Conflicts of Interest
References
- Jeffery, M.M.; D’Onofrio, G.; Paek, H.; Platts-Mills, T.F.; Soares, W.E., 3rd; Hoppe, J.A.; Genes, N.; Nath, B.; Melnick, E.R. Trends in Emergency Department Visits and Hospital Admissions in Health Care Systems in 5 States in the First Months of the COVID-19 Pandemic in the US. JAMA Intern. Med. 2020, 180, 1328–1333. [Google Scholar] [CrossRef] [PubMed]
- Bres Bullrich, M.; Fridman, S.; Mandzia, J.L. COVID-19: Stroke Admissions, Emergency Department Visits, and Prevention Clinic Referrals. Can. J. Neurol. Sci. 2020, 47, 693–696. [Google Scholar] [CrossRef] [PubMed]
- Liu, T.-Y.; Tsai, M.-T.; Cheng, F.-J.; Cheng, C.-Y. The Influence of the COVID-19 Pandemic in an Emergency Department for Cardio-Cerebrovascular Disease Visits in Taiwan. Cerebrovasc. Dis. 2021, 50, 612–614. [Google Scholar] [CrossRef]
- Sung, C.-W.; Lu, T.-C.; Fang, C.-C.; Huang, C.-H.; Chen, W.-J.; Chen, S.-C.; Tsai, C.L. Impact of COVID-19 pandemic on emergency department services acuity and possible collateral damage. Resuscitation 2020, 153, 185–186. [Google Scholar] [CrossRef] [PubMed]
- Tu, Y.P.; Jennings, R.; Hart, B.; Cangelosi, G.A.; Wood, R.C.; Wehber, K.; Verma, P.; Vojta, D.; Berke, E.M. Swabs Collected by Patients or Health Care Workers for SARS-CoV-2 Testing. N. Engl. J. Med. 2020, 383, 494–496. [Google Scholar] [CrossRef] [PubMed]
- Attanasi, M.; Porreca, A.; Papa, G.F.S.; Donato, G.D.; Cauzzo, C.; Patacchiola, R.; Filippo, P.D.; Pillo, S.D.; Chiarelli, F. Emergency Department Visits for allergy re-lated-disorders among children: Experience of a single Italian hospital during the first wave of the COVID-19 pandemic. Multidiscip. Respir. Med. 2021, 16, 786. [Google Scholar] [CrossRef] [PubMed]
- Muhammad, S.; Long, X.; Salman, M. COVID-19 pandemic and environmental pollution: A blessing in disguise? Sci. Total Environ. 2020, 728, 138820. [Google Scholar] [CrossRef]
- Mahato, S.; Pal, S.; Ghosh, K.G. Effect of lockdown amid COVID-19 pandemic on air quality of the megacity Delhi, India. Sci. Total Environ. 2020, 730, 139086. [Google Scholar] [CrossRef]
- Griffith, S.M.; Huang, W.-S.; Lin, C.-C.; Chen, Y.-C.; Chang, K.-E.; Lin, T.-C.; Wang, S.-H.; Lin, N.-H. Long-range air pollution transport in East Asia during the first week of the COVID-19 lockdown in China. Sci. Total Environ. 2020, 741, 140214. [Google Scholar] [CrossRef]
- Cheng, C.-Y.; Cheng, S.-Y.; Chen, C.-C.; Pan, H.-Y.; Wu, K.-H.; Cheng, F.-J. Ambient air pollution is associated with pediatric pneumonia: A time-stratified case-crossover study in an urban area. Environ. Health 2019, 18, 77. [Google Scholar] [CrossRef] [Green Version]
- Cheng, F.-J.; Wu, K.-H.; Hung, S.-C.; Lee, K.-H.; Lee, C.-W.; Liu, K.-Y.; Hsu, P.-C. Association between ambient air pollution and out-of-hospital cardiac arrest: Are there potentially susceptible groups? J. Expo. Sci. Environ. Epidemiol. 2020, 30, 641–649. [Google Scholar] [CrossRef] [PubMed]
- Pan, H.-Y.; Cheung, S.-M.; Chen, F.-C.; Wu, K.-H.; Cheng, S.-Y.; Chuang, P.-C.; Cheng, F.-J. Short-Term Effects of Ambient Air Pollution on ST-Elevation Myocardial Infarction Events: Are There Potentially Susceptible Groups? Int. J. Environ. Res. Public Health 2019, 16, 3760. [Google Scholar] [CrossRef] [PubMed] [Green Version]
- Gao, N.; Li, C.; Ji, J.; Yang, Y.; Wang, S.; Tian, X.; Xu, K.-F. Short-term effects of ambient air pollution on chronic obstructive pulmonary disease admissions in Beijing, China (2013–2017). Int. J. Chron. Obstruct. Pulmon. Dis. 2019, 14, 297–309. [Google Scholar] [CrossRef] [Green Version]
- Kim, T.-Y.; Kim, H.; Yi, S.-M.; Cheong, J.-P.; Heo, J. Short-term Effects of Ambient PM2.5 and PM2.5-10 on Mortality in Major Cities of Korea. Aerosol Air Qual. Res. 2018, 18, 1853–1862. [Google Scholar] [CrossRef]
- Cheng, M.H.; Chiu, H.F.; Yang, C.Y. Coarse Particulate Air Pollution Associated with Increased Risk of Hospital Admissions for Respiratory Diseases in a Tropical City, Kaohsiung, Taiwan. Int. J. Environ. Res. Public Health 2015, 12, 13053–13068. [Google Scholar] [CrossRef] [PubMed]
- Huang, Y.T.; Chen, C.-C.; Ho, Y.-N.; Tsai, M.-T.; Tsai, C.-M.; Chuang, P.-C.; Cheng, F.-J. Short-Term Effects of Particulate Matter and Its Constituents on Emergency Room Visits for Chronic Obstructive Pulmonary Disease: A Time-Stratified Case-Crossover Study in an Urban Area. Int. J. Environ. Res. Public Health 2021, 18, 4400. [Google Scholar] [CrossRef] [PubMed]
- Chen, S.-Y.; Lin, Y.-L.; Chang, W.T.; Lee, C.-T.; Chan, C.-C. Increasing emergency room visits for stroke by elevated levels of fine particulate constituents. Sci. Total Environ. 2014, 473–474, 446–450. [Google Scholar] [CrossRef]
- Altuwayjiri, A.; Soleimanian, E.; Moroni, S.; Palomba, P.; Borgini, A.; Marco, C.D.; Ruprecht, A.A.; Sioutas, C. The impact of stay-home policies during Coronavirus-19 pandemic on the chemical and toxicological characteristics of ambient PM2.5 in the metropolitan area of Milan, Italy. Sci. Total Environ. 2021, 758, 143582. [Google Scholar] [CrossRef]
- Sly, P.D.; Trottier, B.A.; Bulka, C.M.; Cormier, S.A.; Fobil, J.; Fry, R.C.; Kim, K.W.; Kleeberger, S.; Kumar, P.; Landrigan, P.J.; et al. The interplay between environmental exposures and COVID-19 risks in the health of children. Environ. Health 2021, 20, 34. [Google Scholar] [CrossRef]
- Jiménez-Ruiz, C.A.; López-Padilla, D.; Alonso-Arroyo, A.; Aleixandre-Benavent, R.; Solano-Reina, S.; de Granda-Orive, J.I. COVID-19 and Smoking: A Systematic Review and Meta-Analysis of the Evidence. Arch. Bronconeumol. 2021, 57, 21–34. [Google Scholar] [CrossRef]
- Andersen, Z.J.; Hoffmann, B.; Morawska, L.; Adams, M.; Furman, E.; Yorgancioglu, A.; Greenbaum, D.; Neira, M.; Brunekreef, B.; Forastiere, F.; et al. Air pollution and COVID-19: Clearing the air and charting a post-pandemic course: A joint workshop report of ERS, ISEE, HEI and WHO. Eur. Respir. J. 2021, 58, 2101063. [Google Scholar] [CrossRef] [PubMed]
- McAuley, H.; Hadley, K.; Elneima, O.; Brightling, C.E.; Evans, R.A.; Steiner, M.C.; Greening, N.J. COPD in the time of COVID-19: An analysis of acute exacerbations and reported behav-ioural changes in patients with COPD. ERJ Open Res. 2021, 7, 00718–2020. [Google Scholar] [CrossRef] [PubMed]
- Fan, H.-F.; He, C.-H.; Yin, G.-Q.; Qin, Y.; Jiang, N.; Lu, G.; Li, X. Frequency of asthma exacerbation in children during the coronavirus disease pandemic with strict mitigative countermeasures. Pediatr. Pulmonol. 2021, 56, 1455–1463. [Google Scholar] [CrossRef]
- Taquechel, K.; Diwadkar, A.R.; Sayed, S.; Dudley, J.W.; Grundmeier, R.W.; Kenyon, C.C.; Henrickson, S.E.; Himes, B.E.; Hill, D.A. Pediatric Asthma Health Care Utilization, Viral Testing, and Air Pollution Changes During the COVID-19 Pandemic. J. Allergy Clin. Immunol. Pract. 2020, 8, 3378–3387.e11. [Google Scholar] [CrossRef] [PubMed]
- Cheng, F.-J.; Lee, K.H.; Lee, C.W.; Hsu, P.C. Association between Particulate Matter Air Pollution and Hospital Emergency Room Visits for Pneumonia with Septicemia: A Retrospective Analysis. Aerosol Air Qual. Res. 2019, 19, 345–354. [Google Scholar] [CrossRef]
- Mittleman, M.A.; Maclure, M.; Robins, J.M. Control sampling strategies for case-crossover studies: An assessment of relative efficiency. Am. J. Epidemiol. 1995, 142, 91–98. [Google Scholar] [CrossRef]
- Marshall, R.J.; Jackson, R.T. Analysis of case-crossover designs. Stat. Med. 1993, 12, 23332341. [Google Scholar] [CrossRef] [PubMed]
- Ueda, K.; Yamagami, M.; Ikemori, F.; Hisatsune, K.; Nitta, H. Associations between Fine Particulate Matter Components and Daily Mortality in Nagoya, Japan. J. Epidemiol. 2016, 26, 249–257. [Google Scholar] [CrossRef] [Green Version]
- Aho, K.; Derryberry, D.; Peterson, T. Model selection for ecologists: The worldviews of AIC and BIC. Ecology 2014, 95, 631–636. [Google Scholar] [CrossRef]
- Li, R.; Hertzmark, E.; Louie, M.; Chen, L.; Spiegelman, D. The SAS LGTPHCURV9 Macro; Harvard University: Cambridge, MA, USA, 2011. [Google Scholar]
- DeVries, R.; Kriebel, D.; Sama, S. Low level air pollution and exacerbation of existing copd: A case crossover analysis. Environ. Health 2016, 15, 98. [Google Scholar] [CrossRef] [Green Version]
- Liu, J.; Li, Y.; Li, J.; Liu, Y.; Tao, N.; Song, W.; Cui, L.; Li, H. Association between ambient PM2.5 and children’s hospital admissions for respiratory diseases in Jinan, China. Environ. Sci. Pollut. Res. Int. 2019, 26, 24112–24120. [Google Scholar] [CrossRef] [PubMed]
- Xiao, Q.; Liu, Y.; Mulholland, J.A.; Russell, A.G.; Darrow, L.A.; Tolbert, P.E.; Strickland, M.J. Pediatric emergency department visits and ambient Air pollution in the U.S. State of Georgia: A case-crossover study. Environ. Health 2016, 15, 115. [Google Scholar] [CrossRef] [PubMed] [Green Version]
- Gonzalez-Barcala, F.J.; Aboal-Viñas, J.; Aira, M.J.; Regueira-Méndez, C.; Valdes-Cuadrado, V.; Carreira, J.; Garcia-Sanz, M.T.; Takkouche, B. Influence of pollen level on hospitalizations for asthma. Arch. Environ. Occup. Health 2013, 68, 66–71. [Google Scholar] [CrossRef] [PubMed]
- Bono, R.; Romanazzi, V.; Bellisario, V.; Tassinari, R.; Trucco, G.; Urbino, A.; Cassardo, C.; Siniscalco, C.; Marchetti, P.; Marcon, A. Air pollution, aeroallergens and admissions to pediatric emergency room for respiratory reasons in Turin, northwestern Italy. BMC Public Health 2016, 16, 722. [Google Scholar] [CrossRef] [Green Version]
- Huang, M.; Ivey, C.; Hu, Y.; Holmes, H.A.; Strickland, M.J. Source apportionment of primary and secondary PM2.5: Associations with pediatric respiratory disease emergency department visits in the U.S. State of Georgia. Environ. Int. 2019, 133, 105167. [Google Scholar] [CrossRef]
- Lv, C.; Wang, X.; Pang, N.; Wang, L.; Wang, Y.; Xu, T.; Zhang, Y.; Zhou, T.; Li, W. The impact of airborne particulate matter on pediatric hospital admissions for pneumonia among children in Jinan, China: A case-crossover study. J. Air Waste Manag. Assoc. 2017, 67, 669–676. [Google Scholar] [CrossRef]
- Wu, J.; Zhong, T.; Zhu, Y.; Ge, D.; Lin, X.; Li, Q. Effects of particulate matter (PM) on childhood asthma exacerbation and control in Xiamen, China. BMC Pediatr. 2019, 19, 194. [Google Scholar] [CrossRef] [Green Version]
- Hwang, S.-L.; Lin, Y.-C.; Lin, C.-M.; Hsiao, K.-Y. Effects of fine particulate matter and its constituents on emergency room visits for asthma in southern Taiwan during 2008–2010: A population-based study. Environ. Sci. Pollut. Res. Int. 2017, 24, 15012–15021. [Google Scholar] [CrossRef]
- Otmani, A.; Benchrif, A.; Tahri, M.; Bounakhla, M.; Chakir, E.M.; Bouch, M.E.; Krombi, M. Impact of COVID-19 lockdown on PM10, SO2 and NO2 concentrations in Salé City (Morocco). Sci. Total Environ. 2020, 735, 139541. [Google Scholar] [CrossRef]
- Yin, H.; Liu, C.; Hu, Q.; Liu, T.; Wang, S.; Gao, M.; Xu, S.; Zhang, C.; Su, W. Opposite impact of emission reduction during the COVID-19 lockdown period on the surface concentrations of PM2.5 and O3 in Wuhan, China. Environ. Pollut. 2021, 289, 117899. [Google Scholar] [CrossRef]
- Baldasano, J.M. COVID-19 lockdown effects on air quality by NO2 in the cities of Barcelona and Madrid (Spain). Sci. Total Environ. 2020, 741, 140353. [Google Scholar] [CrossRef] [PubMed]
- Brown, L.; Barnes, J.; Hayes, E. Traffic-related air pollution reduction at UK schools during the COVID-19 lockdown. Sci. Total Environ. 2021, 780, 146651. [Google Scholar] [CrossRef] [PubMed]
- Perera, F.; Berberian, A.; Cooley, D.; Shenaut, E.; Olmstead, H.; Ross, Z.; Matte, T. Potential health benefits of sustained air quality improvements in New York City: A simulation based on air pollution levels during the COVID-19 shutdown. Environ. Res. 2021, 193, 110555. [Google Scholar] [CrossRef] [PubMed]
- Xu, K.; Cui, K.; Young, L.-H.; Hsieh, Y.-K.; Wang, Y.-F.; Zhang, J.; Wan, S. Impact of the COVID-19 Event on Air Quality in Central China. Aerosol Air Qual. Res. 2020, 20, 915–929. [Google Scholar] [CrossRef] [Green Version]
- Dias, C.F.; Sarria, E.E.; Scheffel, C.; Delatorre, L.B.; Sapiro, A.; Baldissera, M.; Chiapinotto, S.; Mocelin, H.T.; Fischer, G.B.; Mattiello, R. COVID-19 Prevention Policies Reduce Pediatric Hospital Mortality Due to Community-acquired Pneumonia. Arch. Bronconeumol. 2022, 58, 197–199. [Google Scholar] [CrossRef] [PubMed]
- Ostro, B.; Malig, B.; Hasheminassab, S.; Berger, K.; Chang, E.; Sioutas, C. Associations of Source-Specific Fine Particulate Matter With Emergency Department Visits in California. Am. J. Epidemiol. 2016, 184, 450–459. [Google Scholar] [CrossRef]
- Sarnat, S.E.; Winquist, A.; Schauer, J.J.; Turner, J.R.; Sarnat, J.A. Fine particulate matter components and emergency department visits for cardiovascular and respiratory diseases in the St. Louis, Missouri-Illinois, metropolitan area. Environ. Health Perspect 2015, 123, 437–444. [Google Scholar] [CrossRef] [Green Version]
- Peng, R.D.; Bell, M.L.; Geyh, A.S.; McDermott, A.; Zeger, S.L.; Samet, J.M.; Dominici, F. Emergency admissions for cardiovascular and respiratory diseases and the chemical composition of fine particle air pollution. Environ. Health Perspect. 2009, 117, 957–963. [Google Scholar] [CrossRef] [Green Version]
- Koh, L.; Grigg, J.; Whitehouse, A. Personal monitoring to reduce exposure to black car-bon in children with asthma: A pilot study. ERJ Open Res. 2021, 7, 00482–2021. [Google Scholar] [CrossRef]
- Carazo Fernández, L.; Fernández Alvarez, R.; González-Barcala, F.J.; Rodríguez Portal, J.A. Indoor air contaminants and their impact on respiratory pathologies. Arch. Bronconeumol. 2013, 49, 22–27. [Google Scholar] [CrossRef]
- De Granda-Orive, I.J.; Solano-Reina, S.; Jiménez-Ruiz, C.A. Is smoking outside an enclosed space enough to prevent second and third-hand exposure? Arch. Bronconeumol. 2021, 57, 83–84. [Google Scholar] [CrossRef] [PubMed]


| All | Number = 10,396 | |
|---|---|---|
| Demographic characteristics of patients | % | |
| Age (mean ± standard deviation) | 4.6 ± 3.7 | |
| Male | 5924 | 57.0 |
| Past medical history of respiratory disease | 252 | 2.4 |
| During COVID-19 pandemic | 1405 | 13.5 |
| Onset on warm days (>24.2 °C) | 4809 | 46.3 |
| Percentiles | Mean | Pre-COVID-19 (Mean ± SD) | During COVID-19 (Mean ± SD) | p | IQR | |||
|---|---|---|---|---|---|---|---|---|
| 25% | 50% | 75% | ||||||
| PM2.5 (µg/m3) | 17.4 | 27.5 | 36.1 | 27.4 | 30.2 ± 13.0 | 20.4 ± 11.0 | <0.001 | 18.7 |
| PM10 (µg/m3) | 39.7 | 55.3 | 71.0 | 55.8 | 61.8 ± 22.7 | 40.8 ± 18.5 | <0.001 | 31.3 |
| NO2 (ppb) | 11.5 | 15.4 | 19.7 | 15.8 | 16.8 ± 5.3 | 13.3 ± 5.0 | <0.001 | 8.2 |
| O3 (ppb) | 22.9 | 31.3 | 39.3 | 31.6 | 29.8 ± 11.5 | 31.8 ± 11.0 | 0.268 | 16.4 |
| Temperature (°C) | 21.3 | 24.2 | 27.3 | 24.1 | 23.9 ± 3.8 | 24.7 ± 4.1 | 0.011 | 6.0 |
| Humidity (%) | 69.3 | 72.7 | 75.9 | 72.4 | 72.5 ± 6.5 | 72.3 ± 6.5 | 0.844 | 6.6 |
| PM2.5 | PM10 | NO2 | O3 | Temp | Humidity | |
|---|---|---|---|---|---|---|
| PM2.5 | 1.000 | 0.939 | 0.799 | 0.539 | −0.659 | −0.272 |
| PM10 | 1.000 | 0.790 | 0.515 | −0.622 | −0.350 | |
| NO2 | 1.000 | 0.260 | −0.819 | −0.177 | ||
| O3 | 1.000 | −0.223 | −0.413 | |||
| Temperature | 1.000 | 0.175 | ||||
| Humidity | 1.000 |
| OR (95% CI) of Respiratory Disease-Related ED Visits for Each Interquartile Range Change in Two-Pollutant Models after Adjusting for Temperature and Humidity | ||||
|---|---|---|---|---|
| Adjust PM2.5 | Adjust PM10 | Adjust NO2 | Adjust O3 | |
| PM2.5 | 1.128 (1.055–1.207) | 1.186 (1.138–1.236) | 1.259 (1.212–1.308) | |
| PM10 | 1.125 (1.050–1.204) | 1.189 (1.139–1.240) | 1.258 (1.211–1.307) | |
| NO2 | 1.119 (1.065–1.176) | 1.118 (1.064–1.176) | 1.240 (1.188–1.295) | |
| O3 | 0.965 (0.929–1.004) | 0.975 (0.939–1.013) | 1.050 (1.013–1.089) | |
Publisher’s Note: MDPI stays neutral with regard to jurisdictional claims in published maps and institutional affiliations. |
© 2022 by the authors. Licensee MDPI, Basel, Switzerland. This article is an open access article distributed under the terms and conditions of the Creative Commons Attribution (CC BY) license (https://creativecommons.org/licenses/by/4.0/).
Share and Cite
Cheng, C.-Y.; Tseng, Y.-L.; Huang, K.-C.; Chiu, I.-M.; Pan, H.-Y.; Cheng, F.-J. Association between Ambient Air Pollution and Emergency Room Visits for Pediatric Respiratory Diseases: The Impact of COVID-19 Pandemic. Toxics 2022, 10, 247. https://doi.org/10.3390/toxics10050247
Cheng C-Y, Tseng Y-L, Huang K-C, Chiu I-M, Pan H-Y, Cheng F-J. Association between Ambient Air Pollution and Emergency Room Visits for Pediatric Respiratory Diseases: The Impact of COVID-19 Pandemic. Toxics. 2022; 10(5):247. https://doi.org/10.3390/toxics10050247
Chicago/Turabian StyleCheng, Chi-Yung, Yu-Lun Tseng, Kuo-Chen Huang, I-Min Chiu, Hsiu-Yung Pan, and Fu-Jen Cheng. 2022. "Association between Ambient Air Pollution and Emergency Room Visits for Pediatric Respiratory Diseases: The Impact of COVID-19 Pandemic" Toxics 10, no. 5: 247. https://doi.org/10.3390/toxics10050247