Communication

National Vaccination and Local Intervention Impacts on COVID-19 Cases

1
Department of Statistics, Padjadjaran University, West Java, Bandung 45363, Indonesia
2
Faculty of Economics and Business, Campus UI Depok, Universitas Indonesia, West Java, Depok 16424, Indonesia
3
Bioinformatics and Data Science Research Center, Bina Nusantara University, Jakarta 11480, Indonesia
4
Department of Mathematics, Universitas Sumatera Utara, Medan 20155, Indonesia
5
Department of Forestry, Faculty of Forestry, Universitas Sumatera Utara, Medan 20155, Indonesia
6
Computer Science Department, Bina Nusantara University, Jakarta 11480, Indonesia
*
Authors to whom correspondence should be addressed.
Sustainability 2021, 13(15), 8282; https://doi.org/10.3390/su13158282
Submission received: 26 May 2021 / Revised: 20 July 2021 / Accepted: 21 July 2021 / Published: 24 July 2021

Abstract

:
COVID-19, as a global pandemic, has spread across Indonesia. Jakarta, as the capital of Indonesia, is the province with the most positive cases. The government has issued various guidelines, both at the central and regional levels. Since it began in 2021, the planned new measures, called ‘Pemberlakuan Pembatasan Kegiatan Masyarakat Darurat’, or PPKM emergency public activity restrictions, began with the possibility that the number of active cases might decrease. Accordingly, global vaccinations were also carried out, as they were in Indonesia. However, the first phase prioritized frontline health workers and high-risk elderly people. This study conducted a causal impact analysis to determine the effectiveness of PPKM in Jakarta and its vaccination program against the increase in daily new cases. Based on this test, PPKM showed a significant effect on the addition of daily new cases and recovered cases. Conversely, the vaccination program only had a significant impact on recovered cases. A forecast of the COVID-19 cases was conducted and indicated that the daily new cases showed a negative trend, although it fluctuated for the next 7 days, while death and recovered cases continued to increase. Hence, it can be said that the vaccination program has still not shown its effectiveness in decreasing the number of daily new cases while PPKM is quite effective in suppressing new cases.

1. Introduction

The coronavirus disease (COVID-19) has been deemed a global pandemic by World Health Organization (WHO). Coronaviruses are enveloped, positive, single-stranded large RNA viruses that infect humans and a wide range of animals [1]. The virus was called 2019-nCoV when it was first discovered in Wuhan, China, in people who had been exposed to seafood or wet markets. However, attempts to identify potential intermediate hosts appear to have been neglected in Wuhan, and resulted in rapid transmission routes emerging in various countries [2]. Previous MERS and SARS incidents, that is human-to-human transmission, occurred through droplets and contact with contaminated objects; same transmission was seen in COVID-19 [3,4,5]. In order to prevent the spread of this virus, people needed to regularly wash their hands using soap, cook meat and eggs well, and avoid close contact with or keep a distance from people who have symptoms of respiratory diseases [6]. As of 8 April 2020, 22,073 cases of COVID-19 have been documented from 52 countries; Indonesia is included, here, as its cases have been reported to the WHO by health workers [7].
On 2 March 2020, Indonesia had reported two confirmed cases of COVID-19 at first. As of 29 March 2020, thus number had increased to 1285 cases in 30 provinces. The five provinces with the highest COVID-19 cases were Jakarta (675), West Java (149), Banten (106), East Java (90), and Central Java (63) [8]. Indonesia’s health facilities were not ready to deal with COVID-19 and massive and serious preparations had to be made to reduce the spread of the COVID-19 disease [2,9,10,11,12,13].
According to the Indonesian Ministry of Health, the ratio of the number of beds to the total population is 1.21:1000, which means that per 1000 membrs of the population there are only 1.21 treatment beds in hospitals. In 2020, Indonesia had only 310,000 hospital beds for a population of around 260 million, meaning Indonesia’s health facilities were not ready to deal with COVID-19 because the ratio was still far from the WHO’s recommendation, 5:1000.
According to regulation for Law No 6 2018 on Health Quarantine, there are four types of health quarantine including home quarantine, regional quarantine, hospital quarantine, and large-scale social restrictions or ‘Pembatasan Sosial Berskala Besar’ (PSBB). PSBB was a set of restrictions carried out in certain areas where an increase in COVID-19 cases was suspected. PSBB implementation, meant to control the increase in positive cases in different cities or provinces, therefore meant economic recovery could begin immediately.
At the end of March 2020, the president of Indonesia, Joko Widodo, finally decided to implement PSBB in cities and provinces, not only in the quarantine regions. The government appealed to Indonesian citizens to stay home [8,11,14,15,16,17]. This PSBB was carried out in the hope that the rate of transmission could be slowed down and then stopped, leaving optimal health services available for patients, and allowing the recovery of the health system, economic activities, social services and other sectors from the COVID-19 pandemic [18,19].
Figure 1 depicts that COVID-19’s occurrence in Jakarta had increased rapidly from the beginning of the confirmed cases in March to early September 2020. The number of recovered cases increased, as confirmed, while the number of cumulative deaths was stable. On 26 March 2020, 56 cases of COVID-19 were found; then, a week later, the total number of new COVID-19 cases amounted to 364, with a total of 87 people having died and 37 people having recovered. Since the first phase, PSBB, beginning on 10 April in Jakarta, counted an increase in the number of COVID-19 cases from 1810 to 3399 cases by 22 April. By then, the number of deaths also jumped, to 308 from April 10’s 156 cases, and the number of people who recovered increased from 82 to 291.
From the start of COVID-19 until 1 April 2021, East Kalimantan (63,093), East Java (138,715), Central Java (167,664), West Java (248,396), and DKI Jakarta (380,706) were the five provinces with the highest COVID-19 cases in Indonesia. This means that DKI Jakarta, the capital of Indonesia, was the province with the highest positive cases of COVID-19 among the other provinces. However, the people of Jakarta had very low awareness of implemented government policies to reduce the spread rate of COVID-19. Activity policies under PSBB included: 75% of employees (private and government offices) were to WFH (work from home), learning or educational activities were to be carried out online, shopping centers that sell basic needs were only open until 8:00 p.m., and access to public areas was temporarily suspended.
An increase in COVID-19 cases proved that the PSBB has not been implemented effectively and many people still failed to comply with government regulations for preventing the spread of COVID-19. The government had also extended the PSBB period five times, including a transitional PSBB, which spanned 3–16 July 2020, 17–30 July 2020, 30 July–14 August 2020, 14–27 August 2020, and 27 August–10 September 2020. The implementation of the transitional PSBB was almost the same as that of the PSBB, only with some concessions. (1) Previously, learning activities in schools had not been allowed, but in the transition period, face-to-face schooling, with strict health protocols, was allowed; (2) before the transition, 75% employees worked from home, and after the transition, 50% of employees were allowed to work from the office; (3) church and mosque services were opened; and (4) the opening of public markets, with a capacity of 50%, was allowed, where previously, only markets that sold basic necessities could open.
On 13 September 2020, the government returned to implementing a tight PSBB, also known as the “emergency brake” for 2 weeks, from 14–27 September 2020, and was extended until 11 October 2020. Then, the Jakarta government decided to implement a transitional PSBB through December 2020 because there had still been a surge in virus transmission, with hundreds of new family clusters emerging in the city. The timeline of the implementation of the Jakarta government’s policies in preventing the spread of COVID-19 can be seen in Figure 2.
At the end of 2020, a ban on crowd-pulling events and New Year’s Eve celebrations was imposed by the government, but the increase in confirmed cases of COVID-19 was inevitable, as supported by Figure 2. In the midst of the increasing number of COVID-19 cases in Jakarta, good news emerged, regarding the start of a vaccination program in Indonesia. On 13 January 2021, the president of Indonesia was the first person to receive the Sinovac vaccine. This vaccine was prioritized for people aged 18–59 years. The first phase of vaccination prioritized health workers and support staff. The second phase of mass vaccination targeted priority groups other than medical works, such as the public workforce, including workers in transportation, the tourism sector, public ports and stations, electric companies, banks, water companies, and any officials providing community service.
Until 13 July 2021, the vaccination process was carried out evenly; it included the public, and the process for children had even started. The overall vaccination target was 208,265,720 people, from health workers, the elderly, civil servants, vulnerable communities, the general public, and ages 12–17. Based on this target, 19% received one dose of vaccine. Figure 3 represents the number of active cases after each measure. A total of 38,909,433 people received the first dose and 15,611,554 of them received the full dose. The details of the vaccination procedure for each group are as follows: (1) of 1,468,764 registered health workers, 97.55% received the full dose; (2) 14.53% of 21,553,118 elderly people received the full dose; (3) of 17,327,167 office workers, 52.64% received full doses; (4) 2,159,098 initial doses and 1,579,457 full doses were given to educators; (5) from the general public and vulnerable communities, only 1.36% received full doses, of 141,211,181 people; (6) from the age group of 12- to 17-year-olds, comprising 26,705,490 people, only 0.93% received the first dose, as the vaccination process for this group had only started in early July.
By 18 March 2021, 4.84 million Indonesians received at least one dose of the COVID-19 vaccine and 1.95 million people had been fully vaccinated against COVID-19, after completing three vaccination phases since 13 January 2021. By 13 June 2021, 20.16 million or 7.4% Indonesians had received one shot, while 4.5% of those are fully vaccinated. The start of vaccination resulted in a reduced number of COVID-19 cases in Indonesia and also in Jakarta specifically. It was also shown, in Figure 1, from January to March 2021 that the number of cases in Jakarta experienced a downward trend.
CoronaVac, by Sinovac, is an inactivated viral vaccine with an alum adjuvant, administered in two shots, at two weeks apart in general and four weeks apart for the elderly, in order to have sufficient efficacy [20]. The efficacy of the vaccine, then, appears a few weeks later [21]. Final blood tests are expected in December, however, in order to review longer-term efficacy and side effects collection may be extended in three months [12]. Sinovac showed 91.25% efficacy in a trial in Turkey, and Brazil reported over 50% efficacy, although detailed results have been delayed [22]. The start of vaccination has resulted in a reduced number of COVID-19 cases in Indonesia and also in Jakarta. It was also shown in Figure 1 that, from January to March 2021, the number of cases experienced a downward trend.
Apart from the vaccination program, the Jakarta government also introduced new measures to restrict activities; this enforcement of public activity restrictions, called ‘Pemberlakuan Pembatasan Kegiatan Masyarakat’ (PPKM), implemented from 11 to 25 January 2021, under Home Ministerial Instruction No. 1/2021, as shown in Figure 3. The PPKM mechanism is different from PSBB. Under PSBB, the initial restriction initiatives came from the local government, but PPKM was overseen by the central government.
The central government established initial restriction criteria for all regions. Areas that were included in the criteria had to apply these restrictions to their community activities. These restrictions were slightly looser than requirements had been under the PSBB policy. On 9 February 2021, the government enforced the local scale of community activity, or micro-scale, of PPKM. It would be formed at the village level, to aid health centers in handling isolated COVID-19 patients. The implementation of micro-PPKM showed significant results in reducing the number of COVID-19 cases in Jakarta, and therefore was extended to 5 April 2021.
Based on the facts above, it was somewhat important to predict future cases based on what had happened in the immediate past, especially for a novel infectious disease, in order to warrant the availability of sufficient supplies of personal equipment, deliberation about the health care workforce and other health care resources capability, and how to stabilize preventive safety guidelines while keeping businesses open, to stabilize the economy. Modelling and forecasting infectious disease epidemics are characterized by different approaches, such as (1) mechanistic models based on the SEIR (Susceptible, Exposed, Infected, and Recovered) framework; (2) time series prediction models; and (3) agent-based models (i.e. simulating individual activities for a population) [23,24]. For this study, we mainly focus on short-term predictions based on the time series model for the next week. Before performing the forecast, we try to examine the effectiveness of the PPKM implemented in Jakarta and the national vaccination program to reduce the daily new cases, as well as their effects on the daily recovered cases and daily death cases, as a novelty.
This study aims to determine the effectiveness of PPKM in Jakarta and the vaccination program against the increase in daily new cases, conducting a causal impact analysis using only the two month time period following the vaccination program; then we use neural network models that are suitable for capturing patterns in the data for prediction. In this study, we are avoiding micro-assumptions on a large number of unknown variables, such as death rates and transmissibility, due to the limitations of available data and understanding of the death rates and transmissibility. We also the predictions against actual values then evaluate the model through several error metrics, as one of the four main principles in health forecasting is evaluation and measuring errors in transmissibility [25]. Currently, Indonesia is preparing for the new normal [18,19,26,27].

2. Research Method

2.1. Data Description

The data used in this study are historical data of daily new cases, recovered cases, and death cases of COVID-19 in Jakarta, Indonesia from 1 March 2020 to 18 March 2021. The dataset, of open data, was provided by the COVID-19 task force formed by the Indonesian government. This dataset will be used in order to test whether the implementation of PPKM in Jakarta and its vaccination program were effected a decline in the active cases in Indonesia, specifically in Jakarta, which is the province with the highest case count. Two months of data were used for taking into account the efficacy of the vaccine and, if from after March, other interventions are expected, specifically from the celebration of religious holidays in Indonesia that cause changes in patterns of community mobility between regions.
We have demonstrated a causal impact analysis to test the effectiveness of government measures. This method is widely used to investigate the effectiveness of the new campaigns or programs in the business sector, using a time series dataset; therefore we wish to do the same analyses with like-structured data from different sectors. For short-term forecasting, many researchers have used simple methods to predict their variables because these methods are robust, have meaningful results, and are not challenging computationally [28]. However, we try to make a prediction using a neural network model, since this approach has gained renown, recently, due to its accuracy.

2.2. Causal Impact Analysis and Neural Networks

Causal impact analysis performs causal inference using Bayesian structural time series models. It implements an approach to estimate the causal effect of a designed intervention on a time series [29]. In particular, the model assumes that the time series of the treated unit can be explained in terms of a set of covariates that were themselves not affected by the intervention whose causal effect we are interested in. Structural time series models are state-space models for time series data [30]. They can be defined in terms of a pair of equations
y t = Z t T α t + ε t
α t + 1 = T t α t + R t η t
where ε t   ~   N ( 0 , σ t 2 ) and η t   ~   N ( 0 , Q t ) are independent of all other unknowns. Equation (1) is the observation equation; it links the observed data y t to a latent d-dimensional state vector α t . Equation (2) is the state equation; it governs the evolution of the state vector α t through time. In this paper, y t is a scalar observation, Z t is a d-dimensional output vector, T t is a d × d transition matrix, R t is a d × q control matrix, ε t is a scalar observation error with noise variance σ t , and η t is a q-dimensional system error with a q × q state-diffusion matrix Q t , where q d .
In R software, this analysis is performed with the CausalImpact package [31]. The package is designed to make a counterfactual inference as easily as fitting a regression model, but with much more power, provided the assumptions above are met. The package has a single entry point. Given a response time series and a set of control time series, the function constructs a time series model and performs posterior inference on the counterfactual.
A neural network or artificial neural network is a forecasting method based on a simple mathematical model and has a network system that works like the human brain. An artificial neural network is a network consisting of a collection of processing units called “nodes” that are arranged in certain layers. In a neural network model, the predictor variable or the input is at the bottom layer, while the response variable or the output is at the top layer [32,33,34,35,36,37]. A hidden layer that also contains hidden nodes can be added between the input layer and the output layer as an intermediary for processing the nodes to produce better results [38,39,40]. Neural networks are divided into two types of architectures, namely Feed-Forward Neural Networks (FFNNs) and Recurrent Neural Networks (RNNs). The difference between them is that the RNN, which is often used for sequential modelling, has at least one feedback loop, while FFNN does not [33,34,35,41,42].
A feed-forward neural network is fitted with estimations of y as inputs and a single hidden layer of neurons. The inputs are for lags 1 to p and lags m to mP where m = freq (y). Its columns are additionally utilized as inputs if xreg is given. Though, if there are missing values in y or xreg, the involved rows are rejected from the fit. With irregular initial weights, a total revised network is fitted. Recursively, multi-step predictions are processed, although the network is prepared for a one-step prediction.
The fitted model for data with a non-seasonal pattern is inevitably NNAR (p,k), where k is the number of hidden neurons. This is corresponding to an AR (p) with non-linear functions. For data with seasonal patterns, the fitted model is indicated as NNAR (p,P,k) [m], which is similar to ARIMA (p,0,0) (P,0,0) [m] with non-linear functions. The modelled cycles are always symmetric in AR. Nonetheless, the cyclic model in the NNAR has been modelled well to facilitate the irregularity of the cycles. This is the one difference between AR and NNAR [27].

2.3. Metrics Evaluation

After generating a model from the training process, the model will evaluate using the testing data to get the accuracy of the model. The most common selection criteria is the mean absolute percentage error (MAPE) (3); because the value is in the form of a percentage, it is then appropriate to measure the accuracy of a model. Then, in the network validation phase, MAPE is used. Meanwhile, mean absolute error (MAE) (4) and root-mean-square error (RMSE) (5) are used to calculate network accuracy for different models on the same scale [43,44,45,46]. In addition, the RMSE gives a high weight to large errors because errors are squared; thus this metric is useful when large errors are particularly undesirable [47]. Where n is the number of observations, Y t is the observed value, Y t ^ is the predicted value.
M A P E = 1 n t = 1 n | Y t Y t ^ Y t | × 100
M A E = 1 n t = 1 n | Y t Y t ^ |
R M S E = 1 n t = 1 n ( Y t Y t ^ ) 2

3. Results and Discussion

All analyses were performed in open-source R version 3.6.3 with the nnetar function in the forecast package for prediction, and the CausalImpact package for the causal impact analysis. We use a device with 4GB RAM supported by an AMD Ryzen 5 2500U processor. The artificial neural network method used in this study is NNAR. The networks are not based on a well-defined stochastic model, therefore, they did not require any assumptions in their use.

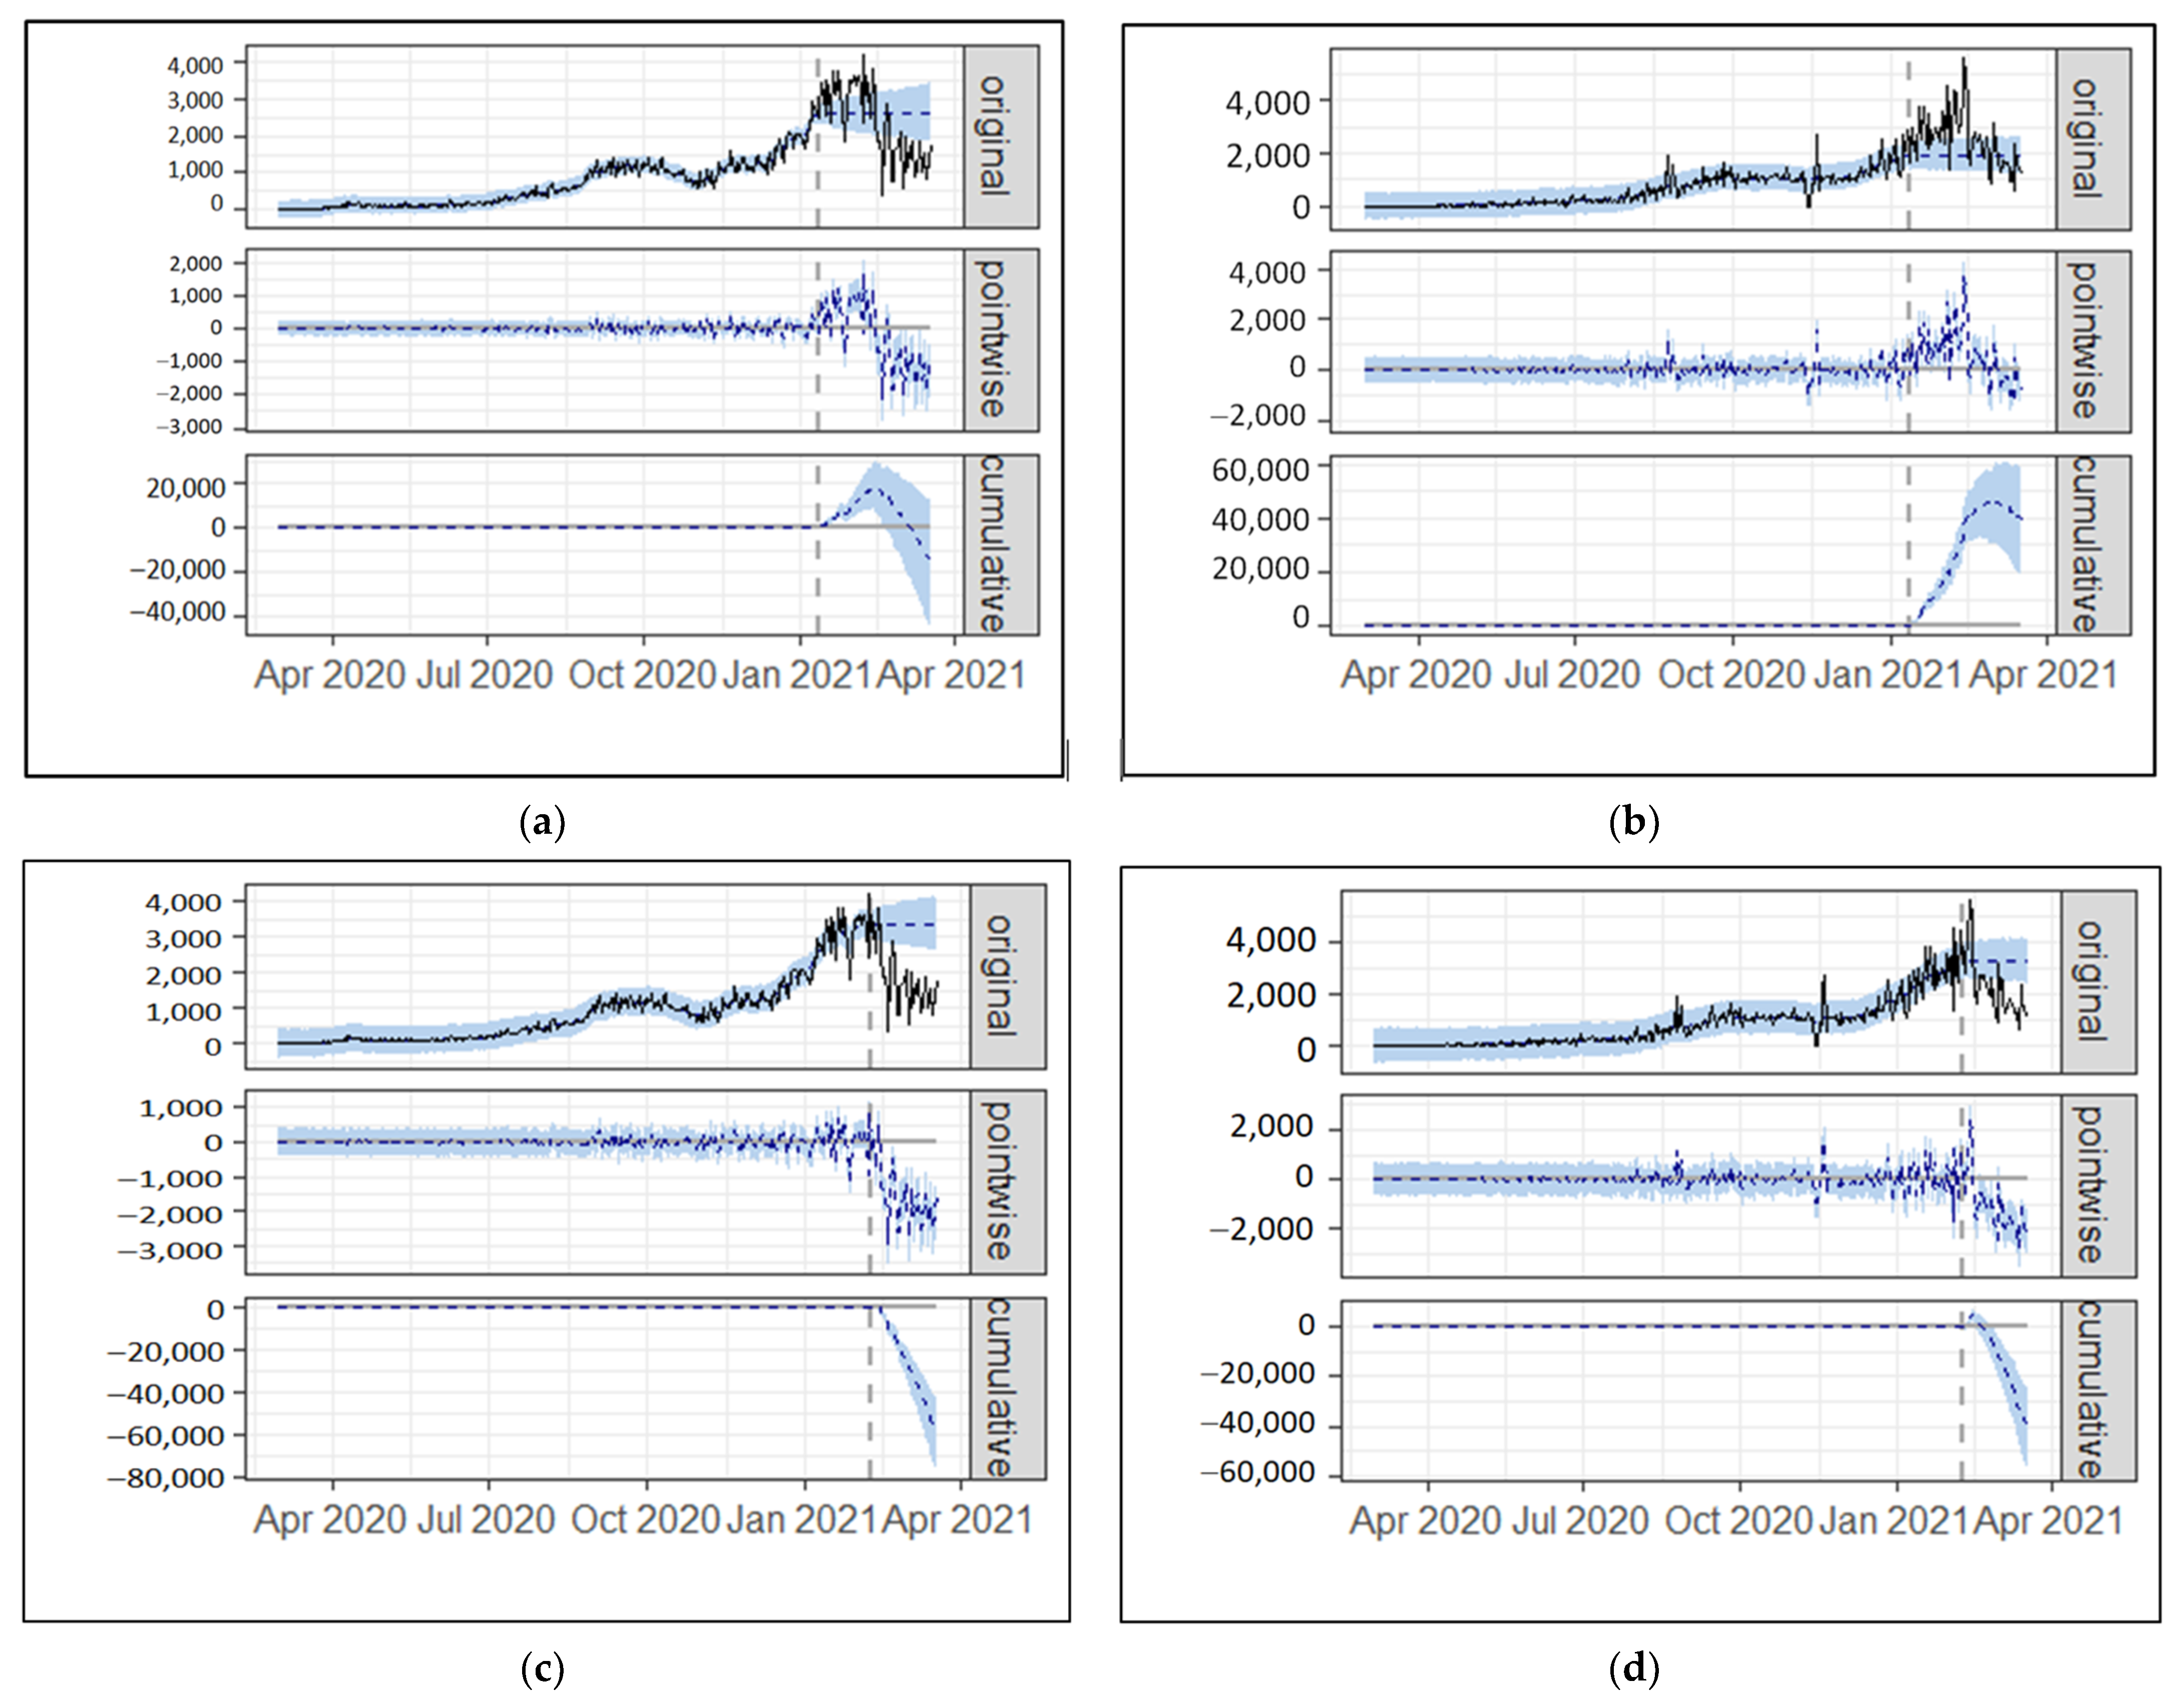
3.1. Causal Impact Analysis
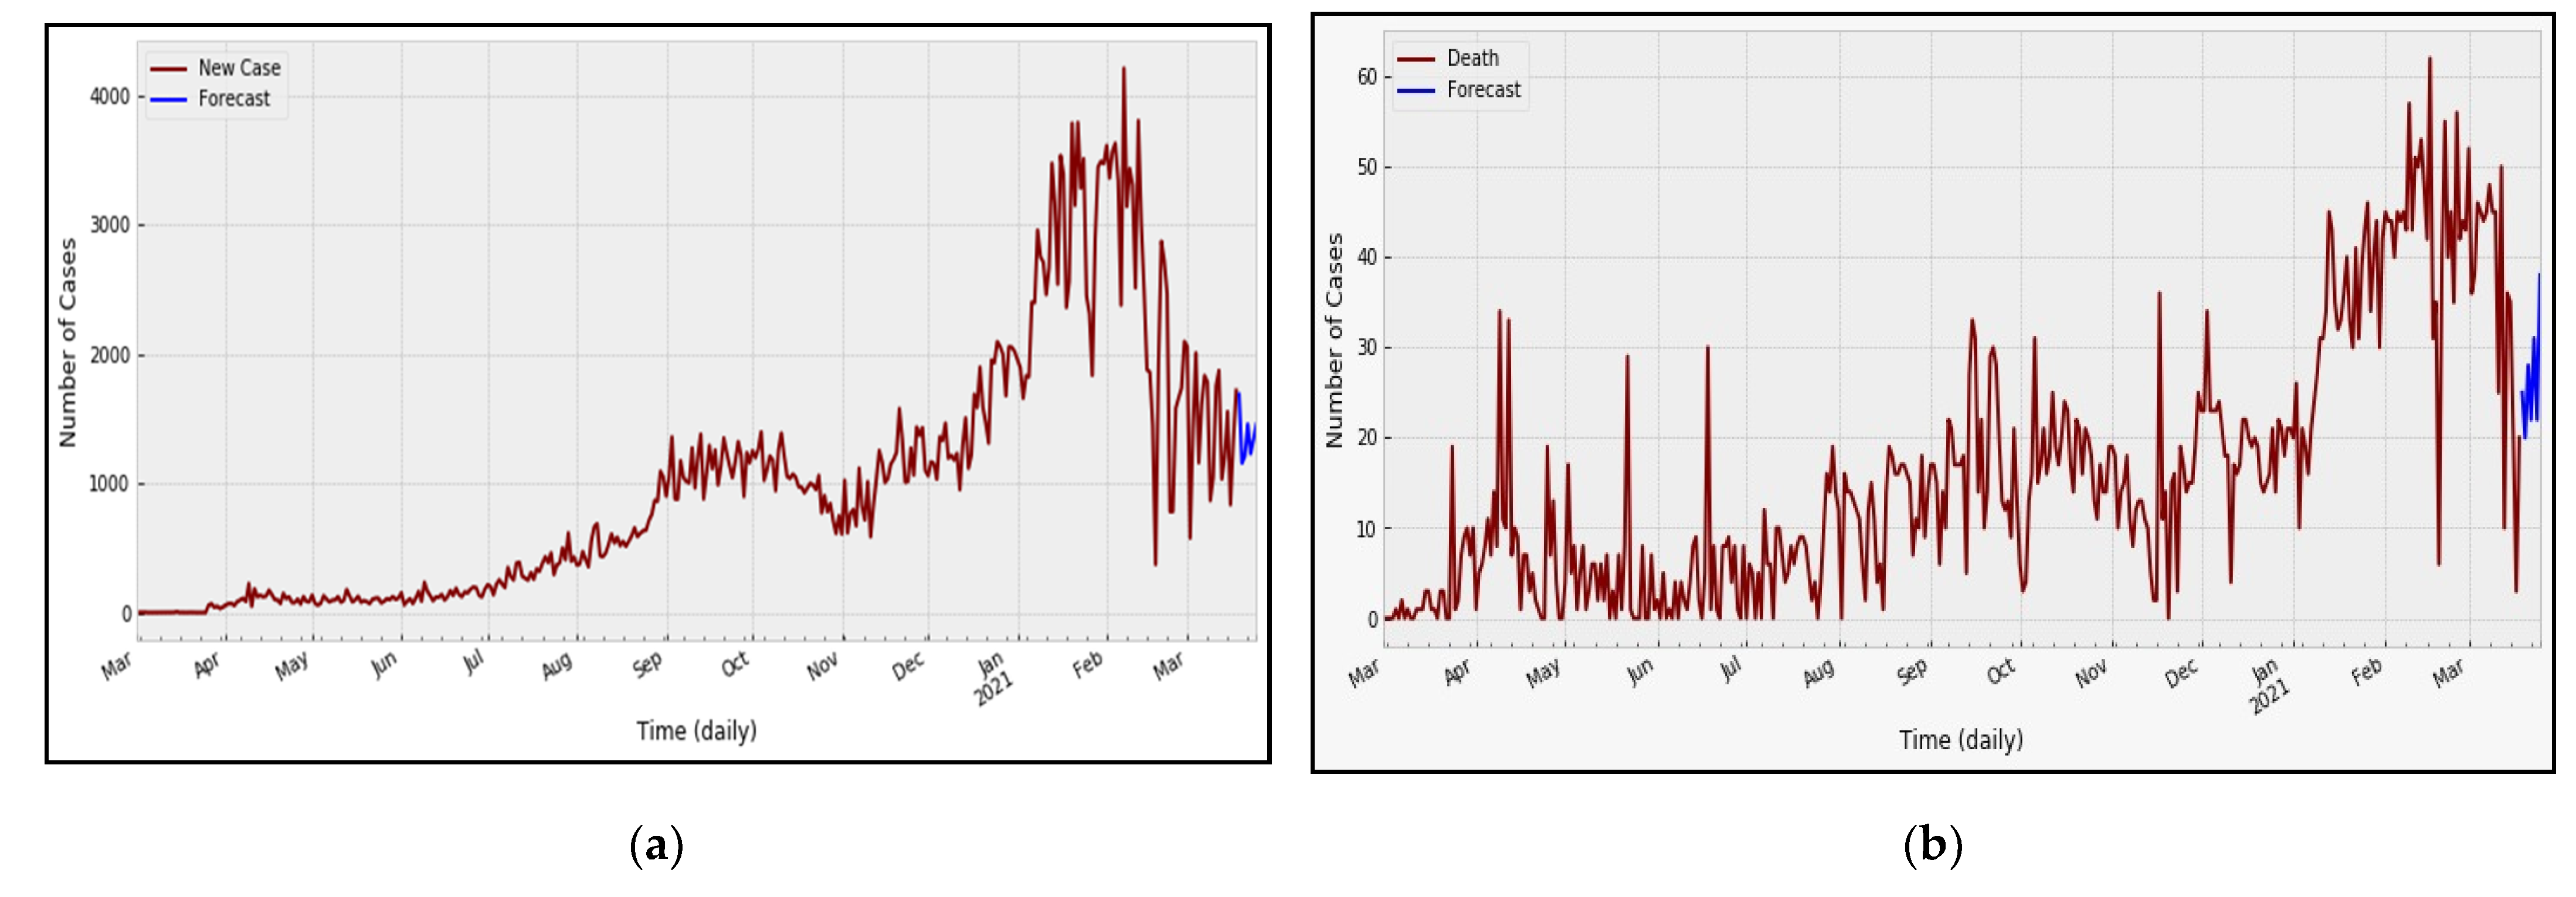
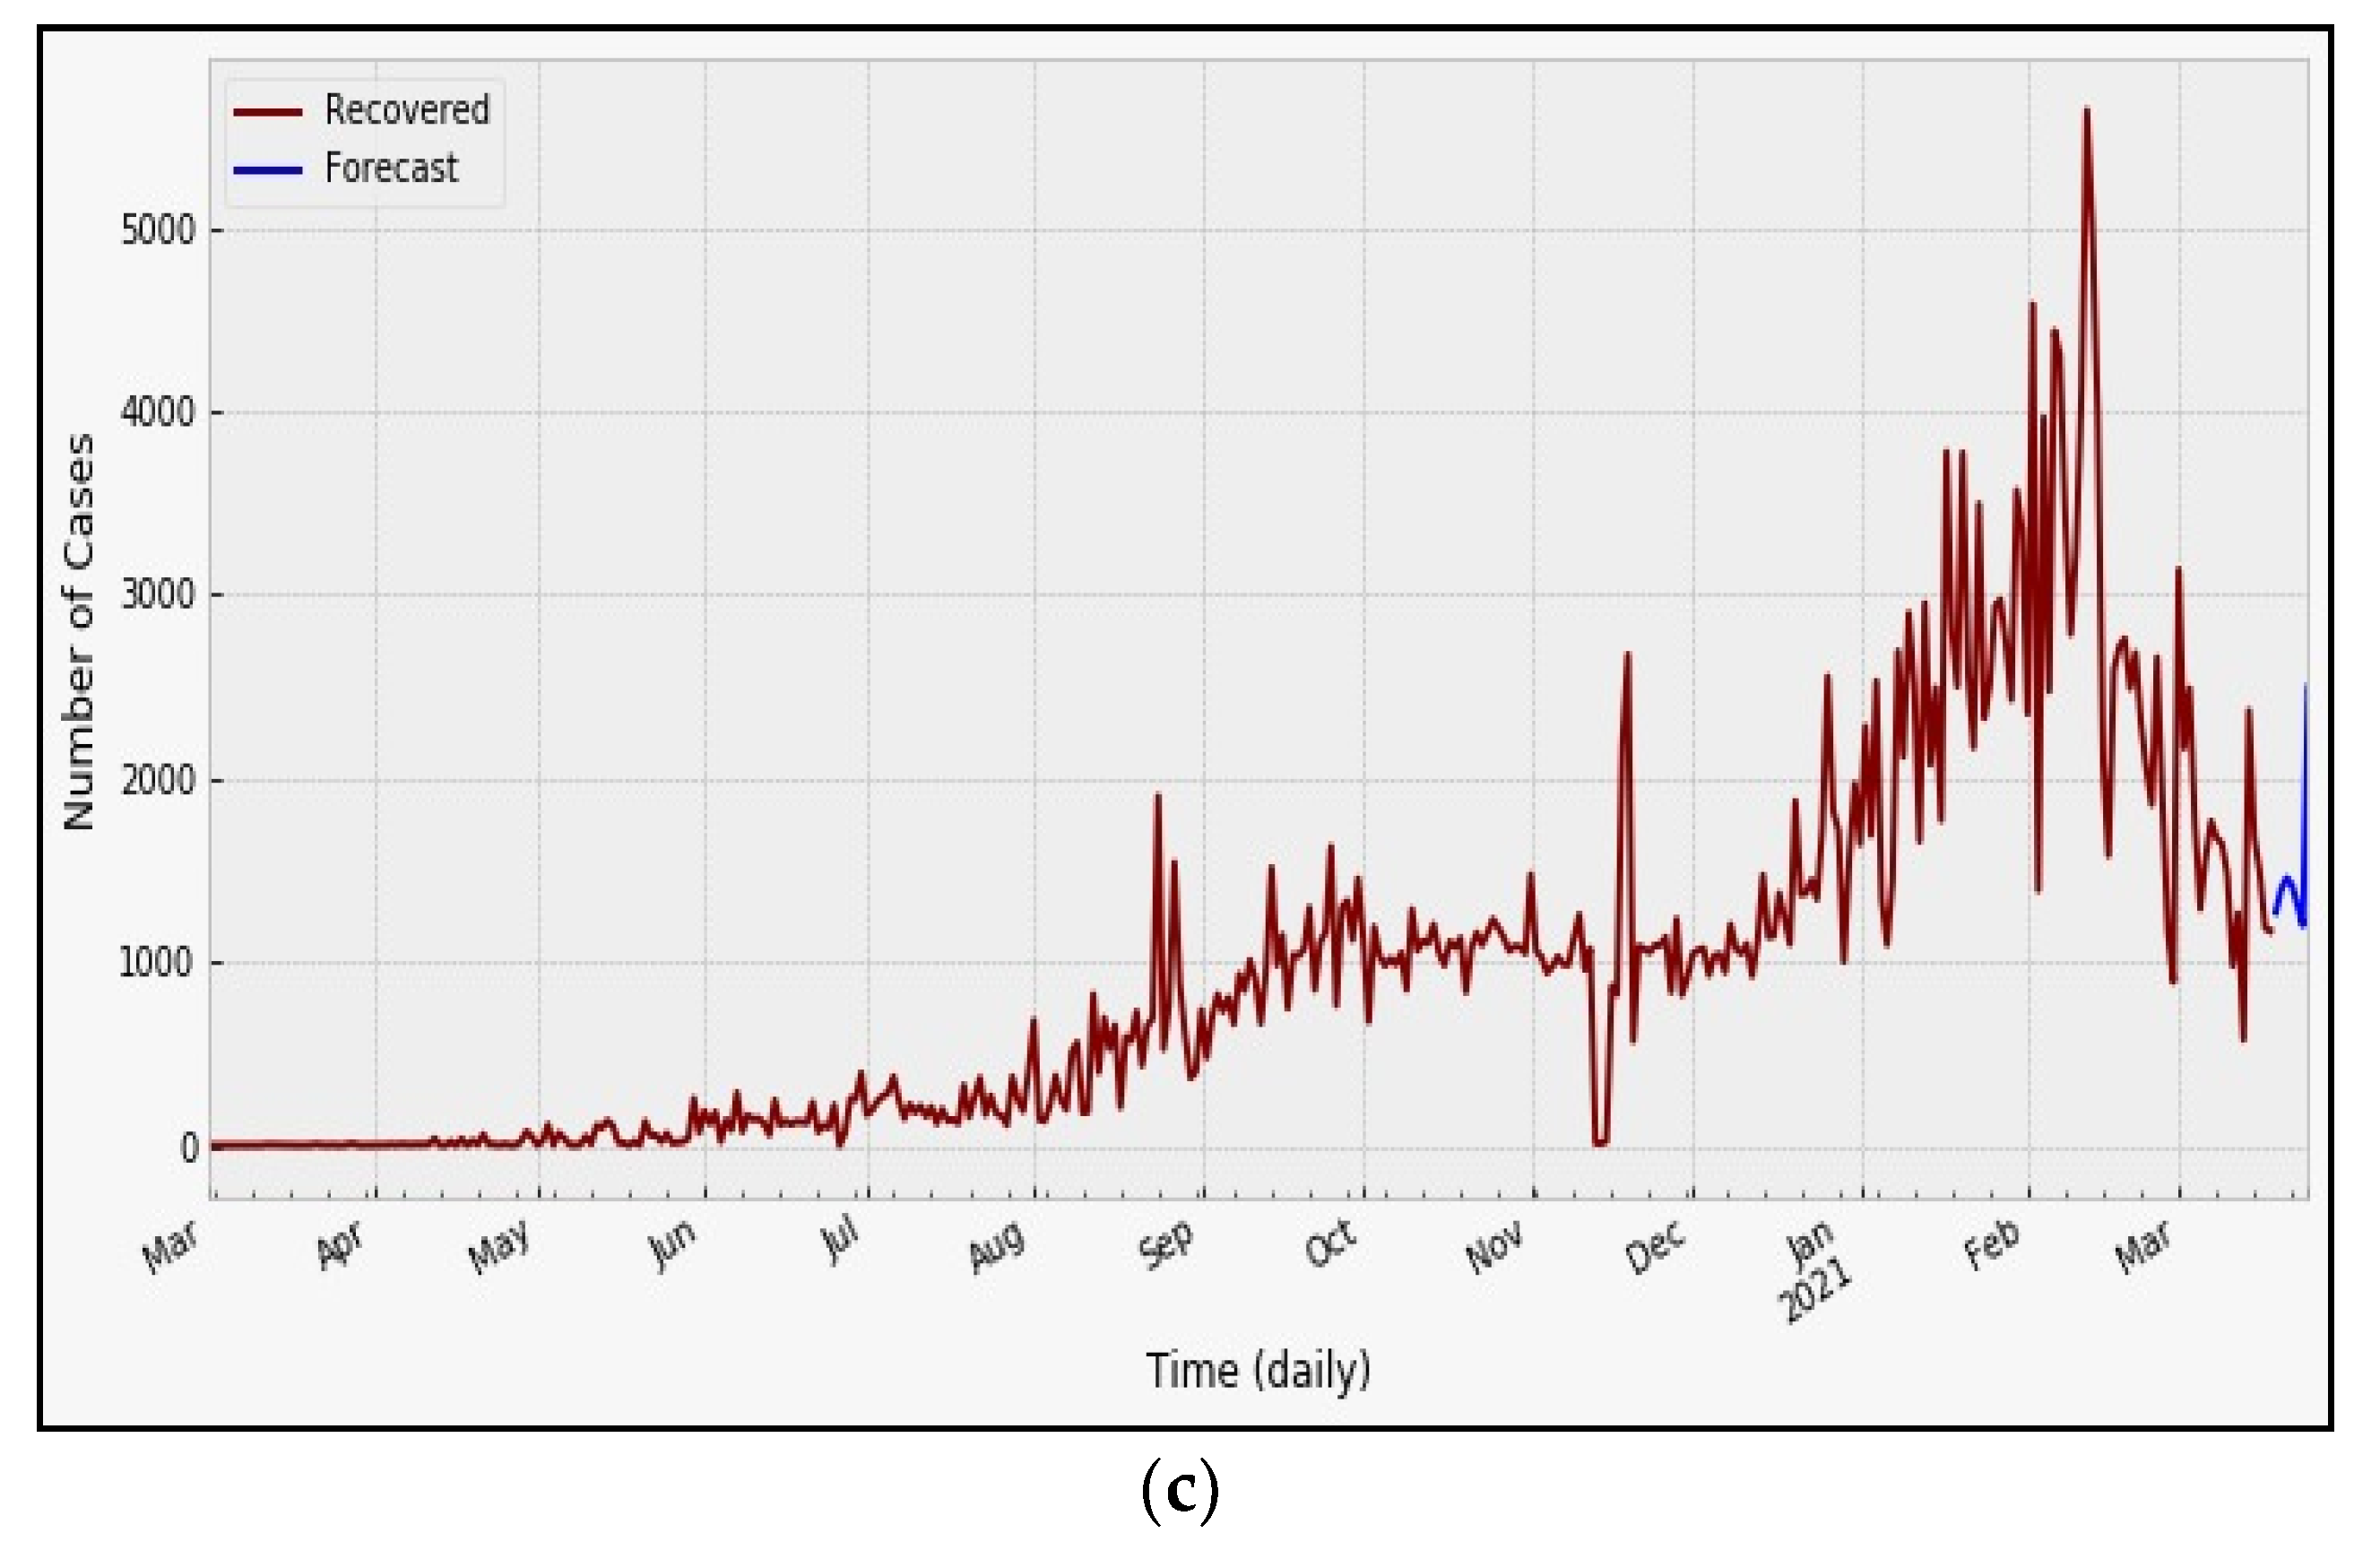
Causal Impact analysis is also performed using R software with the CausalImpact package. This function performs causal inference through counterfactual predictions using a Bayesian structural time series model. This analysis aims to see whether there is a difference in the number of new cases and cases recovered before and after the implementation of vaccination and PPKM in Jakarta through hypothesis testing. We are not including the death cases since no direct relationship of the measures to the death cases. Vaccination started on 13 January 2021, while the Jakarta PPKM started on 9 February 2021. According to the data released by Our World in Data, on the first day, based on the 7-day average and counting by single doses, there were 13,200 doses administered to the priority targets, i.e., elderly people and health workers. On 18 March 2020, the total number of people vaccinated with at least a single dose was 4.84 million people or approximately 0.7% of the population. In addition, 1.95 million people were fully vaccinated.
The vertical grey dashed line in Figure 4 and Figure 5 shows the occurrence of the first vaccine in Jakarta and the implementation of PPKM Jakarta. It is shown that after those interventions the number of new COVID-19 cases decreased until March and the number of recovered cases increased until the end of February.
Based on the p-value in Table 1 with the assumption, α = 0.05, vaccination had a significant impact on the increase in daily recovered cases in Jakarta. On the other hand, although vaccination has indeed succeeded in reducing the number of daily new cases as shown in Figure 6a, the effect was not significant because of the uneven application of the vaccine. The vaccination began to have an impact in February; presently, the number of daily new cases has begun to show a downward trend. Nevertheless, PPKM in Jakarta had a significant impact on daily new cases and daily recovered cases. Figure 6c shows that daily new cases of COVID-19 have experienced a downward trend since the implementation of the PPKM in Jakarta.
In Figure 1, it can be seen that new cases started to rise again in late May due to the end of the Eid celebration period. This indicates that vaccination is not the only solution to suppress increases in COVID-19 cases. The proof is that, with a lax implementation of PSBB, the number of daily cases has continued to increase even though the vaccination program continues. Therefore, the PSBB is still very much needed to prevent cross-region transmission in Indonesia, especially as it approaches the celebration of major holidays. Currently, to suppress the daily number of cases, the regional government has implemented a local lockdown in areas with a significant increase in cases.
The efficacy of the vaccine was observed one month after the administration of the second dose. According to this study, after two months of the vaccination program, the effect was not statistically significant in regard to the addition of new cases, though it was in the increase in the number of recovered cases. However, due to data limitations, no conclusions can be drawn indicating the efficacy of the vaccination program in dealing with the COVID-19 pandemic in Indonesia. Moreover, as shown in previous research, all populations are generally susceptible to SARS-CoV-2.
Thus, this study focused on the province with the highest confirmed cases, as well as the highest population, Jakarta. In addition, the vaccination program focused on this area because, as the capital of Indonesia, Jakarta has high mobility. Since elderly patients with or without underlying comorbidities [48,49] are at high risk, due to rapid migration of the virus to the lung gas exchange units and, furthermore, across multiple organs [50], they are included in the priority group of vaccine recipient.
Recently, the entire world has cooperated, using all available resources and labor, to develop a vaccine against COVID-19. Vaccinations are believed to be an existing solution to control the COVID-19 outbreak, and many vaccines against the current pandemic are being tested in various parts of the world [51,52]. Vaccines based on the structures of the epitope-binding domain, mRNA, and protein S were the most widely explored [53]. However, scientists have predicted that the global vaccination process will take some time and will include a test phase with several safety assessments. In particular, with mass manufacturing, this entire process will take between 12 and 18 months to achieve optimal results [54]. Additionally, once the vaccine is available to the general population, human clinical trials will be needed to demonstrate its overall efficacy and safety. Based on recently discovered epidemiological facts, the nature of the virus, the immune response to the virus, and challenges in vaccine production arise every day [55]. Evidently, the efforts invested in research must be strengthened with urgent applications to combat this pandemic. With the support of this evidence, research on the effectiveness of vaccines for COVID-19 still really need further research, and over a long period of time.

3.2. NNAR Analysis

The lag values in the time series can be used as input for an artificial neural network. NNAR uses a single hidden layer for forecasting univariate time series data. Each hidden layer node performs a single sigmoid transformation of its input. The nnetar function produced a good model by averaging the results of 20 networks with linear output units, but it was not the best. A better model will be produced through a trial-and-error mechanism than the model that is automatically selected by the function itself.
The order of auto-regression indicates the number of lag values upon which the current value of the time series is dependent. Meanwhile, the order of the neural network indicates the number of hidden nodes used in the network. Each node multiplies the input signal with a weight, and each weight is adjusted with the help of the learning process. The nnetar function in R uses the feed-forward algorithm to achieve this.
Both AR and NN orders were obtained by a trial-and-error mechanism, which was validated by forecasting the training data for only one period and comparing it with the actual value of the testing data. Then the compared testing data becomes training data. The same procedure is carried out until as much as the testing data as possible has been analyzed; this process is known as evaluation on a rolling forecasting origin [56,57,58] and obtained results of the validation phase are shown in Table 2 for the new cases, death cases, and recovered cases. The values in the table are the MAPEs from the evaluations, on a rolling forecasting origin. The end target of the forecasting application does not produce a set of predictions.
It is fundamental to compare the result against the actual values consistently, after which the model is evaluated by rolling through the origins. This process is validated by forecasting the training data for only one period and comparing it with the actual values of the testing data. The compared testing data then becomes training data. The same procedure is carried out until as much as the testing data as possible has been analyzed.
In Table 3 the MAPE values of both daily new cases and recovered cases begins to stabilize and is included in the low MAPE category, with 14 hidden nodes on each lag. This is in contrast to the death cases; after 14 hidden nodes, the MAPE value is still not stable at each lag, even though it has resulted in a low MAPE. According to the three tables above, all networks produce a smaller MAPE value; increasing the number of lags and the number of hidden nodes also results in a MAPE value with a low error category. Therefore, in the next step, the same mechanism will be applied again to find the optimal dataset split ratio to be used in the NNAR model. In addition to the 95:5 ratios that have been applied above, 80:20 and 70:30 ratios will be applied, this time with a trial-and-error mechanism. The obtained results are shown in the table below.
In Table 4, the MAPE values for daily new cases and daily death casess are smaller at a 70:30 split ratio, while, for daily recovered cases, the MAPE value is smaller, at an 80:20 split ratio. The NNAR model with the smallest MAPE values thereby will be used to do short-term forecasting. The proposed short-term method can be beneficial in government measures, as well as resources distribution and rapid planning of healthcare service deployment. Furthermore, medium-term and long-term forecasting is more appropriate for ensuring ventilator availability and vaccine production [28].
Forecasting will be carried out using the best network architecture that has the smallest error value in the validation phase. In this study, we will forecast the next 7 days using the one-step-ahead forecasting method. Forecasts are only carried out for the next seven days because the data will be updated approximately every seven days. In addition, forecast accuracy will decrease if longer forecast periods are carried out. This short-term forecast can be utilized for healthcare management decisions and supporting critical retailers in order to avoid stock outages. The accuracy of the network in fitting actual data is determined from the value of RMSE and MAE. The accuracy values of the best network architectures are shown in Table 4. Figure 7 illustrates the future value of daily new cases, daily death cases, and daily recovered cases, respectively, while Table 5 shows the forecasting results of the NNAR to predict each case type for Jakarta.
Based on Figure 7a, the forecast results show that daily new cases in the next 7 days will decline, to within a range range of 1249 to 1591. As the number of daily new cases are expected to decrease over time with the expansion of vaccination, there might be a more significant effect, given the implementation of PPKM Jakarta. On the other hand, the forecast results for daily recovered cases and daily death cases still projects an increase over the next 7 days. Therefore, the government needs additional interventions to decrease the daily death cases and to increase daily recovered cases more substantially; thereafter, active cases can be controlled during the remainder of the pandemic. However, the forecast results were only accurate for the first period, ending 19 March 2021. This is because the validation process was carried out with one-step-ahead validation; it would perform better were the data updated every day and forecasts made for the next day.

4. Conclusions

The Indonesian government continues its efforts to overcome the global pandemic at both national and local levels. Jakarta, as the capital of Indonesia, is the province with the most cases in Indonesia. As a result, Jakarta’s government issued its PPKM policy to reduce the number of COVID-19 cases. Based on the results of causal impact analysis, the application of PPKM Jakarta had a significant impact on the addition of daily new cases, as well as daily recovered cases, in Jakarta. On the other hand, the Indonesian government had also begun adopting national vaccination measures, which were divided into three phases, thus far, in which the frontline guards, such as health workers and the elderly, were the top priority. Unfortunately, according to the results of our analysis, this vaccination program did not have a significant impact on the increasing number of daily new cases in Jakarta, although the number of daily recovered cases was significantly impacted.
As per the forecast, the number of daily new cases were predicted to show a decrease and an increase in recovered and death cases was predicted for the 7-day period after 19 March 2021. However, when we compared these to the actual values, predicted values were only accurate for the first day. This might have happened because of the method we implemented, i.e., one-step-ahead forecasting, not multi-step-ahead forecasting. Considering that this pandemic is new to the world, the data collected are still few and do not reflect actual reality; this lack of data can lead to inaccuracy in long-term forecast results. Additionally, the behavior of any community cannot be controlled by the government on the basis of non-strict policies alone [59,60,61,62]. This leads to the fact that the number of daily new cases fluctuates, jumping up extremely then decreasing significantly, and, therefore, not following previous patterns. In fact, a down-slope in new daily cases does not necessarily lead to a reduced number of deaths. Furthermore, we conclude that this method is better used to generate daily forecasting of COVID-19 cases and evaluate it by rolling the origins or else using other, more appropriate methods to obtain weekly, monthly, and yearly predictions.
Despite all the limitations surround it, it can be said that the PPKM program was statistically significant in reducing the number of daily new cases in Jakarta, while the vaccination program has not yet been significant. The PPKM program might also be accompanied by socialization in the future in order to raise public awareness. By that time, vaccinations will also be more numerous and equally available for all Indonesian citizens, not just priority groups. This is also be a factor in the success of a national vaccination program, as seen in other countries where almost all citizens have been vaccinated.
The success of vaccination programs must be further evaluated over a long period of time to test their effectiveness in general. Therefore, for the time being, vaccination was only evaluated on the basis of confirmed cases in this study. For future studies, it would be better if more variables were included, or if they were carried out in a cohort study. Although the results of this study suggest that vaccination’s impact in Jakarta was not statistically significant, the success of the vaccination cannot be considered a failure because the vaccination process has only been in practice for two months and has not covered the entire population.
However, most recently, these results are consistent with the increase in new cases seen during the major holidays of April and May, although a downward trend emerged by the end of March 2021. Vaccination had been implemented intensively and widely by the major holidays but still hindered the suppression of new COVID-19 cases, since PPKM was not implemented correctly. This supports the result showing that the PPKM had a statistically significant effect and that regional restrictions are, therefore, indeed necessary to reduce mobility between regions. In this study, the two interventions were not tested separately; such would have been better, but was difficult as the two interventions had been implemented at the same time.

Author Contributions

Conceptualization, T.T., R.S.P., R.E.C., S.Z., P.K., N.S., M.D.P.S.; formal analysis, T.T., R.S.P., R.E.C., S.Z., P.K., N.S., M.D.P.S.; investigation, T.T., R.S.P., R.E.C., S.Z., P.K., N.S., M.D.P.S.; resources, T.T., R.S.P., R.E.C., S.Z., P.K., N.S., M.D.P.S.; data curation, R.S.P., R.E.C., S.Z., P.K., N.S., M.D.P.S.; writing—original draft preparation, T.T., R.S.P., R.E.C., S.Z., P.K., N.S., M.D.P.S.; writing—review and editing, T.T., R.S.P., R.E.C., S.Z., P.K., N.S., M.D.P.S., P.U.G., M.B., B.P.; visualization, R.S.P., R.E.C., S.Z., P.K., N.S.; supervision, T.T., R.E.C., M.B., B.P.; project administration, T.T., R.E.C., P.U.G., M.B., B.P.; funding acquisition, T.T., R.E.C., M.B., B.P. All authors have read and agreed to the published version of the manuscript.

Funding

This research is fully supported by Department of Statistics, Padjadjaran University. This research is part of the Directorate General of Research and Community Service, the Ministry of Education, Culture, Research, and Technology of the Republic of Indonesia through the World-Class Research Program 2021 [No. 401 214/SP2H/AMD/LT/DRPM/2020]. This research is part of Faculty of Economics and Business, Universitas Indonesia.

Institutional Review Board Statement

Not applicable.

Informed Consent Statement

Not applicable.

Data Availability Statement

Open data Indonesia National Disaster Management Authority (BNPB)/National Task Force on COVID-19. Code supporting the findings of this study are available https://github.com/Rezzy94/causalimpactneural.git (accessed on 24 July 2021).

Conflicts of Interest

The authors declare no conflict of interest. The funders had no role in the design of the study; in the collection, analyses, or interpretation of data; in the writing of the manuscript; or in the decision to publish the results.

References

  1. Velavan, T.P.; Meyer, C.G. The COVID-19 epidemic. Trop. Med. Int. Health 2020, 25, 278–280. [Google Scholar] [CrossRef] [Green Version]
  2. Djalante, R.; Lassa, J.; Nurhidayah, L.; Minh, H.V.; Mahendradhata, Y.; Ngoc, N.T. The ASEAN’s responses to COVID-19: A policy sciences analysis. PsyArXiv 2020, 368. [Google Scholar] [CrossRef]
  3. Gralinski, L.E.; Menachery, V.D. Return of the coronavirus: 2019-nCoV. Viruses 2020, 12, 135. [Google Scholar] [CrossRef] [Green Version]
  4. Ren, L.L.; Wang, Y.M.; Wu, Z.Q.; Xiang, Z.C.; Guo, L.; Xu, T.; Jiang, Y.Z.; Xiong, Y.; Li, Y.J.; Li, H.; et al. Identification of a novel coronavirus causing severe pneumonia in human: A descriptive study. Chin. Med. J. 2020, 133, 1015. [Google Scholar] [CrossRef]
  5. Zu, Z.Y.; Jiang, M.D.; Xu, P.P.; Chen, W.; Ni, Q.Q.; Lu, G.M.; Zhang, L.J. Coronavirus Disease 2019 (COVID-19): A Perspective from China. Radiology 2020, 296, E15–E25. [Google Scholar] [CrossRef] [PubMed] [Green Version]
  6. Poulter, N. Lower Blood Pressure in South Asia? Trial Evidence. N. Engl. J. Med. 2020, 382, 758–760. [Google Scholar] [CrossRef] [PubMed]
  7. Culp, W.C. Coronavirus Disease 2019: In-Home Isolation Room Construction. A A Pract. 2020, 14, e01218. [Google Scholar] [CrossRef]
  8. Tosepu, R.; Gunawan, J.; Savitri, D.; Ode, L.; Imran, A.; Lestari, H. Correlation between weather and Covid-19 pandemic in Jakarta, Indonesia. Sci. Total Environ. 2020, 725, 138436. [Google Scholar] [CrossRef] [PubMed]
  9. Rahmadi, A.; Fasyah, I.; Sudigyo, D.; Budiarto, A.; Mahesworo, B.; Hidayat, A.A.; Pardamean, B. Comparative study of predicted miRNA between Indonesia and China (Wuhan) SARS-CoV-2: A bioinformatics analysis. Genes Genom. 2021, 21, 1–8. [Google Scholar] [CrossRef]
  10. Kristantyo Wisnubroto Momentum Perbaiki Layanan Kesehatan Nasional. Available online: https://indonesia.go.id/kategori/indonesia-dalam-angka/1970/momentum-perbaiki-layanan-kesehatan-nasional (accessed on 2 March 2021).
  11. Djalante, R.; Lassa, J.; Setiamarga, D.; Mahfud, C.; Sudjatma, A.; Indrawan, M.; Haryanto, B.; Sinapoy, M.S.; Rafliana, I.; Djalante, S.; et al. Review and analysis of current responses to COVID-19 in Indonesia: Period of January to March 2020. Prog. Disaster Sci. 2020, 6, 100091. [Google Scholar] [CrossRef] [PubMed]
  12. Hudaefi, F.A.; Caraka, R.E.; Wahid, H. Zakāh administration in times of Covid-19 pandemic in Indonesia: A knowledge discovery via text mining. Int. J. Islamic Middle East. Financ. Manag. 2021. [Google Scholar] [CrossRef]
  13. Hudaefi, F.A.; Beik, I.S. Digital zakah campaign in time of Covid-19 pandemic in Indonesia: A netnographic study. J. Islam. Mark. 2021, 12, 498–517. [Google Scholar] [CrossRef]
  14. Isaifan, R.J. The dramatic impact of coronavirus outbreak on air quality: Has it saved as much as it has killed so far? Glob. J. Environ. Sci. Manag. 2020, 6, 275–288. [Google Scholar] [CrossRef]
  15. Caraka, R.E.; Lee, Y.; Kurniawan, R.; Herliansyah, R.; Kaban, P.A.; Nasution, B.I.; Gio, P.U.; Chen, R.C.; Toharudin, T.; Pardamean, B. Impact of COVID-19 large scale restriction on environment and economy in Indonesia. Glob. J. Environ. Sci. Manag. 2020, 6, 65–84. [Google Scholar] [CrossRef]
  16. Shammi, M.; Bodrud-Doza, M.; Towfiqul Islam, A.R.M.; Rahman, M.M. COVID-19 pandemic, socioeconomic crisis and human stress in resource-limited settings: A case from Bangladesh. Heliyon 2020, 6, e04063. [Google Scholar] [CrossRef]
  17. Caraka, R.E.; Yusra, Y.; Toharudin, T.; Chen, R.C.; Basyuni, M.; Juned, V.; Gio, P.U.; Pardamean, B. Did Noise Pollution Really Improve during COVID-19 ? Evidence from Taiwan. Sustainability 2021, 13, 5946. [Google Scholar] [CrossRef]
  18. Susanto, A.P.; Findyartini, A.; Taher, A.; Susilaradeya, D.P.; Ariawan, I.; Dartanto, T.; Takwin, B.; Prasodjo, I.B.; Yusuf, P.A.; Sudarmono, P.P.; et al. COVID-19 in Indonesia: Challenges and Multidisciplinary Perspectives for a Safe and Productive New Normal. Acta Med. Indones. 2020, 52, 423–430. [Google Scholar] [PubMed]
  19. Sparrow, R.; Dartanto, T.; Hartwig, R. Indonesia Under the New Normal: Challenges and the Way Ahead. Bull. Indones. Econ. Stud. 2020, 56, 269–299. [Google Scholar] [CrossRef]
  20. Gao, Q.; Bao, L.; Mao, H. Development of an inactivated vaccine candidate for SARS-CoV-2. Science 2020, 369, 77–81. [Google Scholar] [CrossRef]
  21. Haas, E.J.; Angulo, F.J.; McLaughlin, J.M.; Anis, E.; Singer, S.R.; Khan, F.; Brooks, N.; Smaja, M.; Mircus, G.; Pan, K.; et al. Impact and effectiveness of mRNA BNT162b2 vaccine against SARS-CoV-2 infections and COVID-19 cases, hospitalisations, and deaths following a nationwide vaccination campaign in Israel: An observational study using national surveillance data. Lancet 2021, 397, 1819–1829. [Google Scholar] [CrossRef]
  22. Riad, A.; Sağıroğlu, D.; Üstün, B.; Attia, S.; Klugar, M. Prevalence and Risk Factors of CoronaVac Side Effects: An Independent Cross-Sectional Study Among Healthcare Workers in Turkey. J. Clin. Med. 2021, 10, 2629. [Google Scholar] [CrossRef]
  23. Zhao, H.; Merchant, N.N.; McNulty, A.; Radcliff, T.A.; Cote, M.J.; Fischer, R.S.B.; Sang, H.; Ory, M.G. COVID-19: Short term prediction model using daily incidence data. PLoS ONE 2021, 16, 1–14. [Google Scholar] [CrossRef]
  24. Nurlaila, I.; Hidayat, A.A.; Pardamean, B. Lockdown strategy worth lives: The SEIRD modelling in COVID-19 outbreak in Indonesia. In Proceedings of the IOP Conference Series: Earth and Environmental Science, Jakarta, Indonesia, 23–24 June 2020; Volume 729. [Google Scholar] [CrossRef]
  25. Soyiri, I.N.; Reidpath, D.D. An overview of health forecasting. Environ. Health Prev. Med. 2013, 18, 1–9. [Google Scholar] [CrossRef] [Green Version]
  26. Muhyiddin, M. Covid-19, New Normal, dan Perencanaan Pembangunan di Indonesia. J. Perenc. Pembang. Indones. J. Dev. Plan. 2020, 4, 240–252. [Google Scholar] [CrossRef]
  27. Toharudin, T.; Pontoh, R.S.; Caraka, R.E.; Zahroh, S.; Akbar, A.; Pardamean, B.; Chen, R.-C. Indonesia in Facing New Normal: An Evidence Hybrid Forecasting of COVID-19 Cases Using. Eng. Lett. 2021, 29, 1–10. [Google Scholar]
  28. Petropoulos, F.; Makridakis, S.; Stylianou, N. COVID-19: Forecasting confirmed cases and deaths with a simple time series model. Int. J. Forecast. 2020. [Google Scholar] [CrossRef] [PubMed]
  29. Brodersen, K.H.; Gallusser, F.; Koehler, J.; Remy, N.; Scott, S.L. Inferring causal impact using bayesian structural time-series models. Ann. Appl. Stat. 2015, 9, 247–274. [Google Scholar] [CrossRef]
  30. Scott, S.L.; Varian, H.R. Predicting the present with Bayesian structural time series. Int. J. Math. Model. Numer. Optim. 2014, 5, 4–23. [Google Scholar] [CrossRef]
  31. Brodersen, K.H.; Hauser, A. Package CausalImpact. Available online: https://cran.r-project.org/web/packages/CausalImpact/vignettes/CausalImpact.html (accessed on 1 January 2021).
  32. Yasin, H.; Warsito, B.; Santoso, R.; Suparti, S. Soft Computation Vector Autoregressive Neural Network (VAR-NN) GUI-Based. In Proceedings of the E3S Web of Conferences, Semarang, Indonesia, 14–15 August 2018; Volume 73, p. 13008. [CrossRef] [Green Version]
  33. Endharta, A.J. Short term load demand forecasting in Indonesia by using double seasonal recurrent Neural networks. Int. J. Math. Model. Methods Appl. Sci. 2009, 3, 171–178. [Google Scholar]
  34. Suhermi, N.; Permata, R.P.; Rahayu, S.P. Forecasting the Search Trend of Muslim Clothing in Indonesia on Google Trends Data Using ARIMAX and Neural Network. In Proceedings of the Communications in Computer and Information Science, Iizuka, Japan, 28–29 August 2019. [Google Scholar]
  35. Warsito, B.; Yasin, H.; Prahutama, A. Particle Swarm Optimization to Obtain Weights in Neural Network. Matematika 2019, 35. [Google Scholar] [CrossRef]
  36. Caraka, R.E.; Chen, R.C.; Yasin, H.; Pardamean, B.; Toharudin, T.; Wu, S.H. Prediction of Status Particulate Matter 2.5 using State Markov Chain Stochastic Process and HYBRID VAR-NN-PSO. IEEE Access 2019, 7, 161654–161665. [Google Scholar] [CrossRef]
  37. Patan, K. Neural Networks. In Studies in Systems, Decision and Control; Springer: Cham, Switzerland, 2019. [Google Scholar]
  38. Haykin, S.S. Neural Networks and Learning Machines; Prentice Hall: New York, NY, USA, 2009; Volume 3, ISBN 9780131471399. [Google Scholar]
  39. Suhermi, N.; Prastyo, D.D.; Ali, B. Roll motion prediction using a hybrid deep learning and ARIMA model. Procedia Comput. Sci. 2018, 144, 251–258. [Google Scholar] [CrossRef]
  40. Caraka, R.E.; Chen, R.C.; Yasin, H.; Lee, Y.; Pardamean, B. Hybrid Vector Autoregression Feedforward Neural Network with Genetic Algorithm Model for Forecasting Space-Time Pollution Data. Indones. J. Sci. Technol. 2021, 6, 243–266. [Google Scholar]
  41. Gers, F.A.; Schmidhuber, J.; Cummins, F. Learning to forget: Continual prediction with LSTM. Neural Comput. 2000, 12, 2451–2471. [Google Scholar] [CrossRef]
  42. Yasin, H.; Warsito, B.; Santoso, R. Feed Forward Neural Network Modeling for Rainfall Prediction. In Proceedings of the E3S Web of Conferences, Semarang, Indonesia, 14–15 August 2018; pp. 1–5. [Google Scholar]
  43. Toharudin, T.; Pontoh, R.S.; Caraka, R.E.; Zahroh, S.; Lee, Y.; Chen, R.C. Employing Long Short-Term Memory and Facebook Prophet Model in Air Temperature Forecasting. Commun. Stat. Simul. Comput. 2021, 1–24. [Google Scholar] [CrossRef]
  44. Kaimian, H.; Li, Q.; Wu, C.; Qi, Y.; Mo, Y.; Chen, G.; Zhang, X.; Sachdeva, S. Evaluation of different machine learning approaches to forecasting PM2.5 mass concentrations. Aerosol Air Qual. Res. 2019, 19, 1400–1410. [Google Scholar] [CrossRef] [Green Version]
  45. Setiawan, S.; Prastuti, M. S-GSTAR-SUR model for seasonal spatio temporal data forecasting. Malays. J. Math. Sci. 2016, 10, 53–65. [Google Scholar]
  46. De Gooijer, J.G.; Hyndman, R.J. 25 years of time series forecasting. Int. J. Forecast. 2006, 22, 443–473. [Google Scholar] [CrossRef] [Green Version]
  47. Pontoh, R.S.; Solichatus, Z.; Hidayat, Y.; Aldella, R.; Jiwani, N.M. Sukono Covid-19 modelling in south korea using a time series approach. Int. J. Adv. Sci. Technol. 2020, 29, 1620–1632. [Google Scholar]
  48. Huang, C.; Wang, Y.; Li, X.; Ren, L.; Zhao, J.; Hu, Y.; Zhang, L.; Fan, G.; Xu, J.; Gu, X.; et al. Clinical features of patients infected with 2019 novel coronavirus in Wuhan, China. Lancet 2020, 395, 497–506. [Google Scholar] [CrossRef] [Green Version]
  49. Chen, N.; Zhou, M.; Dong, X.; Qu, J.; Gong, F.; Han, Y.; Qiu, Y.; Wang, J.; Liu, Y.; Wei, Y.; et al. Epidemiological and clinical characteristics of 99 cases of 2019 novel coronavirus pneumonia in Wuhan, China: A descriptive study. Lancet 2020, 395, 507–513. [Google Scholar] [CrossRef] [Green Version]
  50. Ho, J.C.; Chan, K.N.; Hu, W.H.; Lam, W.K.; Zheng, L.; Tipoe, G.L.; Sun, J.; Leung, R.; Tsang, K.W. The effect of aging on nasal mucociliary clearance, beat frequency, and ultrastructure of respiratory cilia. Am. J. Respir. Crit. Care Med. 2001, 163, 983–988. [Google Scholar] [CrossRef] [PubMed] [Green Version]
  51. BASE Medicine Task Force. COVID-19: Facts and Recommendations from A to Z. Sci. Insigt. 2020, 33, 138–158. [Google Scholar] [CrossRef]
  52. Yousefifard, M.; Zali, A.; Mohamed Ali, K.; Madani Neishaboori, A.; Zarghi, A.; Hosseini, M.; Safari, S.; Ali, M.K.; Neishaboori, M.A. Antiviral Therapy in Man-agement of COVID-19: A Systematic Review on Current Evidence. Arch. Acad. Emerg. Med. 2020, 8, 45. [Google Scholar]
  53. Scagnolari, C.; Vicenzi, E.; Bellomi, F.; Stillitano, M.G.; Pinna, D.; Poli, G.; Clementi, M.; Dianzani, F.; Antonelli, G. Increased sensitivity of SARS-coronavirus to a combination of human type I and type II interferons. Antivir. Ther. 2004, 9, 1003–1011. [Google Scholar]
  54. Stockman, L.J.; Bellamy, R.; Garner, P. SARS: Systematic review of treatment effects. PLoS Med. 2006, 3, 1525–1531. [Google Scholar] [CrossRef] [Green Version]
  55. Chan, J.F.W.; Yuan, S.; Kok, K.H.; To, K.K.W.; Chu, H.; Yang, J.; Xing, F.; Liu, J.; Yip, C.C.Y.; Poon, R.W.S.; et al. A familial cluster of pneumonia associated with the 2019 novel coronavirus indicating person-to-person transmission: A study of a family cluster. Lancet 2020, 395, 514–523. [Google Scholar] [CrossRef] [Green Version]
  56. Suhartono, D.E.A.; Prastyo, D.D.; Kuswanto, H.; Lee, M.H. Deep neural network for forecasting inflow and outflow in Indonesia. Sains Malays. 2019, 48, 1787–1798. [Google Scholar] [CrossRef]
  57. Sunaryo, S.; Suhartono, J.A. Double Seasonal Recurrent Neural Networks for Forecasting Short Term Electricity Load Demand in Indonesia. In Recurrent Neural Networks for Temporal Data Processing; IntechOpen: London, UK, 2011; pp. 1–16. [Google Scholar]
  58. Suhartono, S.; Prastyo, D.D.; Kuswanto, H.; Lee, M.H. Comparison between VAR, GSTAR, FFNN-VAR and FFNN-GSTAR Models for Forecasting Oil Production Methods. Mat. Malays. J. Ind. Appl. Math. 2018, 34, 103–111. [Google Scholar]
  59. Ng’andu, S.K.; Haambokoma, N.M.; Milingo, T.L.C. The Contribution of Behavioural Theories of Learning to Education; The University Of Zambia School of Education: Zuka, Zambia, 2002. [Google Scholar]
  60. Sudiana, K.; Sule, E.T.; Soemaryani, I.; Yunizar, Y. The development and validation of the Penta Helix construct. Bus. Theory Pract. 2020, 21, 136–145. [Google Scholar] [CrossRef] [Green Version]
  61. Nilsson, M.; McCollum, D.; Echeverri, L.G.; Riahi, K.; Parkinson, S. A Guide To SDG Interactions: From Science to Implementation. In A Guide To SDG Interactions: From Science to Implementation; International Council for Science: Paris, France, 2017; ISBN 9781844078943. [Google Scholar]
  62. Lin, C.; Braund, W.E.; Auerbach, J.; Chou, J.-H.; Teng, J.-H.; Tu, P.; Mullen, J. Policy Decisions and Use of Information Technology to Fight 2019 Novel Coronavirus Disease, Taiwan. Emerg. Infect. Dis. 2020, 26, 1506. [Google Scholar] [CrossRef] [PubMed]
Figure 1. The Number of COVID-19 cases in Jakarta.
Sustainability 13 08282 g001
Figure 2. COVID-19 active cases after each measure. Source: https://corona.jakarta.go.id/en/data-pemantauan (accessed on 24 July 2021).
Sustainability 13 08282 g002
Figure 3. COVID-19 active cases after each measure. Source: https://ourworldindata.org/covid-vaccinations?country=IDN (accessed on 24 July 2021).
Sustainability 13 08282 g003
Figure 4. Visualization of the COVID-19, new and recovered cases, after 1st vaccination.
Sustainability 13 08282 g004
Figure 5. Visualization of the COVID-19, new and recovered, cases after PPKM implementation.
Sustainability 13 08282 g005
Figure 6. Visualization of counterfactual predictions for the post-vaccination period of COVID-19 regarding daily new cases (a) and recovered cases (b); and for the post-PPKM period, daily new cases (c) and recovered cases (d).
Sustainability 13 08282 g006
Figure 7. Forecast results of COVID-19 daily new cases in Jakarta (a), death cases in Jakarta (b), and recovered cases in Jakarta (c).
Sustainability 13 08282 g007aSustainability 13 08282 g007b
Table 1. p-Values of each case.
VariableDaily New CasesRecovered Cases
Vaccination0.166490.00219
PPKM Jakarta0.001060.00109
Table 2. MAPE value of validation for daily new cases, death cases, and recovered cases.
Number of Hidden NodesNumber of Lags
67891011121314
Daily New Cases131.5328.7328.6628.8629.6332.8938.8237.9739.94
228.2226.9727.4626.6628.0327.9729.9229.2626.67
319.8819.0219.6618.6218.3717.8416.9316.0313.15
414.1911.2411.9311.039.749.868.729.497.25
59.268.28.096.115.865.225.184.544.44
65.855.95.194.373.993.182.633.582.83
75.873.72.693.242.422.362.22.292.03
83.62.762.641.951.991.761.791.711.7
93.122.142.081.891.771.611.531.621.31
102.571.81.631.421.461.431.411.291.25
112.091.951.741.511.371.271.271.281.26
121.91.551.531.281.281.281.231.21.16
131.81.481.451.241.251.241.211.21.17
141.721.481.271.221.211.281.151.141.13
Death199.08104.59104.89105.47104.63106.52108.36110.75110.61
289.2388.989.9697.0391.1685.8190.9484.4987.03
358.9757.5252.6258.2860.6955.3456.3660.0542.11
439.7938.6132.3137.2336.0233.8728.0626.6924.47
529.9124.9825.7121.7321.7418.2316.8913.1215.7
622.5618.7616.3214.1814.9210.8910.6910.3111.8
715.1414.8413.8511.0511.038.88.138.77.33
813.6512.6212.678.638.357.067.567.557.72
912.0411.039.767.537.716.656.786.956.63
1011.3110.239.427.346.986.366.466.156.3
1110.479.218.66.596.376.126.046.516.11
1210.189.518.336.336.46.085.886.15.95
139.28.297.976.26.396.26.145.875.89
149.138.067.726.156.166.126.15.865.98
Recovered125.7527.6527.9827.5829.8429.2429.4228.9828.98
229.6729.6329.4129.7730.5331.1230.4332.0132.01
32725.7525.1724.9226.3323.2723.3422.422.4
424.7621.3120.8222.3616.7315.1415.5815.8715.87
521.6718.817.3316.4413.7512.7612.1712.0412.04
618.9715.4713.9312.910.5410.459.899.259.25
714.3514.4110.810.938.999.348.288.398.39
813.0911.7210.439.848.878.197.87.837.83
911.3610.449.978.9287.667.627.727.72
1010.79.0998.5658.4317.6477.5717.2467.2777.277
1110.28.4218.0487.9767.5097.3597.337.3997.399
129.568.0687.967.8627.4027.3787.2797.2387.238
138.938.0967.9847.6117.3687.3457.1827.1797.179
148.577.9547.5287.6257.3967.3357.2687.1837.183
Table 3. MAPE values of validation with different splits of data using NNAR (14,14).
Hidden NodesSplit Ratio
80/2070/30
RecoveredNew CaseDeathRecoveredNew CaseDeath
132.6632.6945.0027.6325.9638.76
222.5920.9136.9519.8917.5832.22
314.9012.4225.8613.9912.3924.40
49.437.3817.069.358.5717.32
55.874.2610.767.115.7812.90
63.752.408.454.883.849.76
72.541.195.123.413.027.60
82.100.793.442.452.236.14
91.710.652.821.971.734.68
101.650.451.701.791.383.99
111.510.331.561.421.172.96
121.480.300.991.321.092.68
131.420.280.961.190.912.20
141.450.260.781.060.871.82
Table 4. Network accuracy.
CasesModelRMSEMAE
Daily newNNAR (14,14)50.7430.64
DeathNNAR (14,14)2.791.45
RecoveredNNAR (14,14)76.4841.16
Table 5. Forecasting results of COVID-19 cases in Jakarta.
DateDaily New CasesDeath CasesRecovered Cases
Lo 95PointHi 95ActualLo 95PointHi 95ActualLo 95PointHi 95Actual
19/03/20211464156816781588192530241097124513881175
20/03/20211179128213851935152026221246140115611184
21/03/20211103120913131638232834231297145315991884
22/03/2021125913641466147416222881293143215751715
23/03/2021125913711481816263137111162131414671691
24/03/2021121913211415890152127111063122213961986
25/03/2021133414311533172732384312233324852643490
Publisher’s Note: MDPI stays neutral with regard to jurisdictional claims in published maps and institutional affiliations.

