
Impact of COVID-19 on the Territory and Demographic Processes: A View from Spanish Rural and Urban Areas

Geography Department, Research Institute of Local Development, Universitat de València, 46010 Valencia, Spain
*
Author to whom correspondence should be addressed.
Sustainability 2023, 15(10), 7899; https://doi.org/10.3390/su15107899
Submission received: 5 April 2023
/
Revised: 3 May 2023
/
Accepted: 6 May 2023
/
Published: 11 May 2023
(This article belongs to the Special Issue COVID-19 and Urban Inequalities: Spatial and Digital Dimensions)
Abstract
:The current physiognomy and problems of rural and urban territories in Spain are directly related to the demographic processes linked to the rural exodus of the 1960s. In the year 2020, a new problem and/or conditioning factor arose, COVID-19, which has modified dynamics, routines, and aspects of the daily life of the population. The objectives of this research are to check whether there are differences in the effect of COVID-19 between urban and rural municipalities and, in turn, to analyse the demographic dynamics of the population between 2020 and 2022, as well as territorial distribution patterns. To this end, population data were extracted from the Population Register and Residential Variation data for the period 2010 and 2022 and demographic and statistical calculations (Student’s t-test and Pearson’s correlation) were carried out. Among the main results, it is observed that COVID-19 has less of an effect in Spanish rural areas. Moreover, these areas show a positive demographic trend for the period 2020–2022. Population growth has had a direct influence on the improvement of demographic data, although with differences according to autonomous communities. This fact represents a break in the trend in rural areas, but is beginning to show signs of exhaustion and a return to the pre-pandemic trend.
1. Introduction
1.1. Population Growth and Migration Dinamics before COVID-19 in Spain
Since the 1950s, Spanish rural areas have suffered a constant loss of population due, among other factors, to the mechanisation of the countryside and the industrialisation and tertiarisation of urban municipalities [1,2]. These rural–urban migratory movements, especially of young people and women, have led to a change in the demographic structure of rural municipalities, with an increase in ageing, over-masculinisation, and dependency, all as a consequence of the decline in population. Thus, the rural exodus has been changing the physiognomy of these spaces, causing a loss of weight of inland rural areas in favour of intermediate and/or urban areas [3,4,5,6,7].
However, when studying internal rural–urban migration, it is possible to differentiate between different stages characterised by a greater or lesser prominence of urbanisation, suburbanization, and/or counter-urbanisation dynamics [8,9,10,11,12]. Moreover, these movements have a direct effect on population volume and structure and, ultimately, on the growth or decline of the areas [13].
1.2. Population Growth and Migratory Dynamics during COVID-19
The effects that COVID-19 has had on residential mobility, especially during the first months of the pandemic, have been widely discussed both in the scientific literature and in the media. Concepts such as “rural renaissance” and “urban exodus” were common in scientific papers and in the media during the first phase of the health crisis, both in Spain [14,15] as well as in other countries such as France [16], the United Kingdom [17], Sweden [18,19], the United States [20], and Japan [21,22], among others, making urban population loss a global phenomenon, albeit with notable differences between countries.
Cities have been the hardest hit by the virus. The high flow of people, air connectivity, population density, and the high intensity of social interactions meant that urban spaces became epicentres of contagion during the first months of the health crisis [12,23,24,25,26,27].
Thus, the traditional reasons that drove the dynamics of counter-urbanisation before the pandemic (high price of urban housing, perceived lack of security, pollution, search for greater contact with nature, and so on) were joined by new motivations related to the fear of contagion and the search for greater freedom of movement. The main reasons for people moving from cities to rural environments include the following: the search for housing with more space than is available in cities, the search for environments with low population density and open spaces where the spread of the virus is less likely, greater food security, or the quality of the landscape [12]. In addition, other authors point out that restrictions on social interaction, the implementation of teleworking, online teaching, the expansion of digital commerce, the closure of leisure and the suppression of cultural activities, and so on reduced the attractiveness of cities in favour of rural areas [26]. As Shucksmith [27] explains, rural areas have been seen by the population as a refuge from illness, but at the same time necessary to maintain mental and physical health. Hence, there are changes and new housing preferences of the population [18,26,27,28].
Furthermore, these population movements have directly influenced the increase in internet coverage in rural areas in Spain, as demonstrated by the latest report from the Spanish government’s Ministry of Economic Affairs [29], which indicates that 7 out of 10 rural households have coverage of more than 100 Mbps, which has led to a reduction in the digital divide of more than 5 points when compared with data from 2021 to 2022, but even more if compared with data from 2020, by almost 25 percentage points. It also highlights that 4G coverage reaches almost 100% of the rural population, while 5G coverage reaches only 25% of the rural population.
All of these reasons have led to a change in the urban population’s perception of rural areas, making them attractive areas in which to live more freely and safely than in crowded cities. Proof of this is that, in Spain, in 2020, there was an increase in the rural population to the detriment of the urban population, thus breaking the trend that had been in force since the middle of the last century [2]. Specifically, the rural population increased by 0.7% in 2020 while the urban population decreased by 0.3% [30]. This change in trend is mainly due to the dynamics of internal migration, with a decrease in rural emigration and an increase in urban immigration to rural areas [12]. This was not unique to Spain, but also occurred in other countries such as Japan [31], the United Kingdom [17], and Sweden [18,19].
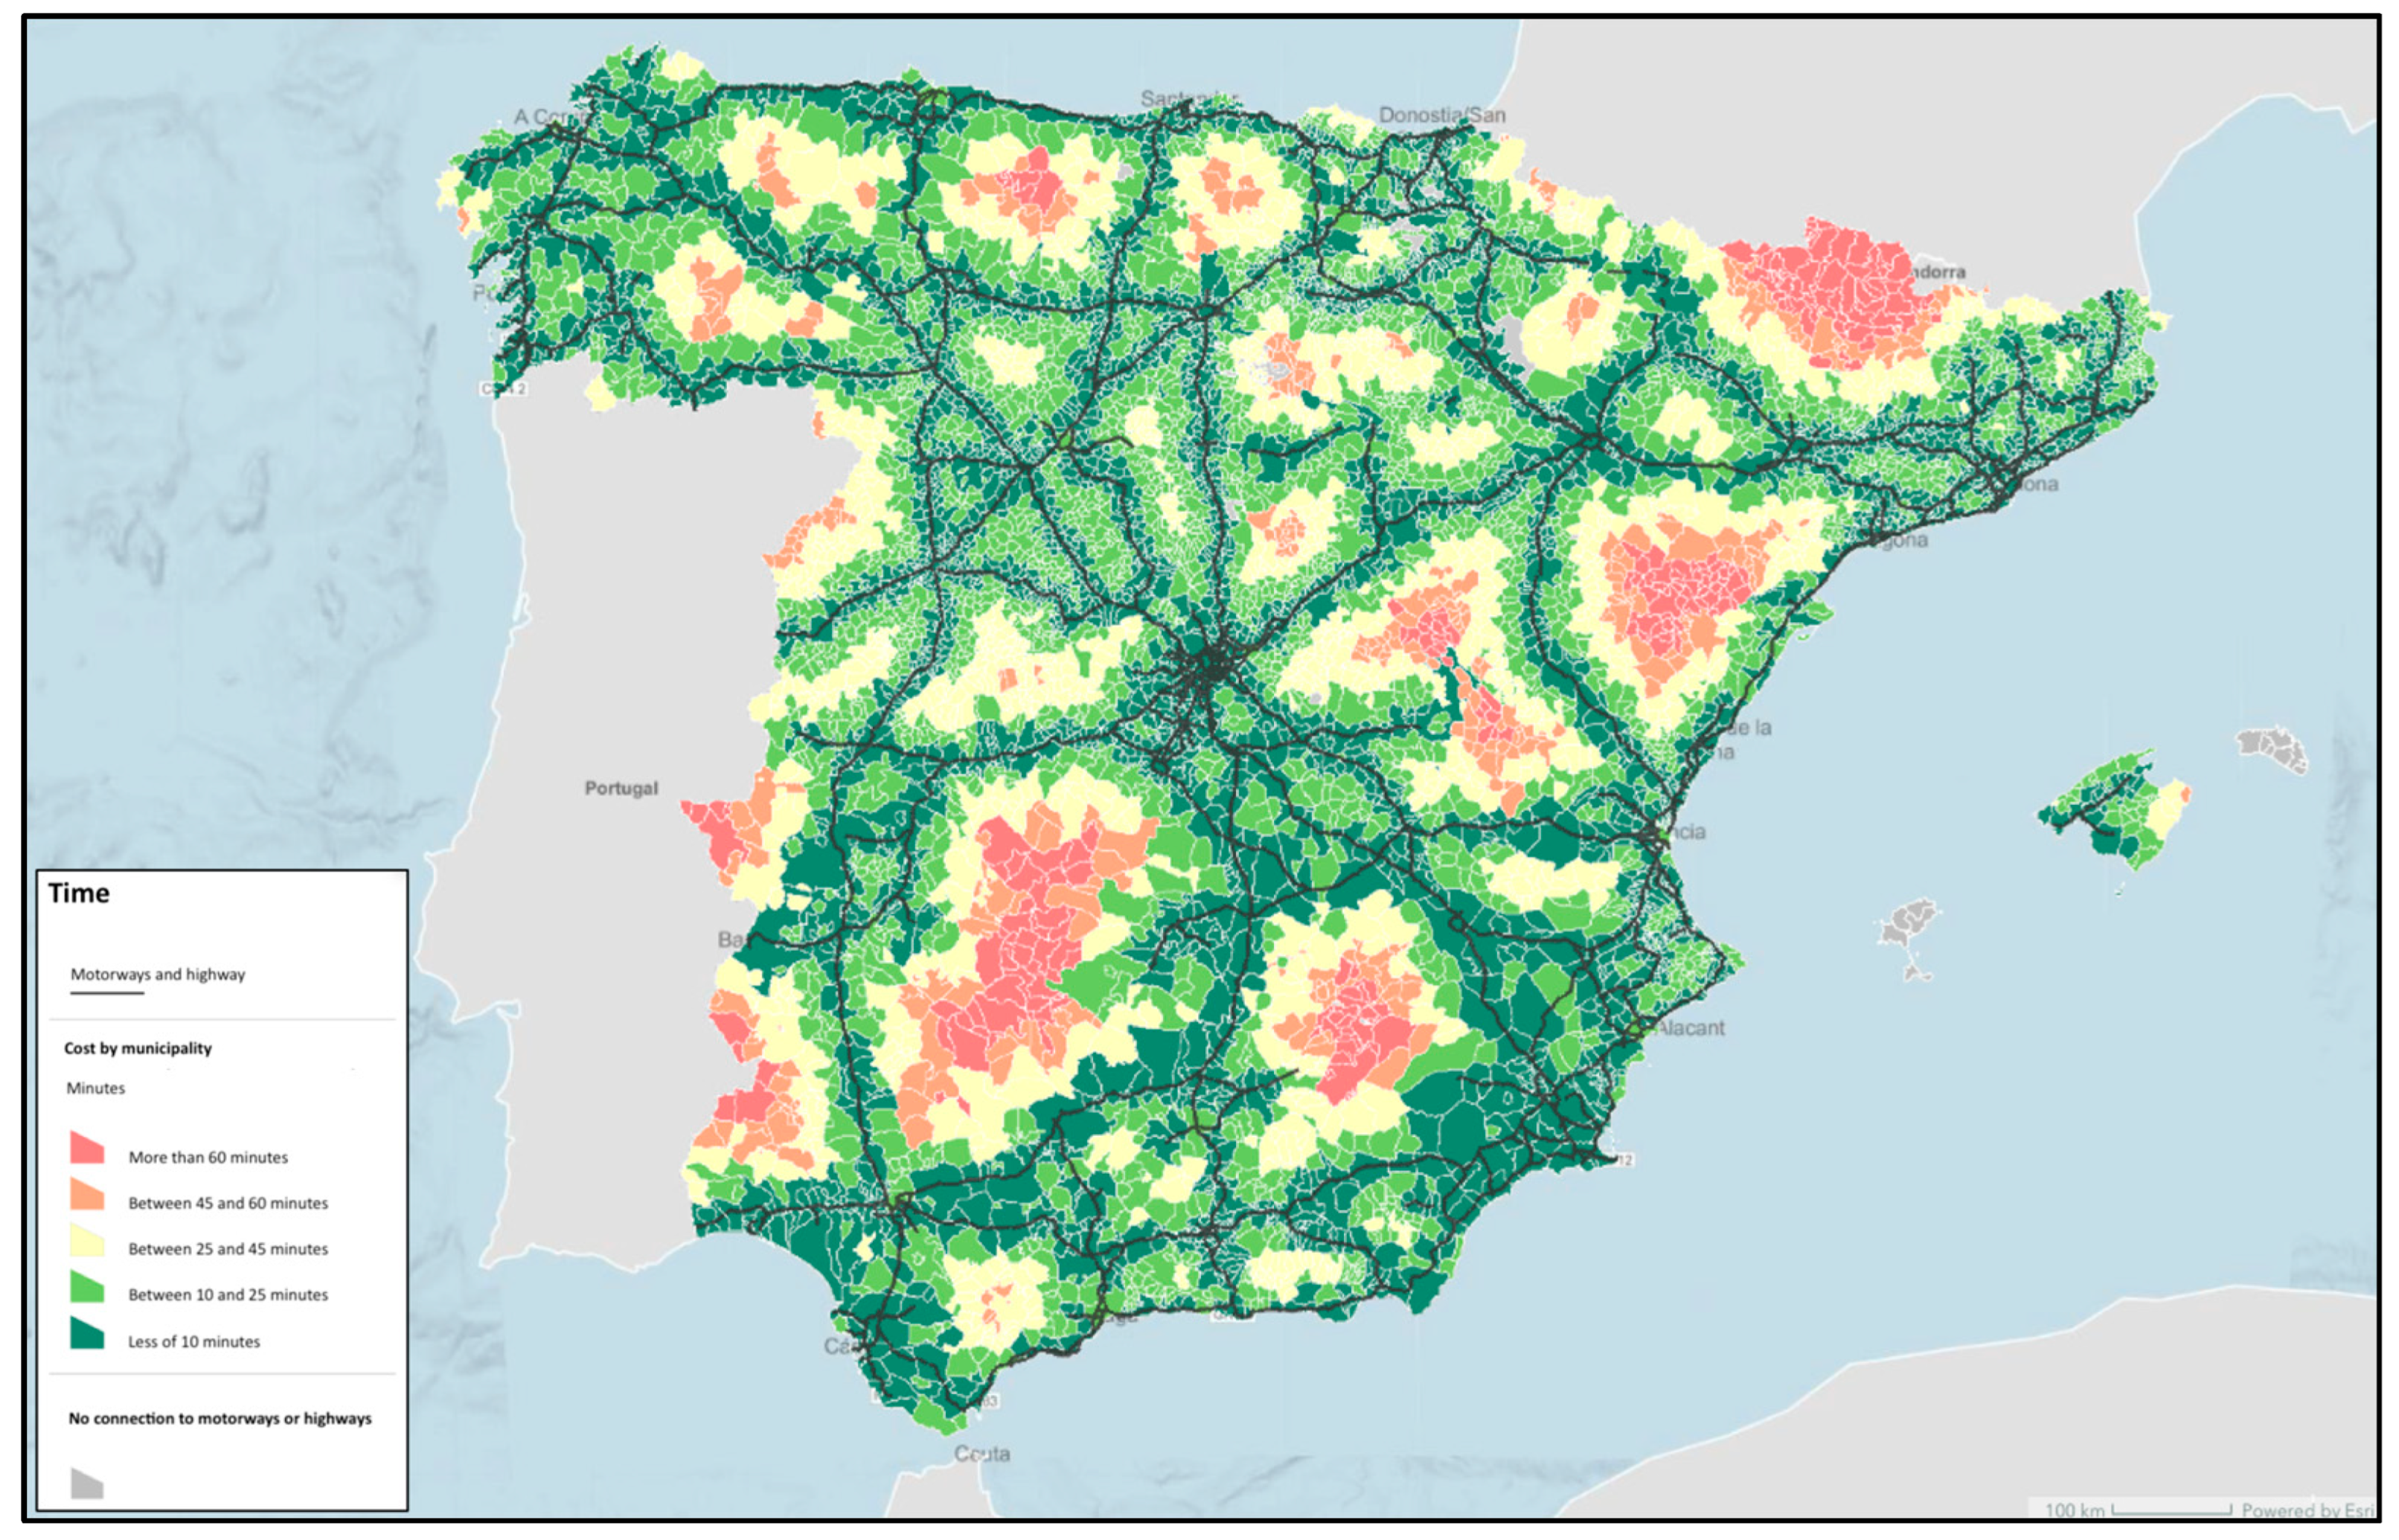
However, not all rural destinations were equally attractive to the urban population, nor did the whole population have the same opportunities or predilections when it came to migrating. Some authors point out that, in the case of Spain, the municipalities that gained in population because of internal migration were those that lost more people during the rural exodus and/or those with a higher percentage of second homes, with aspects such as accessibility to services (physical and digital) also having an important influence [31]. In relation to accessibility through the Spanish road network, the Secretariat of Transport, Mobility, and Urban Agenda [32] has published a study on accessibility in minutes and kilometers from municipal capitals to the main infrastructures such as hospitals or large municipalities. Among the main results of the study, there is a clear dichotomy between urban and intermediate municipalities where the cost in minutes of travel rarely exceeds 25 min, while rural areas are generally in a range between 45 and more than 60 min (Figure 1).
Other authors distinguish between migrations concentrated in rural municipalities located on the fringes of large metropolitan regions, where many urban residents maintain family, social, and residential property ties, and more distant destinations associated with tourist areas in coastal and rural areas of second residence. Moreover, the migrant profile corresponds to upper-middle class people, with the possibility of teleworking and with second homes [2,12].
1.3. Rural Renaissance?
The pandemic may represent an opportunity to reverse the rural–urban migration trend, as these municipalities have become more attractive for the reasons already mentioned (security, freedom, contact with nature, and so on). The implementation of measures such as teleworking and the development of digital commerce could favour the arrival of settlers in rural areas [20,33]. The arrival of these new settlers can be a boost for the local economy, as well as for the maintenance or reopening of basic services such as schools or medical centres. Thus, some authors have argued that the change in trend that occurred in 2020 would persist after the pandemic [34].
The new migratory dynamics have had a significant demographic impact on rural territories, especially in the most depopulated municipalities, where the increase in the population has led to significant changes in the demographic indicators of these populations in relative terms (age structure, ageing, dependency, and so on). However, these flows have not affected the demographic characteristics of cities, owing to their large population size [15].
The decline of cities predicted in some media at the beginning of the pandemic seems to be far from a reality. Several pandemics have hit cities harder than rural settings, but this has not meant the end of urban agglomerations [15,35]. Cities are centres of innovation, exchange of ideas and goods, and economic growth. The return to work and face-to-face education, the end of mobility restrictions, and the opening of commerce and leisure have led to a revival of urban attractiveness.
On the other hand, despite recent improvements in rural connectivity, many remote rural areas lack the infrastructure and services needed for teleworking, e-commerce, and/or for the habits and leisure activities consumed by urbanites. The existence of good internet connectivity is fundamental for the development of these municipalities. However, in the Spanish case, there are serious connectivity deficiencies, especially in the most remote rural areas, where the problems of depopulation are greater [33].
For all of these reasons, several authors raise doubts about the continuity of the phenomenon over the coming years and suggest that these changes may have been temporary [17,20,31]. According to these authors, beyond the evolution of the pandemic itself, the growth in urban and rural populations will be affected by the extent of digitalisation in the rural world, the degree of implementation of teleworking or hybrid working arrangements, the evolution of the preferences and priorities of the urban population, housing prices, and the ageing of the population, among others.
This is why, in view of the effects that the COVID-19 pandemic has had on the population, as well as the movements that have been observed in other countries around the world, this paper poses the following research questions: Are there differences in the number of people infected by and dead from COVID-19 according to the rural or urban municipalities in the different Spanish autonomous communities? Have there been changes in the territorial distribution patterns of the population since the outbreak of the pandemic? Have these demographic changes positively affected the main demographic indicators in Spanish rural areas?
The main contribution of this article is to analyse the population growth/decline of Spanish rural areas over the last 13 years, paying special attention to the pre-pandemic period (2018–2020) and the first two years of the health crisis (2020–2022), in order to check whether COVID-19 has had a differentiated impact on rural areas, as well as to detect possible significant changes in the population growth/decline patterns of these areas during the first two years of the pandemic compared with the period prior to the health crisis. For this purpose, we propose a double statistical analysis; on the one hand, the relationship between different variables and, on the other hand, spatial statistics to verify patterns of territorial distribution of the population. To this aim, we will compare the patterns of all Spanish municipalities based on the annual real growth rate between different periods and considering the classification of the municipality into urban, rural, and intermediate. All of this will make it possible to identify whether there is a relationship between the effect that COVID-19 has had on the different municipalities, their growth/decline, and their demographic effect on the territory. In this way, it is possible to characterise territorially the effect that COVID-19 has had on the population and how it has adapted or moved.
To provide an answer to this, Section 2 is devoted the characterization of the study areas, especially the importance of the Spanish rural areas, the data source, and population and COVID-19 data, as well as the methods, rates and indexes, and methodology used. Section 3 and Section 4 are devoted to the presentation and discussion of the results obtained about the implication of COVID-19 in the population, their distribution, and its effect on the territory. Finally, Section 5 contains the conclusion, where the main contribution of the research is presented, as well as future lines of research to understand the evolution of this process and the state of the rural areas and their population.
2. Materials and Methods
2.1. Data Source and Methods
To achieve the proposed objective, the INE was used to extract population data from the Municipal Register for the period 2010–2022, broken down by sex and age. From this data, a set of basic demographic rates and indicators were selected and calculated to check whether the demographic characteristics and trends in rural areas (depopulation, masculinisation, ageing, and dependency) have changed as a result of COVID-19.
Firstly, the aim is to verify the scope and effect that COVID-19 has had on Spanish rural municipalities. To this end, the cumulative incidence of COVID-19 per 100,000 inhabitants in each autonomous community was calculated. The data were provided by Diario.es because they had the complete database of data from the beginning of the pandemic and relied on official data provided by regional governments. This made it simpler and avoided the bureaucracy of requesting data for each of the autonomous communities, which would cause a long delay. It should be noted that information is not available for all autonomous communities, as Castilla La Mancha, Castilla y León, Extremadura, and Galicia do not publish open data for all municipalities. Thus, data were obtained for a total of 4268 municipalities out of the 8185 that make up Spain. The temporal scope of the data analysed extends from the start of the pandemic to 15 March 2022.
Secondly, based on data extracted from the Municipal Register for the period 2010–2022 and to analyse the demographic consequences of COVID-19 in Spanish rural municipalities, a set of rates and indicators were calculated (Table 1):
- Annual real growth rate (ARGR): this indicator, also known as the growth rate, was calculated to analyse the variation in the population volume of rural municipalities. Numerous authors consider it to be a very appropriate formulation for measuring depopulation, because it arises from the relationship between natural growth and migratory dynamics [35,36].
- Sex rate: the aim of this rate is to check whether there is a relationship between the depopulation process and the greater or lesser presence of men and women in the territory, i.e., whether the phenomena of masculinisation and/or feminisation predominate in the municipalities.
- Ageing index: this index shows the weight that the population over 64 years of age represents in relation to the population under 16 years of age.
- Dependence rate: this is an indicator with a clear economic significance, as it presents the relative measure of the inactive population over the potentially active population.
- The selection of these indicators was made because they directly inform the main demographic problems of Spanish rural areas: depopulation, masculinisation, dependency, and ageing [1,3,4,34,35]. Therefore, the calculation of these indicators allows us to know the real demographic status of these areas.
The results obtained for the different demographic rates and indicators were represented graphically and cartographically using ARCGIS 10.8 software. In addition, a set of statistical calculations were carried out with SPSS software, calculating Student’s t-test or Pearson’s correlation depending on the type of variables analysed.
- On the one hand, by means of Pearson’s correlation, we can analyse the degree of association between two quantitative variables (in our study, they are the ARGR 2020–2022, incidence of COVID-19 per 100,000 inhabitants, and deaths due to COVID-19). The value of the index varies between −1 and 1 and its interpretation is clear. When a value of r = 1 is obtained, it means that there is a perfect positive correlation, i.e., a strong direct relationship whereby, when one variable increases, the other increases in the same proportion. However, when r = −1, it means that there is a negative correlation, i.e., a strong inverse relationship, because when one variable increases, the other decreases in constant proportion. Finally, if r = 0, it means that there is no linear relationship between the variables.
- On the other hand, Student’s t-test will be applied to test the link between quantitative variables and qualitative variables (the incidence of COVID-19 per 100,000 inhabitants, deaths due to COVID-19, ARGR 2018–2020, ARGR 2020–2022, and ARGR 2010–2020, which are quantitative, and the territorial typology variable differentiating rural and non-rural municipalities, which is nominal and dichotomous). This test includes Levene’s test, which shows whether there are significant differences between the variances of the variables, as well as Cohen’s D, which shows the strength of the relationship between the variables, i.e., not only whether or not there is a relationship, but also whether it is low, medium, high, or very high.
- Finally, in order to analyse the spatial distribution patterns of population growth/decline, the optimised hotspot analysis tool (Gi de Getis-Ord) of ArcGis 10.8 software was used. This tool allows the detection of statistically significant spatial clusters that concentrate high values (hot spots) or low values (cold spots) of a variable. Specifically, in this study, it was used to detect those clusters of municipalities in which relative population growth/decrease was statistically significant in spatial terms during the periods 2018–2020, 2020–2022, and 2010–2022.
2.2. Study Area and Characterisation
Spain is a European state that is organised territorially and administratively into three decentralised levels (Art. 137 Spanish Constitution, 1988). The top level is the division into autonomous communities (CC.AA.), where there are a total of 17 CC.AA. and they have political and financial autonomy, as well as decentralised competences according to subjects [38,39]. The second, intermediate, level are the provinces, of which there are a total of 50 and they are located within the autonomous communities. The third level are the municipalities, with a total of 8131 municipalities, which constitute the basic and smallest scale entities of the territorial organisation of the state and are the areas closest to the population [38,39].
Once the Spanish administrative division has been explained, our study will focus on the municipal level, but linking the data to the autonomous community level, as there are large population, administrative, territorial, and other differences between the autonomous communities (Figure 2 and Figure 3). Within the municipalities, it is important to understand the classification and distribution of these between rural, urban, and intermediate. The delimitation of the rural sphere is necessary for the correct design and application of the work, as well as to understand the evolution and the effect of these municipalities after the COVID-19 pandemic.
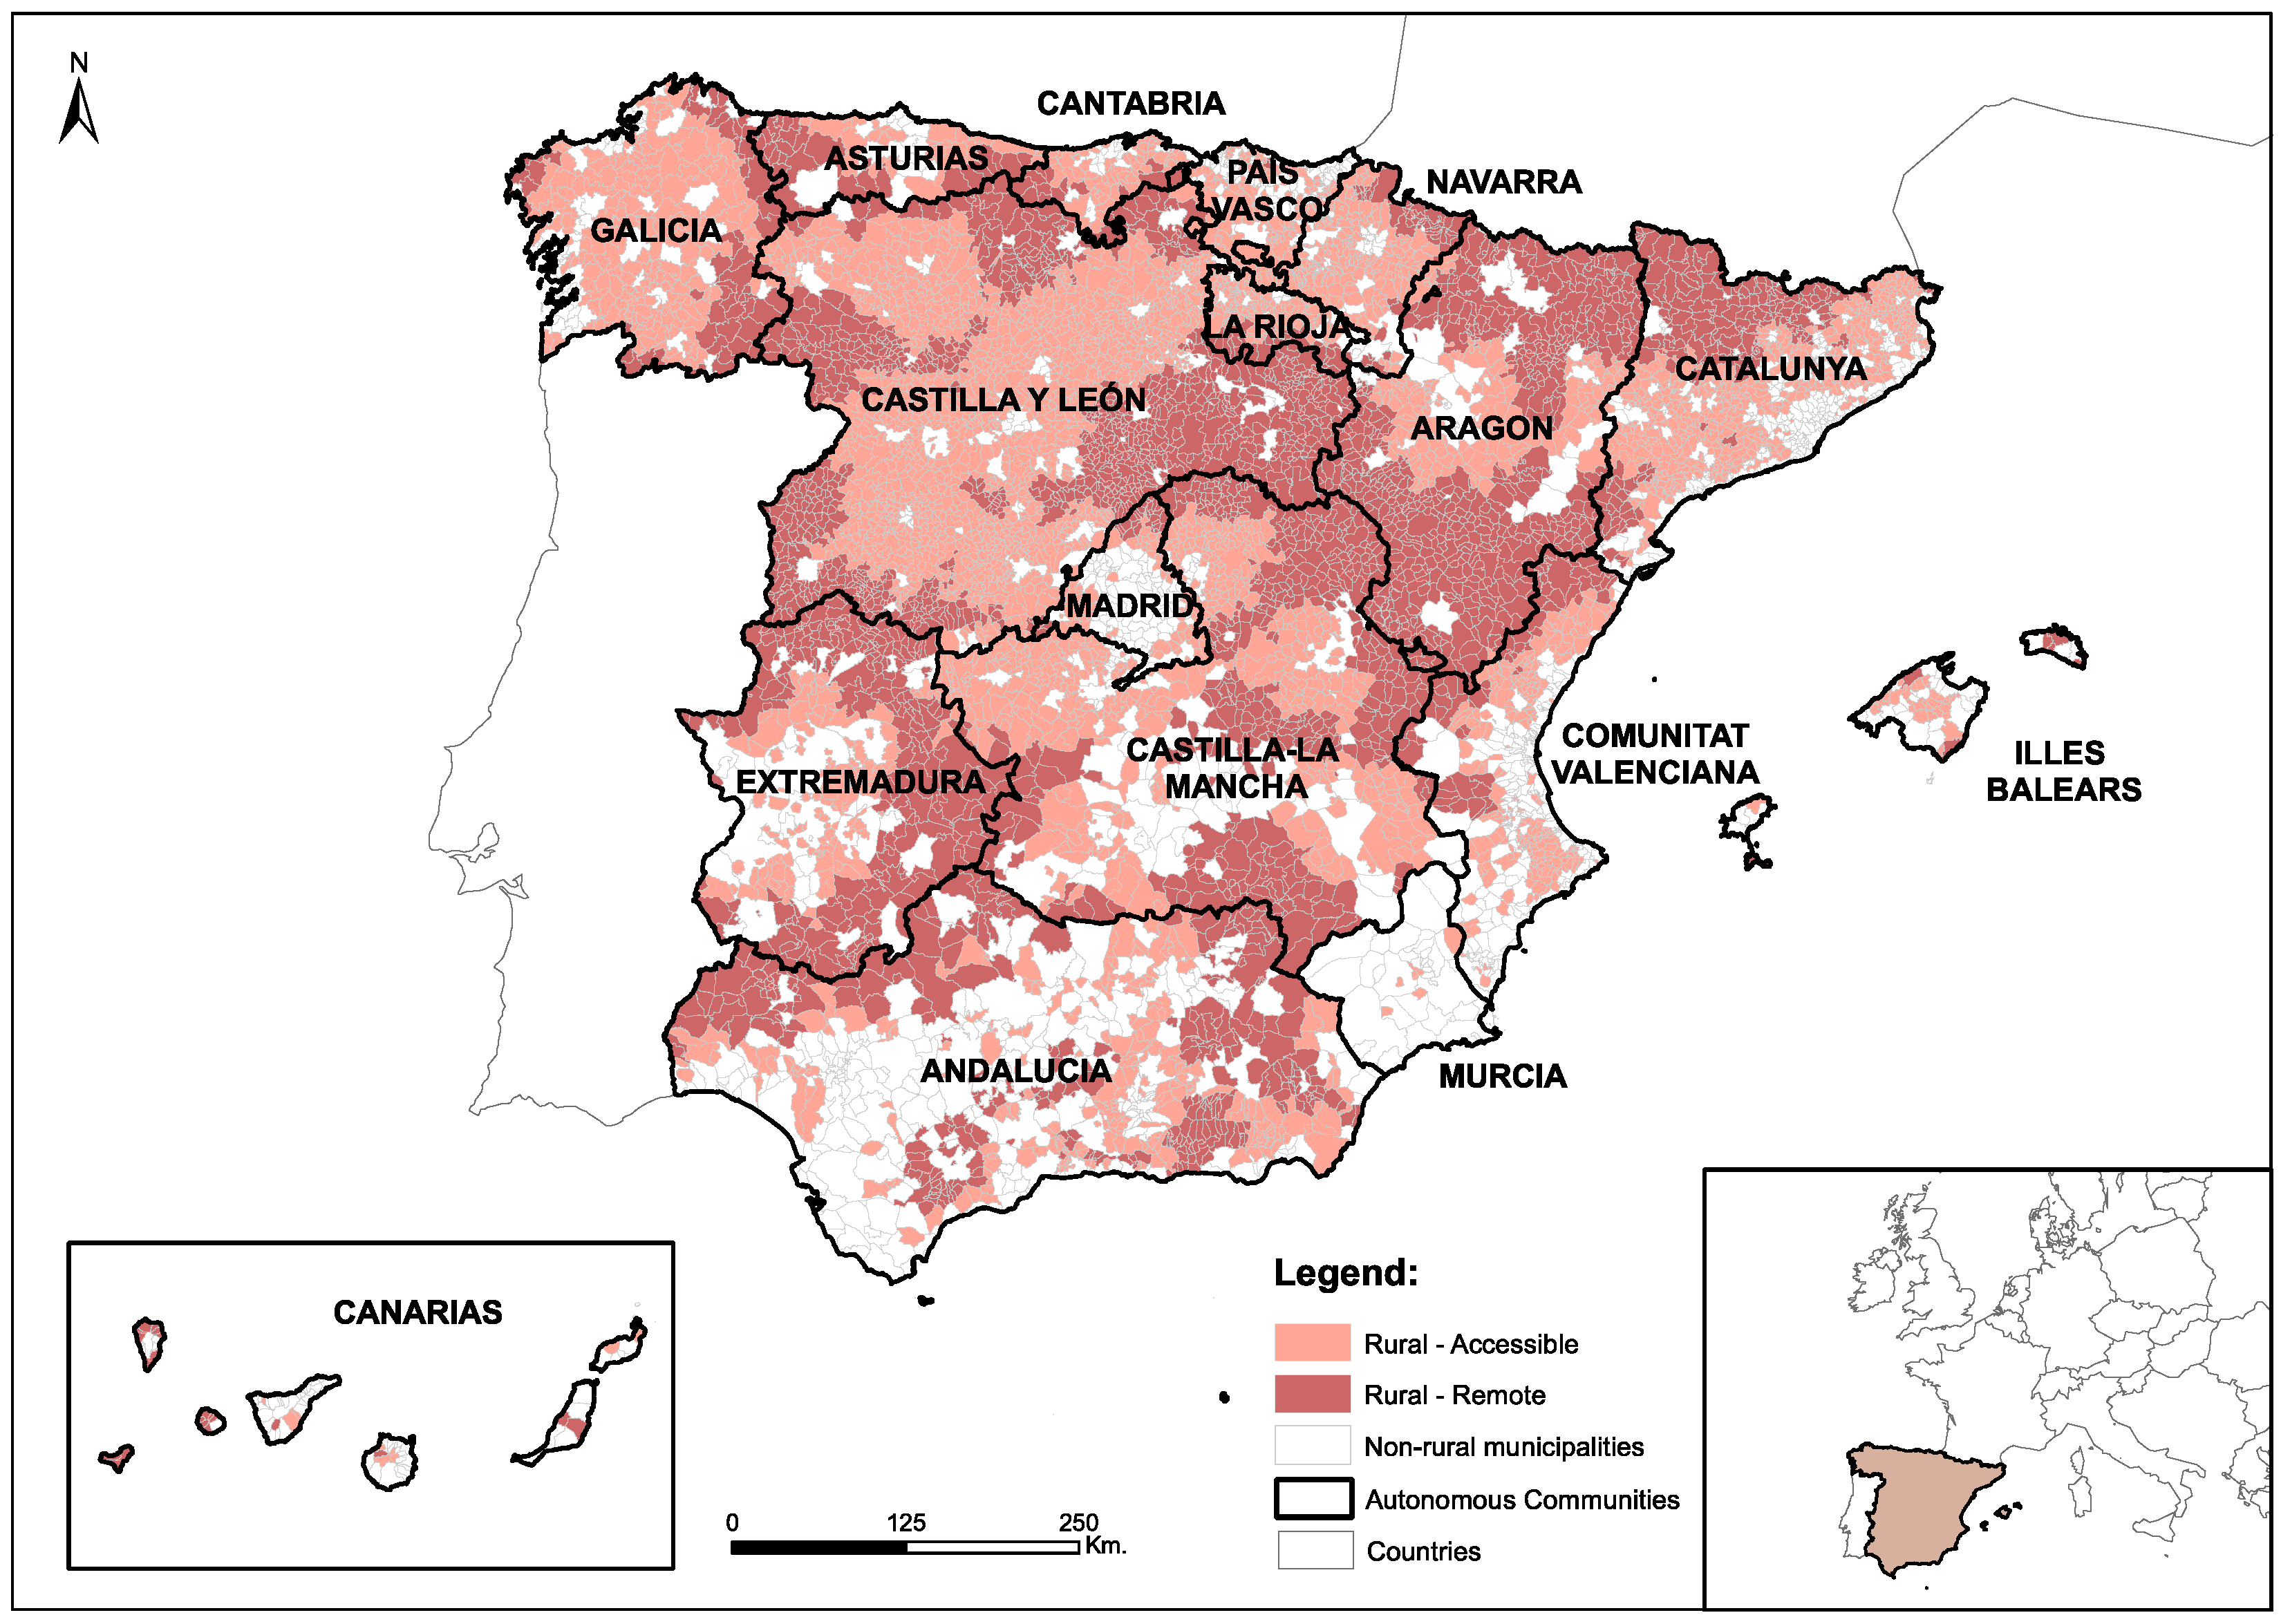
In the Spanish context, municipalities classified as rural occupy 84% of the surface area of Spain and account for 82% of the total number of municipalities in Spain (Figure 2) [40]. Consequently, areas delimited as intermediate and urban (non-rural areas) occupy 16% of the Spanish territory and account for 18% of the municipalities. The classification of municipalities by Goerlich [40] is based on demographic, land occupation, and accessibility criteria, which allows differentiating municipalities into the following: remote rural, accessible rural, open intermediate, closed intermediate, open urban, and closed urban. The classification of an urban, intermediate, or rural municipality is determined by a population grid with a cell size of 1 km2 and where three concepts are used [40]:
- Rural population cells: cells located outside urban agglomerations.
- Urban clusters: agglomerations of contiguous cells with a minimum density of 300 inhabitants/km2 and a minimum population of 5000.
- Urban centers: agglomerations of contiguous cells with a minimum density of 1500 inhabitants/km2 and a minimum population of 50,000 inhabitants.
In addition, the consideration of whether it is an open or closed municipality depends on the extent of the areas that are natural or artificial. Whereas the consideration of an accessible or remote municipality will vary according to the proximity in minutes to a city. In this research, we will focus exclusively on those municipalities classified as remote rural and accessible rural:
- Rural—accessible: those municipalities that are demographically rural and can access the services associated with a city within a reasonable time if the travel time is less than forty-five minutes.
- Rural—remote: those municipalities that are demographically rural and where access to the services associated with a city involves a journey of more than forty-five minutes.
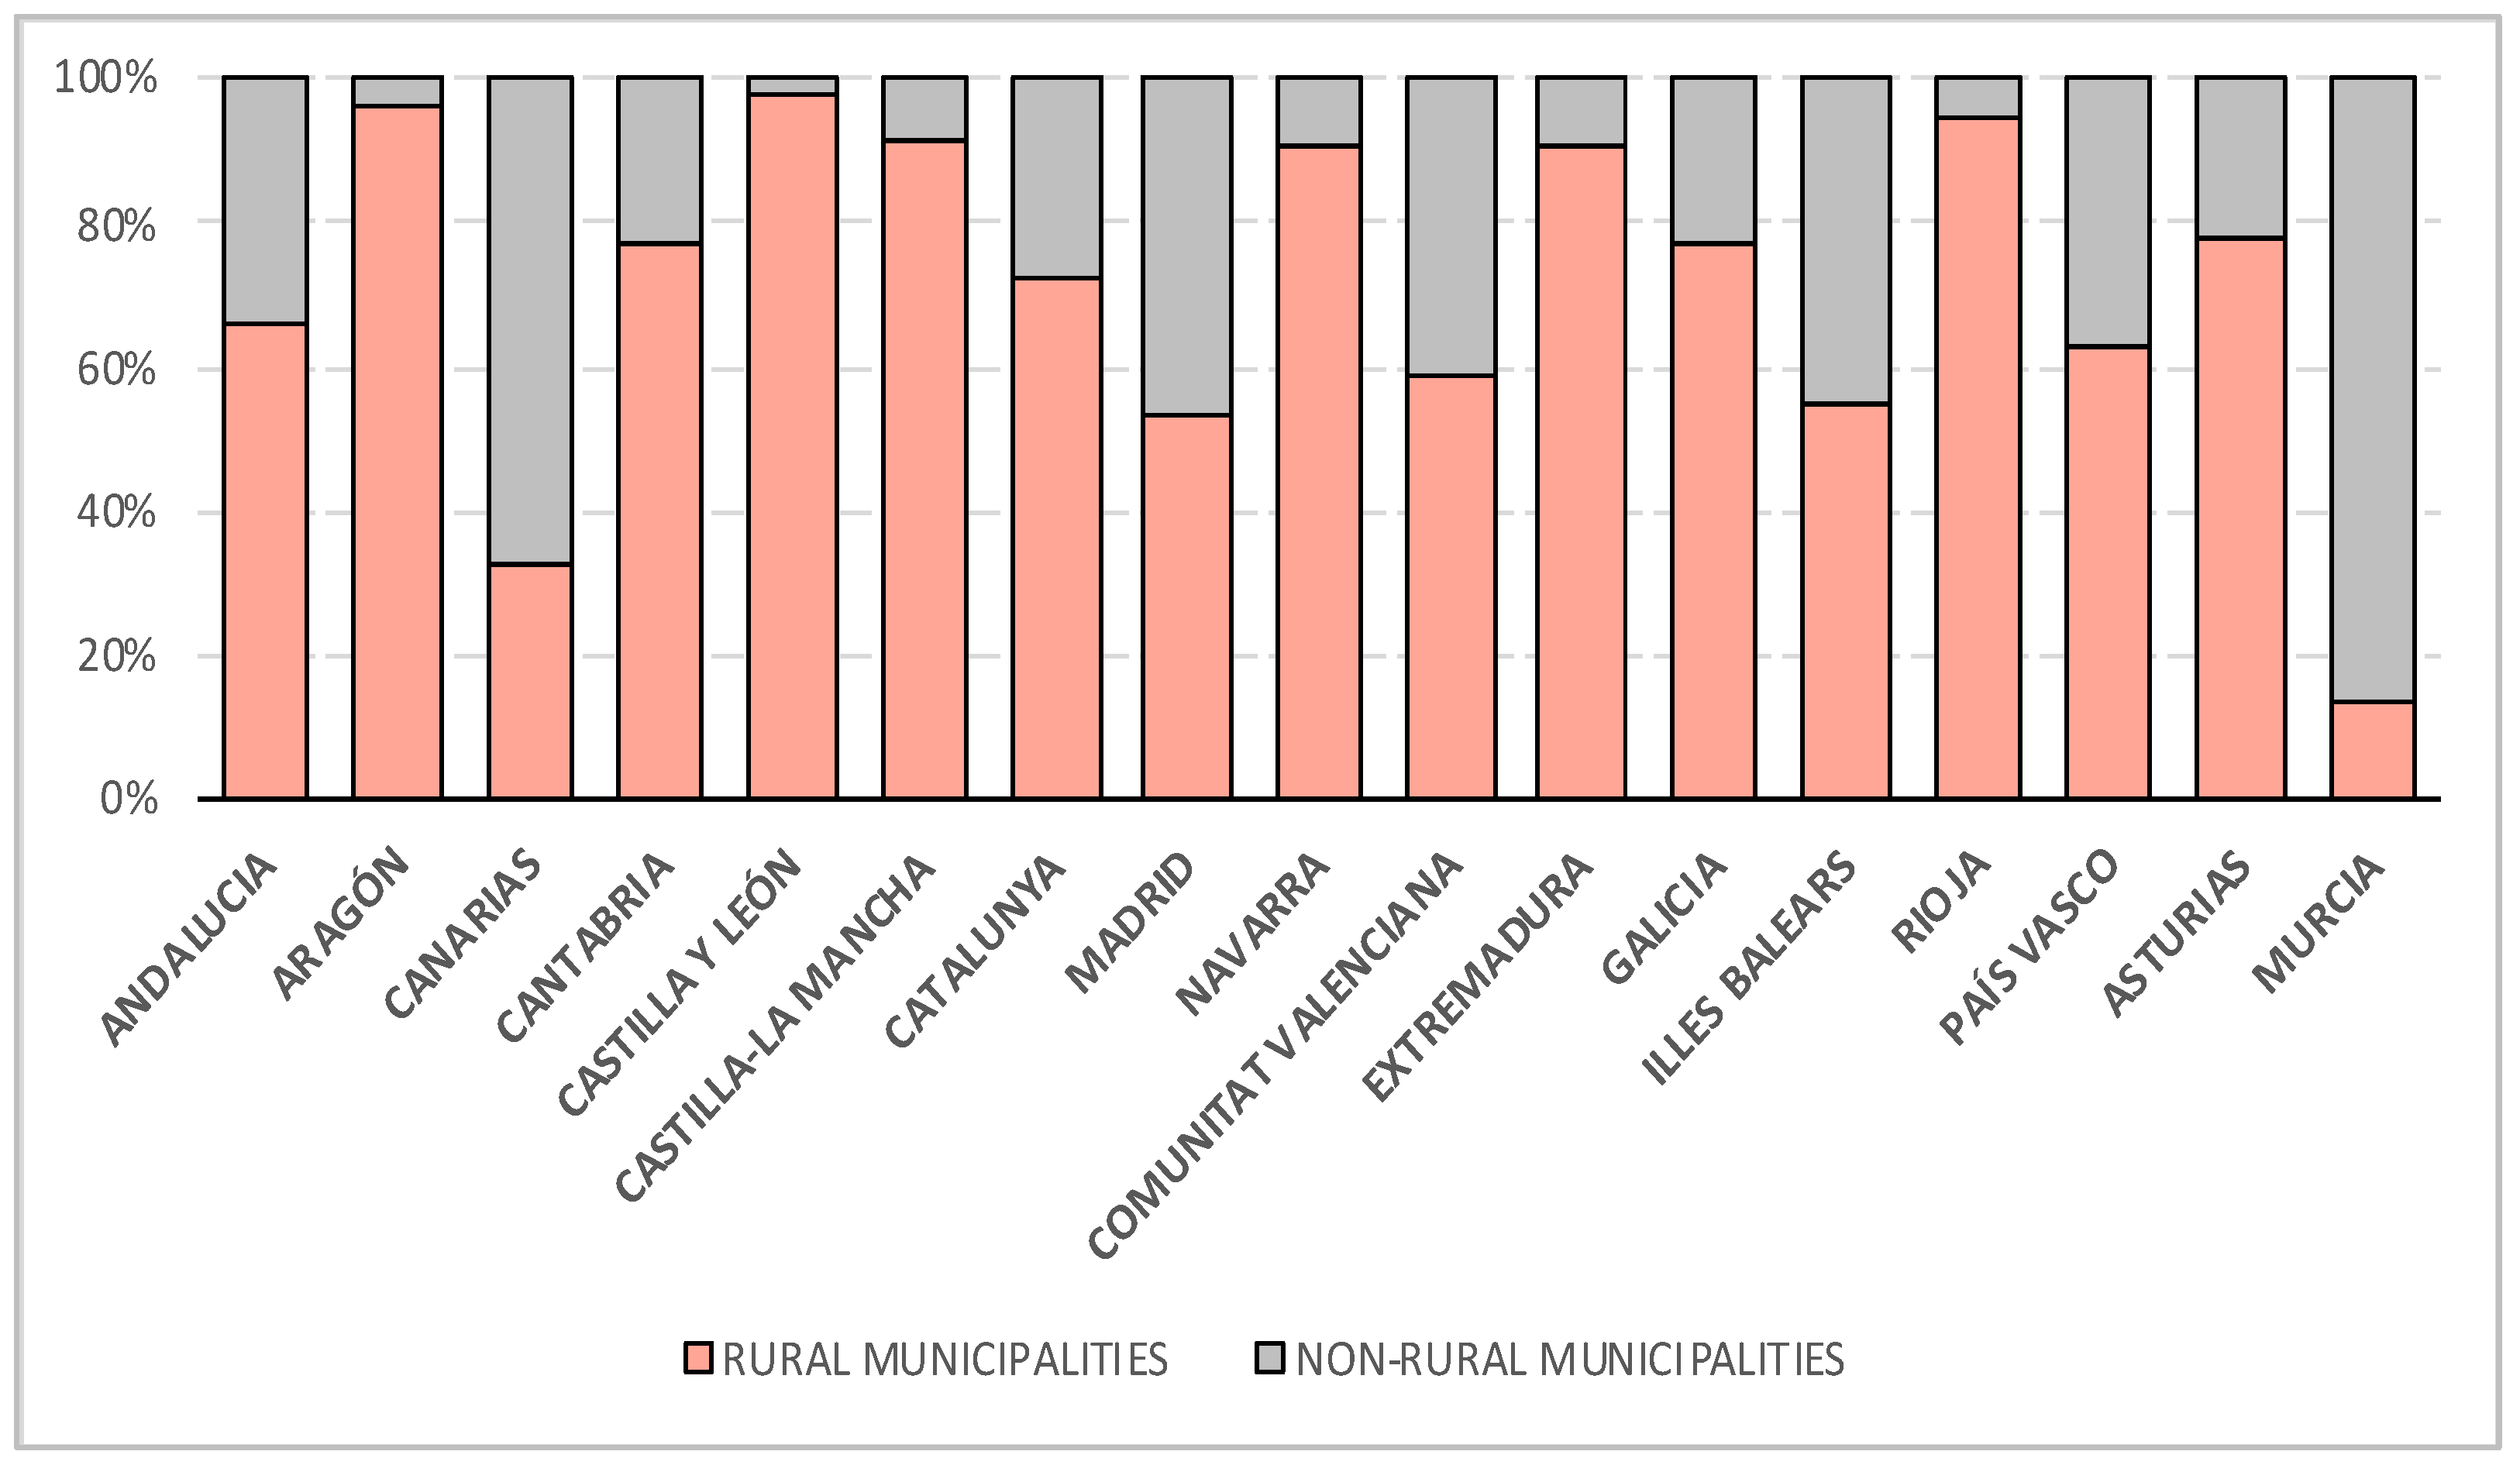
Although the average number of rural municipalities at the national level is 82%, there are differences in the number of municipalities classified as rural according to the autonomous communities (Figure 3). The autonomous regions of Castilla y León, Aragón, La Rioja, Castilla-La Mancha, Navarra, and Extremadura have more than 90% of their territory classified as rural. The autonomous regions of Andalusia, Cantabria, Catalonia, Galicia, País Vasco, and Asturias fall in a range between 60 and 80%. Finally, the autonomous regions with the fewest rural municipalities are Comunitat Valenciana, Madrid, Illes Balears, Islas Canarias, and Murcia, with the latter having less than 20% of municipalities.
Another relevant aspect, in addition to the territorial distribution of rurality, is the concentration of the Spanish population in these municipalities. At the national level, Spain has a population of 47,435,597 inhabitants [37], of which just over 7.5 million reside in rural municipalities, which represents almost 16% of the total Spanish population, and the average density of these municipalities is 17.8 inhabitants per square kilometre [41]. Demographic analysis with a historical perspective based on censuses [38] shows how the Spanish population has grown from 1900 to the present day, but not homogeneously in all municipalities. Rural municipalities have lost nearly 3 million inhabitants, from 10 million to just over 7 million. This means that the relative weight of their population has gone from almost 50 to 16%. On the other hand, the intermediate and urban municipalities, which had 5 million inhabitants each, now account for more than 35 million inhabitants in the urban municipalities and more than 15 million in the intermediate municipalities.
In the distribution of the population according to the typology of municipalities (Figure 4), differentiating between rural and non-rural municipalities, it can be seen that the majority of the population living in each of the autonomous regions is mainly urban, despite the fact that these were the minority areas. There are differences between ARGRs; for example, Madrid is the only one where the population living in a municipality classified as rural is in the majority (over 60%), because more and more of the population lives in municipalities close to Madrid that are classified as rural, representing the expansion of the metropolitan area. However, the rest have rural population ranges that vary between 10% and almost 40%. Within this range, the cases of Aragon, Castilla-Leon, or La Rioja are noteworthy, where the territory classified as rural occupies more than 90% of the surface area, but where the population living in these areas is 20%, 38%, and 23%, respectively.
These territorial imbalances and the population imbalance between rural and urban municipalities in Spain pose problems of territorial articulation at different scales from the national, regional, and provincial levels [36]. This context causes the perpetuation of a vicious circle of decline in rural areas [42,43], which is difficult to solve owing to the lack of population, which negatively feeds back into the rest of the actions and services. For this reason, the changes in trends that have occurred since the pandemic can be revulsive for Spanish rural areas and it is important to analyse them.
3. Results
In this section, we will address whether Spanish rural areas have undergone significant demographic changes as a consequence of the COVID-19 pandemic. Firstly, we will carry out a general analysis of the effect of COVID-19 on rural and non-rural municipalities and study the differences between autonomous communities. Secondly, based on the analysis carried out in Section 3.1, we will study the possible relationship between the decline or gain in population in rural municipalities and its link with the pandemic. Thirdly, the effects of this population growth or decline on the main demographic indicators will be analysed.
3.1. Differential Territorial Effects of COVID-19: Infected and Deaths
Owing to the outbreak and spread of the SARS-CoV-2 virus, better known as COVID-19, across the planet, everyday human processes linked to free mobility were compromised and limited. In the case of Spain, the Spanish government decreed a state of alarm through Royal Decree 463/2020 of 14 March 2020. This approved key measures such as the confinement of the population and the paralysis of all non-essential activities [44]. COVID-19 is one of several black swans that society has had to deal with in recent decades [45]. A black swan can be defined as an event in society, to which society tries to find an explanation for what happened. However, this crisis can be understood as an opportunity to reverse the demographic drain suffered by the rural world [45], based on changes and innovative proposals, transformations, and consolidation of new ideas. COVID-19 entailed a transformation in people’s habits and actions that has had marked territorial implications, both from the point of view of the use and occupation of space, and in the intensity and form of displacement.
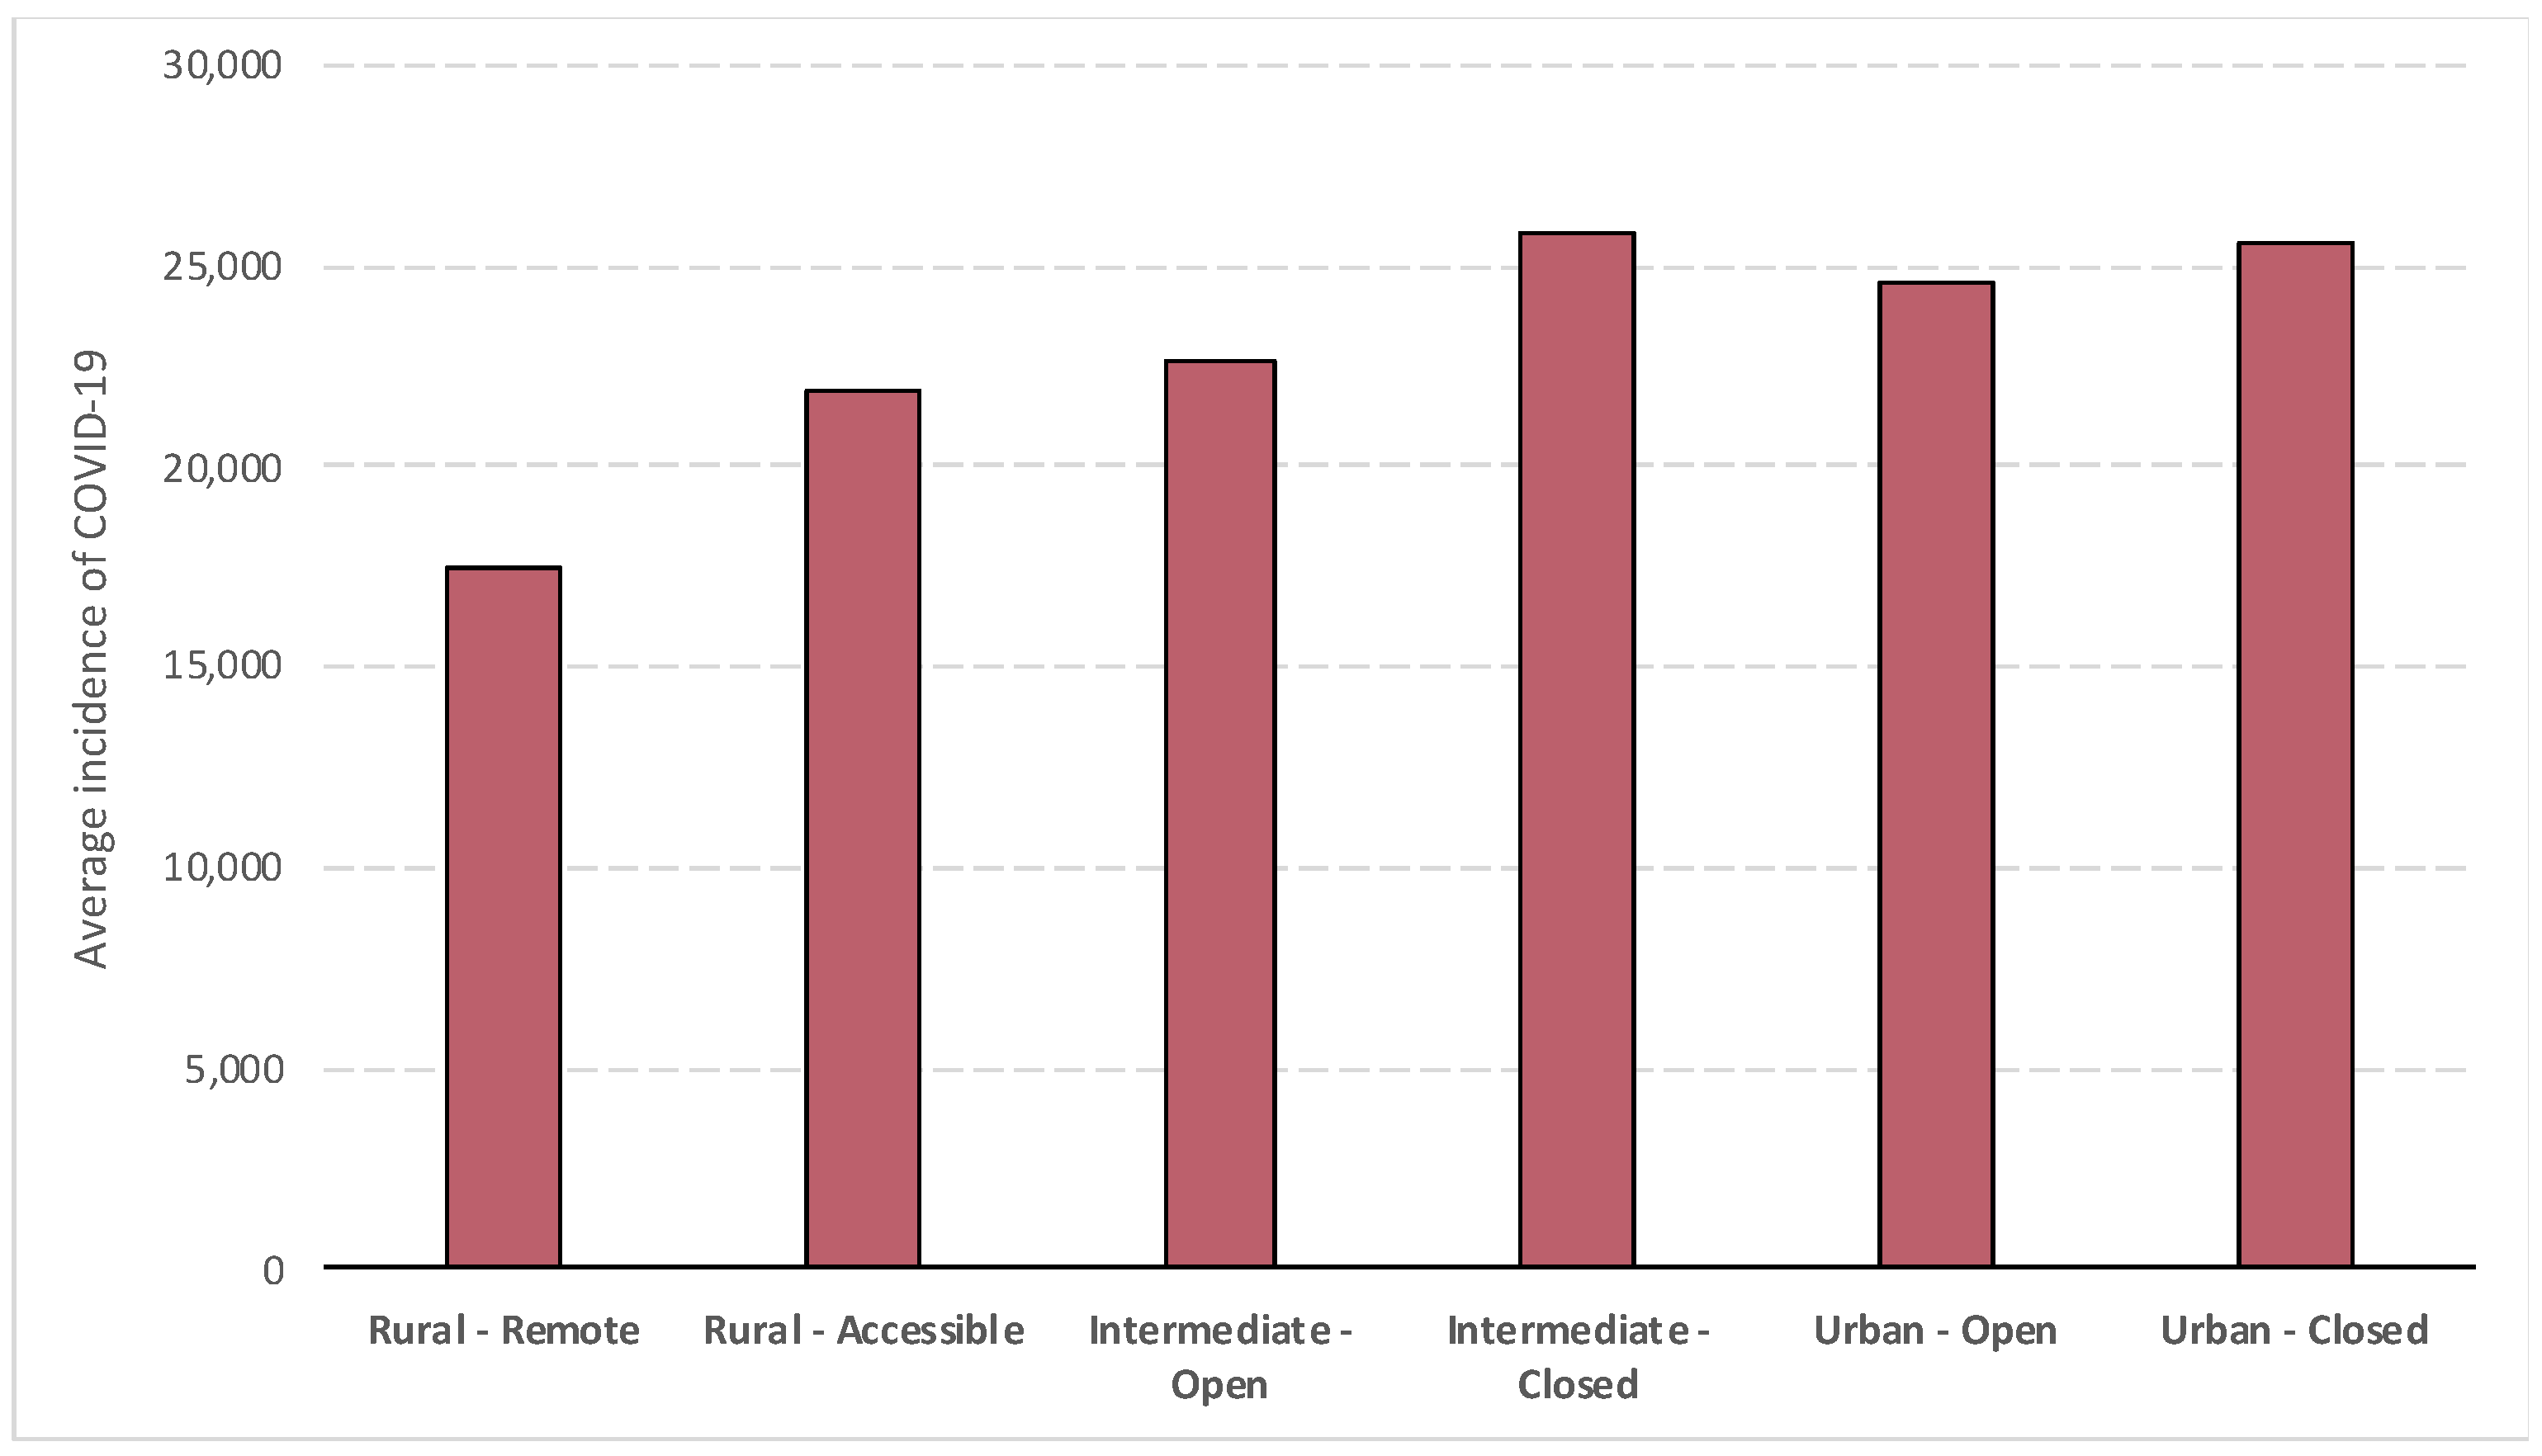
Figure 5 shows the average incidence of COVID-19 cases per 100,000 inhabitants for all municipalities and autonomous communities according to territorial typology [40]. It can be observed that the incidence of cases has been much lower in rural areas than in intermediate and urban areas. Moreover, remote rural areas have the lowest number of COVID-19 cases per 100,000 inhabitants, far behind accessible rural municipalities and, above all, intermediate and closed urban areas.
Moreover, this relationship between the incidence of COVID-19 and rural areas is statistically significant, as can be seen in Table 2. It shows the results obtained from the Student’s t-test after analysing the relationship between territorial typology (rural and non-rural municipalities) and the incidence of COVID-19 in each municipality. The t-test reflects a result of −12.248 and the bilateral significance analysis shows that there is statistical significance in the relationship between the two variables. In addition, Cohen’s D shows a mean relationship of the variables.
The same occurs in the statistical analysis between territorial typology (rural and non-rural) and COVID-19 deaths (Table 3). The Student’s t-test reflects a negative result of −14.486 and the bilateral significance analysis indicates that there is statistical significance in the relationship between the two variables. In addition, Cohen’s D shows a mean relationship of the variables.
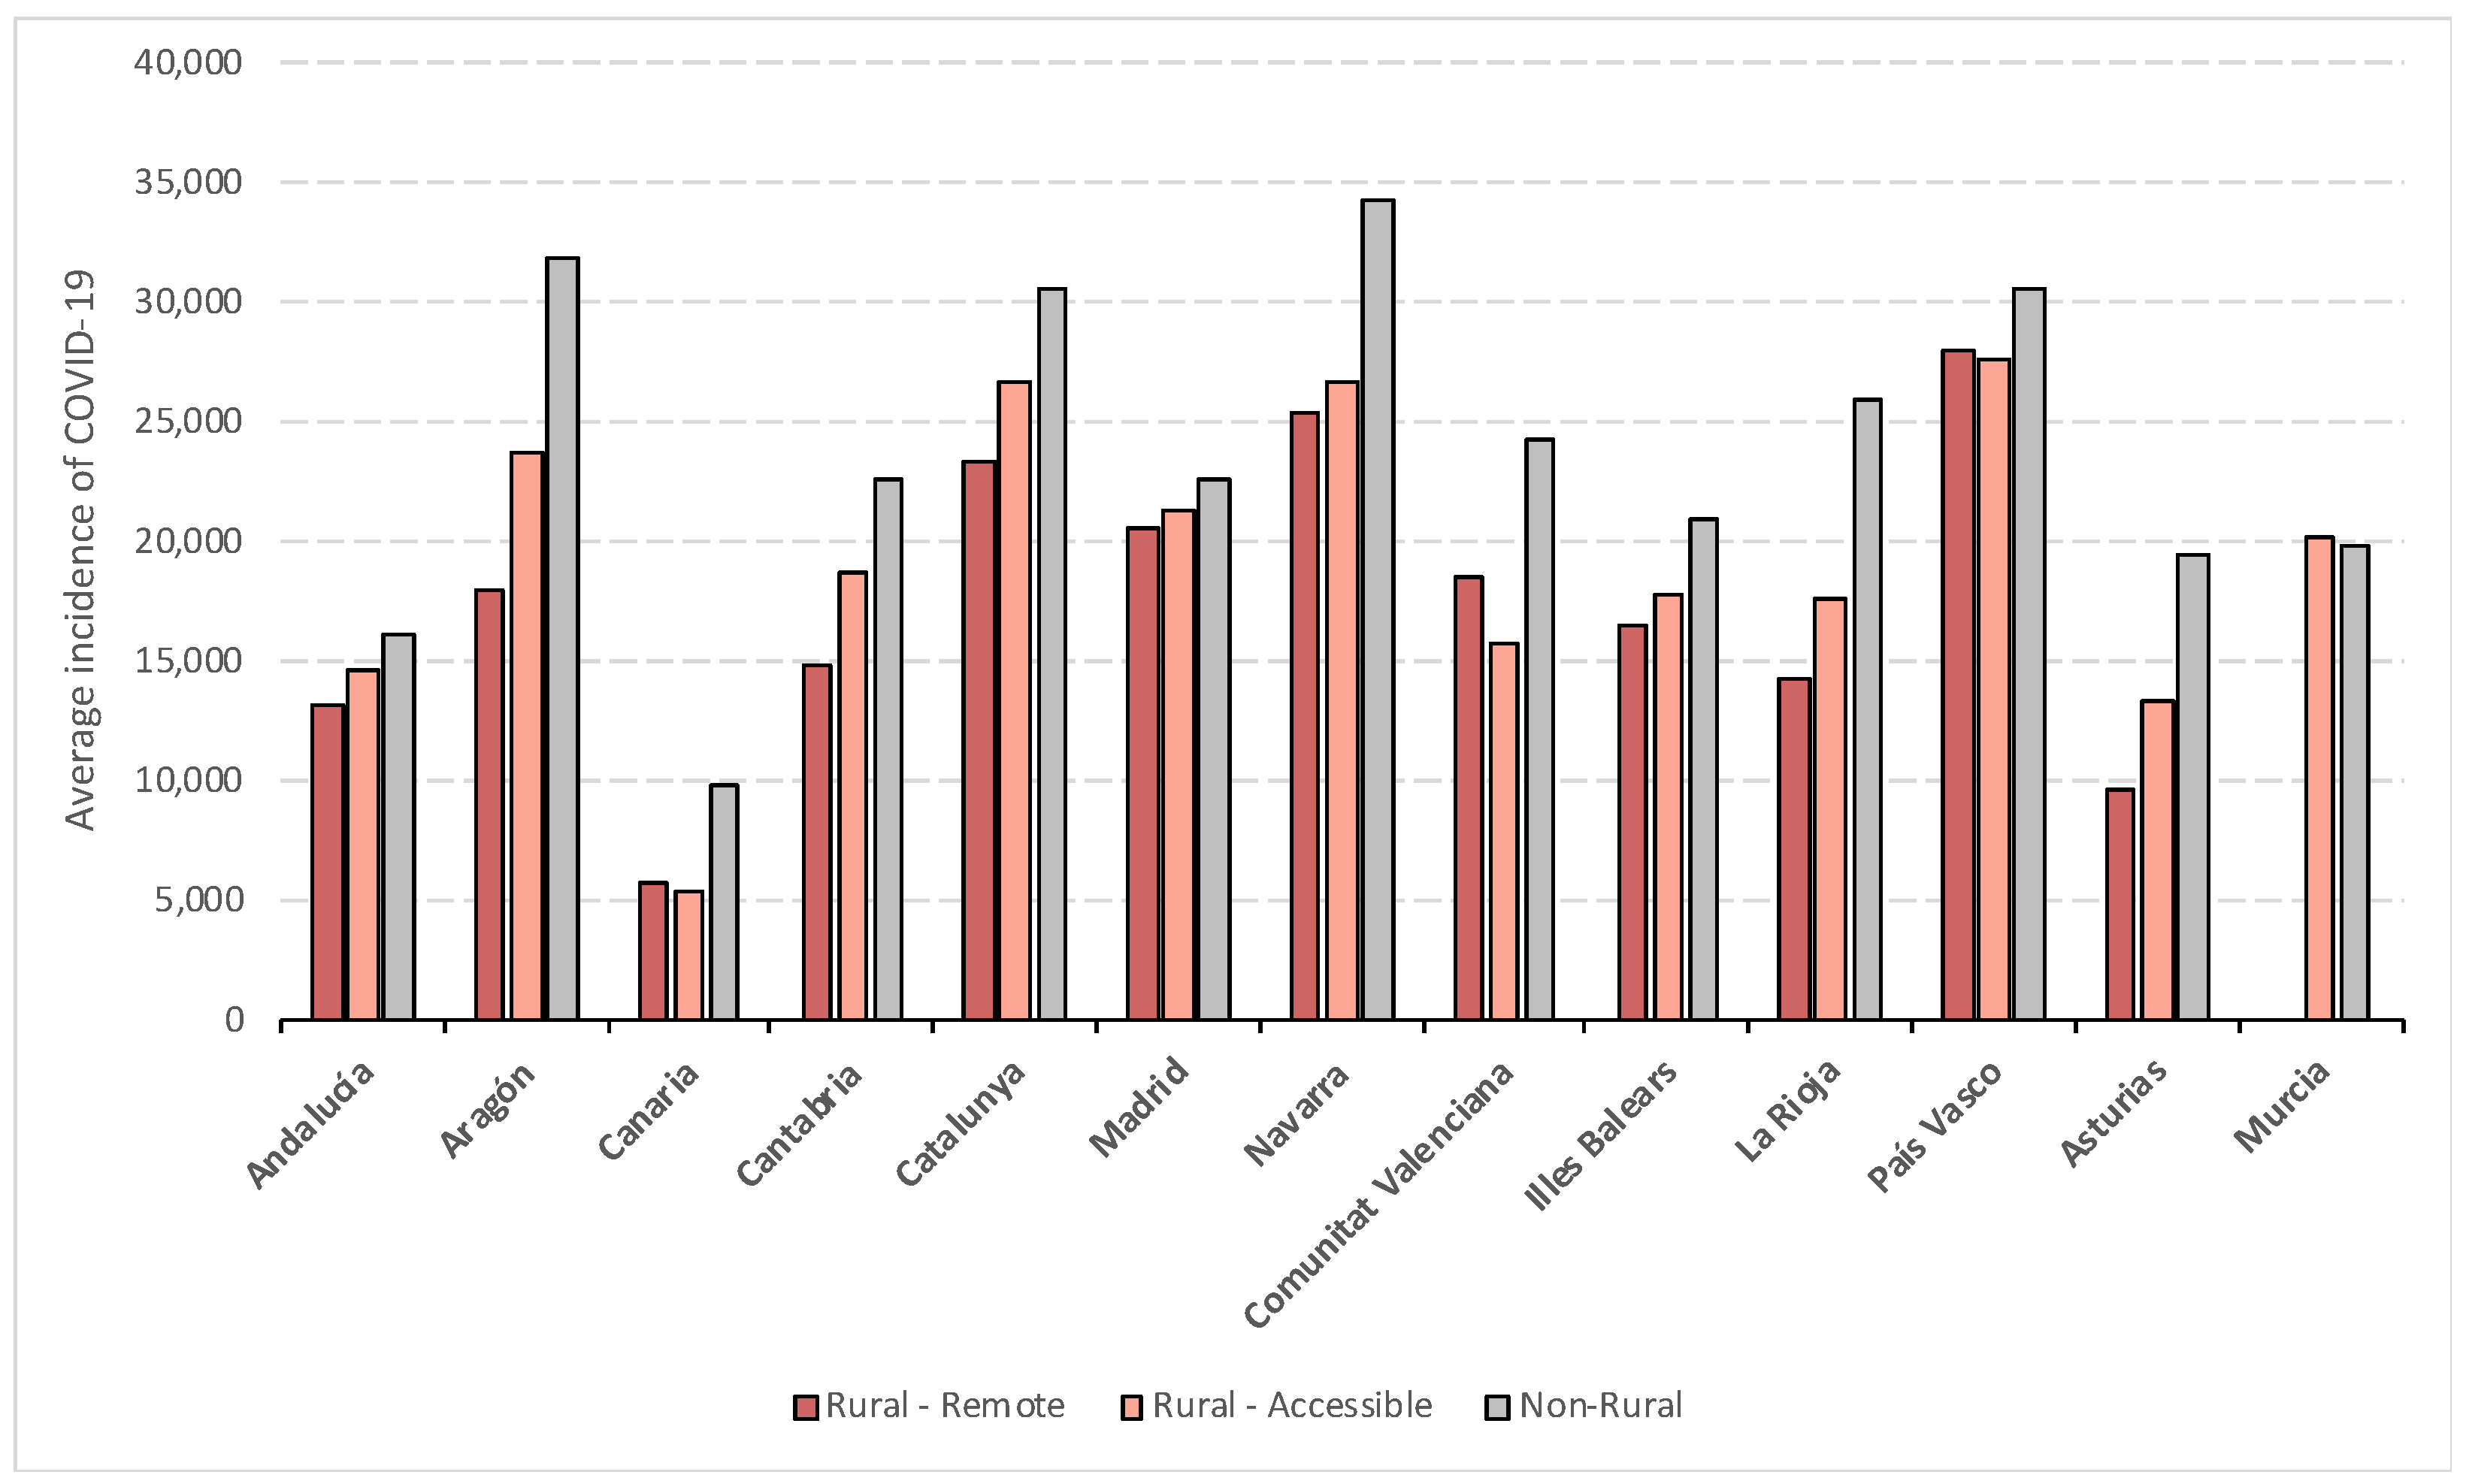
Figure 6 shows the average incidence of COVID-19 per 100,000 inhabitants in rural (remote and accessible) and non-rural (intermediate and urban) municipalities in the autonomous communities for which data are available. In all of them, except in La Rioja, the Islas Canarias, and Murcia, the incidence of COVID-19 was higher in non-rural areas. Moreover, the lower incidence recorded in remote rural areas is particularly noteworthy. Among the autonomous regions with the lowest incidence, the Islas Canarias and the Illes Balears stand out, a fact linked, among other reasons, to insularity factors. On the other hand, the areas with the highest incidence were Aragon, Cataluña, and Navarre.
3.2. Population Growth/Decline before and during COVID-19
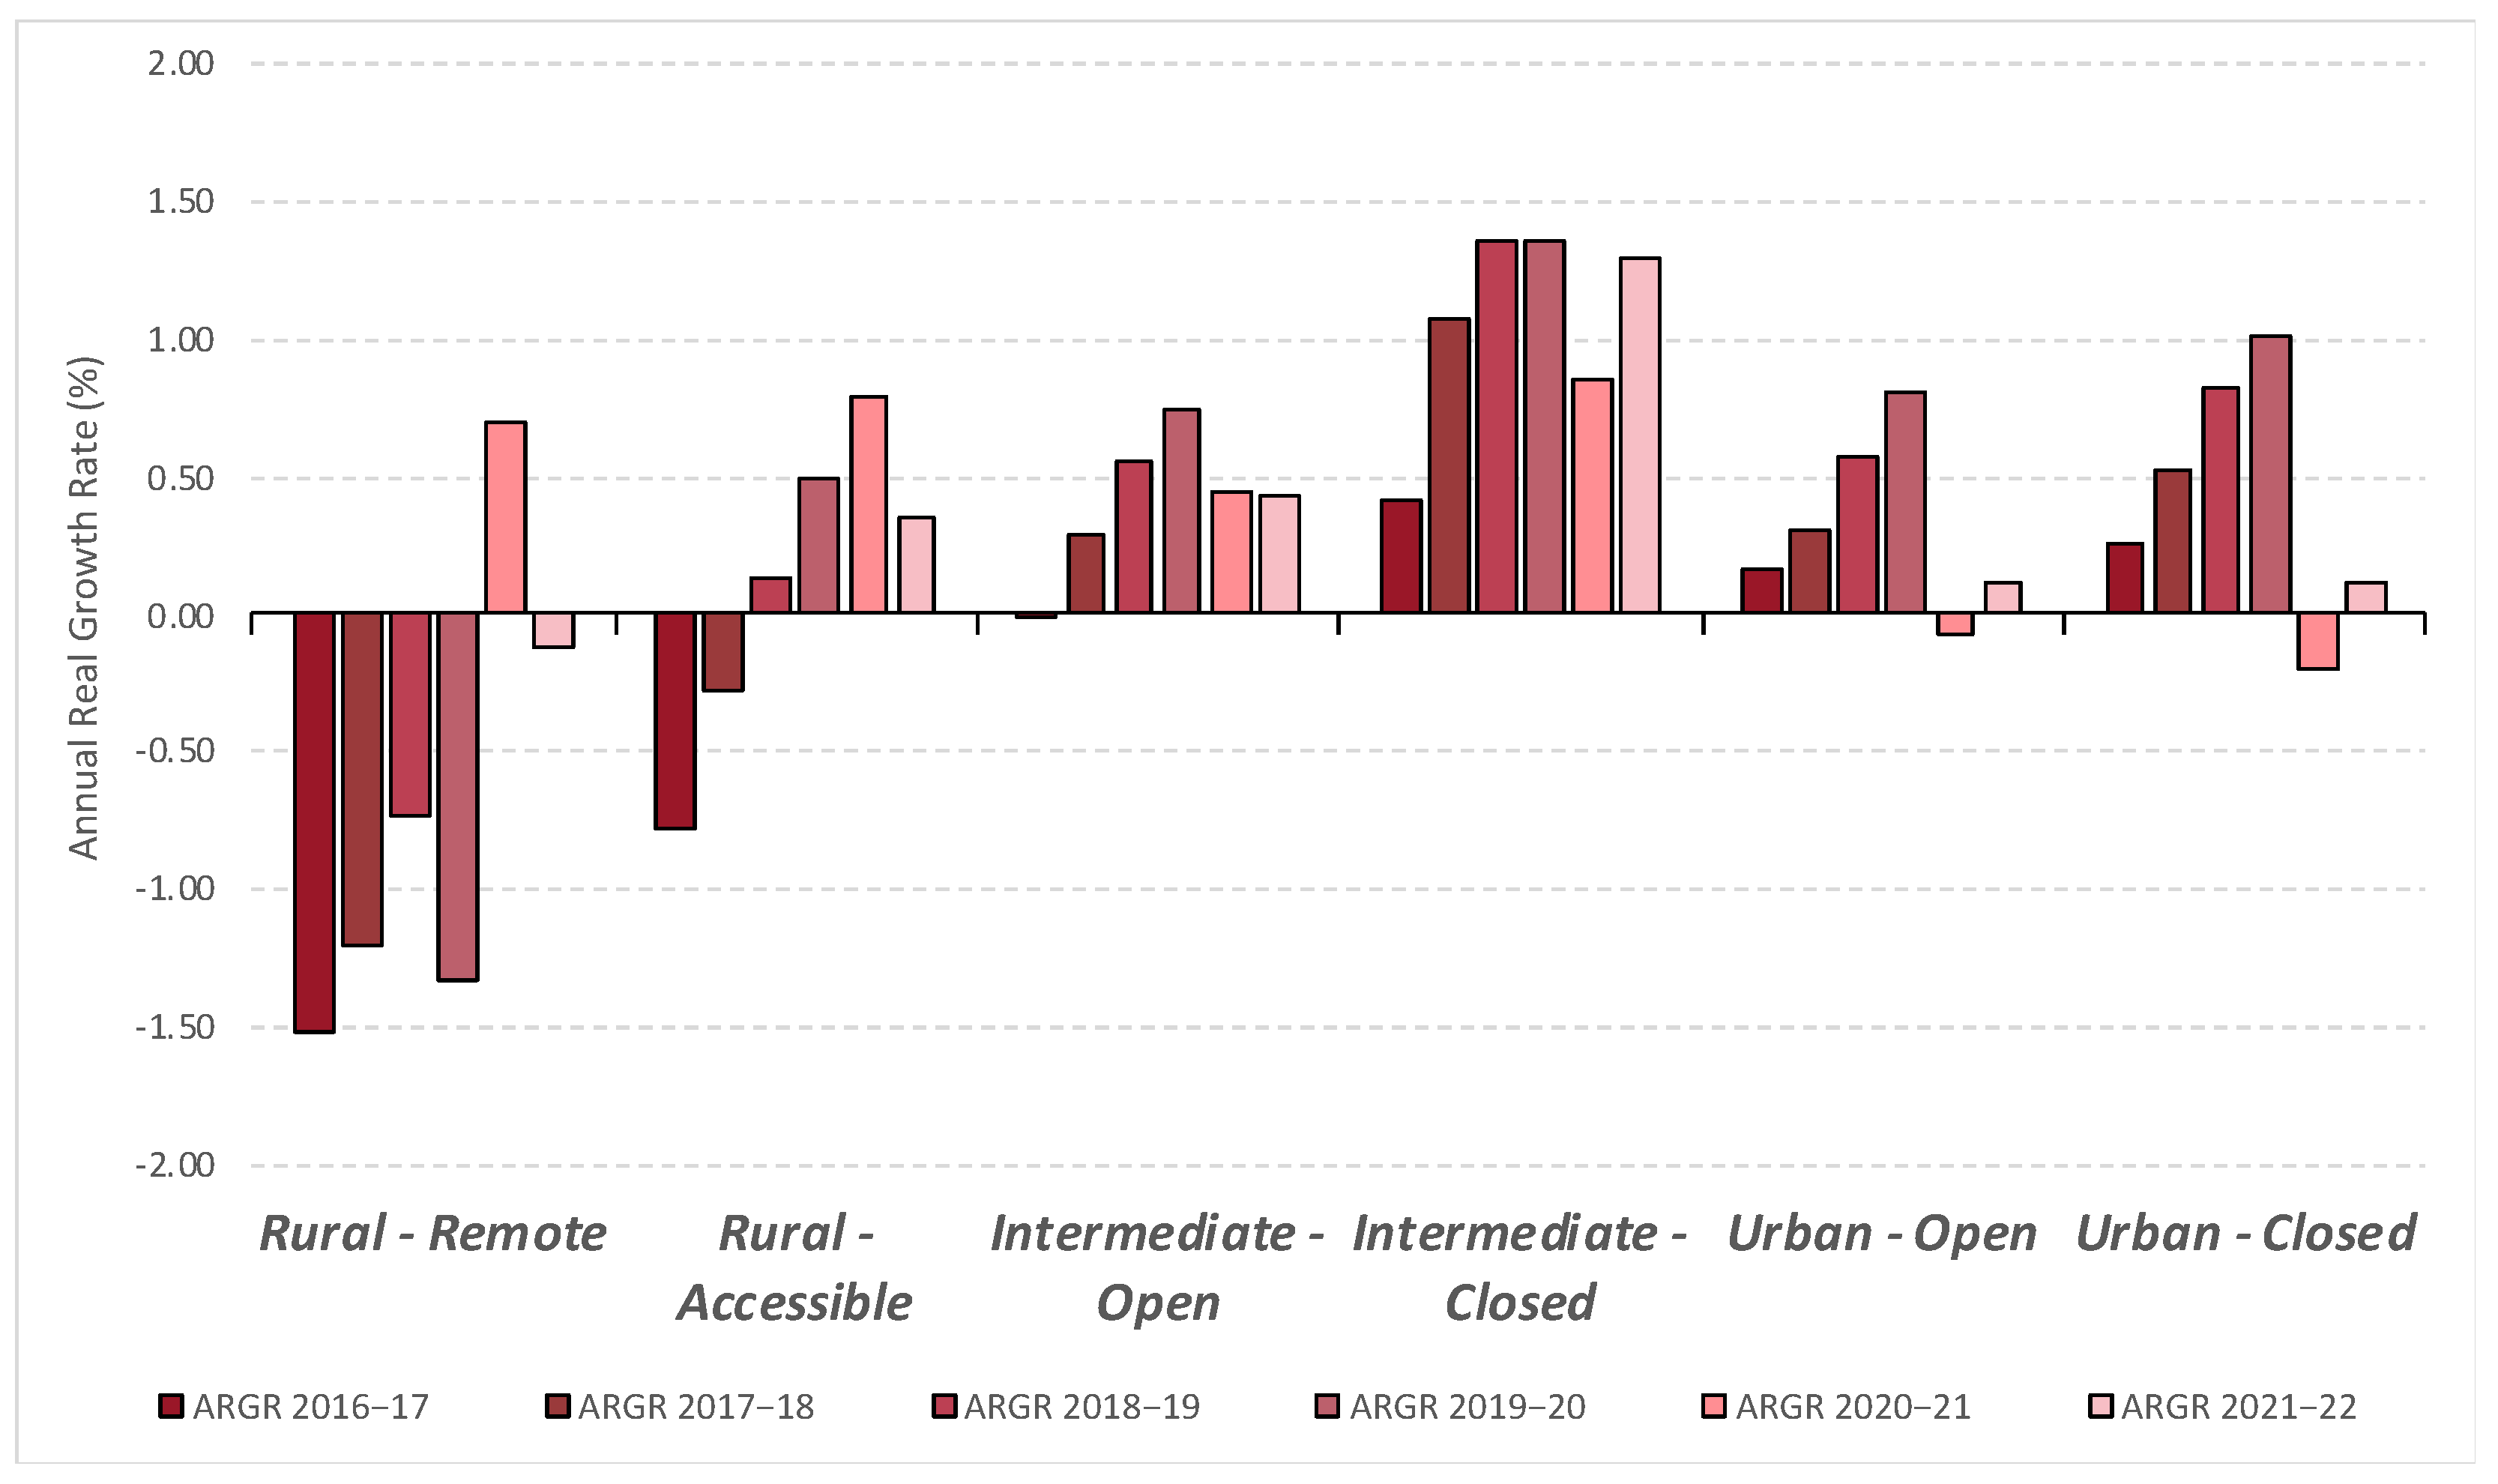
Having analysed the relationship between COVID-19 infections and deaths and the territory in which they are located, it is time to look at the population behaviour of the different areas. To do this, we have extracted the percentage of real annual population growth at municipal level from 2016–2017 to 2021–2022 according to the typology of municipalities (Figure 7). Two clear trends can be observed in this figure. On the one hand, non-rural areas (urban and intermediate) from 2016 to 2020 had a progressive increase in population, although from 2021 to 2022, growth has slowed drastically compared with previous periods. Even in urban areas, there has been a decrease in population between 2020 and 2021, although in the period 2021 to 2022, they have started to grow again, but at a much slower rate than in the pre-pandemic periods.
In the case of rural areas, they have behaved differently from the rest of the areas, with very small population losses or gains. It is thus necessary to differentiate the more accessible rural areas from remote rural areas (Figure 7). The accessible rural areas have had a continuous decline in population during the period 2010–2017, although from 2018 onwards, this trend has changed and they have obtained positive values of population growth. It should be noted that, in the years 2020 and 2021, this growth increased considerably, but in the period 2021–2022, this growth reduced to similar levels prior to COVID-19. In relation to the remote rural areas, these have a different behaviour to the accessible rural areas, as throughout the last decade, they have continued to experience population decline, although the percentage of loss has been reducing considerably, until 2021, which was the first year in which they gained in population. However, in the period 2021–2022, their population declined again, but very little compared with the scenario prior to 2019.
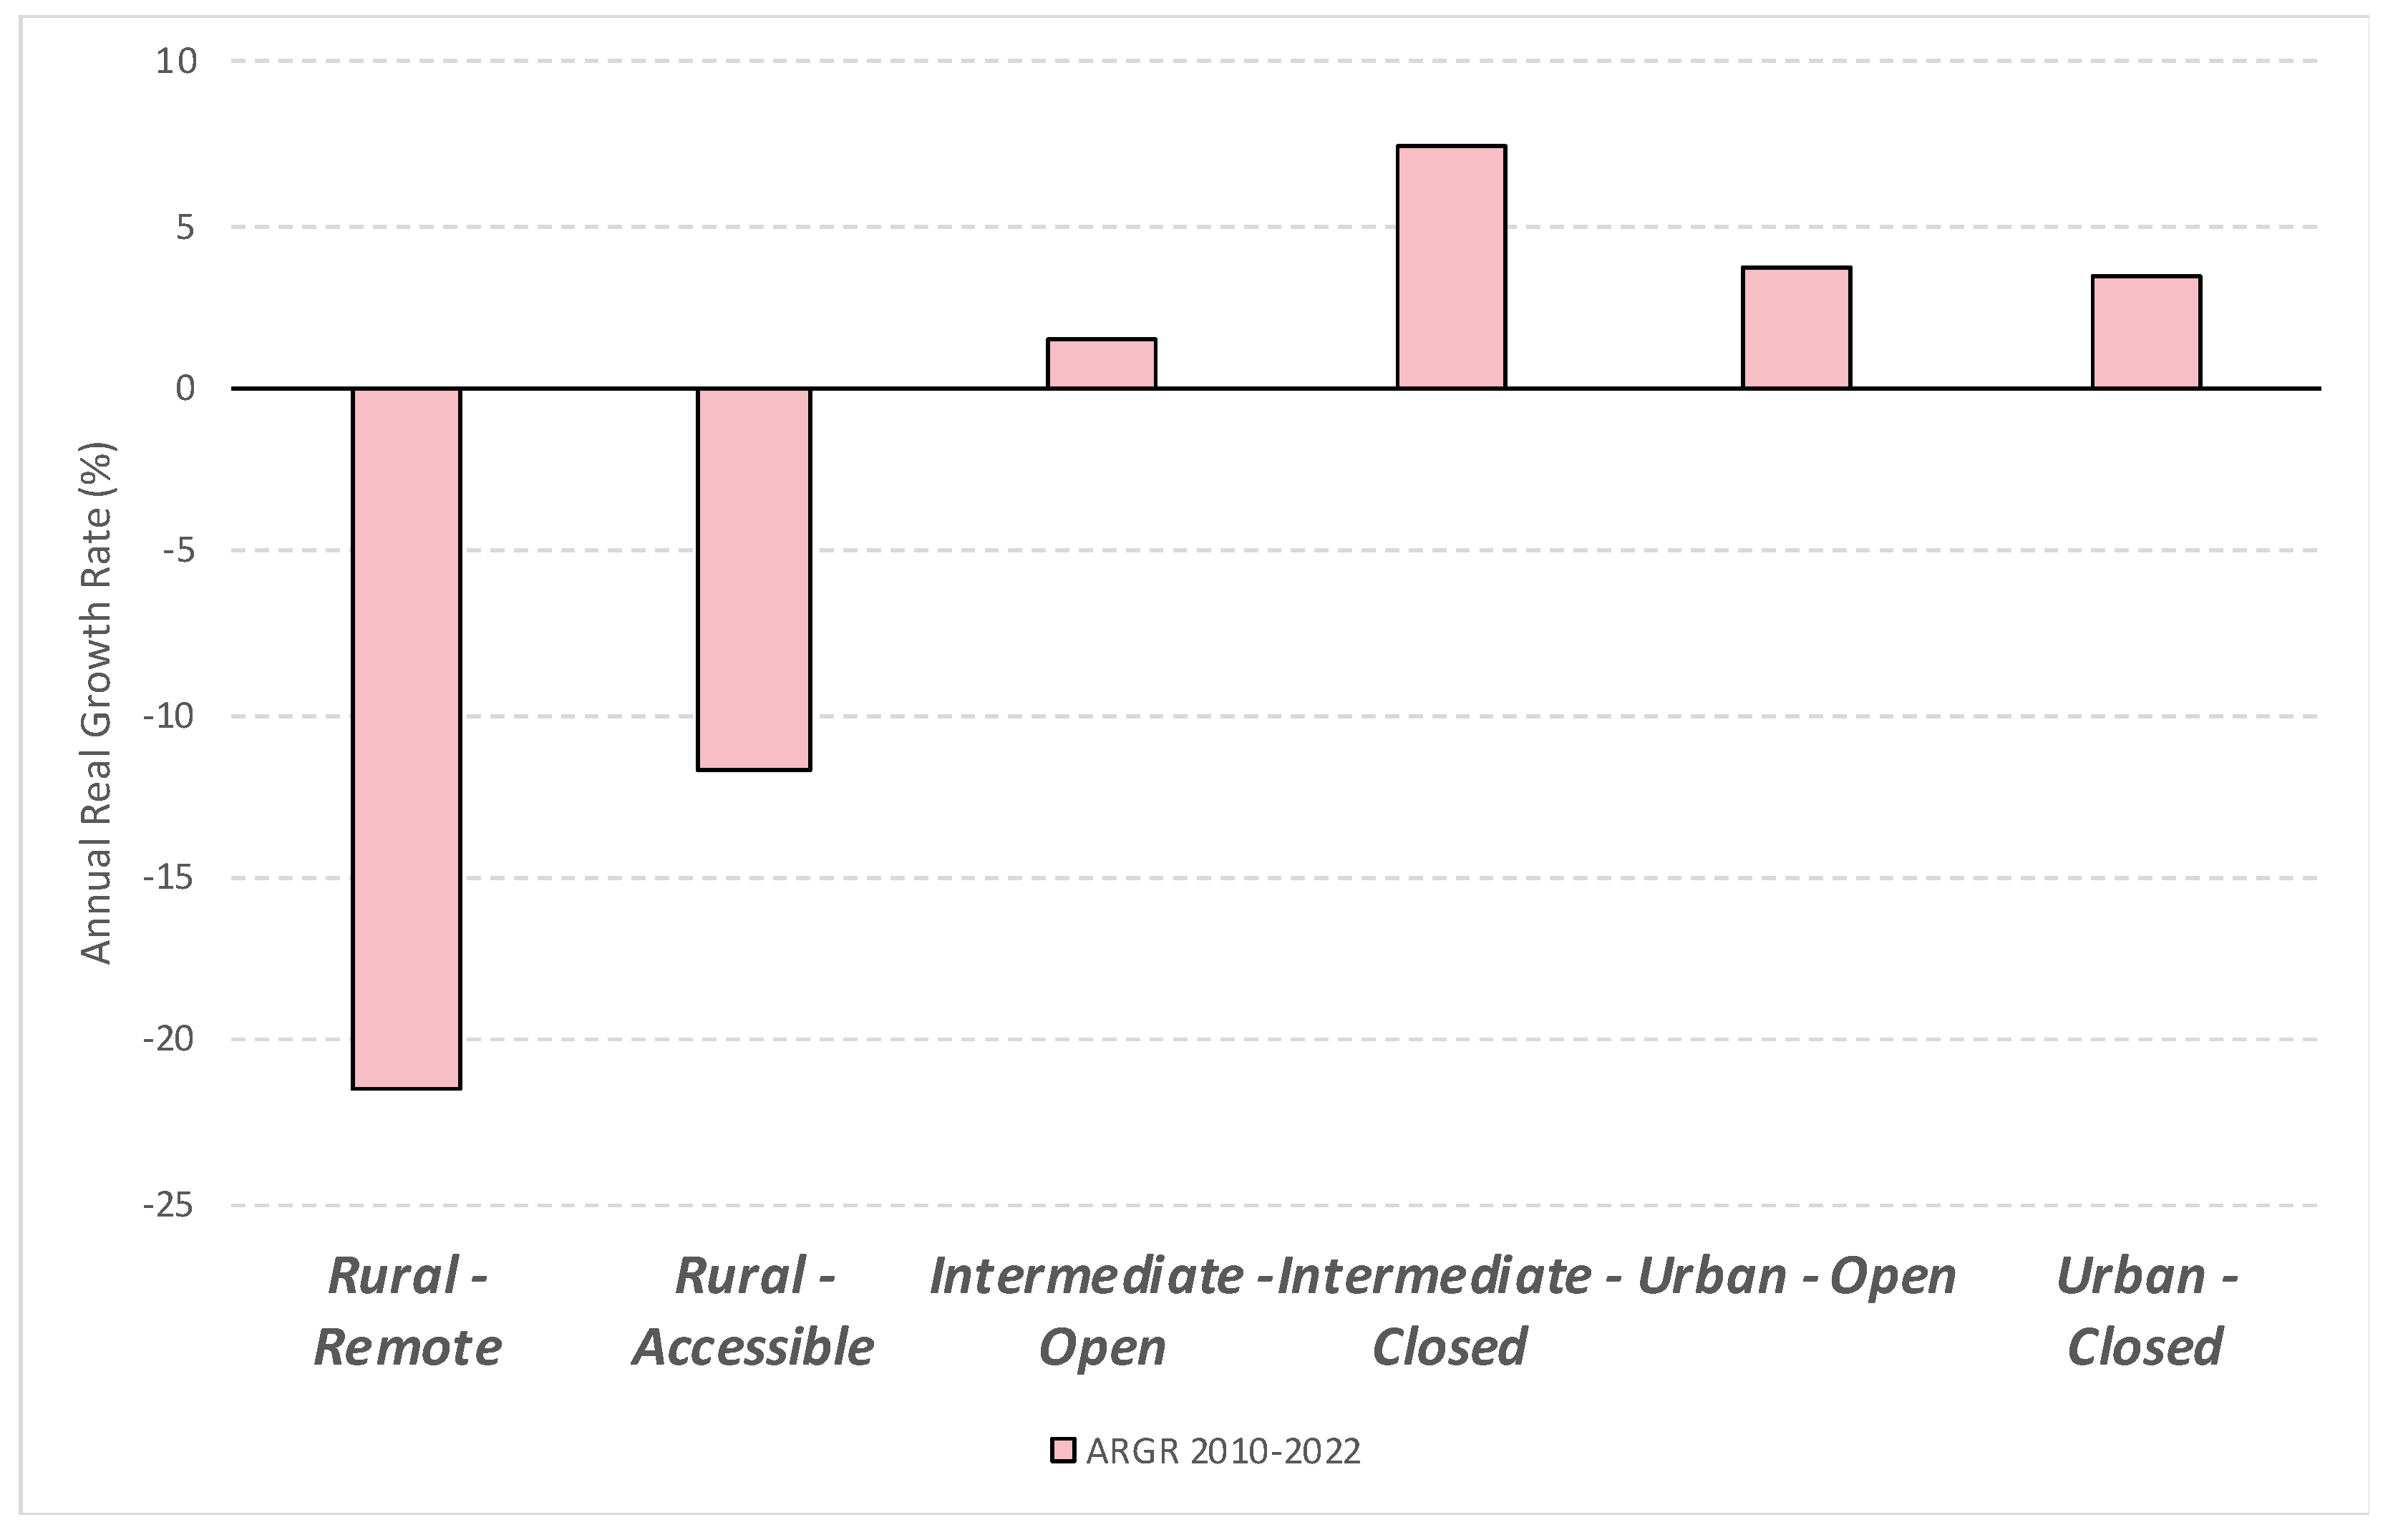
Furthermore, it is important to know the population behaviour over the last decade of the Spanish areas according to their typology. Figure 8 shows the real annual growth between 2010 and 2022. It shows how rural areas (remote and accessible) have experienced population losses of between 10 and 23 percentage points, despite the positive data shown in Figure 3 between 2020 and 2022. The other areas, intermediate and urban, show a positive trend over the decade, with the closed intermediate areas (closer to urban areas) standing out. The urban areas have hardly experienced any change in growth because of the population decline between 2020 and 2021 and lower growth between 2021 and 2022.
In order to check whether these increases and/or decreases in population, depending on the type of municipality, are statistically significant, a Student’s t statistical calculation was performed. For this purpose, a quantitative variable (real annual growth between 2021 and 2022) and a nominal variable (municipality typology) were used, which was simplified for the statistical analysis, considering the municipalities as rural and non-rural (intermediate and urban).
Table 4 studies the statistical relationship between annual real growth (2020–2022) according to the typology of the territory, being statistically significant. Levene’s test shows that there are differences between the variances. The Student’s t-test gives a result of 5.194 and the bilateral significance analysis shows that there is statistical significance in the relationship between the two variables. In addition, Cohen’s D shows a low relationship between the variables.
However, looking at real annual growth between 2010 and 2022, a different trend to that shown in the previous analysis is observed (Table 5). The Student’s t-test gives a result of −30.81 and the bilateral significance analysis shows that there is statistical significance in the relationship between the two variables. In addition, Cohen’s D shows a low relationship between the variables.
The process of population decline between 2010 and 2022 and the population gain or lesser loss between 2020 and 2022 in rural areas show large differences when analysed by region. For this purpose, three periods were selected. First, a pre-pandemic period between 2018 and 2020. Second, a pandemic and post-confinement period between 2020 and 2022. Thirdly, the trend of the last decade between 2010 and 2022. In this way, it is possible to analyse in greater detail whether there has been a significant change in the behaviour of the population settlement linked to COVID-19 and, to synthesise the analysis, we only show how this occurs in the rural areas of the different ARGR (both remote and accessible).
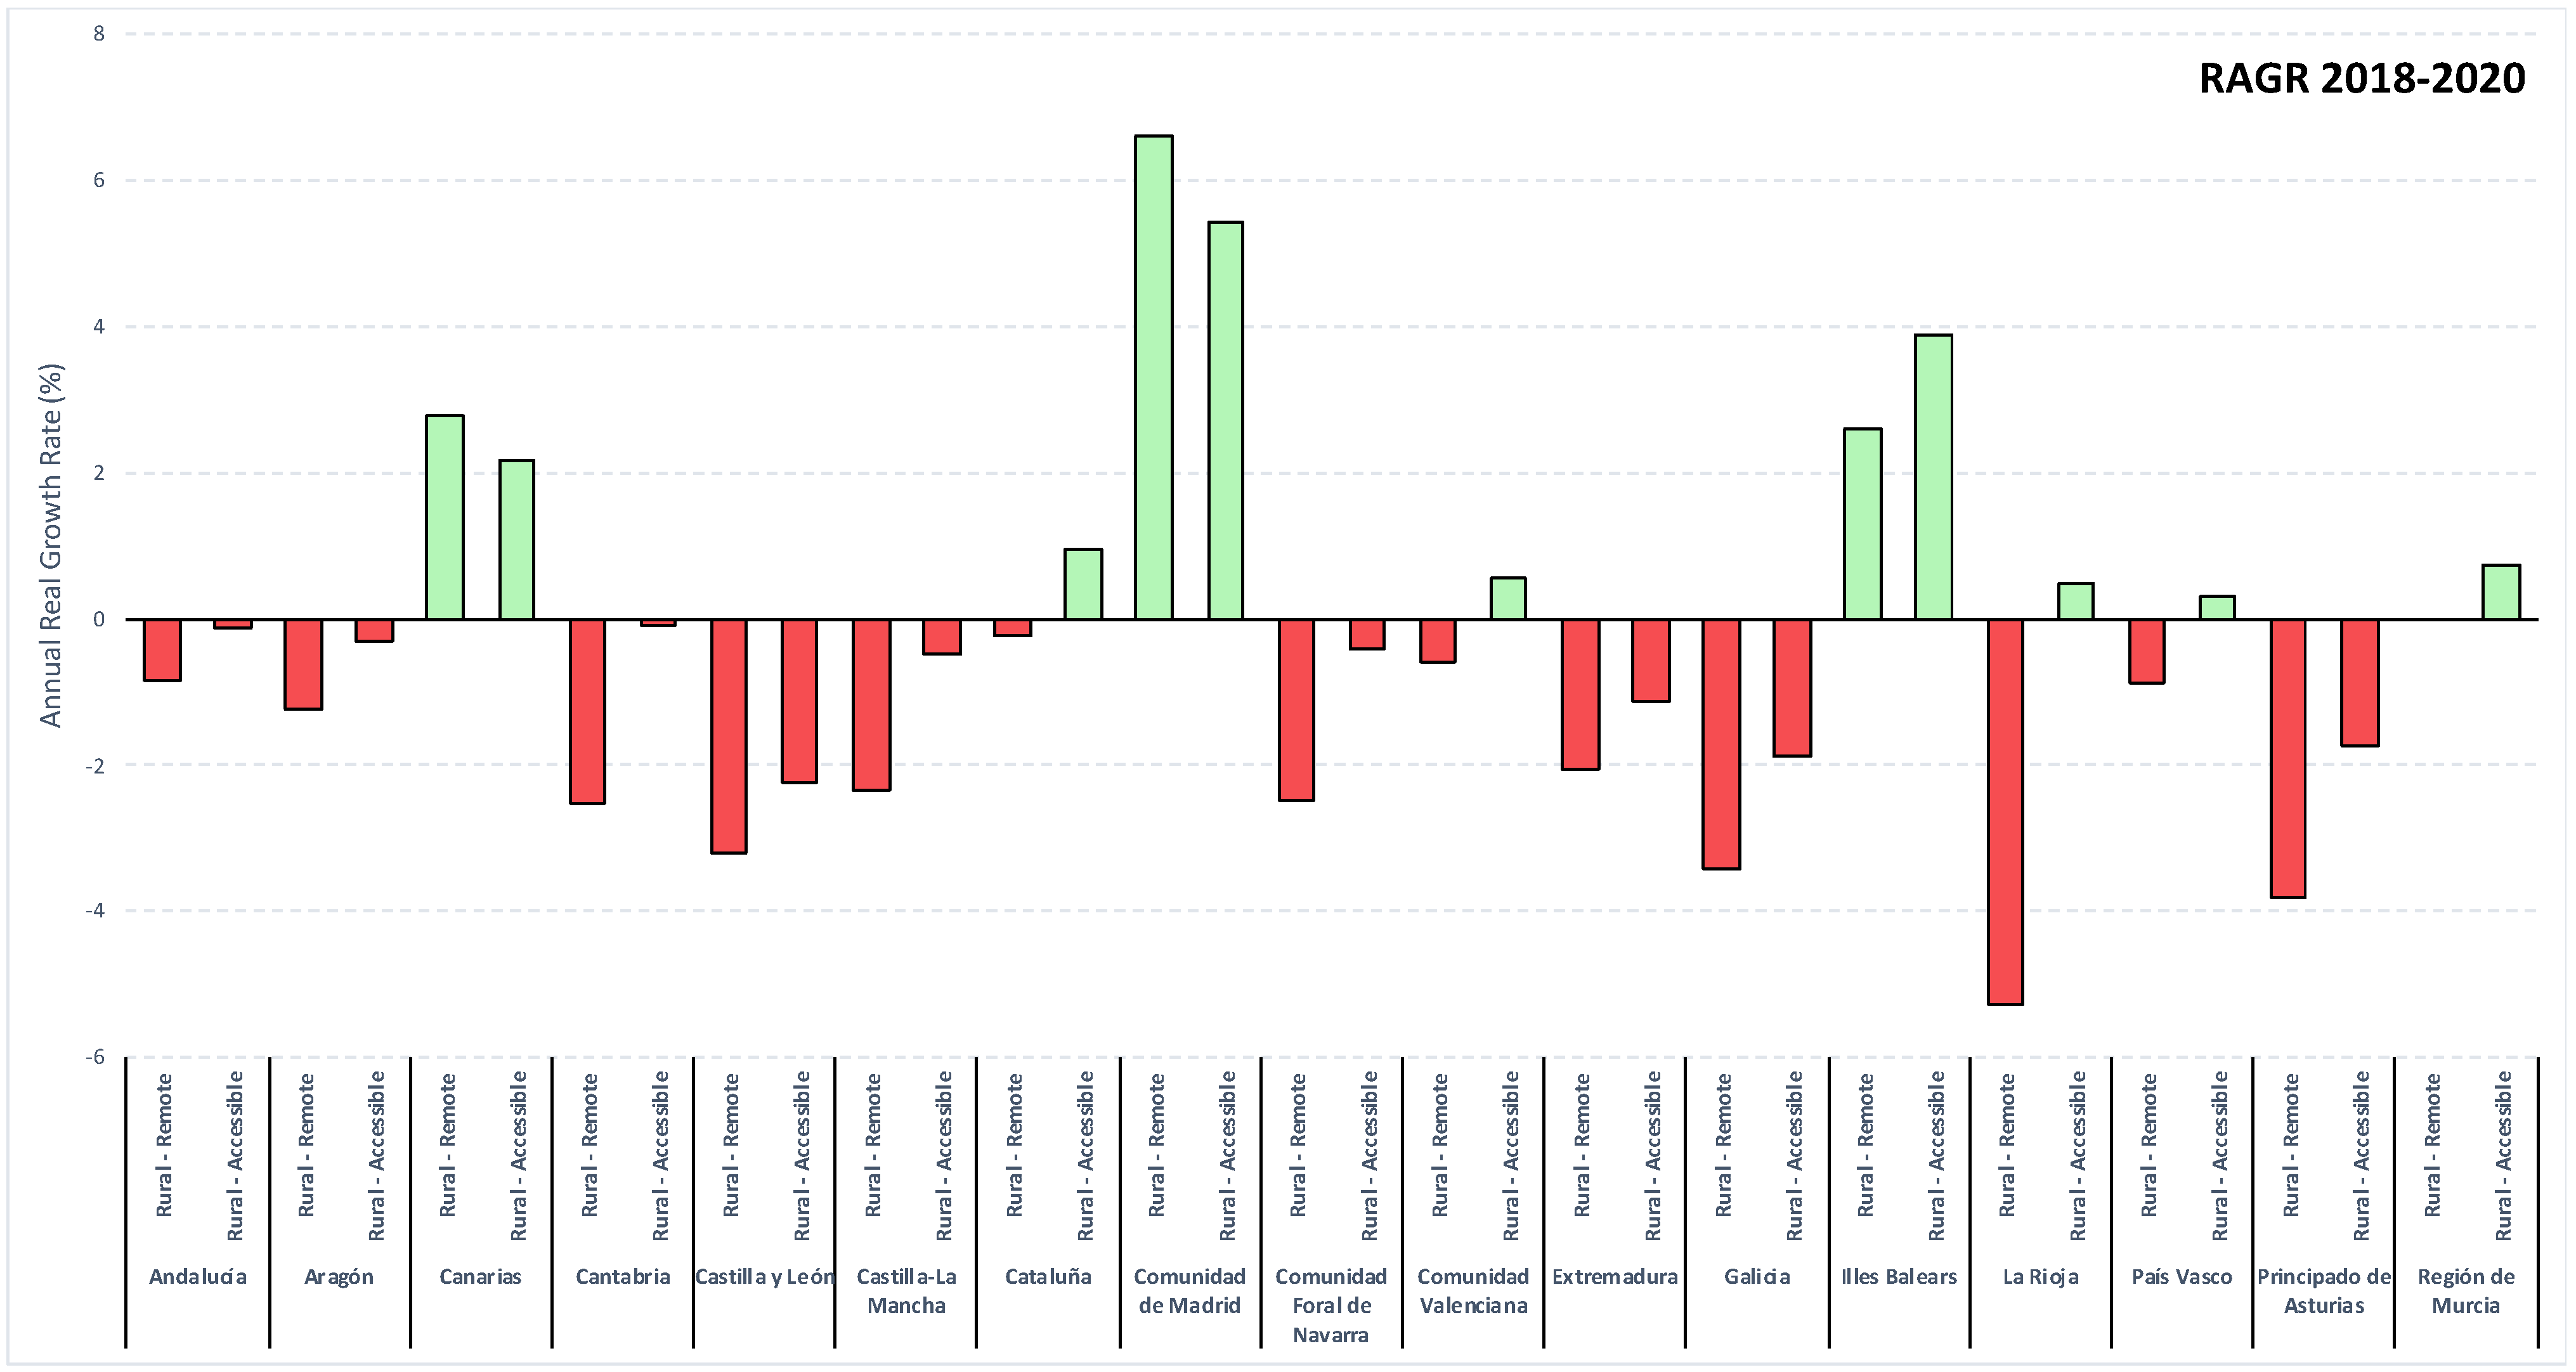
Figure 9 shows ARGR between 2018 and 2020 for the different rural areas of the autonomous regions. This is more noticeable in remote areas than in accessible areas. The autonomous regions with the greatest losses of inhabitants are La Rioja, Asturias, Galicia, Castilla y León, Castilla-La Mancha, Extremadura, and Cantabria. The rural areas with positive values and, therefore, population growth are located in the autonomous communities of Madrid, Illes Balears, Islas Canarias, Murcia, and Cataluña, being communities with a small number of rural areas and very close to urban areas.
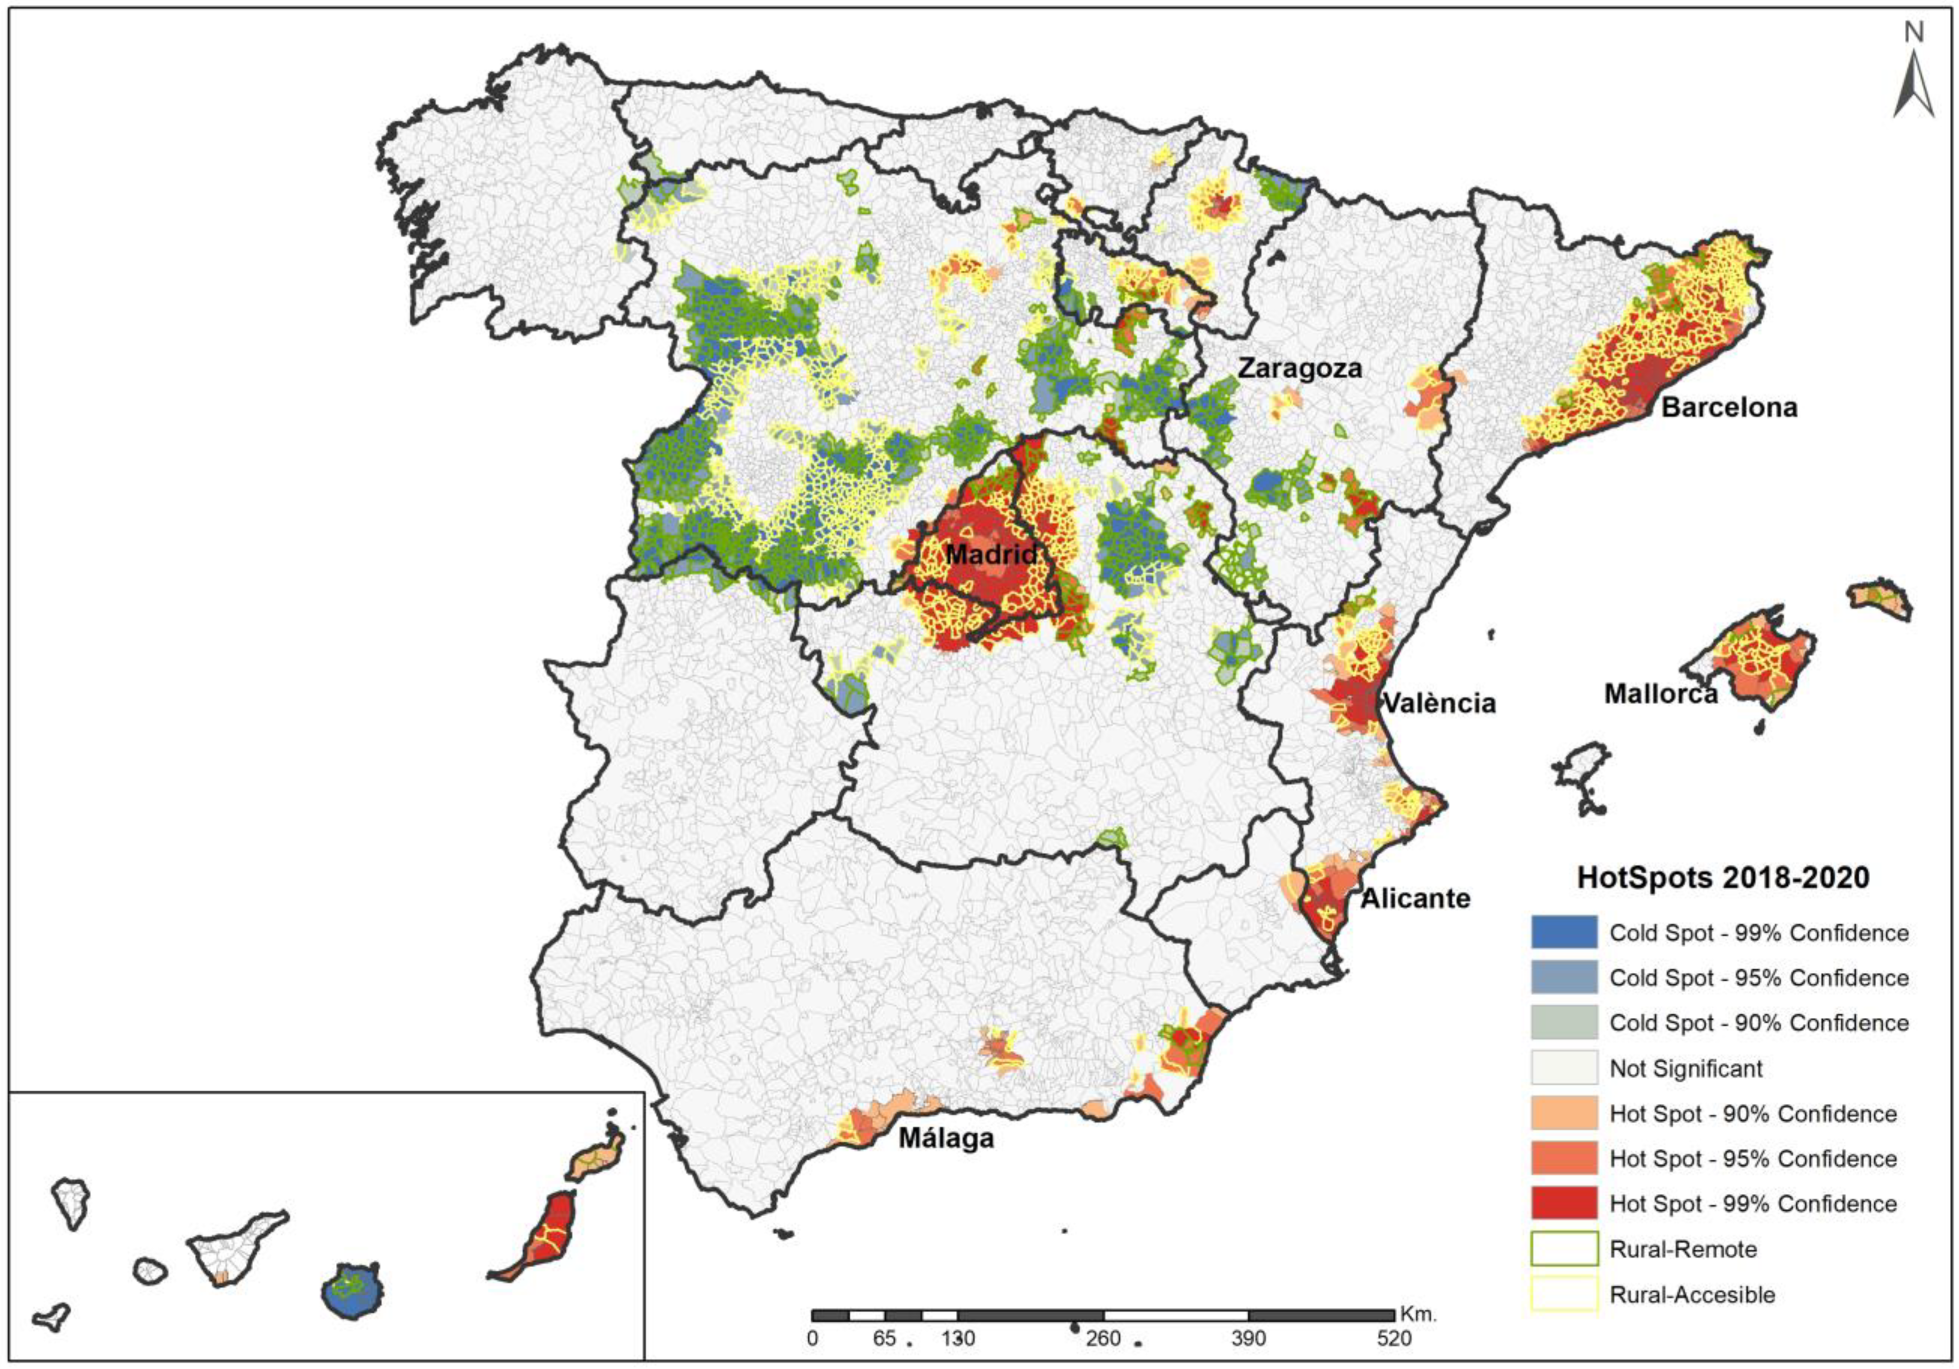
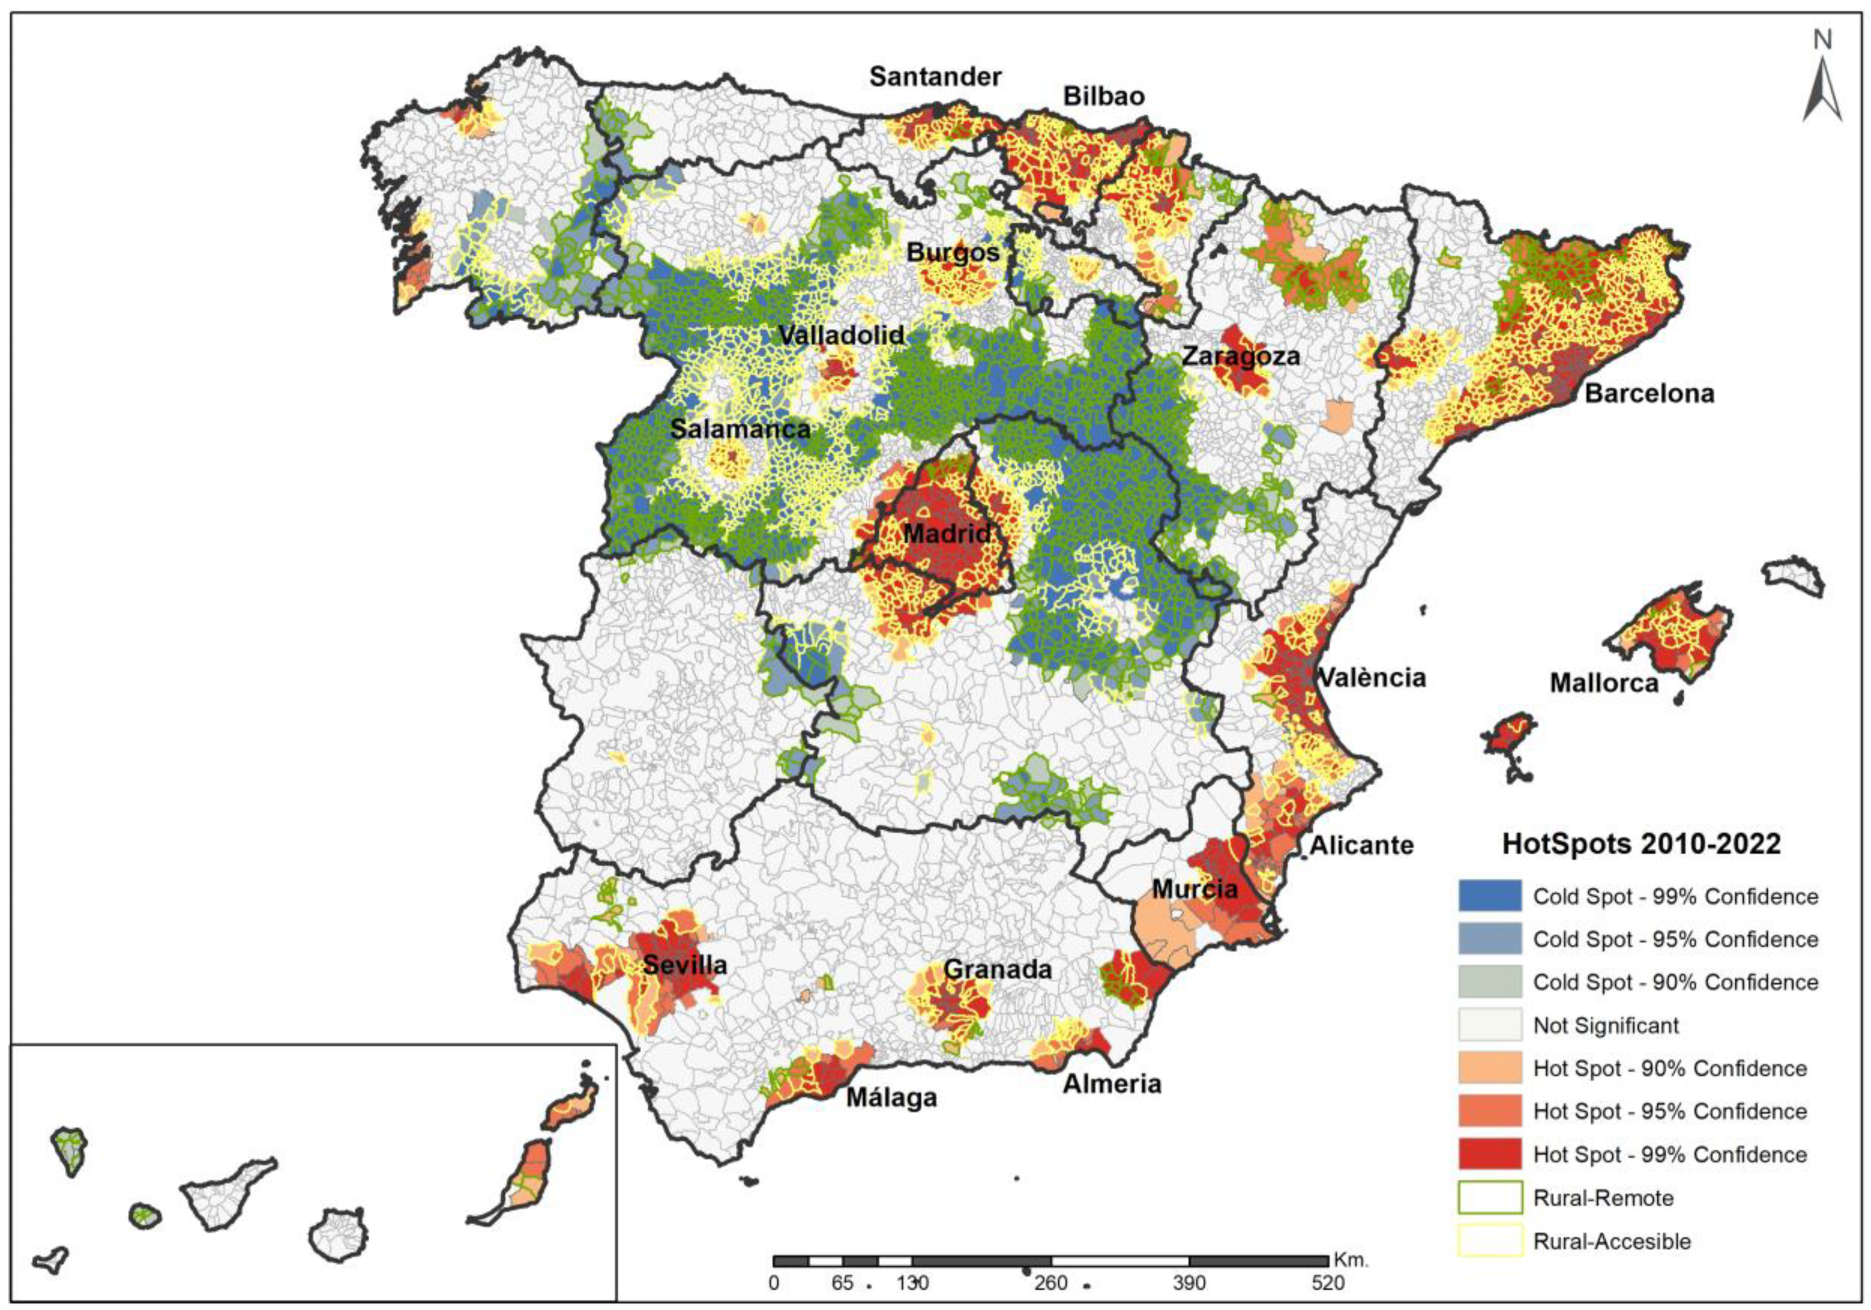
Figure 10 shows the areas in which there are clusters of municipalities with a high proportional population growth (red hotspots) or a high proportional decrease (blue cold spots) between 2018 and 2020. As can be seen, the hot spots are especially concentrated around the large Spanish cities (Madrid, Barcelona, Valencia, and Palma de Mallorca) and other coastal municipalities such as Alicante and Malaga. In addition, there are also significant growth areas on the island of Mallorca and the island of Fuerteventura. Within the rural sphere, the fastest growing areas are those of the accessible type. On the other hand, the agglomerations of municipalities that are decreasing are mainly located in the interior of the country, especially in the autonomous communities of Castilla y León, Castilla-La Mancha, and Aragón. In this case, the predominant types of municipalities that lose the greatest population in proportional terms are the remote rural ones.
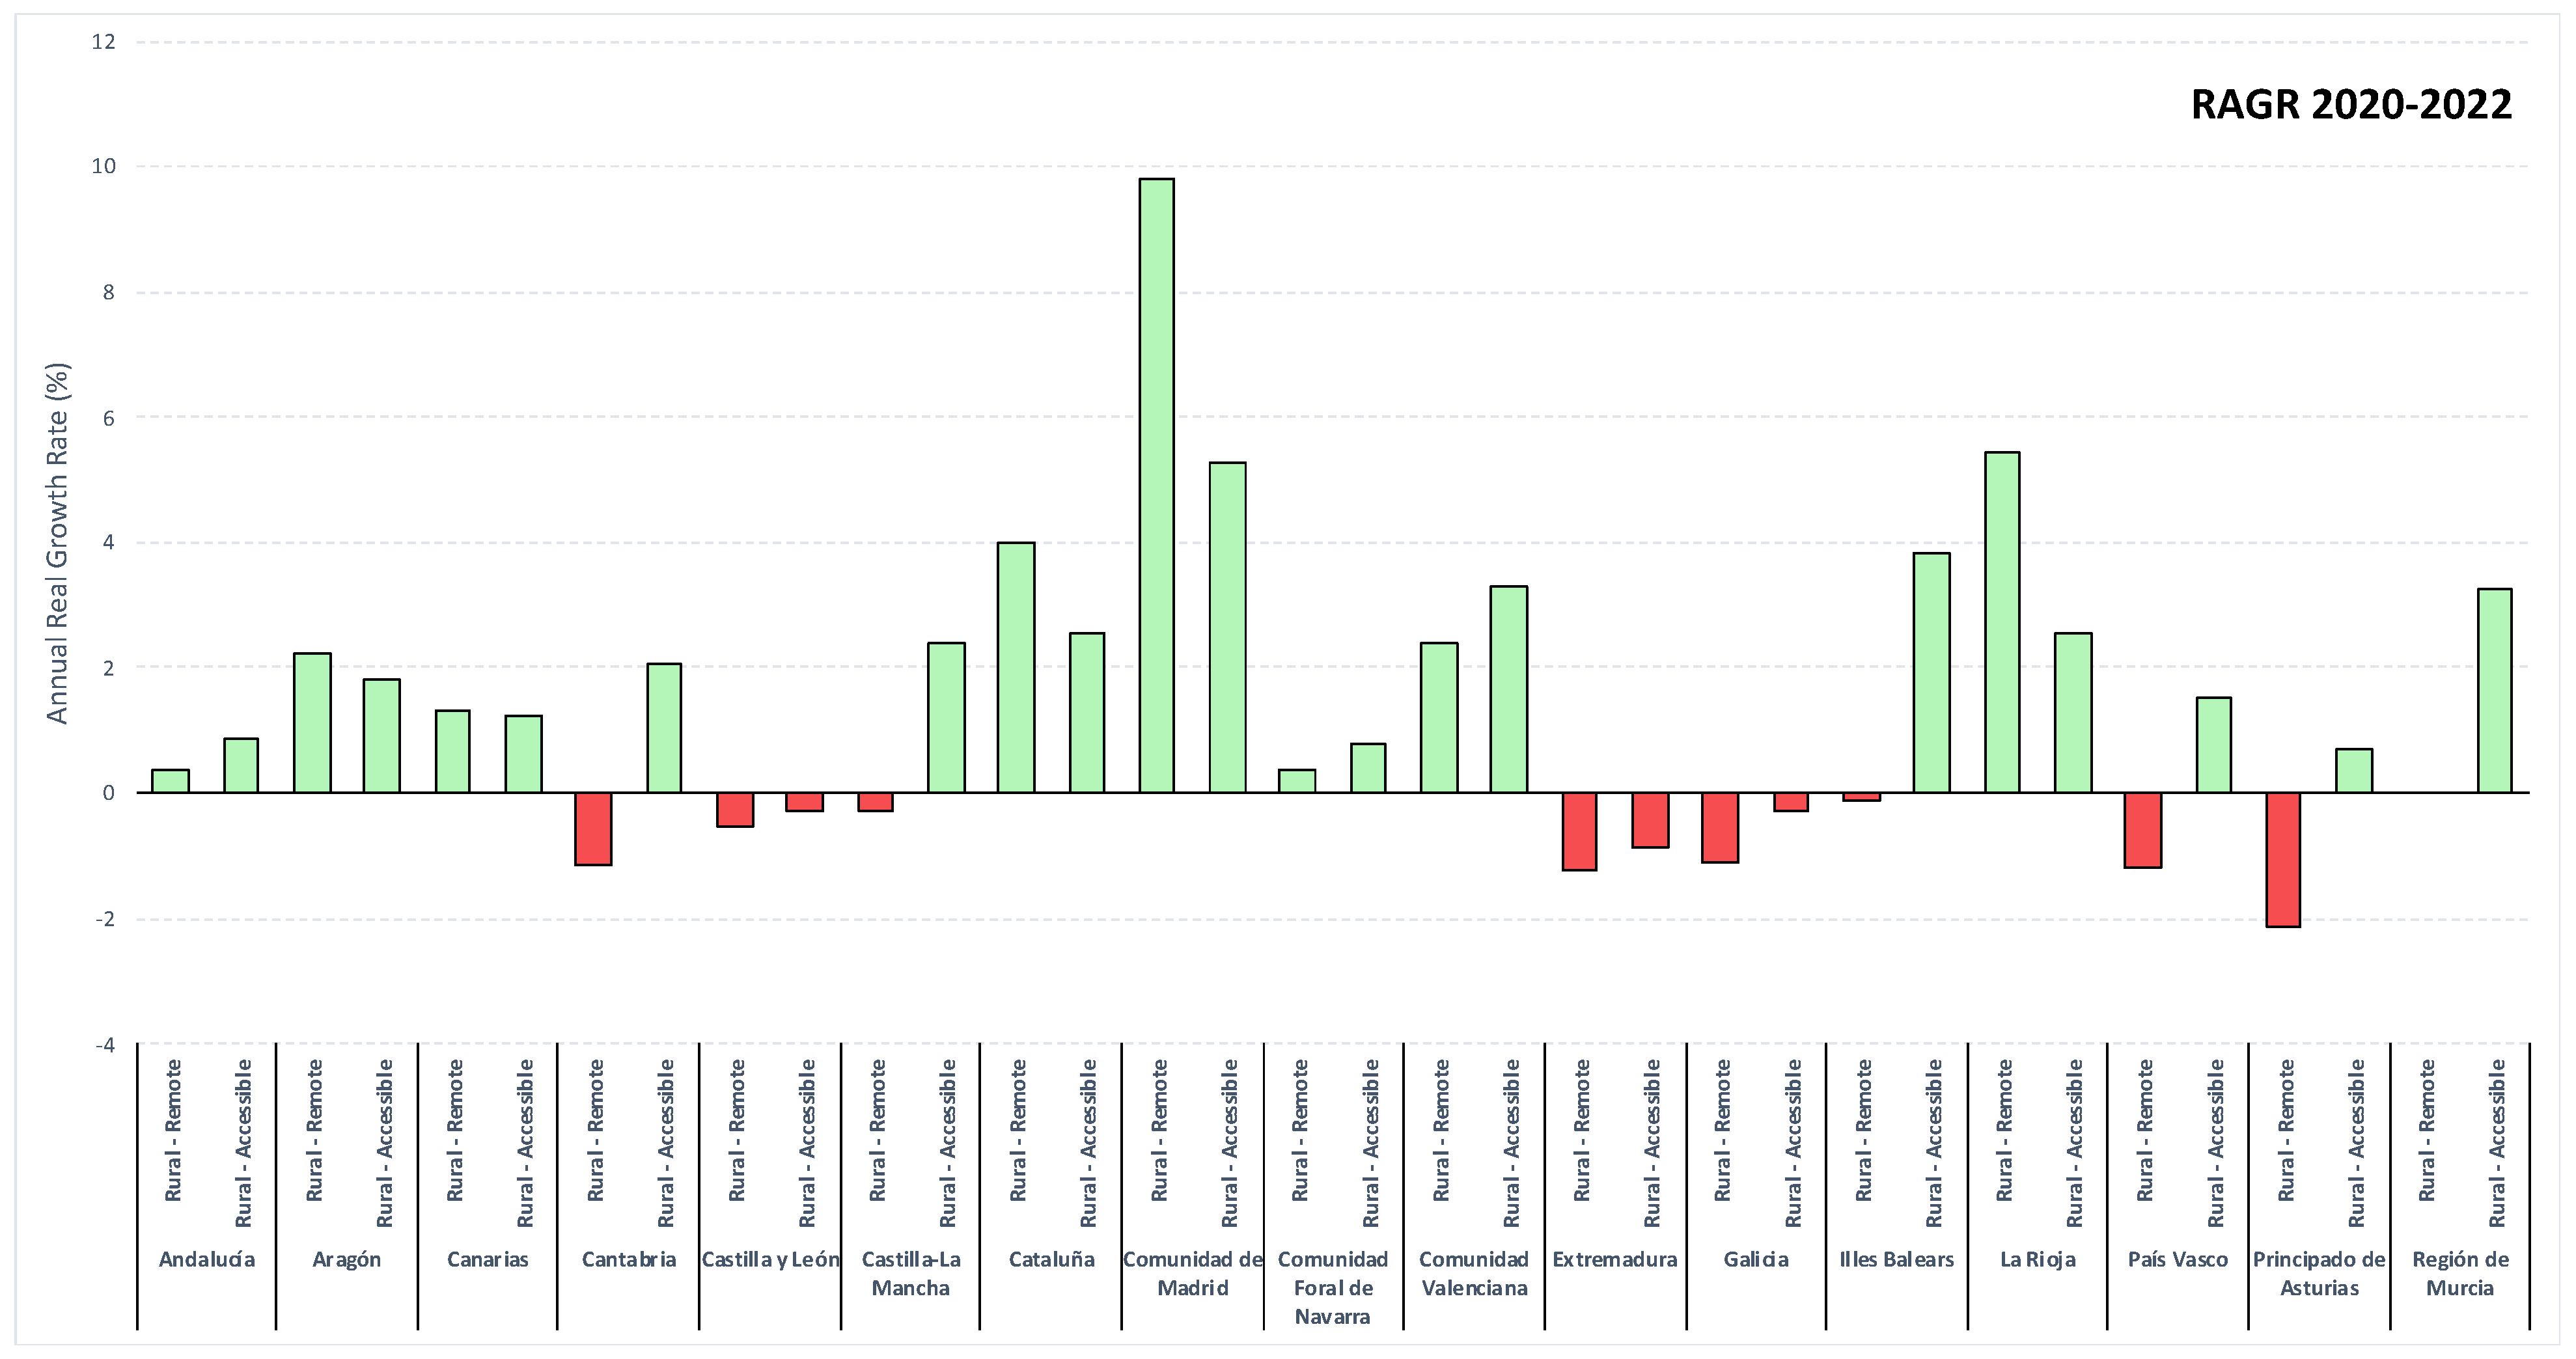
Therefore, in the pre-pandemic scenario, most rural areas in Spain showed negative results. However, in the pandemic and post-confinement period (Figure 11), it can be observed that most of the Spanish rural areas show very positive results, even higher population growth than in the 2018–2020 period. The areas that continue to show population losses in both remote and accessible rural areas are Extremadura, País Vasco, and Castilla y León. However, there are other ARGR such as Cantabria, Castilla-La Mancha, País Vasco, and Asturias that show negative growth only in remote rural areas and positive growth in accessible rural areas. The rest of the autonomous regions show positive population growth between 2020 and 2022, although with significant differences between them. While Madrid, Cataluña, Comunitat Valencia, Illes Balears, La Rioja, and Murcia show the highest population growth rates, which vary between 9% and 2.5%, in the rest of the autonomous communities, there are also population increases in their rural areas, although with lower growth rates than the previous ones.
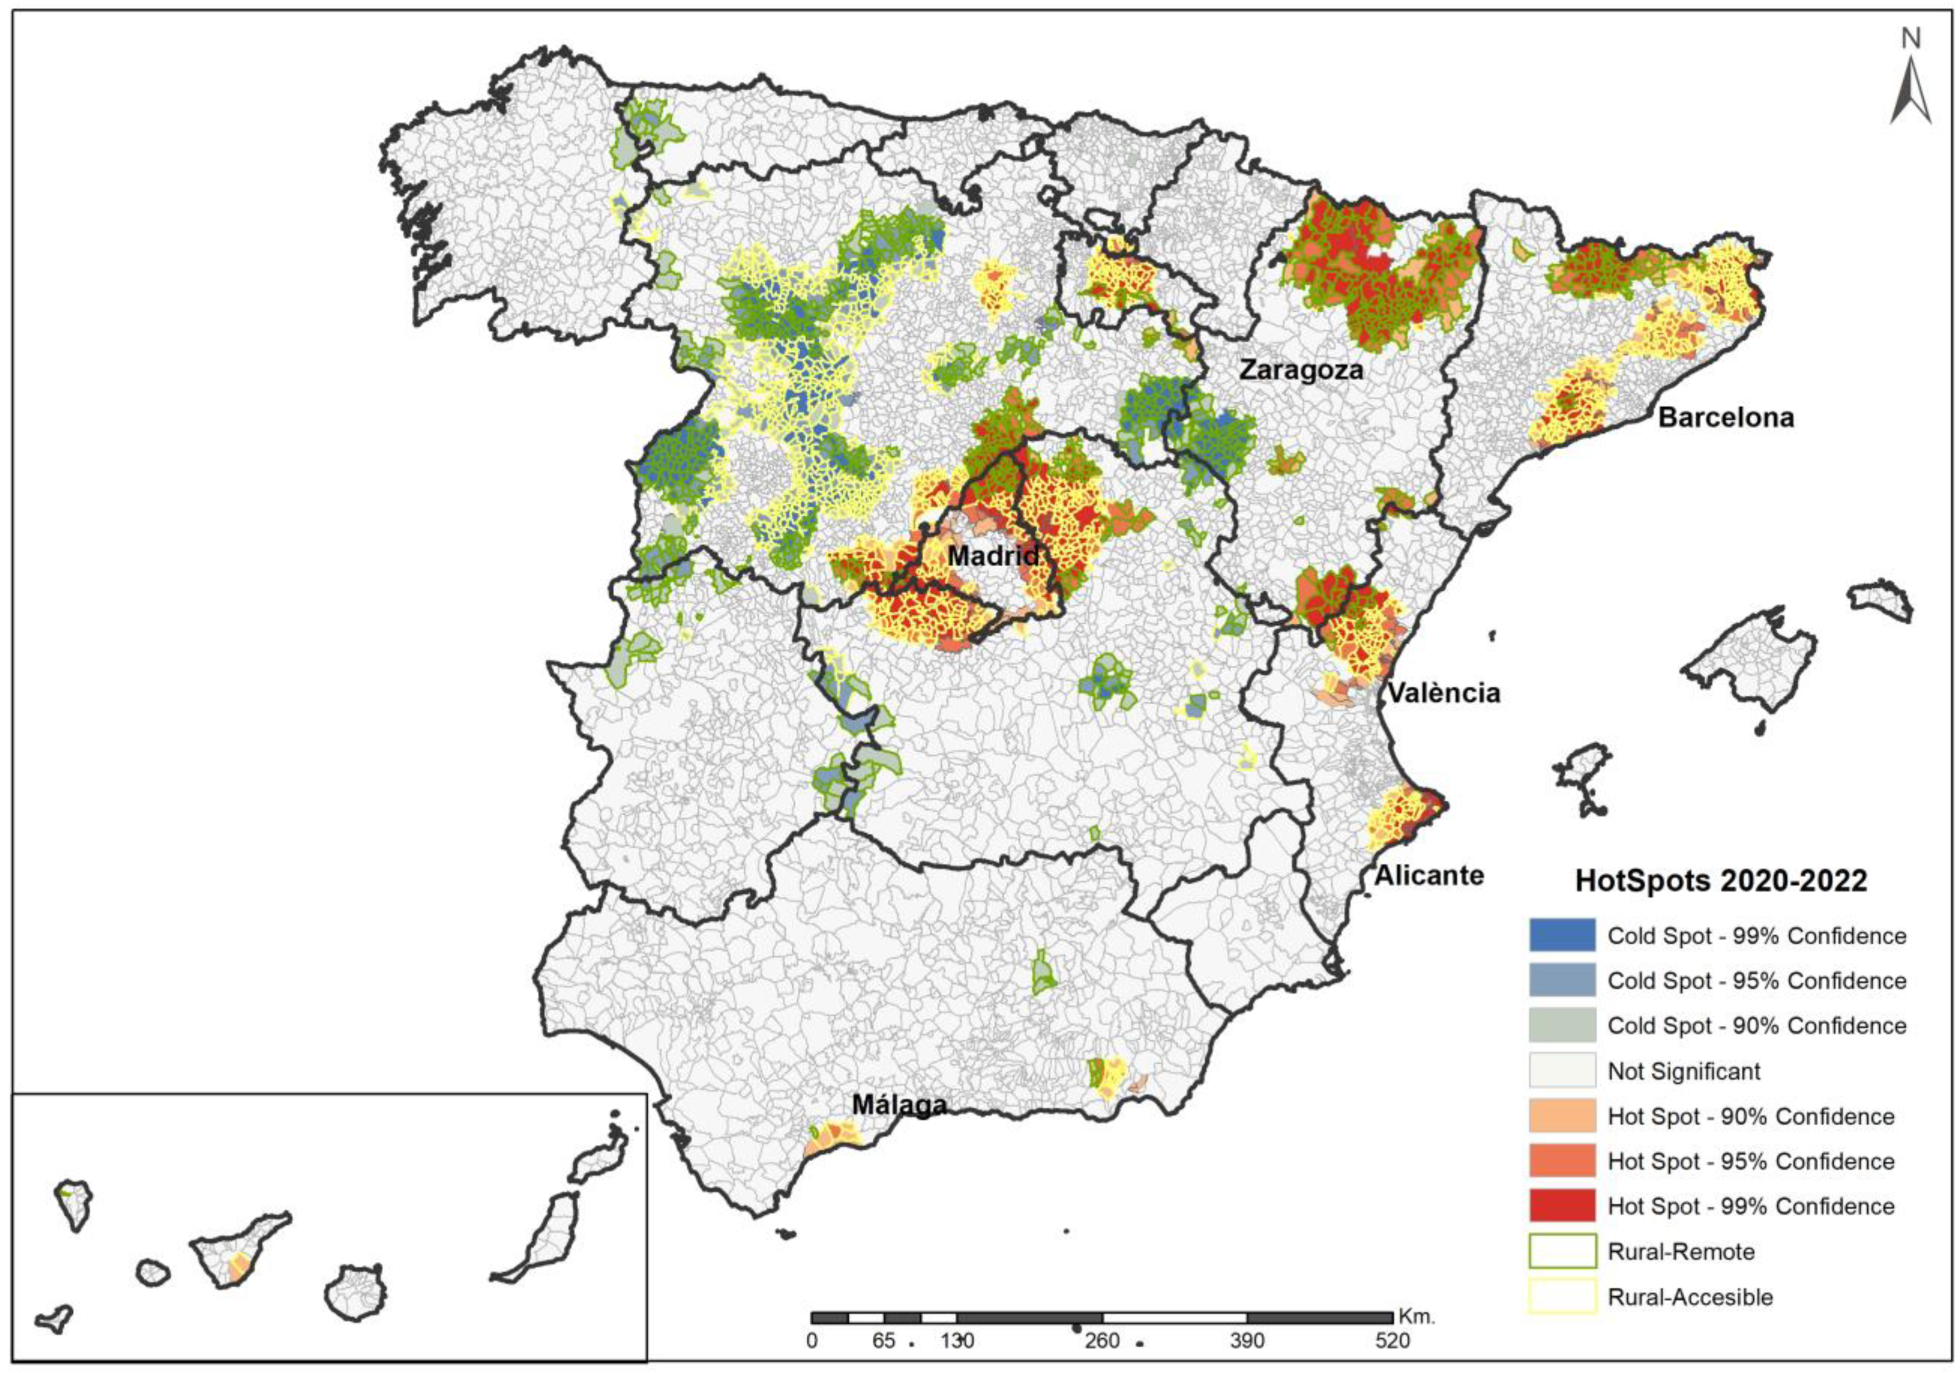
Figure 12 shows the territories in which groups of municipalities with proportional population growth/decrease during the period 2020–2022 are concentrated and whose spatial relationship is statistically significant. Contrary to what happened in the period 2018–2020, during the period 2020–2022, the highest growth rates are not found in the immediate surroundings of the large Spanish cities (Madrid, Barcelona and Valencia), but rather in rural municipalities (remote and accessible) and relatively close to these large cities. Significant growth was also detected around expensive and tourist cities such as Dénia or Javea in the south of the Comunitat Valenciana or Tarragona in the south of Catalunya. It is also worth highlighting the growth in the municipalities located around the Catalan and Aragonese Pyrenees, as most of these municipalities are of the rural—remote type. As for the areas with the greatest population losses in proportional terms, the rural municipalities (deep and remote) of Castilla y León, Castilla-La Mancha, and Aragón continue to stand out.
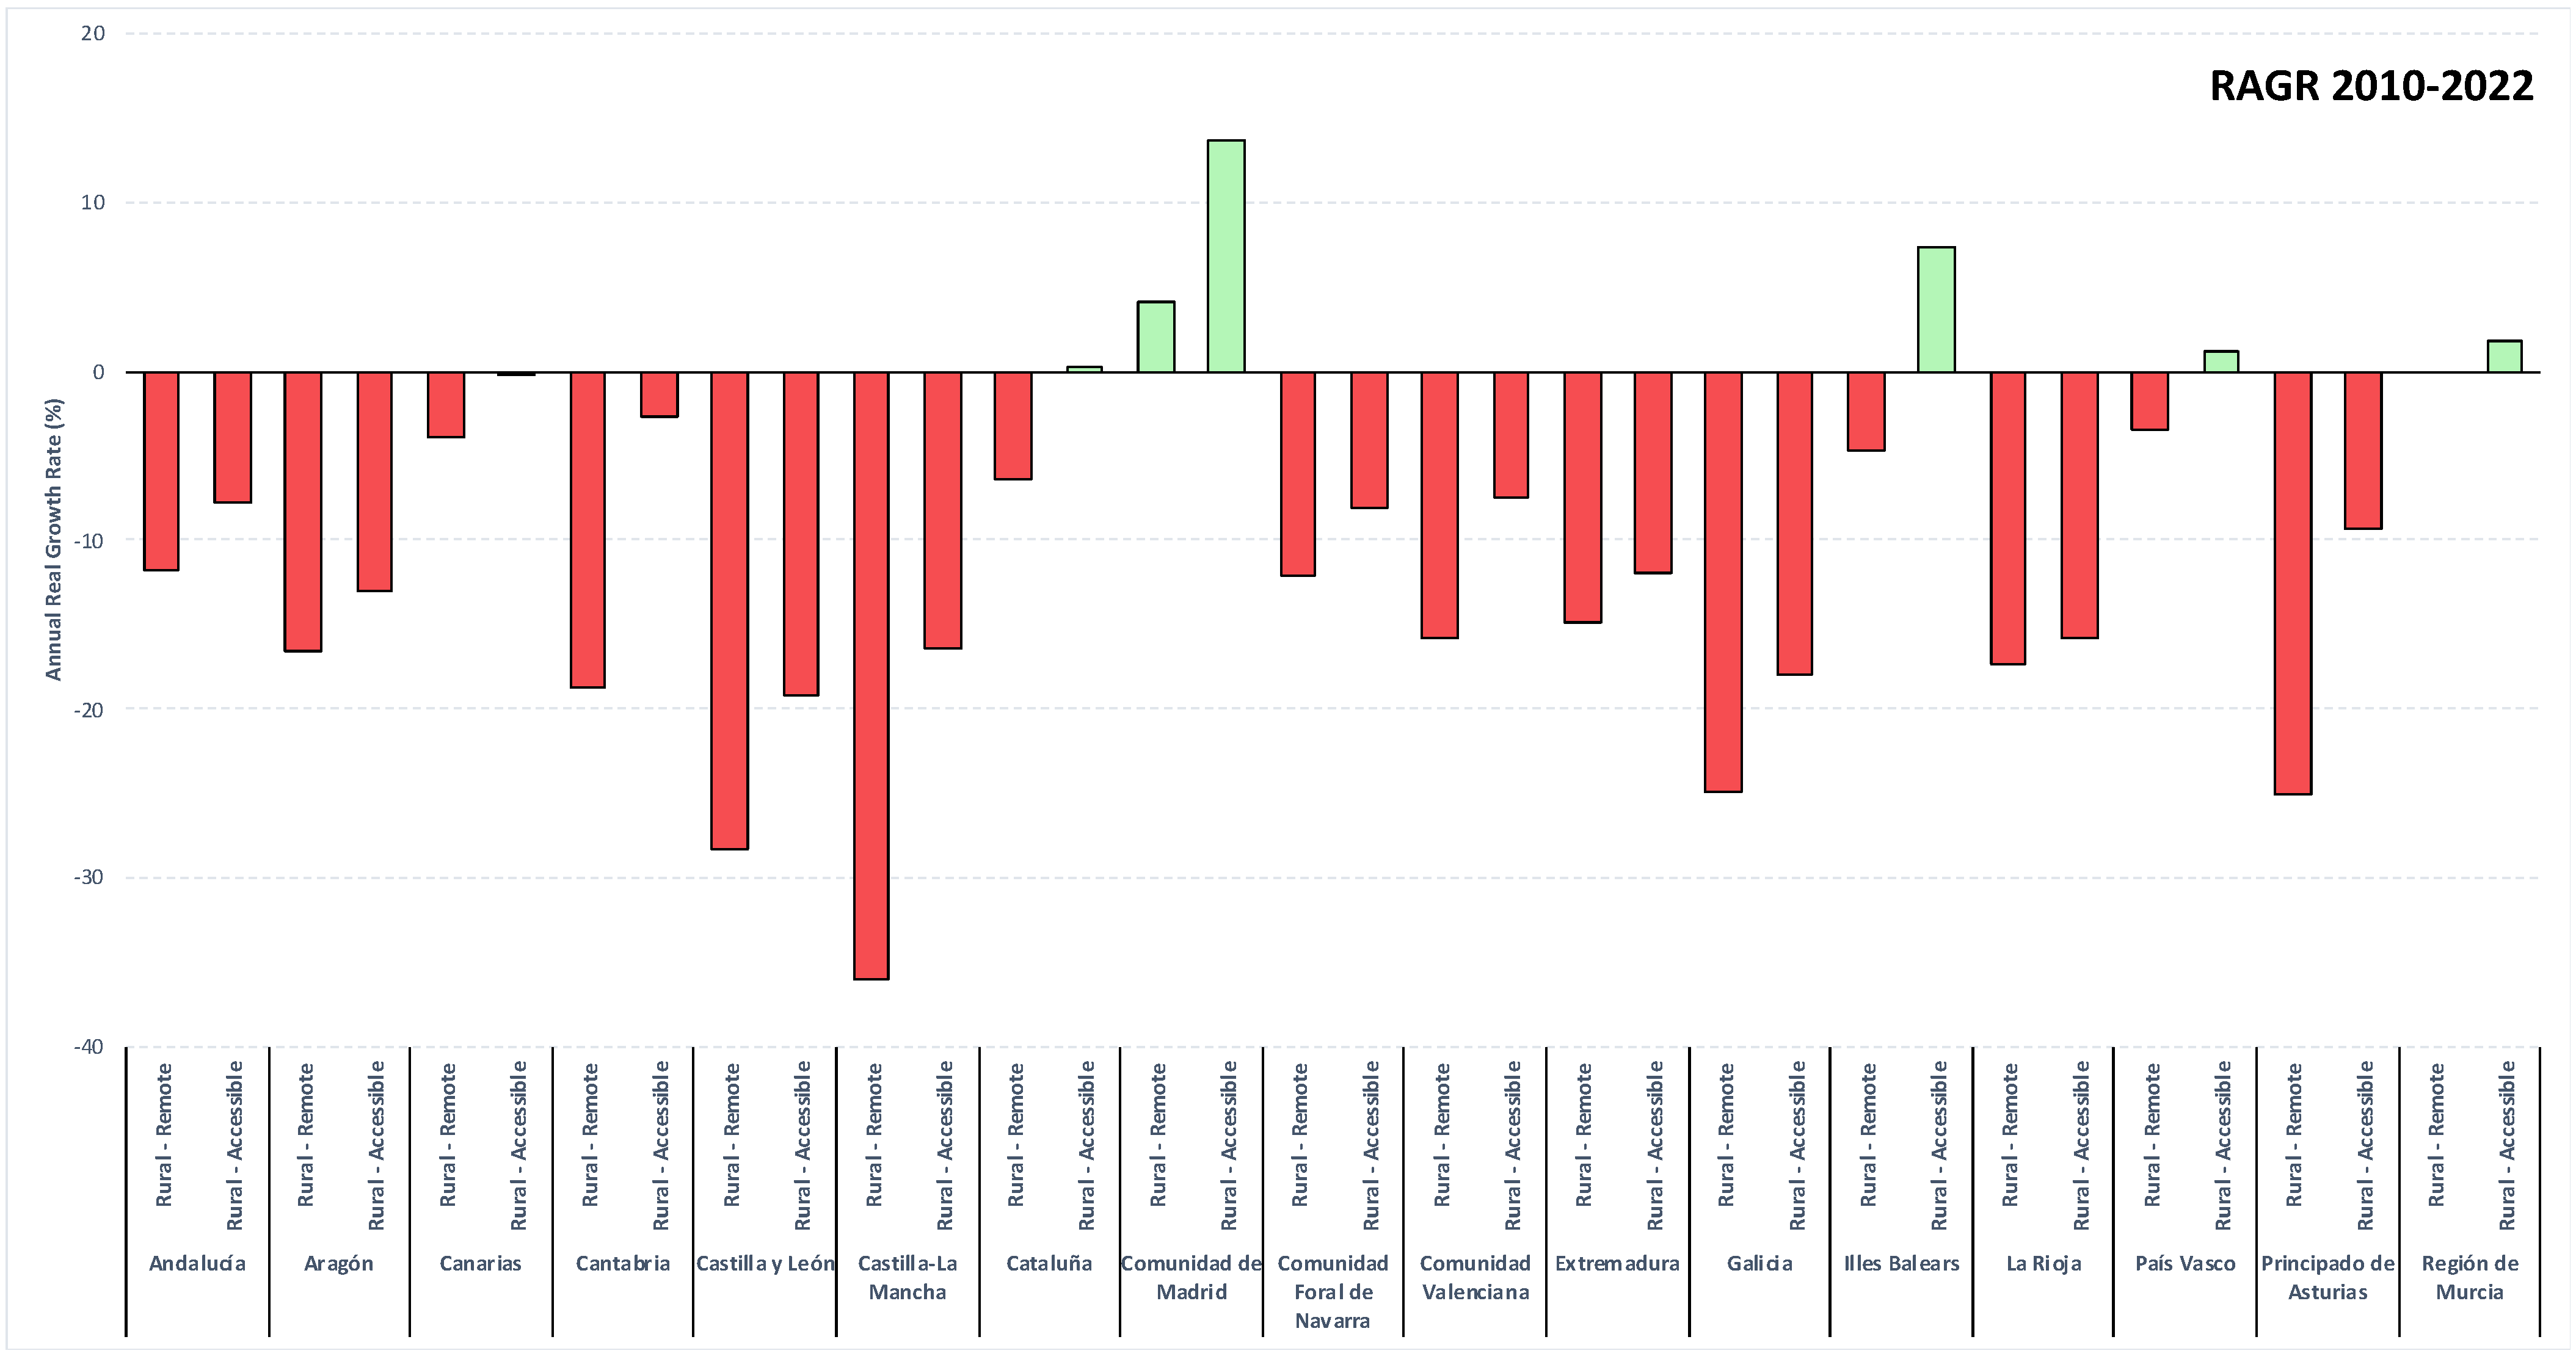
Finally, having analysed the pre- and post-confinement period, it is important to provide a general contextualisation of the last decade. To this end, we have analysed the real population growth between 2010 and 2022 (Figure 13) in order to check whether or not the high growth that occurred between 2020 and 2022 has modified the trend shown before the pandemic. As can be seen, all Spanish rural areas, except for Madrid, Illes Balears, País Vasco, Murcia, and Cataluña, show very significant population losses in the last decade, with levels varying between 10% and 37%, which represents a very marked loss of population.
Figure 14 represents the territories in which clusters of municipalities with proportional population growth/decline during the period 2010–2022 are concentrated and whose spatial relationship is statistically significant. As can be seen, the situation is more similar to that of the 2018–2020 period than to that of 2020–2022. On this occasion, growth occurs around the large cities and provincial capitals that are most important in demographic and economic terms (Madrid, Barcelona, Valencia, Seville, Zaragoza, Bilbao, and so on) as well as in the municipalities of the Spanish east coast. It can also be observed that many of these municipalities are not rural, and among those that are, the accessible rural ones clearly stand out. Moreover, the agglomerations of municipalities that are losing population are particularly concentrated in the centre of the country, around the Community of Madrid and the functional areas of other provincial capitals, with the groupings of municipalities located in Castilla y León, Castilla-La Mancha, and Aragón being noteworthy, as in the previous cases. It should also be noted that, within these groupings of municipalities, remote rural municipalities stand out.
Having demonstrated the change in trend from the population point of view in Spanish rural areas between 2020 and 2022, as well as the change between 2018 and 2022 and in the last decade, it is important to check whether this population growth has any direct relationship with the data on COVID-19 incidence and deaths. Regarding the relationship between annual real growth rate (2020–2022) and COVID-19 incidence, it can be seen in Table 6 that there is a significant relationship between the variables. In the Pearson correlation analysis between ARGR and COVID incidence, the result (−0.182) shows a negative (inverse) relationship between the variables with a significance level of 0.001.
The same trend is observed in Table 7, where ARGR (2020–2022) and COVID deaths are linked through a Pearson correlation. The result (−0.151) shows a negative (inverse) relationship between the variables at the 0.001 level of significance.
3.3. Changes in Demographic Indicators and Rates
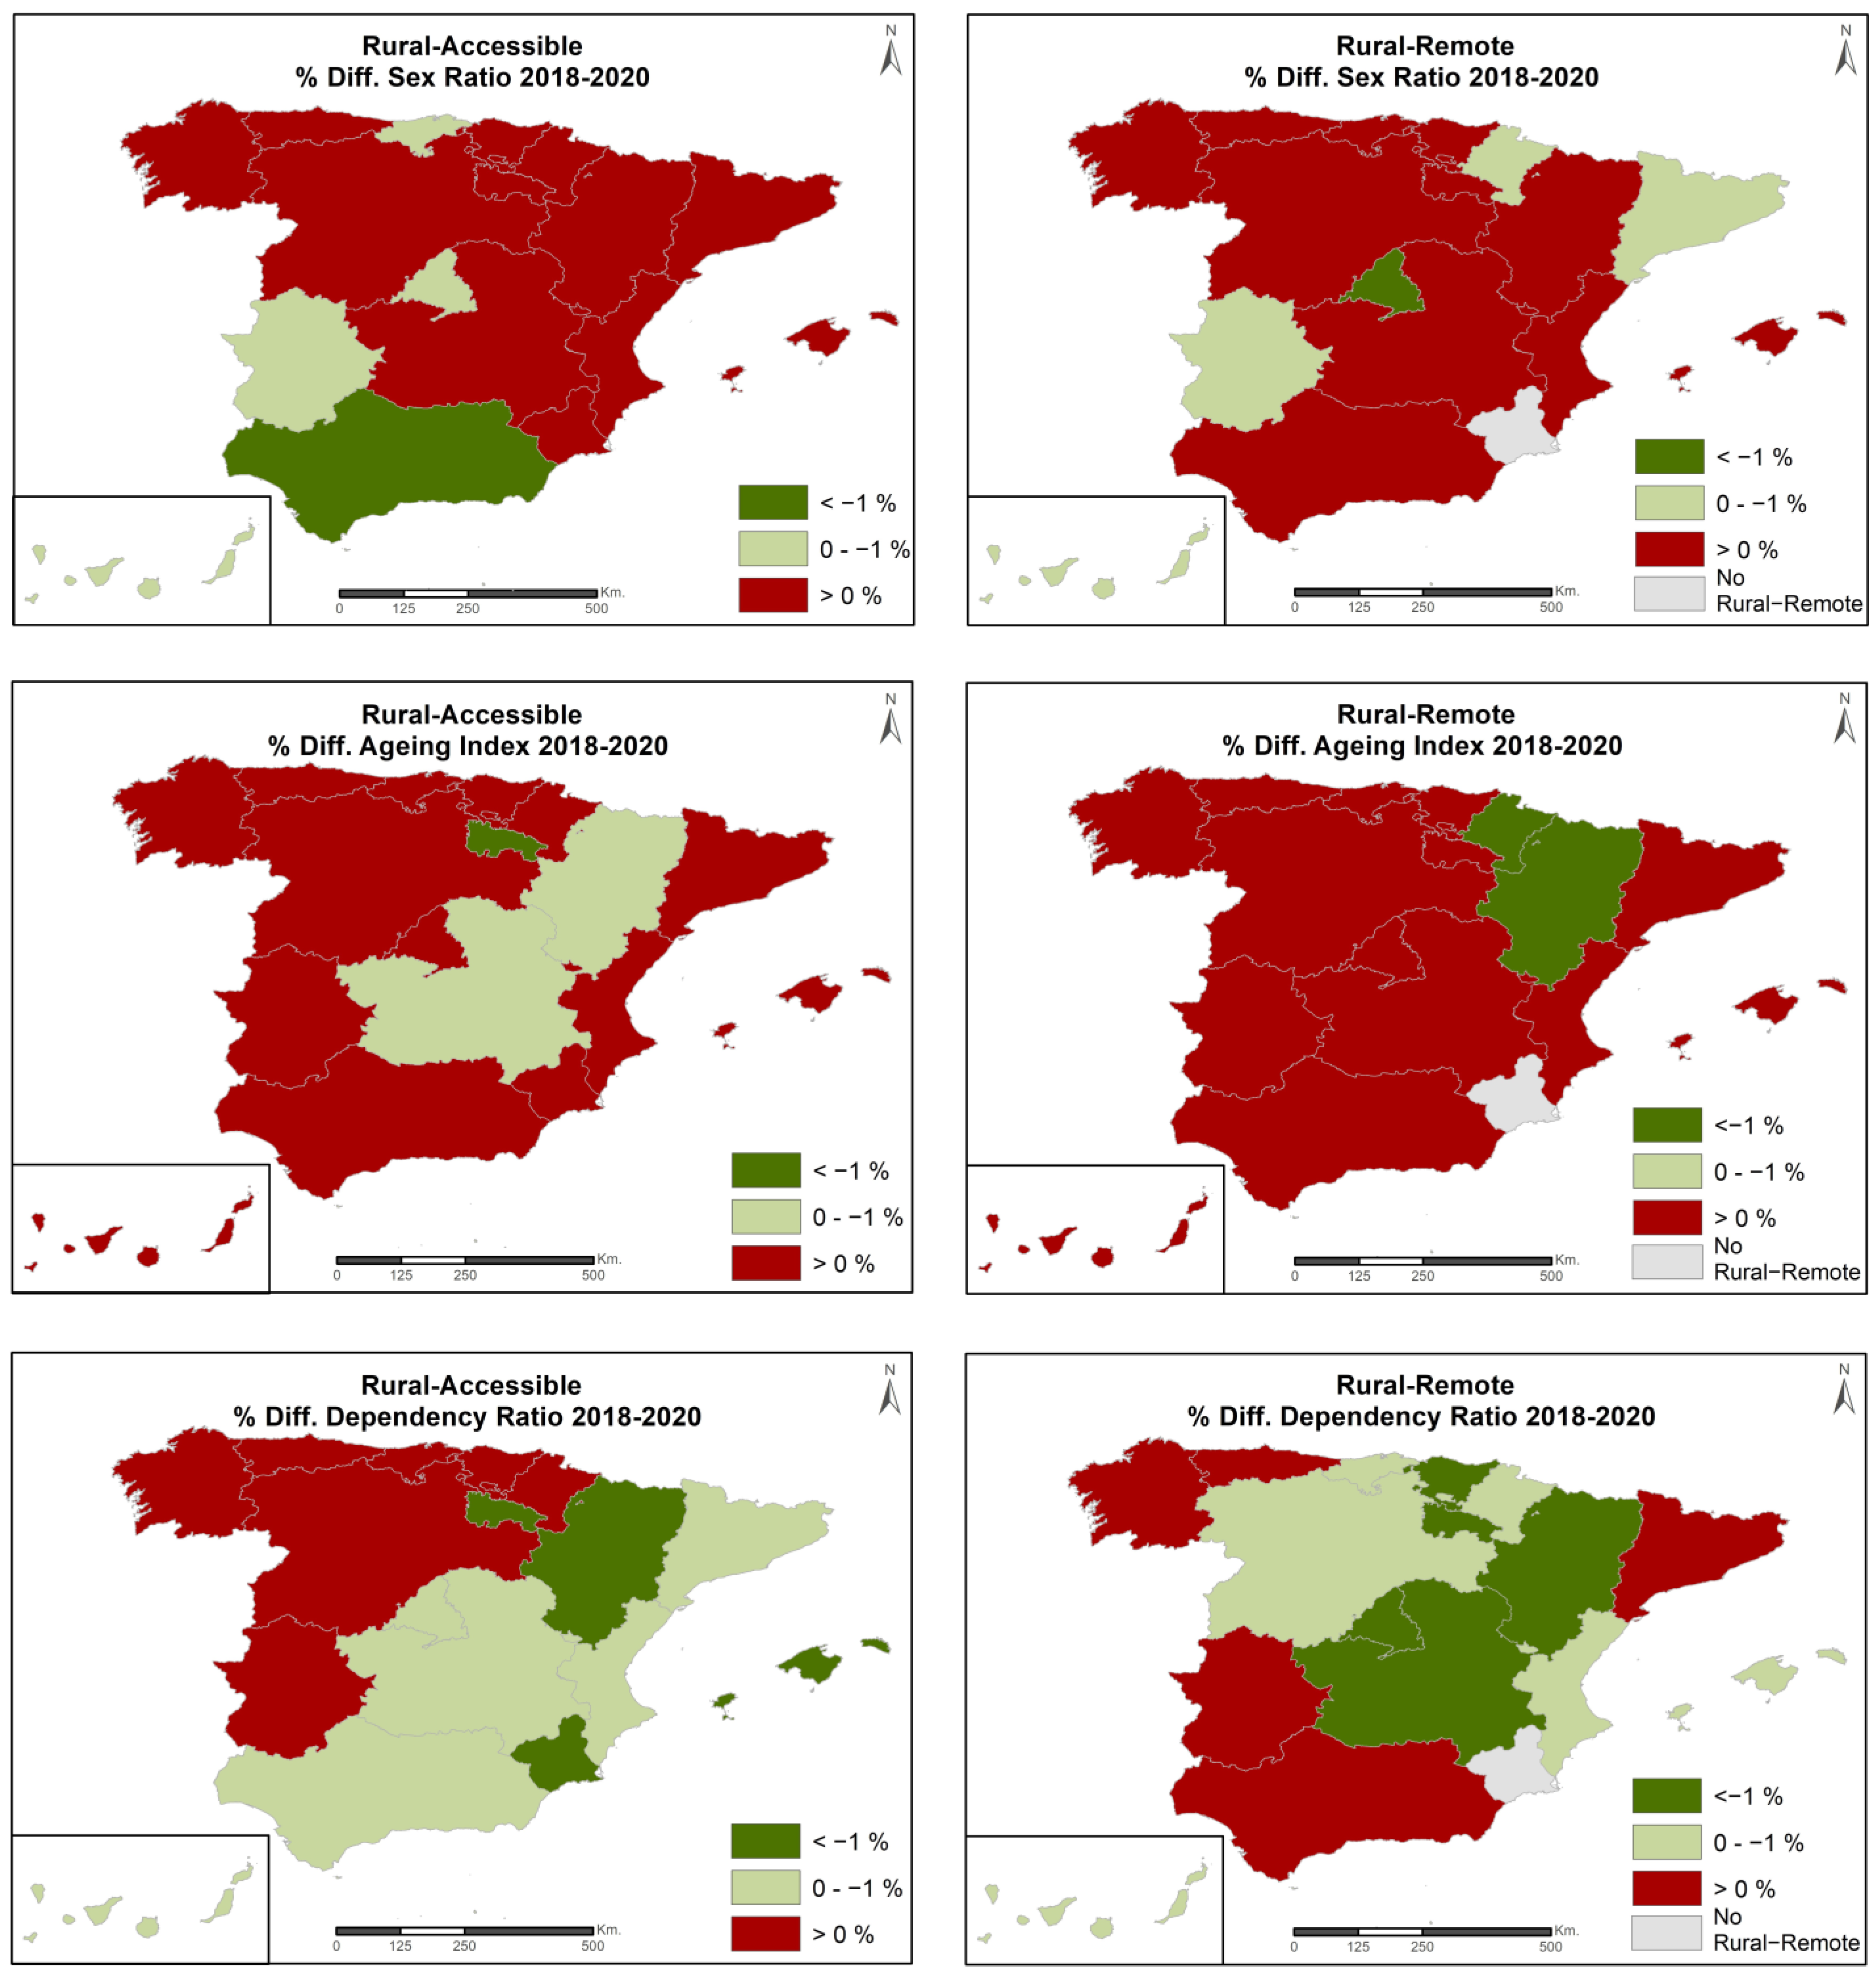
Having analysed the relationship between COVID-19 and population growth in Spanish rural areas between 2020 and 2022, it is important to know whether these processes are also related to and have affected the main demographic indicators. Similarly, it is important to check whether the negative trend regarding population outflow between 2010 and 2022 is related to the results of the demographic indicators and whether the trend between 2020 and 2022 has managed to improve them. For this purpose, based on the calculation of the different indicators and rates, the differential percentage between the years studied in the rural areas of the different autonomous communities was calculated.
Figure 15 shows the percentage differential in the sex ratio, ageing index, and dependency ratio between 2018 and 2020, being the pre-pandemic scenario. Herein, we can see how most of the indicators and rates of the different rural areas obtain positive values, which indicates a growth and, therefore, a worsening of these indicators and rates. This means a worsening of the masculinity ratio; of dependency; and, above all, of ageing, which is the indicator that worsens the most in this period.
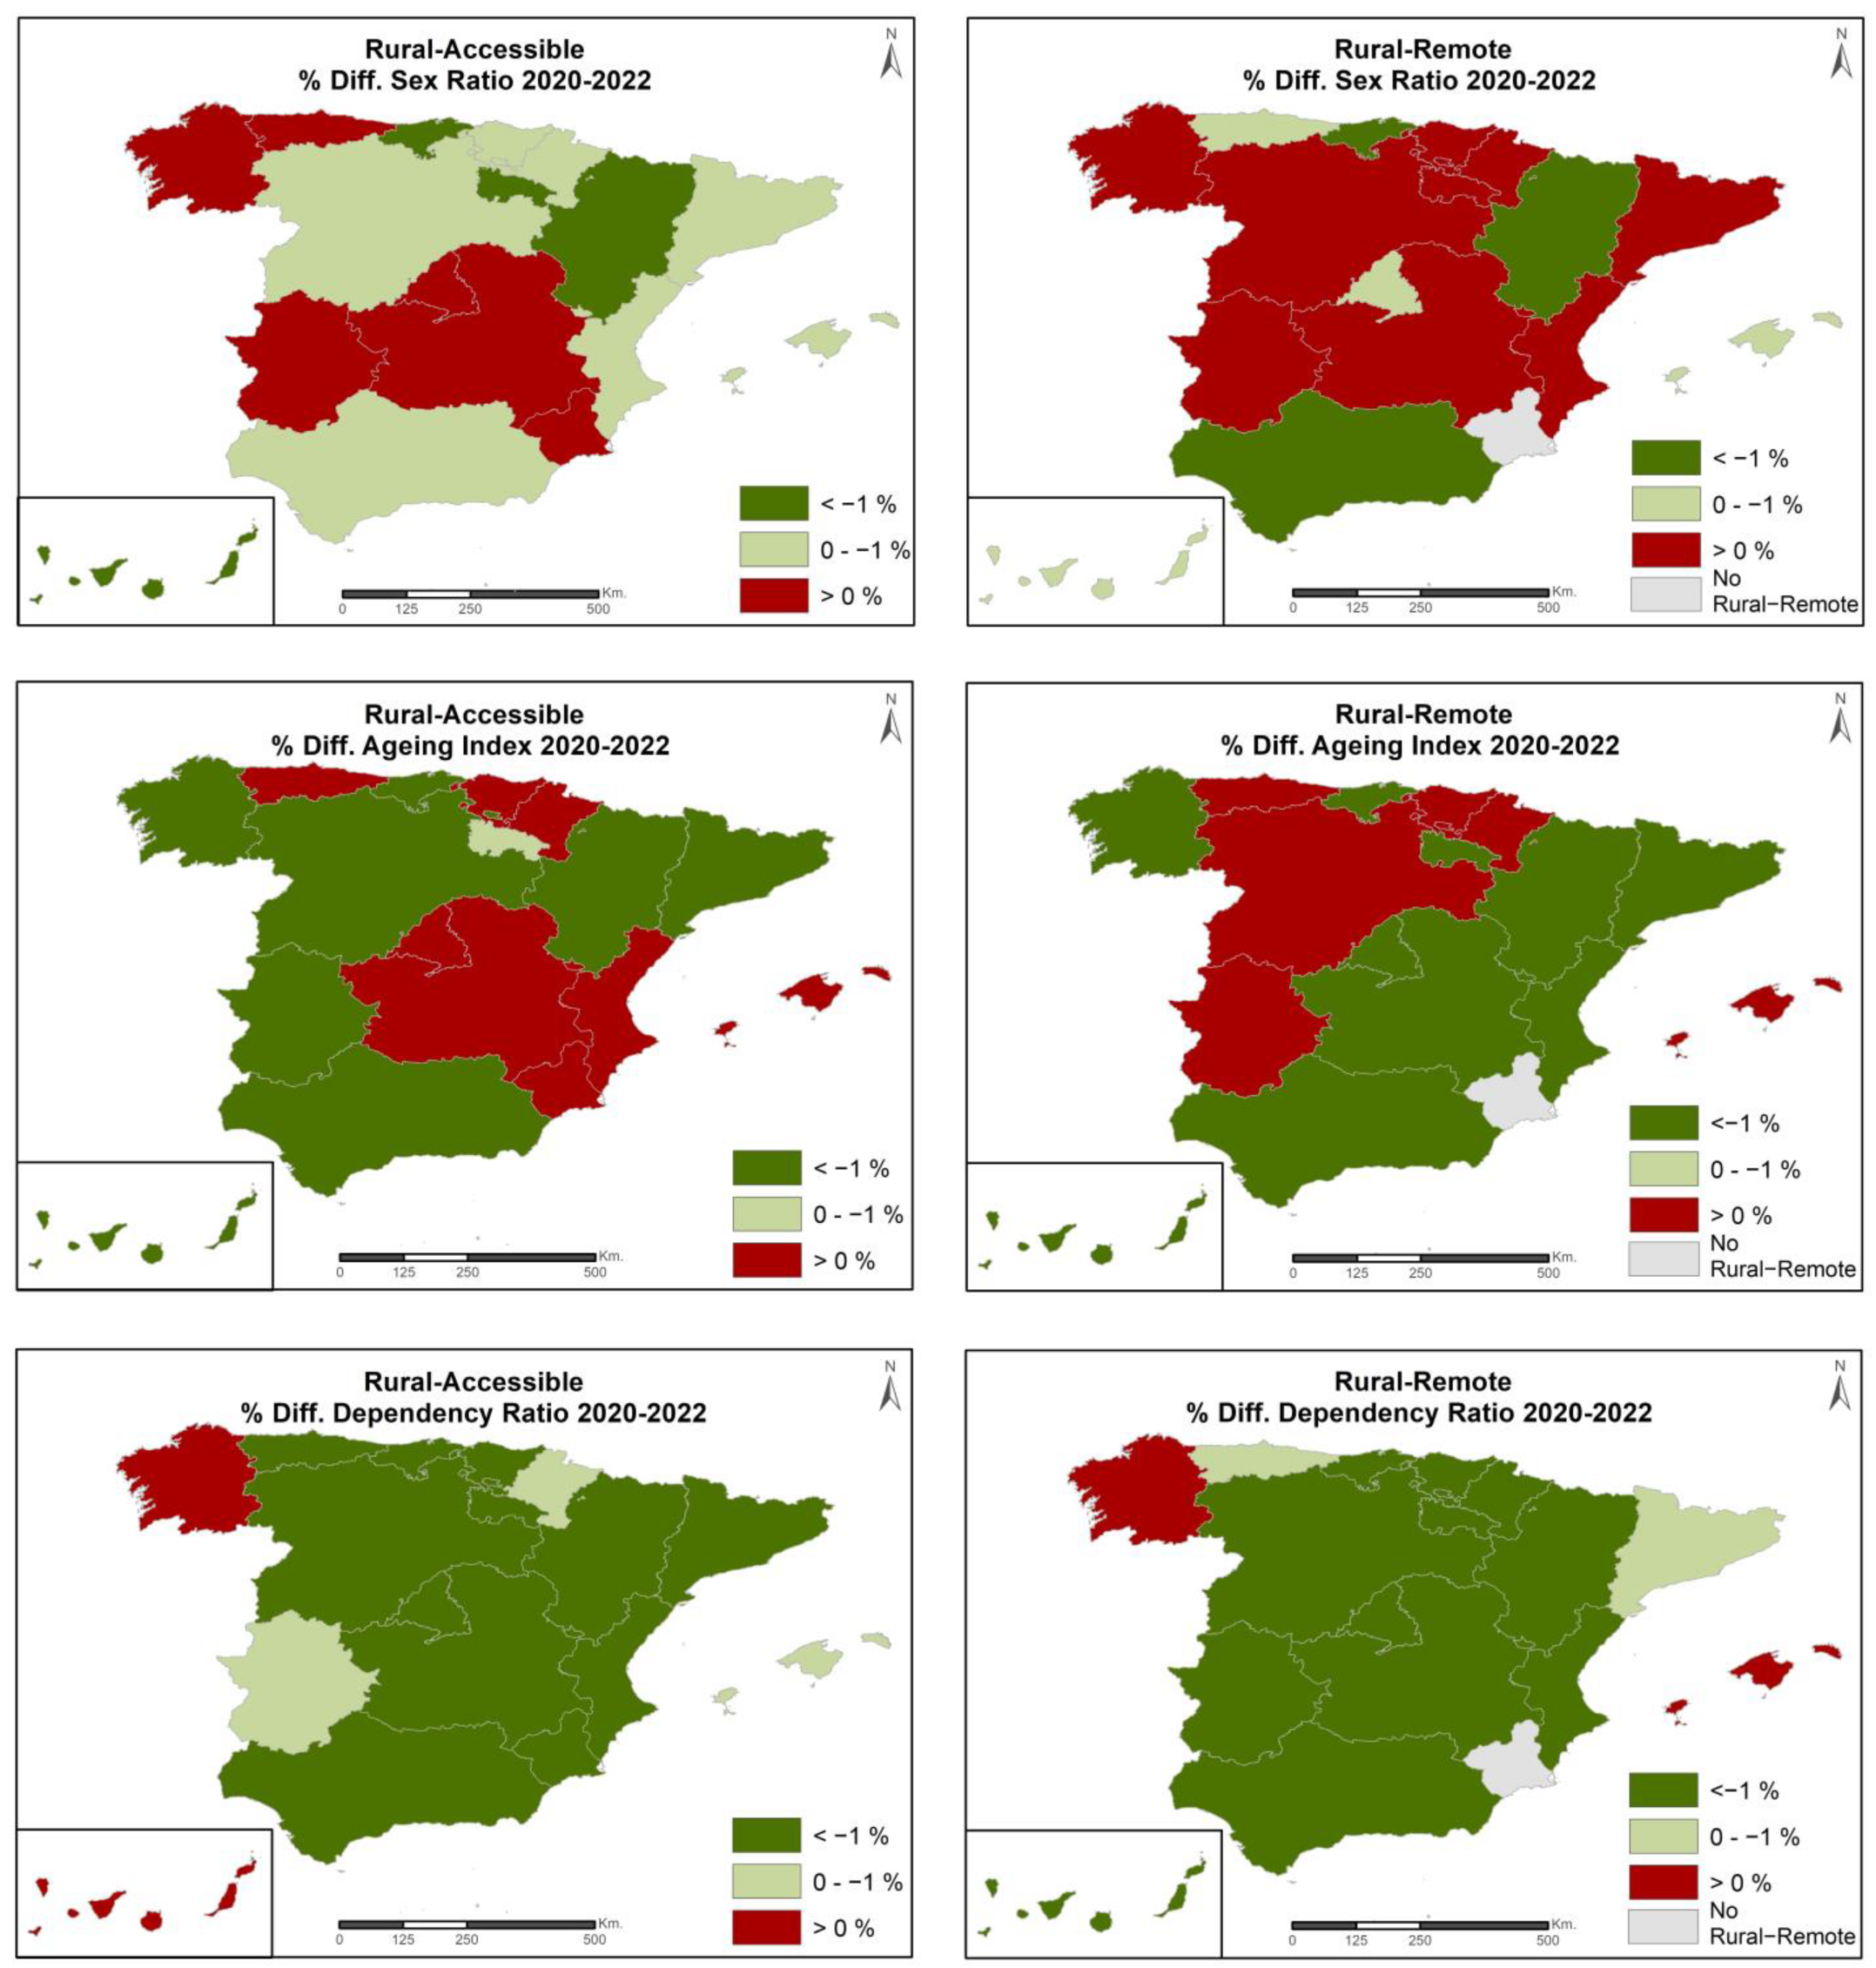
Regarding the behaviour of the indicators in the pandemic and post-confinement period (2020–2022), Figure 16 shows that most of the indicators show negative percentage growth, which indicates that most of them have improved across the board in most of the rural areas of all the autonomous communities, with the results of Andalusia, Aragon, and Cantabria being particularly noteworthy.
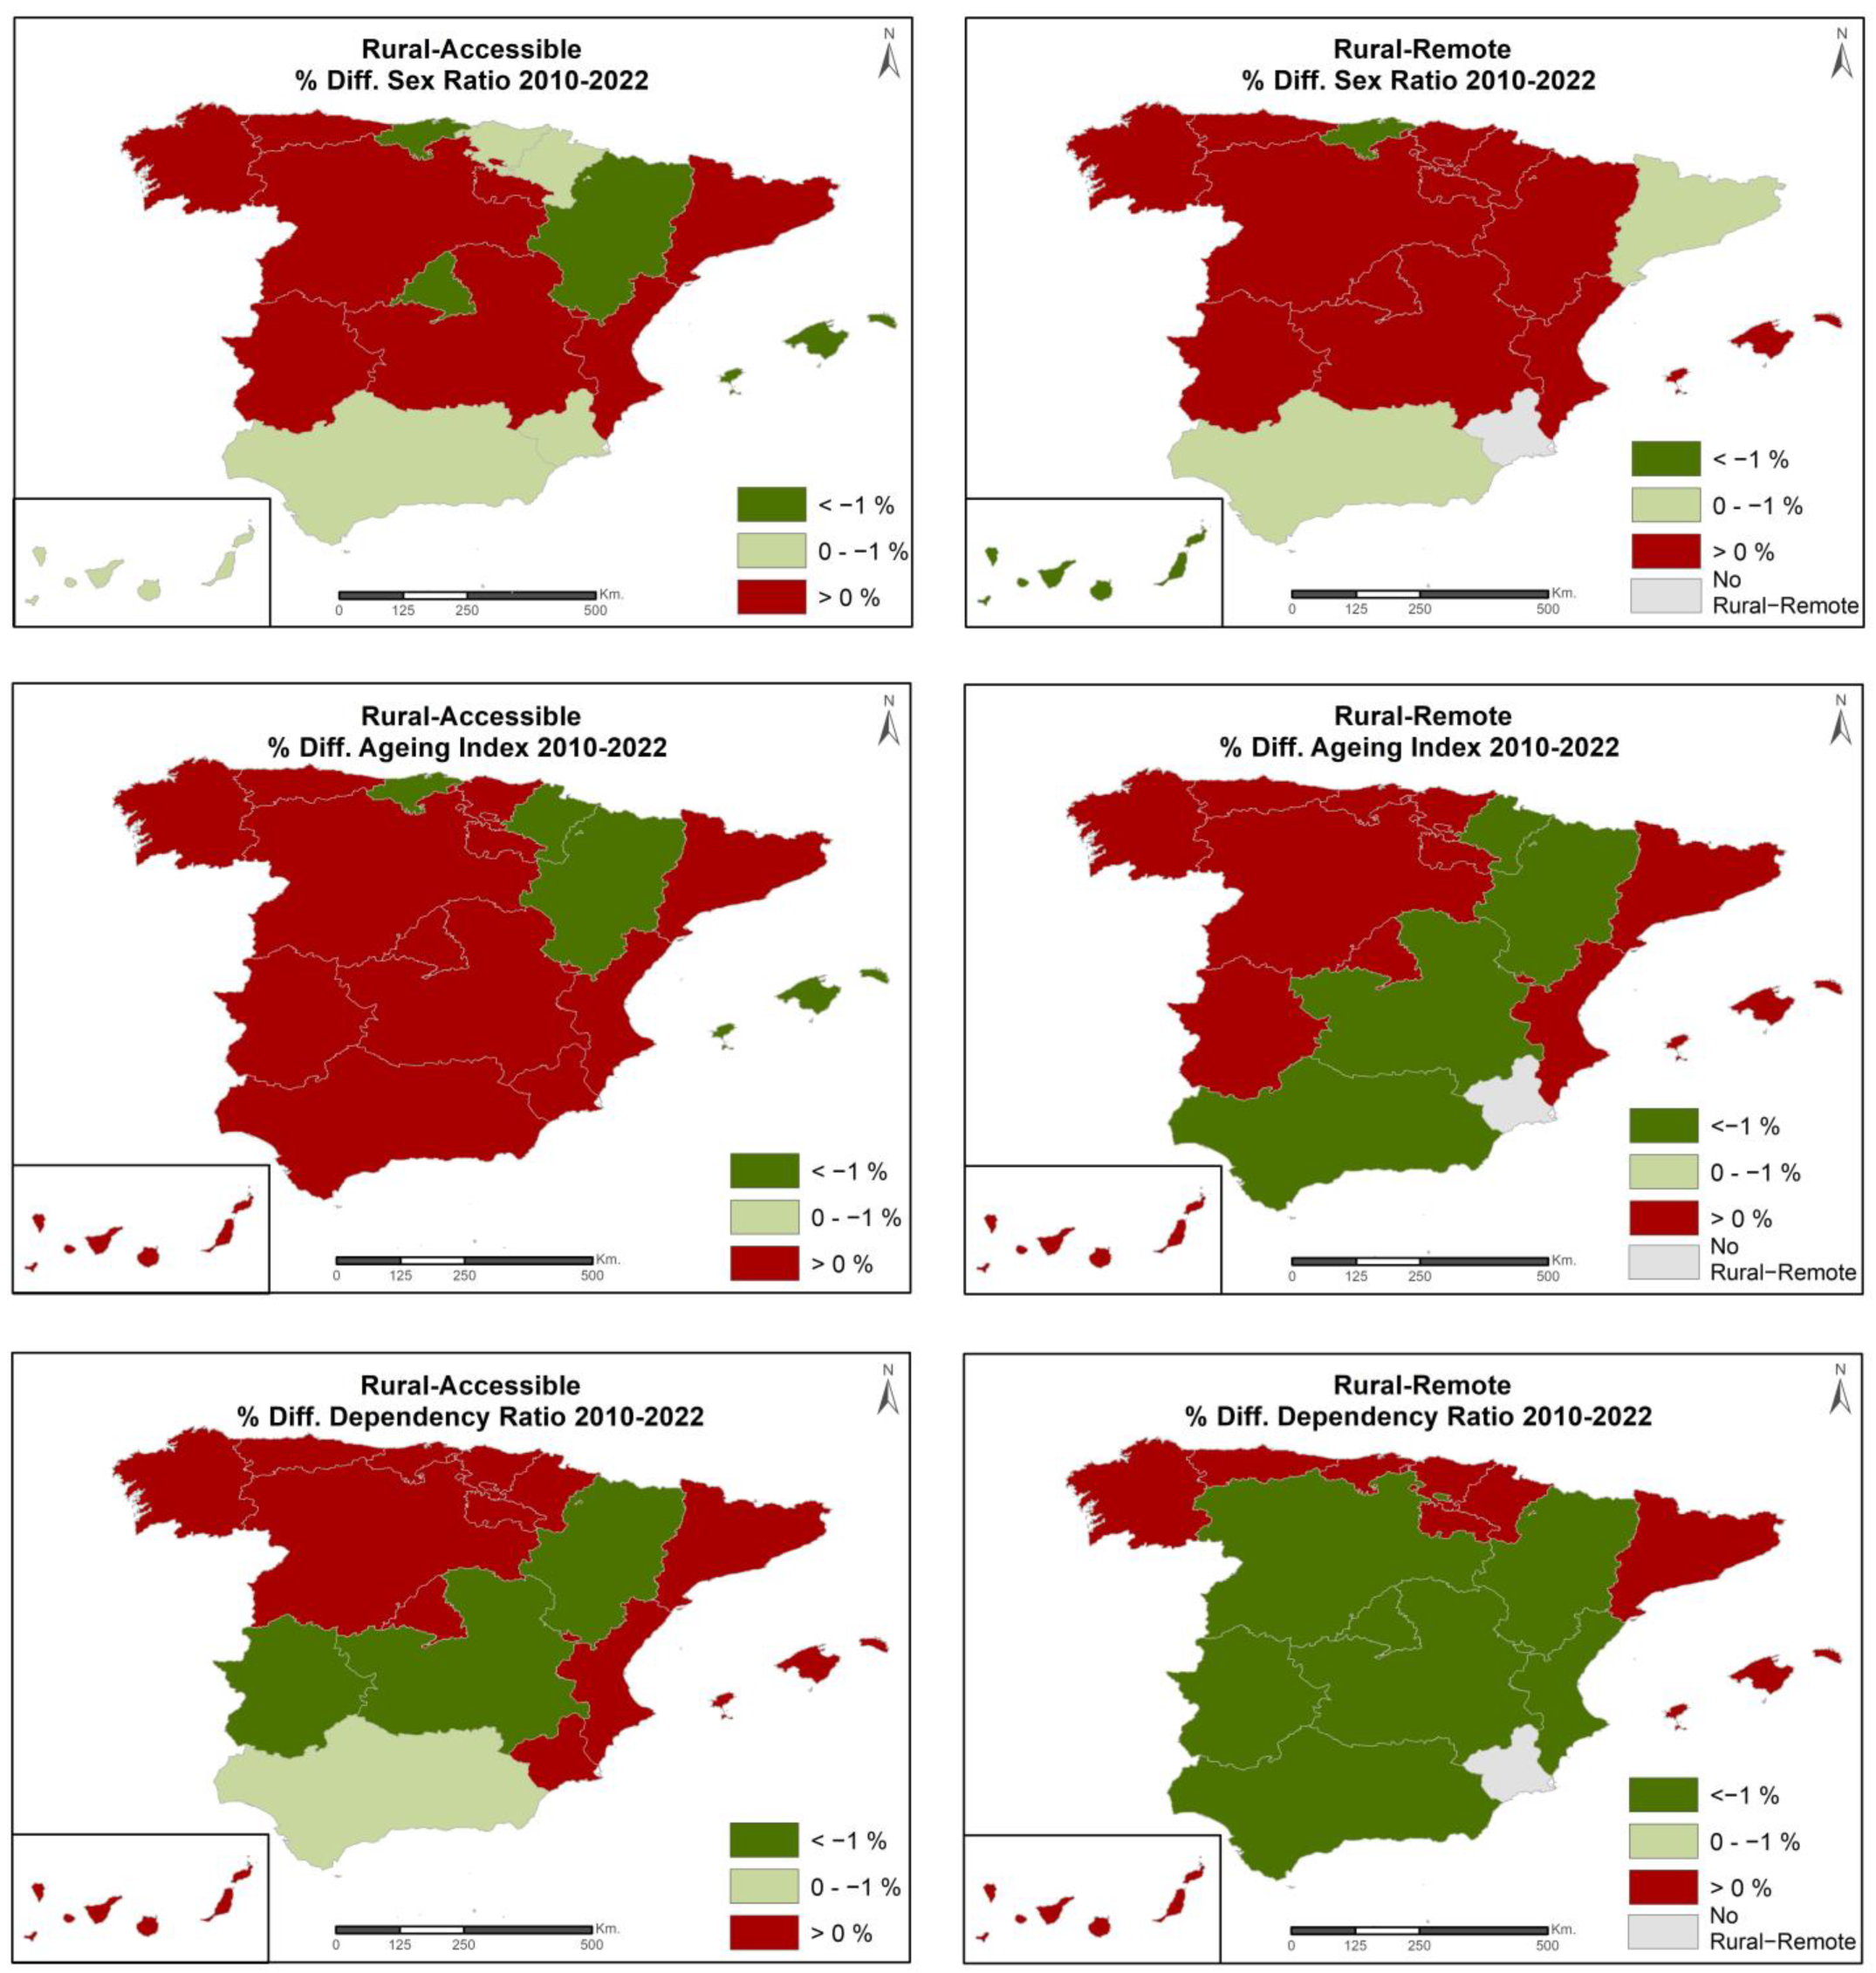
If we check the growth experienced by these indicators and rates from 2010 to 2022 (Figure 17), we can see that the percentage growth is positive in all of them, except in Aragon, which improves its demographic data over these 12 years. Therefore, although the demographic data between 2020 and 2022 are positive for rural areas and show a change in trend, they are still far from changing the demographic results that have prevailed in the last decade in Spanish rural areas.
Finally, in addition to graphically representing the percentage changes of the indicators and rates in the different study periods, it is important to statistically check whether there is a relationship between the 2020–2022 and 2010–2022 growth and the sex ratio, ageing, and dependency results obtained for the year 2022 in Spanish rural municipalities. Table 8 shows the two periods independently by means of a Pearson correlation between ARGR and the different rates and indicators. In the period 2020–2022, except for the sex ratio, which does not show statistical significance with real growth (0.66 significance), the ageing index and the dependency ratio show statistical significance and obtain negative results of −0.196 and −0.170, respectively. This shows an inverse relationship between the variables at the 0.01 significance level. Regarding the relationship between real growth in 2010 and 2022 and the indicators and rates in 2022, all of them show statistical significance. All rates obtain negative results, with the sex ratio being −0.429, the ageing index being −0.421, and the dependency ratio being −0.247, i.e., showing an inverse relationship between the variables with a significance level of 0.01.
4. Discussion
Several insights can be drawn from the extracted results that contribute to the existing debate on the effect that the COVID-19 pandemic has had on the demographic dynamics of the population in Spanish rural areas. The following section analyses the effect of COVID-19 on the major typologies of Spanish municipalities and their relationship with population growth and the evolution of the main demographic indicators of rural environments.
4.1. COVID-19 and Territories
The results on the incidence of COVID-19 by type of municipality have shown an important and statistically significant difference between infections and mortality in rural and urban areas, being higher in the latter.
The Student’s t-test, where rural and non-rural municipalities were related to the incidence of COVID-19 per 100,000 inhabitants, gives a result of −30.11, which indicates that rural areas have the lowest incidence of COVID-19, i.e., they show an inverse relationship. Cohen’s D shows a strong relationship between the variables. The same occurs in the statistical analysis between territorial typology and COVID-19 mortality. The Student’s t-test reflects a negative result of −19.60 with a statistical significance of <0.001, so the interpretation of the t-score indicates that, again, rural areas have had lower COVID-19 mortality, despite having an older population and thus being more vulnerable to the disease. Cohen’s D again shows a strong relationship between the variables. These results are in line with the scientific work and international studies recently published by numerous authors. Thus, in agreement with several authors, the areas most affected were urban areas, mainly owing to the higher population density and the high intensity of mobility and social interactions [11,23,25,26,27,45]. Whereas lower density, more green spaces, use of private transport and fewer shops, and ultimately less contact between people have made rural areas the most effective places against the pandemic [18,26,27,28,46,47]. Therefore, this fact was corroborated in the results of the present study, as open and closed urban areas, as well as intermediate areas, have a higher average number of infections and deaths than rural areas.
4.2. Population Growth and Demographic Indicatos: A Territorial Change in Trend since COVID-19?
In the wake of COVID-19, multiple studies have emerged that point to a change in population dynamics, in which rural territories stop losing population and even receive immigration from urban areas. This paradigm shift is mainly due to two reasons. On the one hand, rural environments have proved to be safer spaces with a lower risk of contagion. On the other hand, the mobility restrictions imposed during the pandemic have been much more bearable in rural environments, where housing is more spacious and the availability of open spaces and green areas is greater than in cities. This has led, as we have seen, to a change in the trend of population growth between 2020 and 2022 in Spanish rural areas, showing significant growth compared with previous periods and, after statistical analysis, showing a significant relationship between growth and territorial typology. In the Student’s t-test, the t-test result is 0.761, which indicates that rural areas have had the greatest increase in population, while non-rural areas have had the least growth or losses. This fact is not exclusive to Spain, but has also been identified in other countries such as the United Kingdom [17], Sweden [18,19], and Japan [21,22]. Therefore, the lesser effects of COVID-19 in Spanish rural areas follow the trend of other homonymous areas.
However, this result is weighed down, to a large extent, by the results for the period 2020–2022, because, during this period, a new change in the trend of population growth is again identified. While, during the period 2020–2022, it was the rural areas that gained the most population while the urban areas lost population, in the period 2021–2022, the remote rural areas again lose population, although to a lesser extent than previously. Similarly, intermediate and urban areas gain in population again, although the growth in the latter is very small.
Therefore, and in accordance with other studies [4,12], between 2020 and 2022, population growth in rural areas is generalised in all of the autonomous communities of Spain. As González-Leonardo also pointed out for the Spanish context [48], both holiday villages with a large number of second homes and rural areas closer to large urban areas and natural landscapes have been the most attractive and, therefore, the ones that have seen the greatest increase in immigration. This evidence is consistent with research in Sweden and the United Kingdom, where departures from densely populated large cities tended to gravitate towards low population density areas close to cities and holiday destinations [18,19]. In addition, national and international authors have found a relationship between population growth in rural areas and their services. In fact, the slower growth of remote rural areas is related to the lack of services and infrastructures such as poor internet connection [48]. This highlights the importance of and need for investment in infrastructure and basic services in rural areas, in order to make the repopulation of these areas a reality. However, this population growth does not correct or modify the trend that these municipalities have been experiencing since 2010. In the last decade, almost 90% of Spanish rural areas have experienced population decline, which is reminiscent of the concept of demographic drain used by Sasone [47]. Such is the population loss of these rural areas that the t-test from growth 2010–2022 shows a T of 10.81 and a strong Cohen’s D relationship between the variables. The interpretation of these results indicates that the areas that have experienced the greatest population growth are the urban and intermediate areas, while the losses have been concentrated in the rural areas, despite the population growth experienced between 2020 and 2022.
For all of these reasons, the change in trend experienced between 2020 and 2022 does not seem to be as clear and lasting as some authors predicted at the beginning of the pandemic [33], as it begins to show signs of weakening, especially in the most remote and remote rural areas, which begin to experience population decline again, although not at pre-pandemic levels.
The analysis of the spatial distribution patterns of population show how pre- and post-confinement population changes have had a direct influence on the territory and the typology municipalities. Between 2018 and 2020, growth in urban areas and loss of population in rural areas was observed. Between 2020 and 2022, growth in rural areas, especially in the peripheral crowns of metropolitan areas, was observed, while population decline was observed in urban areas such as Madrid, Barcelona, and Valencia [4,12,33]. However, this recent process does not break the cumulative trend between 2010 and 2022, where growth in large urban areas and Mediterranean areas was observed, against the emptying of the outer perimeters of metropolitan areas and inland rural areas [17,19].
Therefore, once the health restrictions associated with COVID-19 have ended and in a context of normality such as 2022, population behaviours tend to stabilise and become similar to those prior to the pandemic. In this sense, the results obtained in this research contribute to answering the doubts and hypotheses raised by various authors on the continuity of this change in population dynamics after COVID-19 [12,13,14,26], confirming the cyclical nature of the situation in the Spanish case.
The relationship between COVID-19 incidence and deaths and actual population growth outcomes between 2020 and 2022 is clear and statistically significant. In the case of incidence and ARGR 2020–2022, it obtains a Pearson’s test result of 0.182, while COVID-19 mortality obtains a Pearson’s test result of 0.122. In both cases, the relationship is inverse and is interpreted in the same way; that is, the areas that have had the most relevant population growth are those that have had the lowest incidence, the lowest number of deaths from COVID-19, and fewer restrictions on population and mobility, these being rural areas. On the other hand, urban and intermediate areas have grown the least, as a consequence of the COVID-19 effect and the continuous restrictions that these areas have experienced. This evidence and correlations are on par with those found in the United States, China, and Japan between population flows and the number people infected with COVID-19 [49,50]. This is why the authors do not consider COVID-19 as the main cause of the rural renaissance, but it may have accelerated already existing cultural trends in society. The pandemic can be seen as a reactive motivation for out-migration, beyond traditionally identified incentives and where new preferences take precedence [20,49,50].
Finally, it is important to know whether this population growth has had a direct effect on the main demographic indicators and rates in Spanish rural areas. An improvement and reduction in the sex ratio, ageing, and dependency was observed for the period 2020–2022, but these improvements do not offset the negative effect that these indicators and rates have had throughout the study period (2010–2022). However, the new migration dynamics in rural areas have had a significant effect on indicators and rates in rural areas, which have improved significantly because of the increase in population in highly depopulated areas. From Pearson’s test, it has been possible to verify how there were significant and related changes between population growth in 2020–2022 and the demographic indicators of ageing and dependency, which are statistically significant, but not the same as the sex ratio. In the case of the Pearson correlation between ARGR 2020–2022 and ageing, a relationship of −0.196 was obtained, while with the dependency ratio the result was −0.170; in both cases, its correlation is inverse and its interpretation is that, in those areas where population growth has been positive, the demographic indicators of dependency and ageing have decreased as they have improved. The low population volume in rural areas has allowed the changes in demographic indicators in these areas to be relevant, as the arrival of a small number of inhabitants can relatively and substantially modify the indexes and rates of these municipalities. However, the Pearson correlation between ARGR 2010–2022 and the sex ratio, ageing, and dependency indicators show a statistically significant relationship, with results of −0.429, −0421, and −0.247, respectively, so that, in those municipalities where ARGR has been lower, i.e., where there have been very significant population declines, the demographic indicators have increased considerably, especially in the case of the sex ratio and ageing.
5. Conclusions
The study and analysis of the population dynamics and demographic indicators of the different Spanish municipalities and their differential behaviour between the pre-pandemic and post-confinement periods require greater attention from the academic, political, and institutional world at different levels. For this reason, this article has analysed the impact that COVID-19 has had on the level of infections and deaths in different Spanish autonomous communities, according to the type of municipality (rural/non-rural). On the other hand, the effect of the pandemic on the population trend in rural areas was studied, as well as its impact on some typical demographic indicators of rurality (sex ratio, dependency, and ageing). The results obtained highlight a change in population behaviour in Spain as a whole, especially between 2020 and 2022, where there was a loss or stagnation of population in urban areas and a gain in rural areas. However, this study highlights that this process is beginning to show signs of exhaustion and a return to pre-pandemic population trends is in sight, albeit in a more attenuated form.
Thus, in demographic terms, rural areas have experienced years of population growth linked to COVID-19. The fear of contagion, the search for large and uncongested spaces, the mythification of rural life, the spread of teleworking, and the improvement in telecommunications have been a spur to the constant decline in population in rural municipalities. However, the authors do not consider COVID-19 to be the main cause, although it has contributed to the rural renaissance, as it has accelerated cultural trends already existing in society [48,49,50]. This change in trend appears to have been merely cyclical, as the 2022 data begin to show signs of a return to pre-pandemic population dynamics. During 2022, rural areas have experienced lower population growth and even decreases, although not to pre-pandemic levels, while intermediate and urban areas have once again experienced increases in their population. This fact is also beginning to undermine the good results that could be seen in population growth and, therefore, in the demographic indicators for the 2020–2022 period. The return to normality, the greater cultural and leisure offers in the cities, and the greater presence of work/academic activities is causing the population to return to urban or peri-urban areas and to leave remote rural areas.
Consequently, this study shows the need to continue developing rural areas, which have been seen as useful and necessary for the population in the current scenario of the health crisis. It is thus necessary to continue working on improving the provision of services and infrastructures that improve the quality of life of the local population and attract future inhabitants. In this sense, the existence of good internet connectivity is fundamental for the development of these municipalities, thus the digitalisation of the rural world is a key factor in the evolution and future of these areas, especially because of the normalisation, if not generalisation, of teleworking. All of these actions are important to take advantage of the brake that the pandemic has put on the decline in population in these territories, as everything points to a return to pre-pandemic dynamics.
Finally, future research should analyse whether the accessibility study carried out by the Spanish Government has a clear relationship with the demographic growth that occurred during the pandemic in rural municipalities, as well as analyse the population evolution of these areas in the coming years.
Author Contributions
Investigation, J.J.S. and F.F. All authors have read and agreed to the published version of the manuscript.
Funding
This research was funded by the project Europe’s Regional Partnership for Gender Equality in the Digital Age (EQUALS-EU), reference number 101006396, H2020-SwafS.
Institutional Review Board Statement
Not applicable.
Informed Consent Statement
Not applicable.
Data Availability Statement
The demographic data used in this research are available from the National Institute of Statistics of Spain.
Acknowledgments
Thanks to the Diario.es for the data provided on COVID-19 for Spanish municipalities. In addition, to Mª Dolores Pitarch and Carmen Zornoza for the debate, ideas and support during the research.
Conflicts of Interest
The authors declare no conflict of interest.
References
- Molinero, F.; Alario, M. Ante el reto de la despoblación de la España interior y sus diferencias regionales. In Despoblación y Transformaciones Sociodemográficas de los Territorios Rurales: Los Casos de España, Italia y Francia; Cejudo, E., Navarro, F., Eds.; Universitá de Salento: Lecce, Italy, 2019; Volume 3, pp. 41–70. [Google Scholar]
- Ríos, J.R.; Ruíz, R.; Cejudo, E. La COVID-19 y el éxodo urbano, ¿se ha revertido la tendencia demográfica?: Caso de estudio de Píñar, Granada. In Proceedings of the ¿Renacimiento rural? Los Espacios Rurales en Época de Pos-Pandemia: Actas del XXI Coloquio de Geografía Rural de la AGEIV Coloquio Internacional de Geografía Rural ColoRURAL2022, Santiago de Compostela, Spain, 5–8 October 2022. [Google Scholar]
- Collantes, F.; Pinilla, V. Peaceful Surrender: The Depopulation of Rural Spain in the Twentieth Century; Cambridge Scholars Publishing: Cambridge, UK, 2011. [Google Scholar] [CrossRef]
- Gutiérrez, E.; Moral-Benito, E.; Ramos, R. Tendencias Recientes de la Población en las Áreas Rurales y Urbanas de España; Banco de Españ;a: Madrid, Spain, 2020; p. 40. [Google Scholar]
- Recaño, J. Cambio y continuidades en las migraciones internas en España. In Población y Territorio. España tras la Crisis de 2018; Sempere, J.D., Cortés, C., Cutillas, E., Valero, J.R., Eds.; Editorial Comares: Granada, Spain, 2020; pp. 229–265. Available online: http://rua.ua.es/dspace/handle/10045/115404 (accessed on 15 March 2023).
- Serrano, J.J.; Fajardo, F. Dinámicas demográficas en la España del COVID-19: ¿cambio de tendencia o continuidad en las zonas rurales? In Proceedings of the Actas del I Congreso Interdisciplinar Sobre Despoblación, Madrid, Spain, 11 December 2022. [Google Scholar]
- Serrano, J.; Pitarch Garrido, M.D. Recent demographic trends in Spanish rural areas: Poverty and inequality with gender perspective (1999–2020). In Sustainable Development Goals in Europe, 1st ed.; De Lazaro, M.L., De Miguel, R., Eds.; Springer: Cham, Switerland, 2023; Volume 1, pp. 91–114. [Google Scholar]
- López-Gay, A.; Andújar-Llosa, A.; Salvati, L. Residential mobility, gentrification and neighborhood change in Spanish cities: A postcrisis perspective. Spat. Demogr. 2020, 8, 351–378. [Google Scholar] [CrossRef]
- Torrado, J.M.; Calvache, R.D.; Susino, J. El retorno de la ciudad. La tesis de la recuperación material y simbólica de las ciudades centrales. Rev. Bibliográfica De Geogr. Y Cienc. Soc. 2020, 25, 1–36. [Google Scholar]
- Gil-Alonso, F.; López-Villanueva, C.; Bayona-i-Carrasco, J.; Pujadas, I. Towards an even more spatially diversified city? New metropolitan population trends in the post-economic crisis period. Urban Sci. 2021, 5, 41. [Google Scholar] [CrossRef]
- González-Leonardo, M. Declive demográfico y envejecimiento en las capitales de provincia. Cuad. Geográficos 2021, 60, 168–191. [Google Scholar] [CrossRef]
- González-Leonardo, M.; López-Gay, A.; Newsham, N.; Recaño, J.; Rowe, F. Understanding patterns of internal migration during the COVID-19 pandemic in Spain. Popul. Space Place 2022, 28, e2578. [Google Scholar] [CrossRef] [PubMed]
- Molina, A.; de Pablo, J.; Milán, J.; Caparrós, J.L. COVID-19. ¿Oportunidad para el mundo rural en España? Una reflexión. Col. Econ. Madr. 2020, 170, 167–182. [Google Scholar]
- Oliveres, V.; Sánchez, R. El Mapa del Mayor Éxodo Desde las Grandes Ciudades de la Última Década: Así se ha Movido la Población en la Pandemia. Available online: https://www.eldiario.es/datos/pandemia-provoca-mayor-exodo-ciudades-ultima-decada-espana-rural-espana-vacia_1_8041708.html (accessed on 13 March 2023).
- González-Leonardo, M.; Rowe, F.; Fresolone-Caparrós, A. ¿Renacimiento rural? El aumento de la migración interna a las zonas rurales durante la pandemia de COVID-19. ¿Quién se mudó y dónde? D. Estud. Rural. 2022, 96, 332–342. [Google Scholar] [CrossRef]
- Breuillé, M.-L.; Le Gallo, J.; Verlhiac, A. Migrations résidentielles et crise de la COVID-19: Vers un exode urbain en France? Econ. Et Stat. 2022, 536-537, 59–76. [Google Scholar] [CrossRef]
- Rowe, F.; Calafiore, A.; Arribas-Bel, D.; Samardzhiev, K.; Fleischmann, M. Urban exodus? Understanding human mobility in Britain during the COVID-19 pandemic using Meta-Facebook data. Popul. Space Place 2023, 29, e2637. [Google Scholar] [CrossRef]
- Åberg, H.E.; Tondelli, S. Escape to the Country: A Reaction-Driven Rural Renaissance on a Swedish Island Post COVID-19. Sustainability 2021, 13, 12895. [Google Scholar] [CrossRef]
- Vogiazides, L.; Kawalerowicz, J. Urban exodus in Covid times: Who moves out of the inner city of Stockholm and where do they go? Stockh. Res. Rep. Demogr. 2022, 4, 1–43. [Google Scholar]
- Whitaker, S.D. Did the COVID-19 Pandemic Cause an Urban Exodus? Federal Reserve Bank of Cleveland: Cleveland, OH, USA, 2021. [Google Scholar] [CrossRef]
- Kato, H.; Takizawa, A. Impact of the Urban Exodus Triggered by the COVID-19 Pandemic on the Shrinking Cities of the Osaka Metropolitan Area. Sustainability 2022, 14, 1601. [Google Scholar] [CrossRef]
- Komaki, M.; Kato, H.; Matsushita, D. Why Did Urban Exodus Occur during the COVID-19 Pandemic from the Perspective of Residential Preference of Each Type of Household? Case of Japanese Metropolitan Areas. Sustainability 2023, 15, 3315. [Google Scholar] [CrossRef]
- Borjas, G.J. Demographic determinants of testing incidence and Covid-19 infections in New York City neighborhoods. NBER Work. Pap. 2020, 26952, 1–46. [Google Scholar]
- Brandén, M.; Aradhya, S.; Kolk, M.; Härkönen, J.; Drefahl, S.; Malmberg, B.; Rostila, M.; Andersson, G.; Mussino, E. Residential context and COVID-19 mortality among adults aged 70 years and older in Stockholm: A population-based, observational study using individual-level data. Lancet Healthy Longev. 2020, 1, 80–88. [Google Scholar] [CrossRef]
- Ferrás, C. Ciudades dispersas y aldeas virtuales en la postpandemia del COVID-19. Finisterra 2020, 115, 243–248. [Google Scholar] [CrossRef]
- Florida, R.; Rodríguez-Pose, A.; Storper, M. Cities in a post-COVID world. Urban Stud. 2021, 27, 1–23. [Google Scholar] [CrossRef]
- Shucksmith, M. Re-imaginging the rural: From rural idyll to Good Countriside. J. Rural Stud. 2018, 59, 163–172. [Google Scholar] [CrossRef]
- Rodríguez-Pose, A.; Burlina, C. Institutions and the uneven geography of the first wave of the COVID-19 pandemic. J. Reg. Sci. 2021, 61, 728–752. [Google Scholar] [CrossRef]
- Gobierno de España. Informe de Cobertura de Banda Ancha en España en el año 2021; Ministerio de Asuntos Económicos y Transformación Digital: Madrid, Spain, 2022. Available online: https://avancedigital.mineco.gob.es/banda-ancha/cobertura/Documents/InformeCoberturaBandaAncha2021.pdf (accessed on 13 March 2023).
- Gutiérrez, E.; Moral Benito, E.; Ramos, R. Dinámicas de población durante el COVID-19. Banco De España 2022, 2206, 31. [Google Scholar]
- Fielding, T.; Ishikawa, Y. COVID-19 and migration: A research note on the effects of COVID-19 on internal migration rates and patterns in Japan. Popul. Space Place 2021, 27, e2499. [Google Scholar] [CrossRef] [PubMed]
- Gobierno de España. Cálculo de Distancia a Través de la Red Viaria de la IGR-RT. Informe de Trabajo; Ministerio de Transporte, Movilidad y Agenda Urbana: Madrid, Spain, 2022; Available online: https://storymaps.arcgis.com/stories/662be0691ccd4d6f8d134817c409a356 (accessed on 13 March 2023).
- Ruiz-Martínez, I.; Esparcia, J. Internet Access in Rural Areas: Brake or Stimulus as Post-COVID-19 Opportunity? Sustainability 2020, 22, 9619. [Google Scholar] [CrossRef]
- Nathan, M.; Overman, H. Will coronavirus cause a big city exodus? Environ. Plan. B Urban Anal. City Sci. 2020, 47, 1537–1542. [Google Scholar] [CrossRef]
- Ruiz-Pulpón, A.R.; Ruiz-González, F. Procesos de despoblación en la España interior. La provincia de Ciudad Real como ejemplo. Ager Rev. Estud. Sobre Despoblación Y Desarro. Rural 2021, 33, 183–213. [Google Scholar] [CrossRef]
- Ruiz-Pulpón, A.R.; Martínez, H. Accesibilidad y procesos de despoblación rural: Propuesta metodológica en Castilla-La Mancha (España). Cuad. Geográficos Univ. Granada 2022, 61, 5–23. [Google Scholar] [CrossRef]
- Instituto Nacional de Estadística (INE). Available online: https://www.ine.es (accessed on 3 March 2023).
- Gobierno de España. Comunidades Autónomas. Organización del estado español. Madrid, España. 2023. Available online: https://administracion.gob.es/pag_Home/espanaAdmon/comoSeOrganizaEstado/ComunidadesAutonomas.html (accessed on 10 March 2023).
- Gobierno de España. Entidades Locales. Organización del Estado Español. Madrid, España. 2023. Available online: https://administracion.gob.es/pag_Home/espanaAdmon/comoSeOrganizaEstado/EntidadesLocales.html (accessed on 10 March 2023).
- Goerlich, F.J.; Reig, E.; Cantarino, I. Construcción de una tipología rural/urbana para los municipios españoles. Investig. Geográficas 2016, 35, 151–173. Available online: http://hdl.handle.net/10017/27144 (accessed on 15 March 2023).
- Gobierno de España. La Población de las Áreas Rurales en España Supera los 7.5 millones de Personas. Ministerio de Agricultura, Pesca y Alimentación, Madrid, España. 2021. Available online: https://www.mapa.gob.es/es/prensa/211227poblacionrural_tcm30-583989.pdf (accessed on 10 March 2023).
- Martínez, E.R.; Gisbert, F.J.G.; Martí, I.C. Delimitación de Áreas Rurales y Urbanas a Nivel Local: Demografía, Coberturas del Suelo y Accesibilidad; Fundacion BBVA: Madrid, Spain, 2016; pp. 1–138. Available online: https://www.fbbva.es/publicaciones/delimitacion-de-areas-rurales-y-urbanas-a-nivel-local-demografia-coberturas-del-suelo-y-accesibilidad/ (accessed on 10 March 2023).
- ESPON. European Development Opportunities for Rural Areas (EDORA); Espon: Luxembourg, 2013; pp. 1–84. Available online: https://www.espon.eu/sites/default/files/attachments/EDORA_Final_Report_Parts_A_and_B-maps_corrected_06-02-2012.pdf (accessed on 10 March 2023).
- Gobierno de España. Real Decreto 463/2020, de 14 de Marzo, por el que se Declara el Estado de Alarma para la Gestión de la Situación de Crisis Sanitaria Ocasionada por el COVID-19; Ministerio de la Presidencia, Relaciones con las Cortes y Memoria Democrática: Madrid, Spain, 2020; Available online: https://www.boe.es/buscar/act.php?id=BOE-A-2020-3692 (accessed on 10 March 2023).
- Pardo, H.; Cobo, C. Expandir la universidad más allá de la enseñanzaremota de emergencia. In Ideas Hacia un Modelo Híbrido Post-Pandemia; Outliers School: Barcelona, Spain, 2020. [Google Scholar]
- Glaeser, E. Cities and pandemics have a long history. City J. 2020, 15, 1–8. Available online: https://www.city-journal.org/cities-and-pandemics-have-long-history (accessed on 13 March 2023).
- Sansone-Casaburi, S.; Fernández, J.M.; Marcano, F. Gordoncillo: Una gestión innovadora en el mundo rural. In Proceedings of the Seminario Internacional de Investigación en Urbanismo. XIII Seminario Internacional de Investigación en Urbanismo, Barcelona, Spain, Bogotá, Colombia, 16 June 2021. [Google Scholar] [CrossRef]
- González, M.; Rowe, F.; Fresolone, A.l. Rural revival? The rise in internal migration to rural areas during the COVID-19 pandemic. Who moved and where. J. Rural. Stud. 2022, 96, 332–342. [Google Scholar]
- Jia, J.S.S.; Lu, X.; Yuan, Y.; Xu, G.; Jia, J.M.; Christakis, N.A. Population flow drives spatio-temporal distribution of COVID-19 in China. Nature 2020, 582, 389–394. [Google Scholar] [CrossRef] [PubMed]
- Badr, H.S.; Du, H.R.; Marshall, M.; Dong, E.S.; Squire, M.M.; Gardner, L.M. Association between mobility patterns and COVID-19 transmission in the USA: A mathematical modelling study. Lancet Infect. Dis. 2020, 20, 1247–1254. [Google Scholar] [CrossRef]
Figure 1.
Accessibility of Spanish municipalities in minutes by road. Source: [32] (2022: 2).
Figure 1.
Accessibility of Spanish municipalities in minutes by road. Source: [32] (2022: 2).

Figure 2.
Classification of Spanish municipalities as rural accessible and rural remote. Source: own elaboration from [40].
Figure 2.
Classification of Spanish municipalities as rural accessible and rural remote. Source: own elaboration from [40].

Figure 3.
Distribution of the surface area of the autonomous communities by rural and non-rural municipalities.
Figure 3.
Distribution of the surface area of the autonomous communities by rural and non-rural municipalities.

Figure 4.
Distribution of the population according to rural and non-rural municipalities by autonomous communities.
Figure 4.
Distribution of the population according to rural and non-rural municipalities by autonomous communities.

Figure 5.
Average incidence of COVID-19 per 100,000 inhabitants according to territorial typology.

Figure 6.
Average incidence of COVID-19 per 100,000 inhabitants in the autonomous communities by rural and non-rural municipalities.
Figure 6.
Average incidence of COVID-19 per 100,000 inhabitants in the autonomous communities by rural and non-rural municipalities.

Figure 7.
Percentage evolution of annual real growth rate (ARGR) by territorial typology.

Figure 8.
Percentage evolution of annual real growth rate (ARGR) by territorial typology between 2010 and 2022.
Figure 8.
Percentage evolution of annual real growth rate (ARGR) by territorial typology between 2010 and 2022.

Figure 9.
Annual real growth rate between 2018 and 2020 in rural areas. Legend: Green: positive values. Red: negative values.
Figure 9.
Annual real growth rate between 2018 and 2020 in rural areas. Legend: Green: positive values. Red: negative values.

Figure 10.
Hotspots and coldspots of population growth/decline in relative terms between 2018 and 2020.
Figure 10.
Hotspots and coldspots of population growth/decline in relative terms between 2018 and 2020.

Figure 11.
Annual real growth rate between 2020 and 2022 in rural areas. Green: positive values. Red: negative values.
Figure 11.
Annual real growth rate between 2020 and 2022 in rural areas. Green: positive values. Red: negative values.

Figure 12.
Hotspots and coldspots of population growth/decline in relative terms between 2020 and 2022.
Figure 12.
Hotspots and coldspots of population growth/decline in relative terms between 2020 and 2022.

Figure 13.
Annual real growth rate between 2010 and 2022 in rural areas. Green: positive values. Red: negative values.
Figure 13.
Annual real growth rate between 2010 and 2022 in rural areas. Green: positive values. Red: negative values.

Figure 14.
Hotspots and coldspots of population growth/decline in relative terms between 2010 and 2022.
Figure 14.
Hotspots and coldspots of population growth/decline in relative terms between 2010 and 2022.

Figure 15.
Growth in demographic indicators and rates in rural areas between 2018 and 2020.

Figure 16.
Growth in demographic indicators and rates in rural areas between 2020 and 2022.

Figure 17.
Growth in demographic indicators and rates in rural areas between 2010 and 2022.


| Rates and Indexes | Formula |
|---|---|
| Annual real growth rate (ARGR) | Fp: final population; Ip: initial population; t: interval time |
| Sex rate | P01-01-tmen: population of men resident in the study area on 1 January of year. P01-01-twomen: population of women resident in the study area on 1 January of year. |
| Ageing index | P01-01-t65+: population aged 64 and over, belonging to the study area on 1 January of year t. P01-01-t0–15: population under 16 years of age, belonging to the study area on 1 January of year t. |
| Dependence rate | P01-01-t0–15: population under 16 years of age, belonging to the study area on 1 January of year t. P01-01-t65+: population aged 64 and over, belonging to the study area on 1 January of year t. P01-01-t16–64: population over 15 and under 65, belonging to the study area on 1 January of year t. |
Table 2.
Sample correlation from Student’s t-test between average incidence of COVID-19 per 100,000 inhabitants and territorial typology.
Table 2.
Sample correlation from Student’s t-test between average incidence of COVID-19 per 100,000 inhabitants and territorial typology.
| Levenen’s Test (Significant) | Student’s t-test | Bilateral Significance | Average Difference (Cohen’s D) | |
|---|---|---|---|---|
| <0.001 | Equals variances | −30.11 | 0.000 | −10,329.88 |
| Significant | Strong relationship | |||
Table 3.
Sample correlation from Student’s t-test between COVID-19 death and territorial typology.
| Levenen’s Test (Significant) | Student’s t-test | Bilateral Significance | Average Difference (Cohen’s D) | |
|---|---|---|---|---|
| <0.001 | Equals variances | −19.60 | 0.000 | −18.32 |
| Significant | Strong relationship | |||
Table 4.
Sample correlation from Student’s t-test between annual real growth rate (2020–2022) and territorial typology.
Table 4.
Sample correlation from Student’s t-test between annual real growth rate (2020–2022) and territorial typology.
| Levenen’s Test (Significant) | Student’s t-test | Bilateral Significance | Average Difference (Cohen’s D) | |
|---|---|---|---|---|
| <0.001 | Equals variances | 0.761 | 0.000 | 0.143 |
| Significant | Low relationship | |||
Table 5.
Sample correlation from Student’s t-test between annual real growth (2010–2022) and territorial typology.
Table 5.
Sample correlation from Student’s t-test between annual real growth (2010–2022) and territorial typology.
| Levenen’s Test (Significant) | Student’s t-test | Bilateral Significance | Average Difference (Cohen’s D) | |
|---|---|---|---|---|
| <0.001 | Equals variances | −30.81 | 0.000 | −18.48 |
| Significant | Strong relationship | |||
Table 6.
Pearson’s correlation test between real annual growth (2020–2022) and the incidence of COVID-19 per 100,000 inhabitants.
Table 6.
Pearson’s correlation test between real annual growth (2020–2022) and the incidence of COVID-19 per 100,000 inhabitants.
| Annual Real Growth Rate (2020–2022) | Average Incidence of COVID-19 | ||
|---|---|---|---|
| Annual Real Growth Rate (2020–2022) | Pearson’s Correlation | 1 | −0.182 ** |
| Bilateral Significance | 0.00 | ||
| N | 4268 | 4268 | |
| Average incidence of COVID-19 | Pearson’s Correlation | −0.182 | 1 |
| Bilateral Significance | 0.00 | ||
| N | 4268 | 4268 |
** The correlation is significant at the 0.001 level (bilateral).
Table 7.
Pearson’s correlation test between real annual growth (2020-2022) and COVID-19 death.
| Annual Real Growth Rate (2020–2022) | COVID-19 Death | ||
|---|---|---|---|
| Annual Real Growth Rate (2020–2022) | Pearson’s Correlation | 1 | −0.122 ** |
| Bilateral Significance | 0.00 | ||
| N | 4268 | 4268 | |
| COVID-19 death | Pearson’s Correlation | −0.122 | 1 |
| Bilateral Significance | 0.00 | ||
| N | 4268 | 4268 |
** The correlation is significant at the 0.001 level (bilateral).
Table 8.
Pearson’s correlation test between real annual growth (2020–2022 and 2010–2022) and demographic index (2020–2022 and 2010–2022) in rural municipalities.
Table 8.
Pearson’s correlation test between real annual growth (2020–2022 and 2010–2022) and demographic index (2020–2022 and 2010–2022) in rural municipalities.
| Annual Real Growth Rate (2020–2022) | Annual Real Growth Rate (2010–2022) | ||||
|---|---|---|---|---|---|
| Sex rate (2022) | Pearson’s Correlation | 0.005 | Sex rate (2022) | Pearson’s Correlation | −0.429 * |
| Bilateral Significance | 0.667 | Bilateral Significance | <0.01 | ||
| N | 6716 | N | 6716 | ||
| Ageing Index (2022) | Pearson’s Correlation | −0.196 * | Ageing Index (2022) | Pearson’s Correlation | −0.421 * |
| Bilateral Significance | <0.01 | Bilateral Significance | <0.01 | ||
| N | 6716 | N | 6716 | ||
| Dependency rate (2022) | Pearson’s Correlation | −0.170 * | Dependency rate (2022) | Pearson’s Correlation | −0.247 * |
| Bilateral Significance | <0.01 | Bilateral Significance | <0.01 | ||
| N | 6716 | N | 6716 |
* The correlation is significant in the 0.001 level (bilateral).
Disclaimer/Publisher’s Note: The statements, opinions and data contained in all publications are solely those of the individual author(s) and contributor(s) and not of MDPI and/or the editor(s). MDPI and/or the editor(s) disclaim responsibility for any injury to people or property resulting from any ideas, methods, instructions or products referred to in the content. |
© 2023 by the authors. Licensee MDPI, Basel, Switzerland. This article is an open access article distributed under the terms and conditions of the Creative Commons Attribution (CC BY) license (https://creativecommons.org/licenses/by/4.0/).
Share and Cite
MDPI and ACS Style
Serrano, J.J.; Fajardo, F. Impact of COVID-19 on the Territory and Demographic Processes: A View from Spanish Rural and Urban Areas. Sustainability 2023, 15, 7899. https://doi.org/10.3390/su15107899
AMA Style
Serrano JJ, Fajardo F. Impact of COVID-19 on the Territory and Demographic Processes: A View from Spanish Rural and Urban Areas. Sustainability. 2023; 15(10):7899. https://doi.org/10.3390/su15107899
Chicago/Turabian StyleSerrano, J. Javier, and Félix Fajardo. 2023. "Impact of COVID-19 on the Territory and Demographic Processes: A View from Spanish Rural and Urban Areas" Sustainability 15, no. 10: 7899. https://doi.org/10.3390/su15107899
Note that from the first issue of 2016, this journal uses article numbers instead of page numbers. See further details here.