Next Article in Journal
ADSWIM and WATERCARE Projects Meet Kids and Youth: The Challenge of Bringing the World of Research to School to Merge Research, Education and Communication
Next Article in Special Issue
MIMS as a Low-Impact Tool to Identify Pathogens in Water
Previous Article in Journal
Quantifying the Trends and Drivers of Ice Thickness in Lakes and Rivers across North America
Previous Article in Special Issue
Evaluation of Pre-Analytical and Analytical Methods for Detecting SARS-CoV-2 in Municipal Wastewater Samples in Northern Italy
 
 
water-logo
Article Menu

Article Menu

Article

Extensive Wastewater-Based Epidemiology as a Resourceful Tool for SARS-CoV-2 Surveillance in a Low-to-Middle-Income Country through a Successful Collaborative Quest: WBE, Mobility, and Clinical Tests

by
Juan Eduardo Sosa-Hernández
1,†,
Mariel Araceli Oyervides-Muñoz
1,†,
Elda M. Melchor-Martínez
1,
Erin M. Driver
2,
Devin A. Bowes
2,3,
Simona Kraberger
4,
Sofia Liliana Lucero-Saucedo
1,
Rafaela S. Fontenele
4,5,
Lizeth Parra-Arroyo
1,
LaRinda A. Holland
4,
Samantha Ayde Peña-Benavides
1,
Melanie Engstrom Newell
2,3,
Manuel Martínez-Ruiz
1,
Sangeet Adhikari
2,6,
Laura Isabel Rodas-Zuluaga
1,
Rahul Kumar
2,
Itzel Y. López-Pacheco
1,
Carlos Castillo-Zacarias
7,
Hafiz M. N. Iqbal
1,
Efrem S. Lim
4,5,
Daniel Salas-Limón
8,
Arvind Varsani
4,5,
Rolf U. Halden
2,6,9,* and
Roberto Parra-Saldívar
1,*
add Show full author list remove Hide full author list
1
Tecnologico de Monterrey, School of Engineering and Sciences, Monterrey 64849, Mexico
2
Biodesign Center for Environmental Health Engineering, The Biodesign Institute, Arizona State University, Tempe, AZ 85287, USA
3
School for Engineering of Matter, Transport, and Energy, Arizona State University, Tempe, AZ 85287, USA
4
The Biodesign Center for Fundamental and Applied Microbiomics, Arizona State University, Tempe, AZ 85281, USA
5
School of Life Sciences, Arizona State University, Tempe, AZ 85281, USA
6
School of Sustainable Engineering and the Built Environment, Arizona State University, Tempe, AZ 85281, USA
7
Facultad de Ingenieria Civil, Departamento de Ingenieria Ambiental, Universidad Autonoma de Nuevo Leon, Ciudad Universitaria S/N, San Nicolás de los Garza 66455, Mexico
8
Facultad de Ingeniería Civil, Universidad Autonoma de Nuevo Leon, UANL, Av. Universidad s/n. CD. Universitaria, San Nicolás de los Garza 66455, Mexico
9
OneWaterOneHealth, Arizona State University Foundation, Tempe, AZ 85287, USA
*
Authors to whom correspondence should be addressed.
These authors contributed equally to this work.
Water 2022, 14(12), 1842; https://doi.org/10.3390/w14121842
Submission received: 5 May 2022 / Revised: 25 May 2022 / Accepted: 31 May 2022 / Published: 8 June 2022
(This article belongs to the Special Issue Pathogen Detection and Identification in Wastewater)

Abstract

:
The COVID-19 pandemic has challenged healthcare systems worldwide. Efforts in low-to-middle-income countries (LMICs) cannot keep stride with infection rates, especially during peaks. A strong international collaboration between Arizona State University (ASU), Tec de Monterrey (TEC), and Servicios de Agua y Drenaje de Monterrey (Local Water Utilities) is acting to integrate wastewater-based epidemiology (WBE) of SARS-CoV-2 in the region as a complementary approach to aid the healthcare system. Wastewater was collected from four sewer catchments in the Monterrey Metropolitan area in Mexico (pop. 4,643,232) from mid-April 2020 to February 2021 (44 weeks, n = 644). Raw wastewater was filtered and filter-concentrated, the RNA was extracted using columns, and the Charité/Berlin protocol was used for the RT-qPCR. The viral loads obtained between the first (June 2020) and second waves (February 2021) of the pandemic were similar; in contrast, the clinical cases were fewer during the first wave, indicating poor coverage. During the second wave of the pandemic, the SARS-CoV-2 quantification in wastewater increased 14 days earlier than the COVID-19 clinical cases reported. This is the first long-term WBE study in Mexico and demonstrates its value in pandemic management.

Graphical Abstract

1. Introduction

The COVID-19/SARS-CoV-2 pandemic is responsible for more than 5 million deaths worldwide according to WHO data [1]. In Mexico, more than 3.8 million cases were reported, with 289,811 deaths since the first case was confirmed in the country on 27 February 2020 [1]. To access a confirmed diagnostic test by public health services in Mexico, it is mandatory to have multiple symptoms. However, according to the CDC, symptoms of COVID-19 may appear 2–14 days after exposure to the virus, which represents a non-diagnostic period for the infected population, increasing the risk of spreading the virus [2]. Additionally, less affluent communities often do not have many testing sites or easy access to those sites in their area or do not have the option to work from home to feed their families. In low-to-middle-income countries (LMICs), access to any COVID-19 test, including PCR testing, is lower and does not cover most of the population besides healthcare institutions’ efforts. Mexico has 0.09 clinical tests per thousand people compared with 2.44 in the US, which is replicated in similar economies. Therefore, lower accessibility results in a higher clinical test positivity, which indicates that the authorities are only testing the sickest patients and/or people who seek out medical attention [3].
This year, the National Institute of Statistics and Geography (INEGI) [4,5,6] reported that 31 million of the working-age Mexican population are engaged in occupations in the informal employment sector without options to stay at home for quarantine. Additionally, more than 50% do not have access to health services, which can increase the risk for rapid viral transmission within and between communities. Furthermore, the described situation poses major challenges for epidemiologists who are trying to understand the dynamics of transmission. Individualized testing provides insight into who is currently infected but does not always capture people who are asymptomatic or still developing symptoms.
The Public Education Secretary set forward a vacation period of one month, beginning 14 March 2020, at the beginning of the pandemic, based on the number of increasing clinical cases reported across the country. The federal government established a mandatory quarantine period on 26 March 2020, where all non-essential activities were suspended. The State’s Health Secretary of Nuevo Leon, along with the Nuevo Leon government, applied different restrictions to mobility to reduce the increase in COVID-19 cases in the state of Nuevo Leon at that time. On 1 July, the first reopening of the economy occurred, which led to an increase in the number of cases in Monterrey and its metropolitan area. As a result, the State’s Health Secretary and Nuevo Leon’s government applied new mobility restrictions, which included reducing the capacity of all businesses, scheduled restrictions, and weekend closures. The presented actions were attempts to mitigate the viral spread and provide a buffer for overwhelmed local healthcare systems.
A late response to assessing, mitigating, and preventing the community spread of the virus could be avoided by integrating alternative epidemiological surveillance strategies, including the use of wastewater-based epidemiology. This approach is based on the chemicals and biomarkers present in the urine and feces in raw wastewater to obtain qualitative and quantitative data on the activity of inhabitants within a given wastewater catchment. This technology was applied for norovirus, hepatitis A virus, and poliovirus detection [7] Water contaminated by nonenveloped viruses could be a potential fomite when a poor plumbing system easily generates aerosols and could represent a public health issue [8]. However, SARS-CoV-2-positive feces from COVID-19 patients were used to infect Vero E6 cells to determine the presence of infectious SARS-CoV-2 particles. The isolated viral particles showed no cytopathic effect on these cells, and SARS-CoV-2 was not detected in the supernatants, suggesting the absence of infective viral particles [9].
Recently, it was used for countries such as Italy [10,11,12], Australia [7], Germany [13], Spain [14,15,16], India [17], the Netherlands [18] USA [19,20,21,22,23], France [24,25], Ecuador [26], Israel [27], Turkey [28], Japan [29], and Brazil [30] to detect SARS-CoV-2 in wastewater.
In this study, a previously established collaboration between Arizona State University and Tech de Monterrey [31] was rapidly adapted to implement wastewater surveillance to monitor SARS-CoV-2 in wastewater throughout Nuevo León state, the third-largest metropolitan area in Mexico (Figure 1). In 2010, Nuevo León was reported as a predominantly low-to-middle-income city with a total of 4,689,601 inhabitants in an area of 6357 people per km2 (INEGI). The aims of this study were to (i) determine the feasibility of monitoring the virus in wastewater, (ii) assess spatial and temporal wastewater trends throughout the area, and (iii) compare these trends with available clinical data and mobility rates in other low-to-middle-income country (LMIC) populations.

2. Materials and Methods
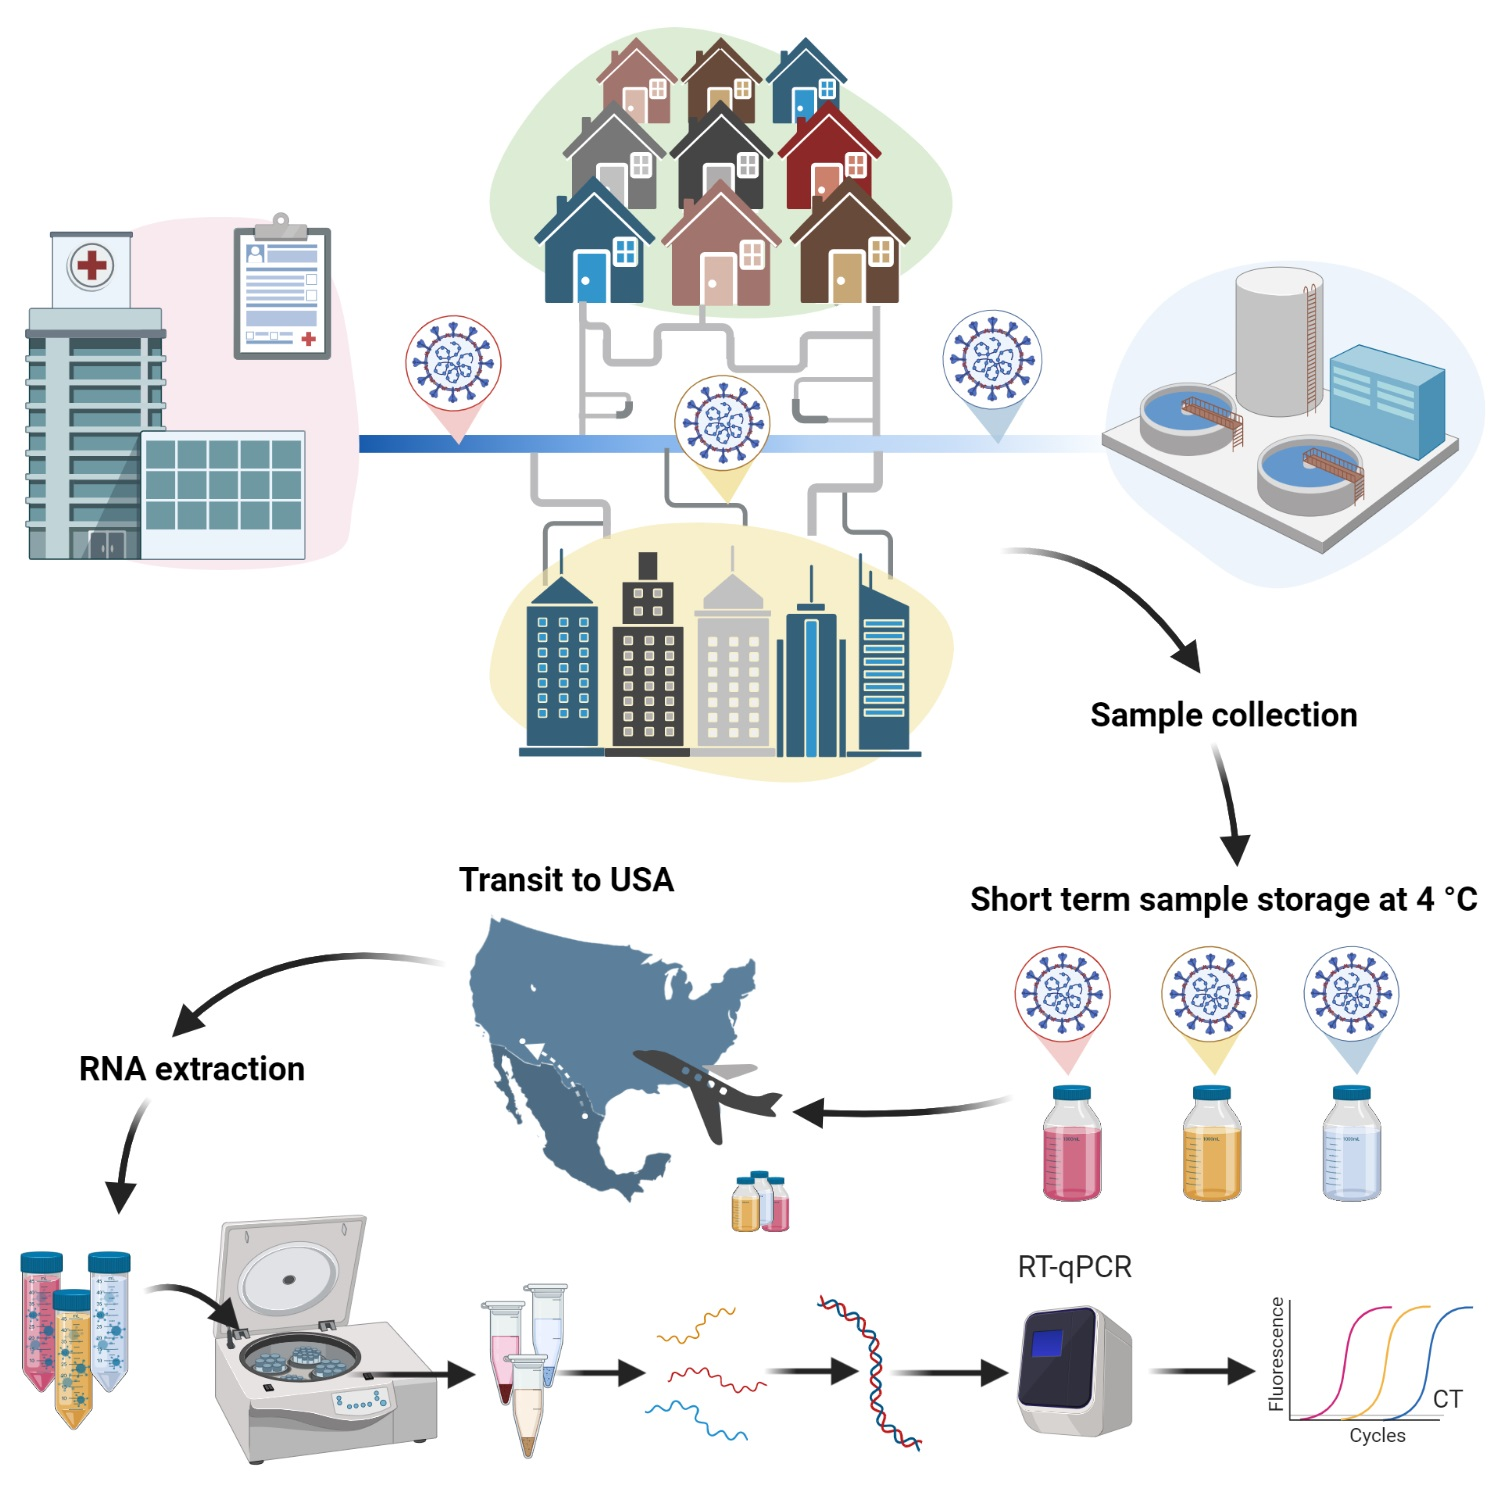
2.1. Study Area

The study area covered part of the Monterrey Metropolitan Area (MMA), which is located in the northeast of México in the state of Nuevo León. The municipalities investigated in this study were Apodaca, Garcia, San Pedro Garza García, General Escobedo, Guadalupe, Juárez, San Nicolás de los Garza, Monterrey, El Carmen, Pesquería, and Santa Catarina. This total area had a population of 4.6 M inhabitants and a population density of 6357 inhabitants per km2. Four wastewater treatment plants were sampled; they had the following served populations: Norte with 1,139,123 people (25°47.860′ N, 100°17.483′ W), Noreste with 476,695 (25°48′28.3″ N, 100°09′58.2″ W), Dulces Nombres with 1,695,589 (25°44′16.3″ N, 100°04′09.5″ W), and Cadereyta with 122,337 (25°35′10.0″ N, 99°58′28.8″ W). The population in each catchment area per WWTP does not correspond with the municipality area (as shown in Figure 1). The program ArcGis Pro (version 2.8) was used to determine the exact population in these areas. In short, the shapefiles (geographic feature format) of the municipalities were downloaded from INEGI (2016) [4] at the level of residential blocks, which was the smallest unit for mapping found in the INEGI data. This data was uploaded to ArcGis Pro and matched with the corresponding WWTP area. Afterward, the population data were updated with the most recent census, which was published this year (INEGI, 2021) [4]. Average daily wastewater flows discharged to each WWTP range were between 17,492 and 605,290 m3/d. Data obtained from the catchment area of each WWTP were provided by Servicios de Agua y Drenaje de Monterrey.

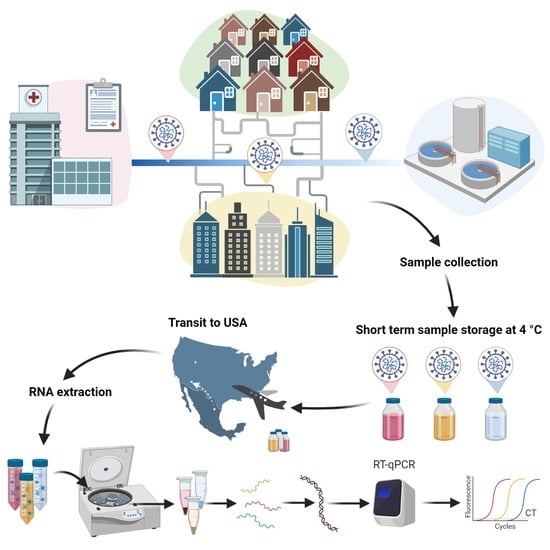
2.2. Sample Collection, Storage, and Shipment

Samples of wastewater influent were collected at each wastewater treatment plant (WWTP) after its primary screening. The sampling method consisted of 1 L grab samples collected each hour, which were used to create a 24 hr composite sample with added volumes weighted according to the corresponding flow rate; the final sample volume was 2 L. Samples were collected in high-density polyethylene (HDPE) bottles and stored on ice at 4 °C until subsequent compositing. Sample collection occurred on Sundays, after which, samples were kept at 4 °C and subsequently shipped to ASU on Tuesday in a cold chain. Shipment was made with an express (next-day) service. The disposable insulator box included ice and gel bags to maintain appropriate temperature and prevent degradation.

2.3. Sample Processing and Analysis

The methodological details were previously published [32,33]. Briefly, raw wastewater was filtered using a two-step process: 0.45 µm polyethersulfone (PES) membrane filter unit (Fisher Scientific, Lenexa, KS, USA), then a 0.22 µm Minisart® PES syringe filter (Sartorius, Bohemia, NY, USA). The filtrate was concentrated on Amicon® ultra 15 centrifugal filters with a 10,000 molecular weight cutoff (MWCO) (Millipore Sigma, Burlington, MA, USA) and extracted using a Qiagen Rneasy Mini Kit (Qiagen, Germantown, MD, USA) following a modified version of the RNA purification. Reverse transcriptase–quantitative polymerase chain reaction (RT-qPCR) was performed on an Applied Biosystems QuantStudioTM 3 Real-Time PCR System with the QuantStudio Design and Analysis Software 1.3 (Thermo Fisher Scientific, Waltham, MA, USA) using a SuperScript™ III One-Step RT-PCR System with Platinum™ Taq DNA Polymerase (Invitrogen, Carlsbad, CA, USA) and the Charité/Berlin (World Health Organization) protocol primer and probe E (envelope) gene target (Integrated DNA Technologies, Coralville, IA, USA).

3. Results

The goal of this study was to use an existing international collaborative network in the US and Mexico to implement SARS-CoV-2 monitoring in wastewater in predominantly low-to-middle-income cities to aid in the public health response.

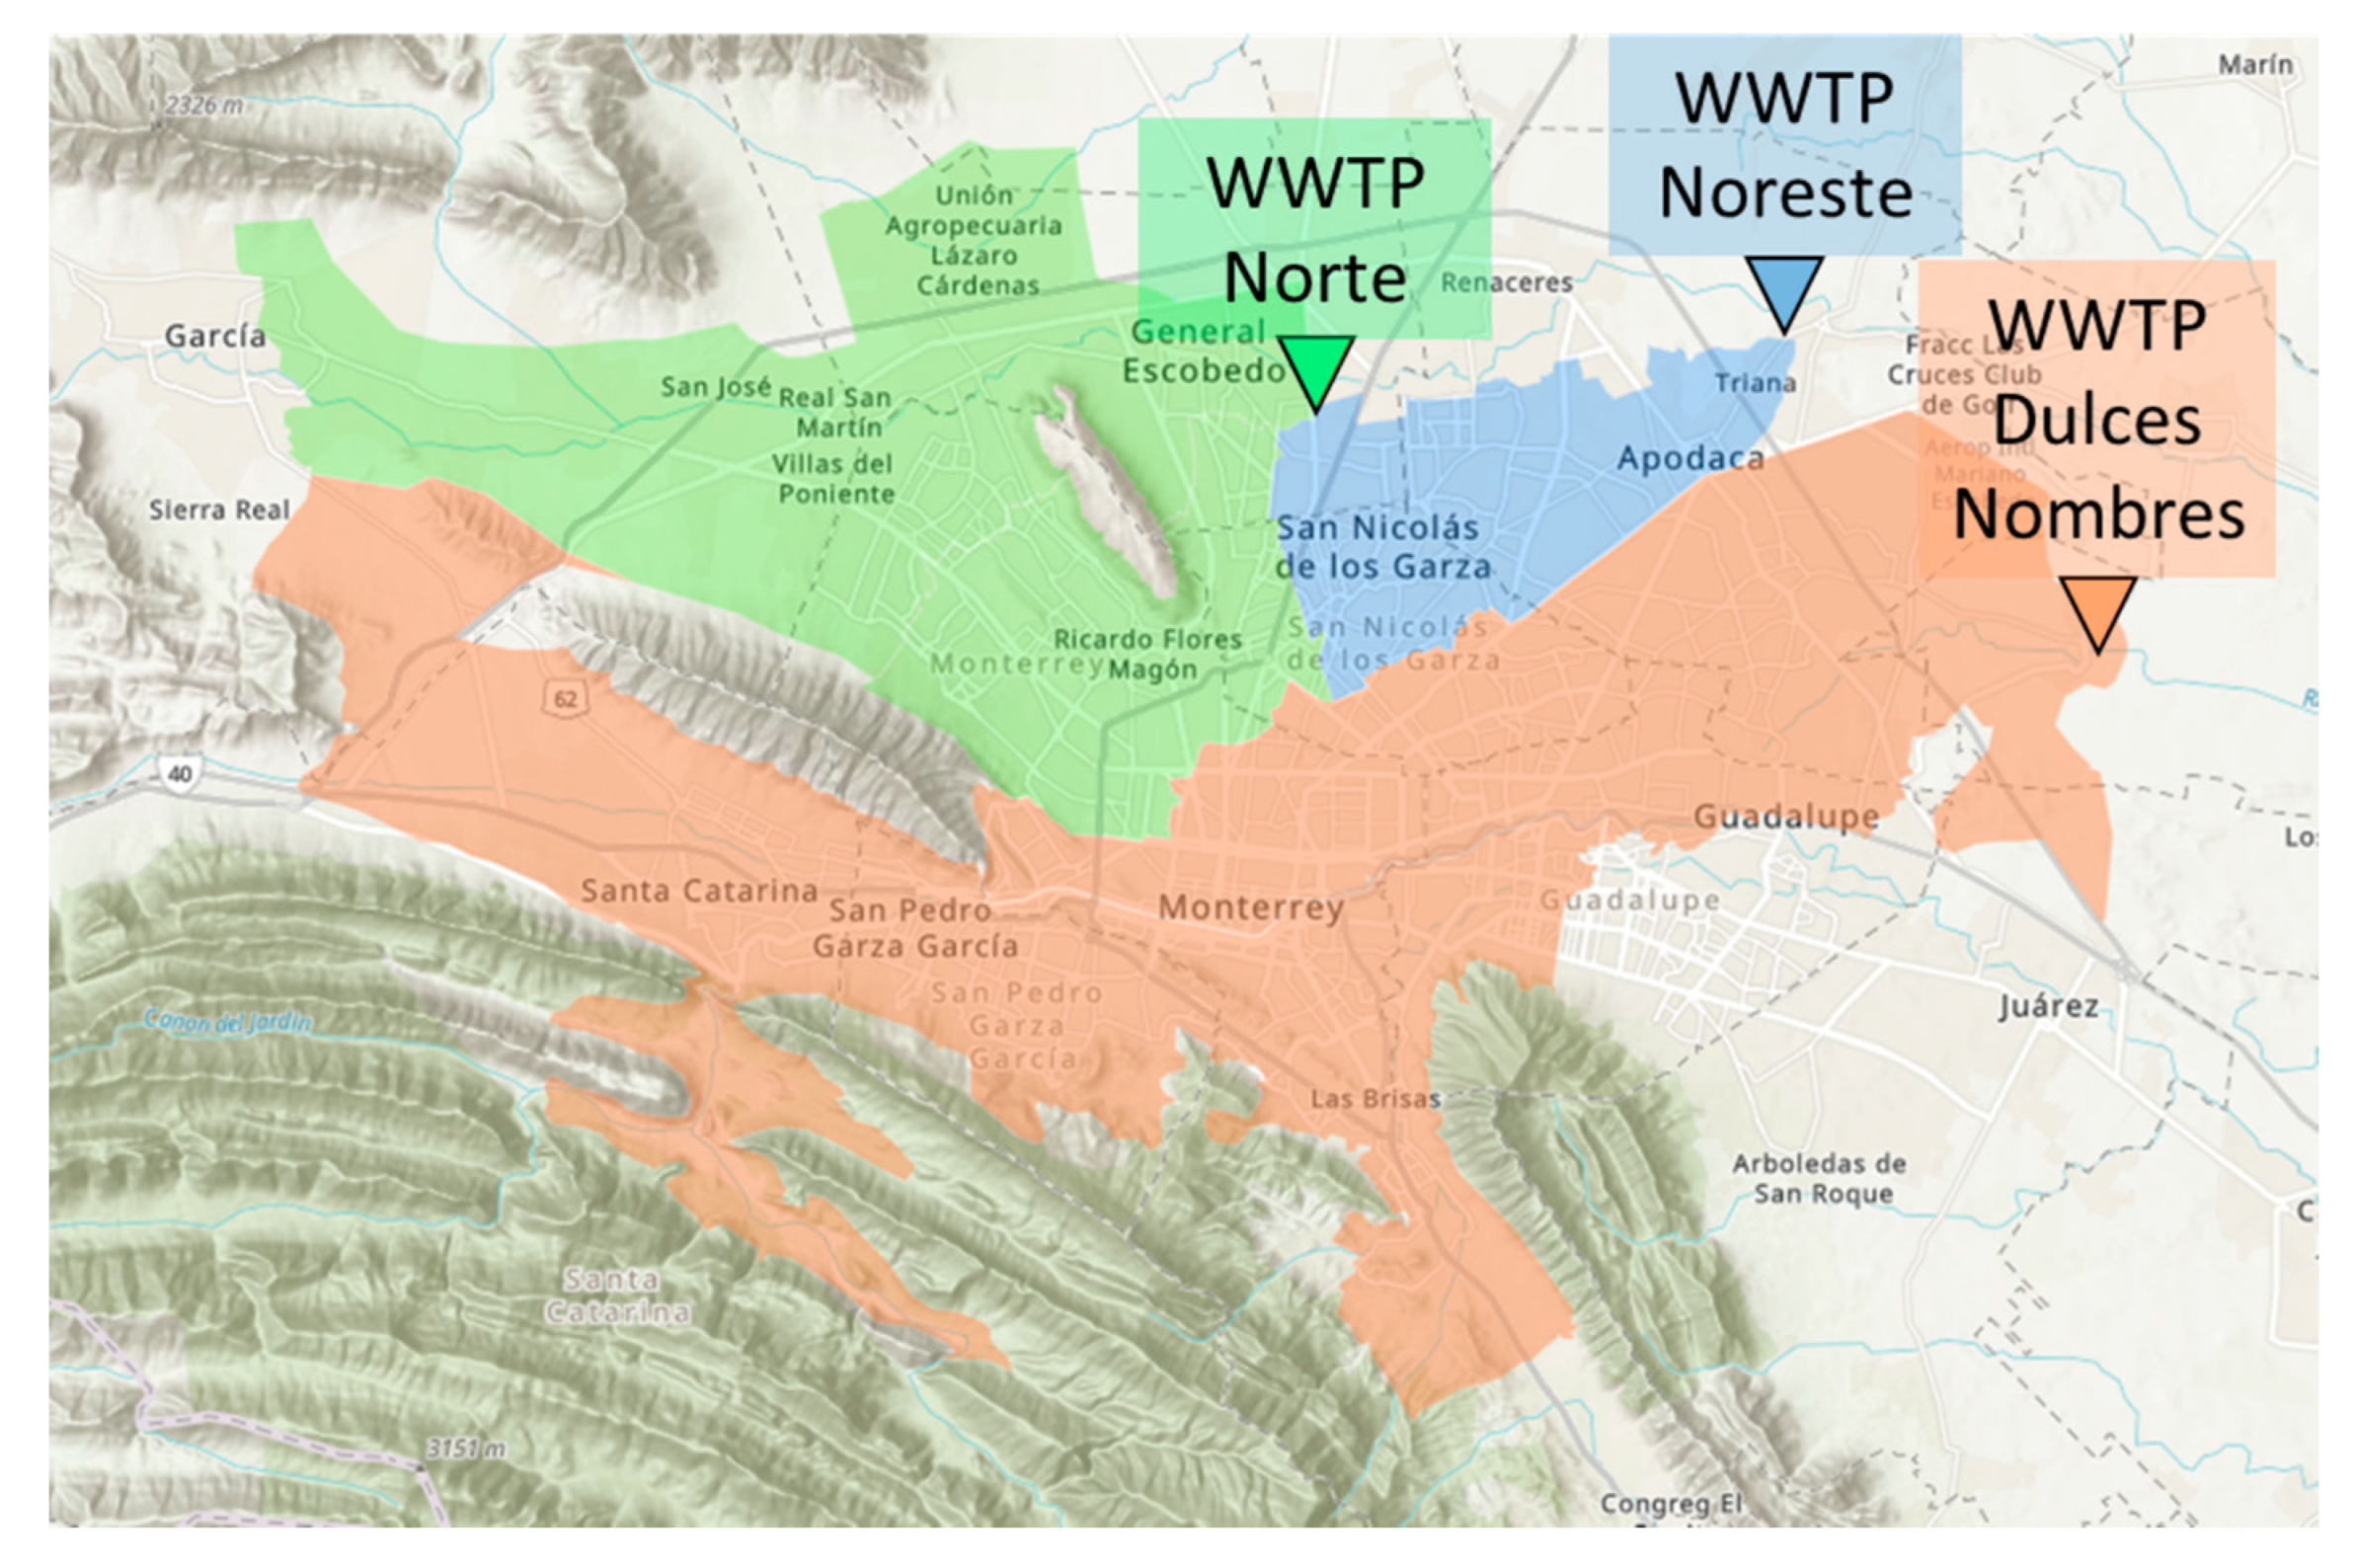
3.1. SARS-CoV-2 in Wastewater in the Monterrey Metropolitan Area

The sewer network dedicated to the Monterrey metropolitan area was composed of three catchment areas across several municipalities presented in Figure 1; from largest to smallest catchment size, this involved Dulces Nombres, Norte, and Noreste, serving a total of 4.34 million people, while the fourth location corresponds to Cadereyta catchment (not included in the figure, located at coordinates: 25.585683, −99.974523). Wastewater samples were analyzed from 16 April 2020 to 31 January 2021, with the first SARS-CoV-2 genome copies detected on 27 June from three WWTPs including: “Dulces Nombres” (“DNo”, which partially includes the Apodaca, Monterrey, Juárez, Santa Catarina, San Pedro Garza García, Pesquería, and Guadalupe municipalities), “Noreste” (“Nes”, which partially includes the Apodaca, General Escobedo, and San Nicolás de los Garza municipalities), and “Cadereyta” (“Cad”, which includes the Cadereyta municipality). The first SARS-CoV-2 detection at “Norte” (“Nte”, which partially includes the El Carmen, García, General Escobedo, Monterrey, and San Nicolás de los Garza municipalities) occurred the following day on 28 June. At this time, there were 213 confirmed new COVID-19 cases reported by the State’s Health Secretary, with a seven-day moving average of 303 new clinical cases. The observed SARS-CoV-2 quantification in genome copies per day (calculated according to the WW flow per day) is shown with the daily number of cases reported by the State’s Health Secretary confirmed with the clinical PCR testing (Figure 2).
In Figure 3, SARS-CoV-2 wastewater-derived results are shown individually for each WWTP with the corresponding catchments’ new clinical cases. The Dulces Nombres WWTP had peak genome copies per L of measurements of 4.05 × 10⁵ on 12 July, and the next day, a high in new daily clinical cases was reported (~270 new cases), followed ten days later by another peak in cases (~280 new cases), which was the highest in the first wave of the pandemic. In each case, the highest measured genome copies of SARS-CoV-2 detected in wastewater would correspond to an increase in the number of cases, anywhere from 1 to 10 days after the measured peak in wastewater. Similar results were seen for Norte and Cadereyta WWTPs. The Noreste WWTP showed that the measured SARS-CoV-2 genome copies per L were a leading indicator of increasing clinical caseloads during the first wave of the pandemic but not in the second.

3.2. COVID-19 Confirmed Clinical Cases vs. WW SARS-CoV-2 Viral Copies in the Monterrey Metropolitan Area

According to the SARS-CoV-2 Mexican Daily Technical Report, on 9 February 2021, a total of 1,995,892 cases and 174,657 deaths from SARS-CoV-2 were confirmed. In Nuevo Leon, Mexico, 159,814 SARS-CoV-2 cases and 8207 deaths were confirmed from 10 March 2020 to 9 February 2021, with 145,153 confirmed cases in the study area, or 91% of total cases reported in COVID-19 Tablero México—CONACYT (accessed on 15 September 2021) [34]. As described in previous works, wastewater-derived SARS-CoV-2 genome copies in wastewater correlate with the number of active patients contributing to the sewershed [17]. In this study, the same result was observed (Figure 2). During the first wave of increasing clinical cases, SARS-CoV-2 genome copies per L in wastewater samples from the four WWTPs also increased. Similarly, from 12 to 26 July, a decrease in the average of genome copies/L in wastewater samples from all WWTPs occurred with a subsequent reduction in the reported clinical cases (from 612 to 355 new cases) from 23 to 30 July.
Peaks of viral genome copies per L were detected in the four WWTPs during the first wave on 7 August and on 4 October 2020, after the first wave (1.6 × 10⁶ and 1.5 × 10⁶, respectively) (see Figure 2, yellow stars). Two weeks before an increase of 780 clinical cases on 6 September, an increase in genome copies/L was observed before the second wave peak, which was as high as 1.0 × 10¹³ to 3.3 × 10¹⁴ copies. On 20 December, before the second wave peak (5 January 2021), 3.5 × 10¹⁴ genome copies were detected, as high as the previously detected peaks of viral genome copies in wastewater samples. This result suggests less clinical testing and an underestimation of active COVID-19 cases in the Monterrey Metropolitan area during the plateau of the first wave (from August to October).
During the second wave, we found an increase in the genome copies in wastewater samples on 20 December, just when the holidays started (blue triangle) (Figure 2). On 5 January, the clinical testing reports rose to the maximum number of cases observed so far since the beginning of the pandemic, reporting 1162 new COVID-19 cases that day, with an average of 889 new cases daily. As we present in this work, the WBE results predicted this maximum peak two weeks after the increased number of genome copies in the WW samples (Figure 2). Our data suggests a peak of cases predicted during this second wave, with a robust two weeks notice.
There are several reports where the RNA from SARS-CoV-2 was monitored for over a year. In Munich [35], around 1.5 million habitants were monitored through wastewater weekly for a year, sampling in six areas, where the sewage viral load preceded the incidence numbers by three weeks. This timelapse of the leading indicator was variable between the six areas. Averages of 4 days to 3 weeks were identified in several studies [23,36]. In San Diego, CA, US, 2.3 million residents were monitored for a period of 3 months (July to October 2020), where the peaks of viral load quantification predicted the increase in COVID-19 cases in the area up to three weeks in advance in most cases. This study suggested that this system is helpful for community surveillance in vulnerable populations [36]. In Massachusetts, from January to May 2020, the viral load trends in the sewage appeared between 4–10 days earlier than the clinical data [23].
In Latin America, an epidemiological dynamics report of a 1.2 million population in Argentina from July 2020 to January 2021 showed that increases in SARS-CoV-2 genome copies detection in sewage samples were 3–6 days ahead of the clinical COVID-19 weekly confirmed cases [37]. The only study realized in Mexico was in Queretaro city, where they correlated the accumulated number of new COVID-19 cases with the number of viral genome copies/mL detected in wastewater samples [38].

3.3. SARS-CoV-2 in WW and Mobility Info in the Monterrey Metropolitan Area

Mexico is currently among the 15 countries with the highest confirmed cases of SARS-CoV-2 despite the efforts made by the government. The Mexican government implemented a series of measures beginning on 26 March 2020, such as the suspension until 30 April of non-essential activities in the public, private, and social sectors (all activities except construction, mining, transport equipment development, as well as occupations related to the issuance of health and safety at the workplace); the banning of meetings of more than 50 people in essential sectors; the implementation of basic hygiene, prevention, and healthy distance measures; and urging the population to take co-responsible domiciliary guard, which involved strictly providing home protection to anyone over 60 years of age, pregnant women, or people suffering from chronic or autoimmune diseases [39]. These measures were taken to reduce the number of people infected; the contagion curve showed a lower trend than in other countries for the days at the beginning of infection monitoring (Figure 2).
From 30 March to 18 May, when there was a partial reopening of activities in the country, there was an increase of 46,296 confirmed cases. After 18 May, in the same period length (50 days), there was an increase in confirmed cases of 205,021, meaning that SARS-CoV-2 cases increased four-fold. It is not strange to observe that from 18 May, the exponential phase of contagion and hospitalized SARS-CoV-2 cases in the country approximately began in Nuevo Leon and the study area. Although economic reactivation was necessary, this reactivation caused a significant increase in the number of people infected and hospitalized with SARS-CoV-2. Despite this increase, the number of total confirmed cases in Mexico was lower in comparison to other countries. It can be considered that the actions of the Mexican government were correct, and yet these actions could have been even better if the WBE methodology had been implemented to know the estimated cases that were not reported, such as the asymptomatic cases or cases that lacked diagnosis. Measures such as lockdowns and mobility restrictions were applied by the government to limit the virus from becoming widespread around the world. In France, the COVID-19 epidemic’s dynamics were evaluated through SARS-CoV-2 detection in wastewater samples from March to April during the lockdown period. The lockdown effect showed a decrease in the quantities of viral genome copies 29 days after, simultaneously with the reduction in the number of new clinically reported cases [25].
In this study, a mobility data report in Local mobility reports on COVID-19 (accessed on 26 September 2021) [40] was separated into the following categories: retail and recreation, grocery and pharmacy, workplaces, residential, and total mobility. This information included more than 80% of the population of Nuevo Leon since it is located in the metropolitan area. These data were used to compare the mobility and the rise of COVID-19 clinical cases, to monitor the government’s mobility restrictions and the pandemic behavior, and compare with our data.
During the first wave of infections, the economy reopening activities began on 2 July (Figure 2B), where all the essential activities were allowed to operate full-time, while non-essential activities were allowed to operate during an established schedule at 50% capacity. Mobility was reduced to 25% capacity in the commercial sector, and services (including restaurants) with an established schedule during weekdays closed on the weekends [41]. After this announcement, there was an average increase of measured SARS-CoV-2 genome copies detected in the four WWTPs, especially in August, after which, there was an increase in the number of clinical cases. At this time there was a greater need for clinical testing, and the health system started to limit the testing to only symptomatic people. It was assumed that the rise in the number of cases was limited due to testing; therefore, a real comparison was not observed in this first wave. To achieve a direct comparison, the testing strategy should have included a higher number of random clinical testing samples since Mexico had the lowest rate of clinical COVID-19 testing (0.6 tests per 1000 population) in the Organization for Economic Co-operation and Development (OECD) countries, where the average was 27.7 [38,42].
When the first COVID-19 case was reported, retail and recreation mobility decreased, as observed in Figure 2B (blue dots), as well as total mobility (gray dots). Jobs mobility was restricted to only essential jobs, and it was observed that the total mobility decreased to 30% of the baseline in May compared with the last year 2019 [5]. Public transportation served 21.5 million people per month, where 1.99 million people were active workers [6]. After the mandatory lockdown, retail and recreation mobility increased considerably from 30 April to when the economy reopened on 2 July. After this period this mobility was maintained until December when the total mobility and the retail and recreation mobility started to rise again and it coincided with the job mobility reduction (Figure 2B). With this, an upswing in the genome copies/L was observed in wastewater and clinical testing, where its maximum number of cases was reported on January 5 (1162) and the wastewater measurement increase was a leading indicator for the rise in the number of cases with a two-week advance (Figure 2).
In addition to the analysis of raw wastewater samples, treated effluent was also examined. It was found that SARS-CoV-2 was not detected in treated wastewater. It is believed that treatment steps in the WWTP acted as a retainer of SARS-CoV-2 genetic material, especially in the activated sludge step [43].

3.4. Limitations of the WBE Methodology in SARS-CoV-2 Detection

As an international collaborative study, samples were shipped from Mexico to the US, presenting a lag time of ~5.5 days between sample collection and sample receipt. Samples were kept at 4 °C before shipment to avoid excess temperature increases. However, longer hold times were shown to reduce the recoverable virus in wastewater samples [7]. Consequently, the detected concentrations of SARS-CoV-2 (genome copies/L) may have been higher than the measured values, indicating a higher estimated disease burden in the communities than originally thought. Unfortunately, the international shipment was the only option since no local laboratories were capable of measuring SARS-CoV-2 in wastewater at that time and it would not be possible until 2021.

4. Conclusions

This work highlighted the importance of the role WBE can play in providing information regarding COVID-19 community infections in LMIC populations. It was demonstrated that the wastewater-based epidemiology methodology could be useful in disease monitoring and the necessity of strategically placing WBE control centers in target communities.
LMIC strategies to assess the pandemic through clinical testing lagged regarding the representation of the actual number of COVID-19 clinical cases. The first detection of genome copies in wastewater occurred on 27–28 June when the average clinical cases were 303 new daily cases. A correlation was demonstrated between the wastewater genomic copies and the clinical case trends. During the first wave, the increase in clinical cases agreed with the wastewater genomic copies increase, and similarly with the decrease. Moreover, during the second wave, an increase in genomic copies was detected around 15 days ahead of the highest peak of clinical cases. Wastewater-based epidemiology is a synergic tool that is used for clinical testing to accurately describe viral circulation in the general population regardless of the access to clinical testing. The difference between reported clinical cases in the first and second peaks contrasted with the same level of genomic copies in wastewater demonstrated its relevance regarding overcoming the gaps in clinical testing generated by infrastructure capacity, economic challenges, and cultural adaptation.
Finally, the use of WBE as a tool to follow up and evaluate emerging health policies on the pandemic control is effective. Additionally, it can be complemented with free available tools on mobility categorized by activity. A complete system requires a set of tools from which this work has showcased three synergic parts that may be further explored.

Author Contributions

Conceptualization, J.E.S.-H., M.A.O.-M., E.M.M.-M. and M.M.-R.; methodology, M.A.O.-M., E.M.D., D.A.B., R.S.F., L.A.H., M.E.N., S.A., R.K. and S.K.; validation, E.M.D. and D.A.B.; formal analysis, J.E.S.-H., M.A.O.-M., E.M.D., D.A.B. and S.A.P.-B.; investigation, J.E.S.-H., M.A.O.-M., E.M.D., D.A.B., S.K., R.S.F., L.A.H., M.E.N., S.A., R.K., R.U.H. and R.P.-S.; data curation, J.E.S.-H., E.M.M.-M., E.M.D., D.A.B., S.L.L.-S. and S.A.P.-B.; writing—original draft preparation, J.E.S.-H., M.A.O.-M., E.M.M.-M., S.L.L.-S., L.P.-A., S.A.P.-B., M.M.-R., L.I.R.-Z., I.Y.L.-P. and C.C.-Z.; writing—review and editing, E.M.D., D.A.B., M.E.N., S.A., R.K., H.M.N.I., S.K., R.S.F., L.A.H., E.S.L., A.V., D.S.-L., R.U.H. and R.P.-S.; visualization, J.E.S.-H., M.A.O.-M., S.L.L.-S., L.P.-A., S.A.P.-B., L.I.R.-Z., I.Y.L.-P. and C.C.-Z.; supervision, J.E.S.-H., E.M.D., H.M.N.I., E.S.L., A.V., D.S.-L., R.U.H. and R.P.-S.; project administration, J.E.S.-H., E.M.D., R.U.H. and R.P.-S.; funding acquisition, J.E.S.-H., R.U.H. and R.P.-S. All authors have read and agreed to the published version of the manuscript.

Funding

We are thankful to Tecnologico de Monterrey for providing financial support to conduct this research.

Institutional Review Board Statement

Not applicable.

Informed Consent Statement

Not applicable.

Data Availability Statement

Not applicable.

Acknowledgments

This project acknowledges the Biotechnology Center—FEMSA and the recently created ad hoc laboratory MARTEC from Tecnológico de Monterey for the development of the project. We also acknowledge the Arizona State University and Biodesign Institute for the fast shift in the previous collaboration supported by the Global Consortium for Sustainability Outcomes with the project title “Facilitating Evidence-based Decision-making for Global Health Out-comes” during the COVID-19 pandemic to increase the capacity for the sample processing to carry out this study. We are thankful to the GIECC Research Group from Tecnológico de Monterey for providing us with the ArcGis Pro license and Duvan Alfonso Alvarado Pachon for the guidance to use the program. CONACYT is thankfully acknowledged for partially supporting this work under the Sistema Nacional de Investigadores (SNI) program awarded to Juan Eduardo Sosa-Hernández (CVU: 375202), Mariel A. Oyervides-Muñoz (CVU: 422778), Elda M. Melchor-Martínez (CVU: 230784), Hafiz M.N. Iqbal (CVU: 735340), Roberto Parra-Saldívar (CVU: 35753), Manuel Martínez-Ruiz (CVU: 418151), and Carlos Castillo-Zacarías (CVU: 359310). Finally, we are thankful to Servicios de Agua y Drenaje de Monterrey for the collaboration in this project.

Conflicts of Interest

R.U.H. and E.M.D. are cofounders of AquaVitas, LLC, 9260 E. Raintree, Ste 130, Scottsdale, AZ 85260, USA, which is an Arizona State University startup company providing commercial services in wastewater-based epidemiology. R.U.H. is also the founder of OneWaterOneHealth, which is a non-profit project of the Arizona State University Foundation.

References

  1. Mexico: WHO Coronavirus Disease (COVID-19) Dashboard With Vaccination Data | WHO Coronavirus (COVID-19) Dashboard With Vaccination Data n.d. Available online: https://covid19.who.int/region/amro/country/mx (accessed on 31 May 2022).
  2. Symptoms of COVID-19 | CDC n.d. Available online: https://www.cdc.gov/coronavirus/2019-ncov/symptoms-testing/symptoms.html (accessed on 31 May 2022).
  3. Coronavirus Pandemic (COVID-19)—Our World in Data n.d. Available online: https://ourworldindata.org/coronavirus#citation (accessed on 31 May 2022).
  4. SCITEL n.d. Available online: https://www.inegi.org.mx/app/scitel/Default?ev=10 (accessed on 31 May 2022).
  5. Transporte de Pasajeros n.d. Available online: https://www.inegi.org.mx/temas/transporteurb/ (accessed on 31 May 2022).
  6. Resultados De La Encuesta Nacional De Ocupación Y Empleo. Nueva Edición (Enoen) Cifras Durante El Cuarto Trimestre De 2020 n.d. Available online: https://www.inegi.org.mx/contenidos/saladeprensa/boletines/2021/enoe_ie/enoe_ie2021_02.pdf (accessed on 31 May 2022).
  7. Ahmed, W.; Angel, N.; Edson, J.; Bibby, K.; Bivins, A.; O’Brien, J.W.; Choi, P.M.; Kitajima, M.; Simpson, S.L.; Li, J.; et al. First confirmed detection of SARS-CoV-2 in untreated wastewater in Australia: A proof of concept for the wastewater surveillance of COVID-19 in the community. Sci. Total Environ. 2020, 728, 138764. [Google Scholar] [CrossRef] [PubMed]
  8. Panchal, D.; Prakash, O.; Bobde, P.; Pal, S. SARS-CoV-2: Sewage surveillance as an early warning system and challenges in developing countries. Environ. Sci. Pollut. Res. 2021, 28, 22221–22240. [Google Scholar] [CrossRef] [PubMed]
  9. Albert, S.; Ruíz, A.; Pemán, J.; Salavert, M.; Domingo-Calap, P. Lack of evidence for infectious SARS-CoV-2 in feces and sewage. Eur. J. Clin. Microbiol. 2021, 40, 2665–2667. [Google Scholar] [CrossRef]
  10. La Rosa, G.; Iaconelli, M.; Mancini, P.; Ferraro, G.B.; Veneri, C.; Bonadonna, L.; Lucentini, L.; Suffredini, E. First detection of SARS-CoV-2 in untreated wastewaters in Italy. Sci. Total Environ. 2020, 736, 139652. [Google Scholar] [CrossRef] [PubMed]
  11. Rimoldi, S.G.; Stefani, F.; Gigantiello, A.; Polesello, S.; Comandatore, F.; Mileto, D.; Maresca, M.; Longobardi, C.; Mancon, A.; Romeri, F.; et al. Presence and infectivity of SARS-CoV-2 virus in wastewaters and rivers. Sci. Total Environ. 2020, 744, 140911. [Google Scholar] [CrossRef]
  12. La Rosa, G.; Mancini, P.; Ferraro, G.B.; Veneri, C.; Iaconelli, M.; Bonadonna, L.; Lucentini, L.; Suffredini, E. SARS-CoV-2 has been circulating in northern Italy since December 2019: Evidence from environmental monitoring. Sci. Total Environ. 2021, 750, 141711. [Google Scholar] [CrossRef]
  13. Westhaus, S.; Weber, F.-A.; Schiwy, S.; Linnemann, V.; Brinkmann, M.; Widera, M.; Greve, C.; Janke, A.; Hollert, H.; Wintgens, T.; et al. Detection of SARS-CoV-2 in raw and treated wastewater in Germany—Suitability for COVID-19 surveillance and potential transmission risks. Sci. Total Environ. 2020, 751, 141750. [Google Scholar] [CrossRef]
  14. Chavarria-miró, G.; Anfruns-Estrada, E.; Guix, S.; Paraira, M.; Galofré, B.; Sánchez, G.; Pintó, R.M.; Bosch, A. Sentinel Surveillance of SARS-CoV-2 in Wastewater Anticipates the Occurrence of SARS-CoV-2 Cases. medRxiv 2020. [Google Scholar] [CrossRef]
  15. Randazzo, W.; Cuevas-Ferrando, E.; Sanjuán, R.; Domingo-Calap, P.; Sánchez, G. Metropolitan wastewater analysis for COVID-19 epidemiological surveillance. Int. J. Hyg. Environ. Health 2020, 230, 113621. [Google Scholar] [CrossRef]
  16. Randazzo, W.; Truchado, P.; Cuevas-Ferrando, E.; Simón, P.; Allende, A.; Sánchez, G. SARS-CoV-2 RNA in wastewater anticipated COVID-19 occurrence in a low prevalence area. Water Res. 2020, 181, 115942. [Google Scholar] [CrossRef]
  17. Kumar, M.; Patel, A.K.; Shah, A.V.; Raval, J.; Rajpara, N.; Joshi, M.; Joshi, C.G. First proof of the capability of wastewater surveillance for COVID-19 in India through detection of genetic material of SARS-CoV-2. Sci. Total Environ. 2020, 746, 141326. [Google Scholar] [CrossRef] [PubMed]
  18. Medema, G.; Heijnen, L.; Elsinga, G.; Italiaander, R.; Brouwer, A. Presence of SARS-Coronavirus-2 RNA in Sewage and Correlation with Reported COVID-19 Prevalence in the Early Stage of the Epidemic in The Netherlands. Environ. Sci. Technol. Lett. 2020, 7, 511–516. [Google Scholar] [CrossRef]
  19. Green, H.; Wilder, M.; Collins, M.; Fenty, A.; Gentile, K.; Kmush, B.L.; Zeng, T.; Middleton, F.A.; Larsen, D.A. Quantification of SARS-CoV-2 and cross-assembly phage (crAssphage) from wastewater to monitor coronavirus transmission within communities. medRxiv 2020, 2, 1–18. [Google Scholar] [CrossRef]
  20. Nemudryi, A.; Nemudraia, A.; Wiegand, T.; Surya, K.; Buyukyoruk, M.; Cicha, C.; Vanderwood, K.K.; Wilkinson, R.; Wiedenheft, B. Temporal Detection and Phylogenetic Assessment of SARS-CoV-2 in Municipal Wastewater. Cell Rep. Med. 2020, 1, 100098. [Google Scholar] [CrossRef]
  21. Peccia, J.; Zulli, A.; Brackney, D.E.; Grubaugh, N.D.; Kaplan, E.H.; Casanovas-Massana, A.; Ko, A.I.; Malik, A.A.; Wang, D.; Wang, M.; et al. SARS-CoV-2 RNA concentrations in primary municipal sewage sludge as a leading indicator of COVID-19 outbreak dynamics. medRxiv 2020. [Google Scholar] [CrossRef]
  22. Sherchan, S.P.; Shahin, S.; Ward, L.M.; Tandukar, S.; Aw, T.G.; Schmitz, B.; Ahmed, W.; Kitajima, M. First detection of SARS-CoV-2 RNA in wastewater in North America: A study in Louisiana, USA. Sci. Total. Environ. 2020, 743, 140621. [Google Scholar] [CrossRef]
  23. Wu, F.; Zhang, J.; Xiao, A.; Gu, X.; Lee, W.L.; Armas, F.; Kauffman, K.; Hanage, W.; Matus, M.; Ghaeli, N.; et al. SARS-CoV-2 Titers in Wastewater Are Higher than Expected from Clinically Confirmed Cases. mSystems 2020, 5, e00614-20. [Google Scholar] [CrossRef]
  24. Trottier, J.; Darques, R.; Mouheb, N.A.; Partiot, E.; Bakhache, W.; Deffieu, M.S.; Gaudin, R. Post-lockdown detection of SARS-CoV-2 RNA in the wastewater of Montpellier, France. One Health 2020, 10, 100157. [Google Scholar] [CrossRef]
  25. Wurtzer, S.; Marechal, V.; Mouchel, J.M.; Maday, Y.; Teyssou, R.; Richard, E.; Almayrac, J.L.; Moulin, L. Evaluation of lockdown impact on SARS-CoV-2 dynamics through viral genome quantification in Paris wastewaters. medRxiv 2020. [Google Scholar] [CrossRef]
  26. Guerrero-Latorre, L.; Ballesteros, I.; Villacrés-Granda, I.; Granda, M.G.; Freire-Paspuel, B.; Ríos-Touma, B. SARS-CoV-2 in river water: Implications in low sanitation countries. Sci. Total Environ. 2020, 743, 140832. [Google Scholar] [CrossRef]
  27. Bar-Or, I.; Yaniv, K.; Shagan, M.; Ozer, E.; Weil, M.; Indenbaum, V.; Elul, M.; Erster, O.; Mendelson, E.; Mannasse, B.; et al. Regressing SARS-CoV-2 Sewage Measurements Onto COVID-19 Burden in the Population: A Proof-of-Concept for Quantitative Environmental Surveillance. Front. Public Health 2022, 9, 561710. [Google Scholar] [CrossRef] [PubMed]
  28. Kocamemi, B.A.; Kurt, H.; Hacıoglu, S.; Yaralı, C.; Saatci, A.M.; Pakdemirli, B. First data-set on SARS-CoV-2 detection for Istanbul wastewaters in Turkey. medRxiv 2020. [Google Scholar] [CrossRef]
  29. Haramoto, E.; Malla, B.; Thakali, O.; Kitajima, M. First environmental surveillance for the presence of SARS-CoV-2 RNA in wastewater and river water in Japan. Sci. Total Environ. 2020, 737, 140405. [Google Scholar] [CrossRef]
  30. Fongaro, G.; Stoco, P.H.; Souza, D.S.M.; Grisard, E.C.; Magri, M.E.; Rogovski, P.; Schörner, M.A.; Barazzetti, F.H.; Christoff, A.P.; de Oliveira, L.F.V.; et al. The presence of SARS-CoV-2 RNA in human sewage in Santa Catarina, Brazil, November 2019. Sci. Total Environ. 2021, 778, 146198. [Google Scholar] [CrossRef] [PubMed]
  31. Ng, K.T.; Rapp-Wright, H.; Egli, M.; Hartmann, A.; Steele, J.C.; Sosa-Hernández, J.E.; Melchor-Martínez, E.M.; Jacobs, M.; White, B.; Regan, F.; et al. High-throughput multi-residue quantification of contaminants of emerging concern in wastewaters enabled using direct injection liquid chromatography-tandem mass spectrometry. J. Hazard. Mater. 2020, 398, 122933. [Google Scholar] [CrossRef] [PubMed]
  32. Holland, L.A.; Kaelin, E.A.; Maqsood, R.; Estifanos, B.; Wu, L.I.; Varsani, A.; Halden, R.U.; Hogue, B.G.; Scotch, M.; Lim, E.S. An 81-Nucleotide Deletion in SARS-CoV-2 ORF7a Identified from Sentinel Surveillance in Arizona (January to March 2020). J. Virol. 2020, 94, e00711-20. [Google Scholar] [CrossRef] [PubMed]
  33. Bowes, D.A.; Driver, E.M.; Kraberger, S.; Fontenele, R.S.; Holland, L.A.; Wright, J.; Johnston, B.; Savic, S.; Newell, M.E.; Adhikari, S.; et al. Unrestricted Online Sharing of High-frequency, High-resolution Data on SARS-CoV-2 in Wastewater to Inform the COVID-19 Public Health Response in Greater Tempe, Arizona. medRxiv 2021. [Google Scholar] [CrossRef]
  34. COVID-19 Tablero México—CONACYT—CentroGeo—GeoInt—DataLab n.d. Available online: https://datos.covid-19.conacyt.mx/#DownZCSV (accessed on 31 May 2022).
  35. Rubio-Acero, R.; Beyerl, J.; Muenchhoff, M.; Roth, M.S.; Castelletti, N.; Paunovic, I.; Radon, K.; Springer, B.; Nagel, C.; Boehm, B.; et al. Spatially resolved qualified sewage spot sampling to track SARS-CoV-2 dynamics in Munich—One year of experience. Sci. Total Environ. 2021, 797, 149031. [Google Scholar] [CrossRef]
  36. Karthikeyan, S.; Ronquillo, N.; Belda-Ferre, P.; Alvarado, D.; Javidi, T.; Longhurst, C.A.; Knight, R. High-Throughput Wastewater SARS-CoV-2 Detection Enables Forecasting of Community Infection Dynamics in San Diego County. mSystems 2021, 6, e00045-21. [Google Scholar] [CrossRef]
  37. Giraud-Billoud, M.; Cuervo, P.; Altamirano, J.C.; Pizarro, M.; Aranibar, J.N.; Catapano, A.; Cuello, H.; Masachessi, G.; Vega, I.A. Monitoring of SARS-CoV-2 RNA in wastewater as an epidemiological surveillance tool in Mendoza, Argentina. Sci. Total Environ. 2021, 796, 148887. [Google Scholar] [CrossRef]
  38. Carrillo-Reyes, J.; Barragán-Trinidad, M.; Buitrón, G. Surveillance of SARS-CoV-2 in sewage and wastewater treatment plants in Mexico. J. Water Process Eng. 2020, 40, 101815. [Google Scholar] [CrossRef] [PubMed]
  39. Sala de Prensa IMSS. Gobierno de Mexico n.d. Available online: http://www.imss.gob.mx/prensa/archivo/202003 (accessed on 1 June 2022).
  40. Local mobility reports on COVID-19 n.d. Available online: https://www.google.com/covid19/mobility/ (accessed on 1 June 2022).
  41. Presentación de la “Actualización de medidas de mitigación contra COVID-19” | 02-07-2020 | Gobierno del Estado de Nuevo León n.d. Available online: https://www.nl.gob.mx/publicaciones/presentacion-de-la-actualizacion-de-medidas-de-mitigacion-contra-covid-19-02-07-2020 (accessed on 1 June 2022).
  42. Hasell, J.; Mathieu, E.; Beltekian, D.; Macdonald, B.; Giattino, C.; Ortiz-Ospina, E.; Roser, M.; Ritchie, H. A cross-country database of COVID-19 testing. Sci. Data 2020, 7, 345. [Google Scholar] [CrossRef] [PubMed]
  43. Balboa, S.; Mauricio-Iglesias, M.; Rodriguez, S.; Martínez-Lamas, L.; Vasallo, F.J.; Regueiro, B.; Lema, J.M. The fate of SARS-COV-2 in WWTPS points out the sludge line as a suitable spot for detection of COVID-19. Sci. Total Environ. 2021, 772, 145268. [Google Scholar] [CrossRef] [PubMed]
Figure 1. Wastewater catchment area of each wastewater treatment plant, namely, Dulces Nombres (Orange), Norte plant (Green), and Noreste Plant (Blue). The inverted triangles correspond to the WWTP locations. Cadereyta (Cad) WWTP is not shown. Source: Servicios de Agua y Drenaje de Monterrey, 2020.
Water 14 01842 g001
Figure 2. Wastewater monitoring (A) and mobility (B). The first graph (A) shows the official new COVID-19 cases per day (light gray circles) and its seven-day moving window average (purple continuous line) in Nuevo Leon state, México. The data were obtained from COVID-19 México from https://datos.covid-19.conacyt.mx/#DownZCSV (accessed on 16 September 2021) [34], along with the genome copies per day sum for all WWTPs in red squares with a four-day moving window average shown by a light red line. At the top, important events are highlighted with gray dashed lines, where two yellow stars mark the higher quantifications and an inverted blue triangle marks the higher quantification before the second wave peak. (B) Mobility reports from Nuevo Leon reported by the Google platform are plotted in the same time frame. The mobility report was separated into the following categories: retail and recreation, grocery and pharmacy, workplaces, residential, and total mobility. Each category was based on the time spent per day in each location type. This information was compared with the new cases and WBE information corresponding to the Monterrey metropolitan area since more than 80% of the population of Nuevo León was located in this area.
Water 14 01842 g002
Figure 3. New cases per municipality associated with WWTPs that serve the Monterrey metropolitan area vs. genetic copies per liter in each WWTP: (A) Dulces Nombres, (B) Norte, (C) Noreste, and (D) Cadereyta 1.
Water 14 01842 g003
Publisher’s Note: MDPI stays neutral with regard to jurisdictional claims in published maps and institutional affiliations.

