Article

Achieving Personalized Precision Education Using the Catboost Model during the COVID-19 Lockdown Period in Pakistan

1
University Institute of Information Technology, Pir Mehr Ali Shah Arid Agriculture University, Rawalpindi 46300, Pakistan
2
Industrial Engineering Department, College of Engineering, King Saud University, P.O. Box 800, Riyadh 11421, Saudi Arabia
3
Electrical Engineering Department, College of Engineering, King Saud University, P.O. Box 800, Riyadh 11421, Saudi Arabia
4
School of Information Technology, Deakin University, Burwood, VIC 3128, Australia
5
Space and Upper Atmosphere Research Commission, Islamabad 44000, Pakistan
*
Author to whom correspondence should be addressed.
Sustainability 2023, 15(3), 2714; https://doi.org/10.3390/su15032714
Submission received: 29 December 2022 / Revised: 19 January 2023 / Accepted: 30 January 2023 / Published: 2 February 2023
(This article belongs to the Special Issue Impact of COVID-19 on Education)

Abstract

:
With the emergence of the COVID-19 pandemic, access to physical education on campus became difficult for everyone. Therefore, students and universities have been compelled to transition from in-person to online education. During this pandemic, online education, the use of unfamiliar digital learning tools, the lack of internet access, and the communication barriers between teachers and students made precision education more difficult. Customizing models from previous studies that only consider a single course in order to make a prediction reduces the predictive power of the model because it only considers a small subset of the attributes of each possible course. Due to a lack of data for each course, overfitting often occurs. It is challenging to obtain a comprehensive understanding of the student’s participation during the semester system or in a broader context. In this paper, a model that is flexible and more generalizable is developed to address these issues. This model resolves the problem of generalized models and overfitting by using a large number of responses from college and university students as a dataset that considered a broader range of attributes, regardless of course differences. CatBoost, an advanced type of gradient boosting algorithm, was used to conduct this research, and enabled the developed model to perform effectively and produce accurate results. The model achieved a 96.8% degree of accuracy. Finally, a comparison was made with other related work to demonstrate the concept, and the experimental results proved that the Catboost model is a viable, accurate predictor of students’ performance.

1. Introduction

Precision education is defined as a strategy for identifying students at risk of dropping out [1]. It is helpful to identify students who are at risk early on so that appropriate interventions can be applied. With the evolution of the field of education, the need for precision in education has become essential. The concept of precision education is relatively recent, having only been devised in 2016 [2].
Creating more effective learning strategies and methods that take into account students’ individual intelligence levels is the current research community’s top priority. Researchers are therefore engaged in precision education development. Most commonly, the term “precision” refers to a precise and accurate evaluation of a particular individual for some purpose. In order to select the intervention [3] that works most effectively for these individuals, precision education was implemented.
Precision education is effective because it examines the performance and needs of each student on an individual level, thereby preventing dropouts and facilitating the development of appropriate mediation. The effectiveness of an intervention is evaluated by monitoring the student over time after it has been implemented. In addition, modern educators view precision education as a competitive opportunity to improve both their own teaching methods and the ways in which their students learn. According to [4], digital education podiums are now used to keep track of student data and analyze patterns in how they learn. Precision education exploits real-time studying practices, so researchers [5] have used data from the latest education tools to certify the best teaching attributes of staff and support students’ learning.
Given the wide variety of factors that can contribute to a student’s failure in higher education, individualizing the learning experience has emerged as a crucial strategy for raising both the success and the literacy rates. Precision education draws attention to the areas in which each student needs improvement, as well as the requirements and preferences that they have. In the field of education, reaching the goal of precision education has become an essential component for estimating the rate of academic achievement among students [5].
Students used to traditional learning may have trouble with online learning, as some students reside in areas with limited or nil internet access [6]. Therefore, students’ access to education can be affected by factors such as a lack of internet, mental health issues, and a general lack of interest.
Despite the increased level of competition in the education sector, digital learning platforms continue to generate and store vast quantities of educational data. The following are some of the primary components of the field of Education Data Mining (EDM): learning analytics, machine learning, computer science, pattern recognition, and computer-based education.
Learning analytics (LA) has been employed to perceive the available educational data. The introduction of precision education has led to a greater focus on the field of LA. For estimating student participation in academia, learning analytics is described in [6] as use of formal analysis such as machine learning, statistical techniques to generate information that enhance decision-making which mean LA is a “a conceptual framework and as a part of Precision Education used to analyze and predict students’ performance and provide timely interventions based on student learning profiles”.
According to [7], LA discusses the analysis and comprehension of various types of educational data, including but not limited to: detailed logbooks of various university education management systems (EMSs), interactive content and data saved in electronic conversation forums, videos recorded during the delivery of online lectures, and data of trainers and illustrative policymakers. Most of the work that has been undertaken recently on LA has been based on constructing models using data taken from student information systems, digital education environments such as LMS systems, and electronic tutorial systems, as detailed in previous research [8]. Collecting data from online databases maintained by various educational institutions, LA then builds models to predict student behavior and outcomes with the goal of bettering the teaching and learning process. Applying the principles of LA, precision education has the potential to benefit both educators and students by providing more engaging, adaptive, flexible, and individually tailored assessment and intervention [9].
Students in digital learning environments (DLEs) must be analyzed to provide precision education by understanding their behavior and learning patterns. Learning resources can be accessed by the student at any time and from any location thanks to DLEs. Online learning platforms have shifted the traditional learning process online due to the COVID-19 pandemic and DLEs over the past few decades. There is no longer any reason for a language barrier to exist between teachers and students because of the advent of online education, as stated in [10]. Because COVID-19 was an unprecedented event [11], it has also affected the academic performance of many students [12].
Some of the digital learning platforms that were utilized during the COVID-19 period are illustrated in Figure 1. The majority of online platforms available to students consist of Course Management Systems, Small Private Online Courses (SPOCs), Content Management Systems (CMSs), Massive Open Online Courses (MOOCs), Google Meet, Google classroom, and Zoom, as outlined in [13].
A literature study of recent papers indicated a research gap related to performance prediction of students; specifically, during COVID-19, it showed that the existing models have some limitations that need to be resolved. Existing studies focus on tailoring these models to analyze student performance, related to any specific course. These models require more technical expenditure and human resources. Scalability is another issue faced by these models. So, these models have a large overhead. Moreover, already existing models within precision education are normally not flexible enough to deal with a variety of organizational environments. These studies also lack the required dataset; as a result, the model is unfit for accurate prediction, which causes the problem that features selected from the dataset are not enough to enable precise analysis of the behavior of student learning at the individual level.
Thus, to counter the aforementioned limitations, this study contributed by collecting data from bachelor’s, master’s, and doctoral students through a Google-based questionnaire. For resampling, the data were acquired from the students using the Monte Carlo method, and then applied. From this data, potential attributes were selected based on the Pearson correlation coefficient. Using this dataset, the proposed framework was trained using the CatBoost classifier method due to its correctness, consistency, and robustness in handling categorical data. In this way, this study proposed a framework that works well in predicting students’ performance and feedback during COVID-19 by considering different attributes that are independent of disparate courses. Finally, a comparison was made to show the effectiveness of the proposed model compared to other related work from the COVID-19 lockdown period.
The paper is organized as follows. Section 2 contains the LA-related studies and correlated work for precision education. Section 3 presents the proposed methodology, the phases for the prediction of the performance of the learner, and the proposed model. Section 4 demonstrates the experiments and results of this study, which is followed by presentation of a conclusion, limitations, and recommendations for further research in Section 5.

2. Literature Review

Recent research has been conducted on precision education to determine the extent to which the COVID-19 pandemic has impacted the educational sector following the imposition of lockdown. Research shows the pandemic has affected the psychological health of students. To conduct this study [14], approximately 1766 students were recruited. To collect data from these students, a web-based questionnaire was developed. Students from various Arab nations filled out this questionnaire, which collected information regarding the sleeping habits of students, their exposure to digital tools, level of social interaction, psychological state, depression scale, and anxiety. Eventually, using ANOVA, each attribute’s dependence was analyzed. The collected data were refined using preprocessing methods. Then, features were selected. The dataset was split into training and testing sets with proportions of 70% and 30%, respectively. Moreover, the author noted that the utilized dataset was insufficient. Therefore, using fewer data for training purposes resulted in the loss of some essential training attributes. Then, some of the most common classification classifiers used to solve everyday problems were employed to conduct additional research.
Academic performance evaluation studies are proposed [15] to help students make informed decisions about their future in their field. Different methods for representing students’ individual performance were compared in this study. The dataset utilized to conduct this research was taken from the “Big data research center (BDRC)” of the university of China. The data were pre-processed before the research to filter out the best attributes. Four optimal attributes were taken, namely, “Academic Career”, “industry employment”, “engagement in advanced studies at other universities”, and “engagement in advanced studies in current university”. Supervised machine learning algorithms were used to check the model performance and sensitivity. “SVM”, “ANN”, “Naïve Bayes”, “KNN”, and “Decision Tree (DT)” were used. The accuracy of the model was tested on a number of different datasets. The study proved that ANN and DT are best at evaluating career decisions made by students on the basis of the student performance during their academic history. The observed accuracy for ANN was 94.75%, and that for DT was 86.76%. Further, conducting research using a larger dataset and different deep learning techniques to make predictions can be undertaken in the future.
Student performance was measured through a collaborative learning format in a recent study [16]. During the learning process, a combination of traditional and online student activities was considered. Incorporating big data and learning analytics methods, this study aimed to discuss precision education’s role in identifying struggling students early on. After identifying risk factors, it is possible to provide at-risk students with the necessary instructions. This study examined a blended calculus course with 21 features. Behavior and learning activities of students were monitored along with their performance in the tests, assignments, and homework. For the dataset, “Online Assessment System (OAS)” and “Massive Open Online Courses (MOOCs)” were taken into account. After preprocessing, five sets of data were tested by passing them through the model during experimentation. After integrating optimal attributes, PCR was utilized to construct a model for the performance evaluation of students. The performance of the model was validated through the use of the regression method. Seven factors, of which three were traditional and four were online, were identified as having the potential to affect student performance. The predictability of student performance was highly accurate. This model can be used to intervene and predict weak students in the future.
The problems with outdated predictive models, which were used in a previous paper [17] to analyze student performance and predict the students’ outcomes, were brought to light. Previous models could not trace factors that affect student learning and were designed for any environment. They proposed an analysis of numerous factors that influence the prediction of students’ performance. Some of the factors that were included are: “course duration”, “type of assignments”, “data collection procedure”, “clickstream data”, and “forum variables”. The study demonstrated that the variables related to forum and online learning platforms are less helpful than the variables associated with exercise for making the best prediction of student outcomes. The dataset was collected from two MOOCs. One of these was previously evaluated and the second was evaluated to allow the comparison of the results of both datasets, while considering factors that could influence the prediction of final grades. The experiment was conducted by taking only one programming course of “Java”. Results showed that forum variables were not useful for prediction, but variables associated with exercises were. Moreover, results depicted that the “Multiple online questions” are helpful in making predictions rather than the “coding questions”. Further, more courses can be considered for the analysis of more factors for final grade prediction.
Using students’ static and dynamic behavior to their advantage, the authors of [18] argued that students could more effectively reach their academic potential. Therefore, the paper proposed conducting a study in which an innovative method would be applied in order to automatically identify those students who are at risk of failing programming courses within the discipline of computer science. After the deficiencies were identified, the students were given feedback in order to help them improve by addressing those deficiencies. A prediction model was constructed which utilized information of students from both online (dynamic) and offline (static) resources regarding their “behavior activity logs”, “demographics”, and “characteristics”. A classification model was trained with a dataset of student sessions in 2015–2016. A weekly report was generated to predict the outcome of these students in the final exams of the semester. Each week, new dynamic attributes were added to the model. The model was trained with past data and the data were added to it for learning each week. The model was validated through different classifiers. The K-neighbors algorithm was proven to be helpful in testing the performance of the model. The model was proven to be successful in accurately predicting the outcome of students through data mining techniques, and also helped in-need students and teachers by providing dynamic feedback to them for their improvement. Furthermore, this predictive model was also proven to be helpful to students for predicting outcomes for numerous other courses. Moreover, this model can be used for making predictions on other learning platforms by helping students to perform better in their studies.
Based on previous research [19], a study proposed a model for evaluating the final scores of students using the learning activity logs of students. The M2B learning platform constructed by “Kyushu University” for improving teaching and learning was utilized. All the students using this learning platform were instructed by the university to use their own devices to access it, so that the true activity log for each student could be maintained. Students and teachers accessed LMS for class attendance, and an e-book was used by students to obtain the learning material uploaded by the instructors. The e-book and LMS log activities of each student were fetched and, after integration of optimal attributes, analysis was performed. By utilizing an approach known as “Discrete Graphs”, the activity logs of students were visualized. Using this approach, the prediction of final scores from logs was performed successfully. Moreover, the variables that were responsible for students who received an “F” grade were stored to help weak students in the next session. In addition, some technological issues were not handled properly. In the future, students and teachers can also undertake their own assessments by downloading their data for improvement in learning and teaching, respectively.
Another study [20] provided a deep analysis of how educational big data and machine learning can facilitate in the prediction of dropout students at an early stage. For that purpose, a logistic regression model for the statistical analysis of student learning behavior and the students’ backgrounds was considered. A number of attributes associated with students’ backgrounds were fetched through statistical analysis. These were: “student loan applications”, “number of absentees from school”, and “no of alerted subjects”. The dataset was passed to the training model through a “multilayer perceptron algorithm” of deep learning. The validation and training datasets were spilt using the ratios of 5% and 95%, respectively. With the increase in amount of data and number of epochs, the accuracy of model was also observed to increase. The Tensorflow platform was used for training a predictive model. The model successfully provided an accurate prediction of those students who were at risk of dropping out. Through this predictive model, precision education was achieved by providing an early warning to teachers, who could intervene to help these weak students. In this way, the model proved beneficial for both the university and students by minimizing the dropout rate. The accuracy achieved with logistic regression was observed to be 61%, and that with deep learning was about 77%. Further work on this model can be undertaken to increase its accuracy to 80%.
A recent study was conducted [21] with the main objective of identifying and recognizing the role of the paradigm shift of educational institutions towards digital media during the COVID-19 pandemic. The study proposed visualizing how numerous online learning environments could help in remote learning for students. To conduct this study, a sample dataset was collected through a questionnaire designed for both students and teachers across India and UAE. The survey was conducted for 250 students and 155 teachers. The survey results depicted that positive interest was shown by a majority of students for remote learning through video lectures and digital media. Moreover, it showed that most of the teachers and students were using “Zoom” and “Microsoft” to present and take part in online lectures through online classrooms. This study proved beneficial in analyzing the positive impact of these platforms on the learning of students during the COVID-19 pandemic. These platforms also provide benefits, such as enabling students to download lectures, record lectures, and view lectures after class. Moreover, positive fostering of cognitive skills in students using these platforms was identified.
Another study [22] found that it is necessary to visualize the increase in numerous digital technologies in the educational sector to understand student engagement through blended learning. This study used the “Educational Data Mining (EDM)” approach to identify the engagement of students. Data were obtained through the Moodle platform, through which lectures were conveyed during the course. Only the data for 1 week of offline learning, in which postgraduate students were taught face to face, were considered. Later, the collected data were preprocessed and EDM was applied to gain deep insights into the information and its analysis. The unsupervised machine learning approach known as “K-means clustering” was utilized for the construction of the optimal number of clusters. Clustering was conducted on the basis of defined similarity criteria. Students’ engagement level was classified into three levels: low, high, and medium. The predictive model successfully identified student engagement and, in this way, precision education was also promoted. The study proved that each individual has different ways of interacting with learning resources, so designing the same learning pattern for all students will not work well. Through this, the educators are also acknowledged, so that they can provide timely interventions to help the student, while keeping in mind that each student has a different level of engagement with these learning resources. Some limitations were that size of the dataset and number of considered variables were small.
Another research paper [23] proposed a study based on predicting students who are at-risk by achieving precision education in an “e-book learning environment” through the use of learning analytics, educational data, and machine learning techniques. After diagnosis, certain strategies were applied as a treatment to improve both student learning and the e-book through the feedback of students. A comparison was made between the strategy applied by students to read e-books and their learning behavior during analysis to fetch the optimal attributes to continue this empirical study. A total of 19 features were extracted by the analysis of the e-book dashboard by tracing numerous learning patterns of students. A blended programming course on Python with Moodle as a learning environment was taken. A predictive model for this research was built using well-known classifiers of machine learning, including: “support vector classification (SVC)”, “Logistic Regression (LR)”, “Random Forest (RF)”, and “eXtreme Gradient Boosting (XGB)”. The model was then tested using evaluation metrics to check the performance. Out of the several classifiers used for carrying out the research, SVC performed well, with an observed accuracy of 80%. Three major problems were encountered with the proposed model: weak students that were monitored by teacher were not marked as being at-risk through the model; the proposed model cannot be used for predicting weak students for other courses; and problems faced by students during learning are not easily recognized by the model.
Another study proposed a method [24] for predicting students who are likely to fail a course. Students in a hybrid advanced statistics course were evaluated using online discussion forums. Analysis of student Facebook group posts was used to determine whether or not students were actively engaged in their academic work. As a dataset, the forum’s student-posted textual messages were extracted. In order to obtain more precise information, the text was subsequently preprocessed. After the raw data were cleaned and organized, features were derived. The data were subsequently used to train a predictive model. Machine learning algorithms were used to check the efficiency of the model, including: “Support Vector Machine (SVM)”, “Random Forest (RF)”, and “Artificial Neural Network (ANN)”. Using these classifiers, Facebook posts were classified into statistics-related posts. Three trained ML models were validated through 10-cross validation to test the model’s performance. The model predicted that those students who passed had more posts in a group compared to those who failed the course. Table 1 highlights the potential work of some previous studies.

3. Proposed Model for Precision Education

This section presents the proposed model for predicting the performance of students in higher education during the COVID-19 period, taking into account a large number of attributes.
Greater precision is needed in higher education in order to lower the rate at which students drop out of school. Due to a variety of factors, university students face a greater risk of dropping out. Choosing the wrong major is a common reason for poor performance. Some individuals are compelled to pursue an education in fields chosen by their guardian. Several individuals struggle to adapt to the semester system of education. Postgraduate students often struggle because they are unable to successfully balance their work and academic responsibilities. Due to the emergence of COVID-19, universities around the world were compelled to transition to an online education delivery system.
This study utilized a dataset of students in higher education collected through a survey. The results of this study are generalizable to other populations. Due to the global trend toward online education, students from all backgrounds will have been impacted by similar factors that were considered in this research. Using data pre-processing, missing values were filled in. Following the selection of potential attributes, data extraction was carried out. The extracted data attributes were subsequently used for training a model to make precise predictions. The model was then evaluated using various performance metrics. The phases of the proposed model required for performance prediction are depicted in Figure 2.

3.1. Materials and Methods

The following subsections discuss the various steps involved in the proposed model for achieving precision in education depicted in Figure 2. It describes each step in detail, and how data collection and utilization for training were carried out sequentially.

3.1.1. Data Acquisition

In the first stage, a Google Forms-based online questionnaire was developed to collect data about students; this included as many variables as possible that could possibly be used to predict how they would do during the COVID-19 pandemic. This survey was developed with the intention of collecting information from students enrolled in higher education. A total of 30 different sample questions were used for the survey. Subsequently, this questionnaire was distributed to various Pakistani university students. The total number of responses that were gathered was 4000. The remaining responses were discarded after data on students majoring in “computer science” and “management science” were extracted from the first set of responses. These questions served as attributes for the present study.

3.1.2. Data Resampling

The next step involved compiling the raw data collected through the survey. The Monte Carlo method was used for resampling to ensure that the data were accurate. After that, preprocessing of the data was carried out in order to eliminate any unnecessary outliers that were still present in the data.
In order to compile our own dataset, we devised a questionnaire and collected responses through a Google Form. Then, the Monte Carlo method was utilized for data resampling because Monte Carlo estimation is a technique that uses a sample of actual data to estimate the probability of a random variable’s quantity. The Monte Carlo method is defined by the following mathematical formula, which is derived from [14]:
F ( G )   1 M m = 1 M g n
The mathematical symbol “≈” in Equation (1) shows that the formula at the right inside of this symbol only gives an “estimate” of what the random variable G expects function F(G) to be.

3.1.3. Data Pre-Processing

The various steps of data pre-processing employed by this proposed research are described in detail in Figure 3 below. The “filtering method” was used to deal with missing data values and remove unnecessary information during the pre-processing phase of data analysis.

3.1.4. Feature Selection and Extraction

Feature extraction and selection was performed to select attributes required for research. The “Pearson Correlation Coefficient”, which was calculated using the following mathematical equation, was used to select features that were highly correlated with the desired output [16]:
r =   ( a i a ¯ )   ( e i e ¯ )   ( a i a ¯ ) 2   ( e i e ¯ ) 2
In Equation (2) above, r is the correlation coefficient, a represents the values for a-variable in the dataset and ā is the mean of the values of a-variable, e represents the values for e-variable in the dataset and ē is the mean of the values of e-variable. After selecting potential attributes, these extracted attributes were then later passed to the model for training. A supervised machine learning technique was used to train the model on selected data attributes using the Catboost gradient algorithm.

3.1.5. Supervised Machine Learning

A subcategory of machine learning and artificial intelligence known as “Supervised Learning” was used to train the machines through labelled datasets [25]. The expected outcome was predicted with the help of the provided training data, which contained the input and the correct output. The following loss function was used for calculating correctness of an algorithm [26]:
Y = f ( X )
Equation (3) above shows the mapping function, where “Y” is the output variable, “X” is input variable, and “f” is the mapping function. The mapping function adjusts the values each time when a new input value (X) is entered and then, after calculation, gives the desired result (Y). Supervised learning optimizes the performance of the model with the help of past experience.

3.1.6. Catboost Algorithm Architecture

The Catboost classifier is known as one of the most commonly used supervised machine learning algorithms, and is the advanced version of the gradient boosting algorithm. The steps of the proposed CatBoost algorithm are defined in Algorithm 1:
Algorithm 1: Proposed Catboost algorithm for performance analysis
Input: {(ax,bx)}mx=1, i, α, l, t, switch
  • Πr <- random variation of [1,m] for r = 0…t;
  • N0(x) <- 0 for x = 1…m;
  • if switch = Plain then
  •  Nr(x) <- 0 for r = 1…t, x: πr(x) <= 2k+1
  • if switch = Ordered then
  • for k <- 1 to [log2m] do
  •   Nr,k(x) <- 0 for r = 1…t, x = 1…2k+1;
  • for s <- 1 to i do
  •  Ss, {Nr)}r=1 <- BuildTree({Nr}r = 1, {(ax,bx)} mx=1, i, α, l, t, switch
  •  leaf0(x) <- GetLeaf(ai, Ss, π0) for x = 1…m;
  •  grad0 <- CalGrad (l, N0, y);
  • foreach leaf k in Ss do
  •   yk <- average(grad0(x) for x: leaf0(x) = k);
  •  N0(x) <- N0(x) + αysleafo(x) for x = 1…m;
  • return f(g) = Σis=1 Σkαysk1(GetLeaf(iSs,Applyswitch) = k);
The above algorithm shows the workflow of Catboost, and how it treats the data and deals with numerical values through their manipulation. Catboost easily deals with the categorical features of a dataset without any label encoding. During the training process, only numerical features are required for most of the machine learning algorithms. To do so, preprocessing is first required. By using “label encoding”, categorical features are converted into numerical features. In its own optimized way, Catboost deals with label encoding automatically by concluding the feature association with the production class. Equation (4) is used by Catboost for label encoding [22]:
c = Count + ( i previous ) max _ Count + i
where i and previous are constants and their values are taken as 0.5 and 1, respectively, by default. Count is the sum of all the output values and max_Count is the addition of similar class objects above the present row. Catboost is mostly used to tackle regression and classification problems.

3.1.7. Model Validation

The phase following model design is the checking of its efficiency. For validation of the proposed model’s working, its performance was evaluated using some performance metrics (accuracy, precision, recall, and F1 score). A 2*2 confusion matrix is used to depict the diversity between the proposed values of the dataset and those values that are predicted by the model. Equation (5) is an expression for calculating accuracy [23]:
Accuracy = TP + TN TP + TN + FP + FN
Accuracy is basically a measure of the total correct predictions made in the dataset out of the total number of input values. Precision deals with the exactness of the classifier, and is shown through Equation (6):
Precision = TP TP + FP
Recall shows the correctness of a classifier by measuring the correct predictions of class made by the model out of the total input values of class in a dataset. Recall is given by Equation (7):
Recall = TP TP + FN
F-measure is used to prevent any misleading evaluation that may occur due to unbalancing of data. It is the harmonic mean of recall and precision, which is shown in Equation (8):
F measure = 2 ( Precision * Recall ) ( Precision + Recall )
In Equations (5)–(7), TP signifies True Positive, TN symbolizes True Negative, FN denotes False Negative, and FP indicates False Positive.

4. Experiment and Results

Dataset

The dataset used for this study was collected using a questionnaire. The questionnaire was designed to collect data for the COVID-19 period, keeping in view all the essential attributes that are needed to identify students’ individual performance. The questionnaire was designed through Google Forms and was distributed among different universities in Pakistan to collect data from higher education students (bachelor’s, master’s, and doctoral degree students).
The data collected from student surveys are presented in 
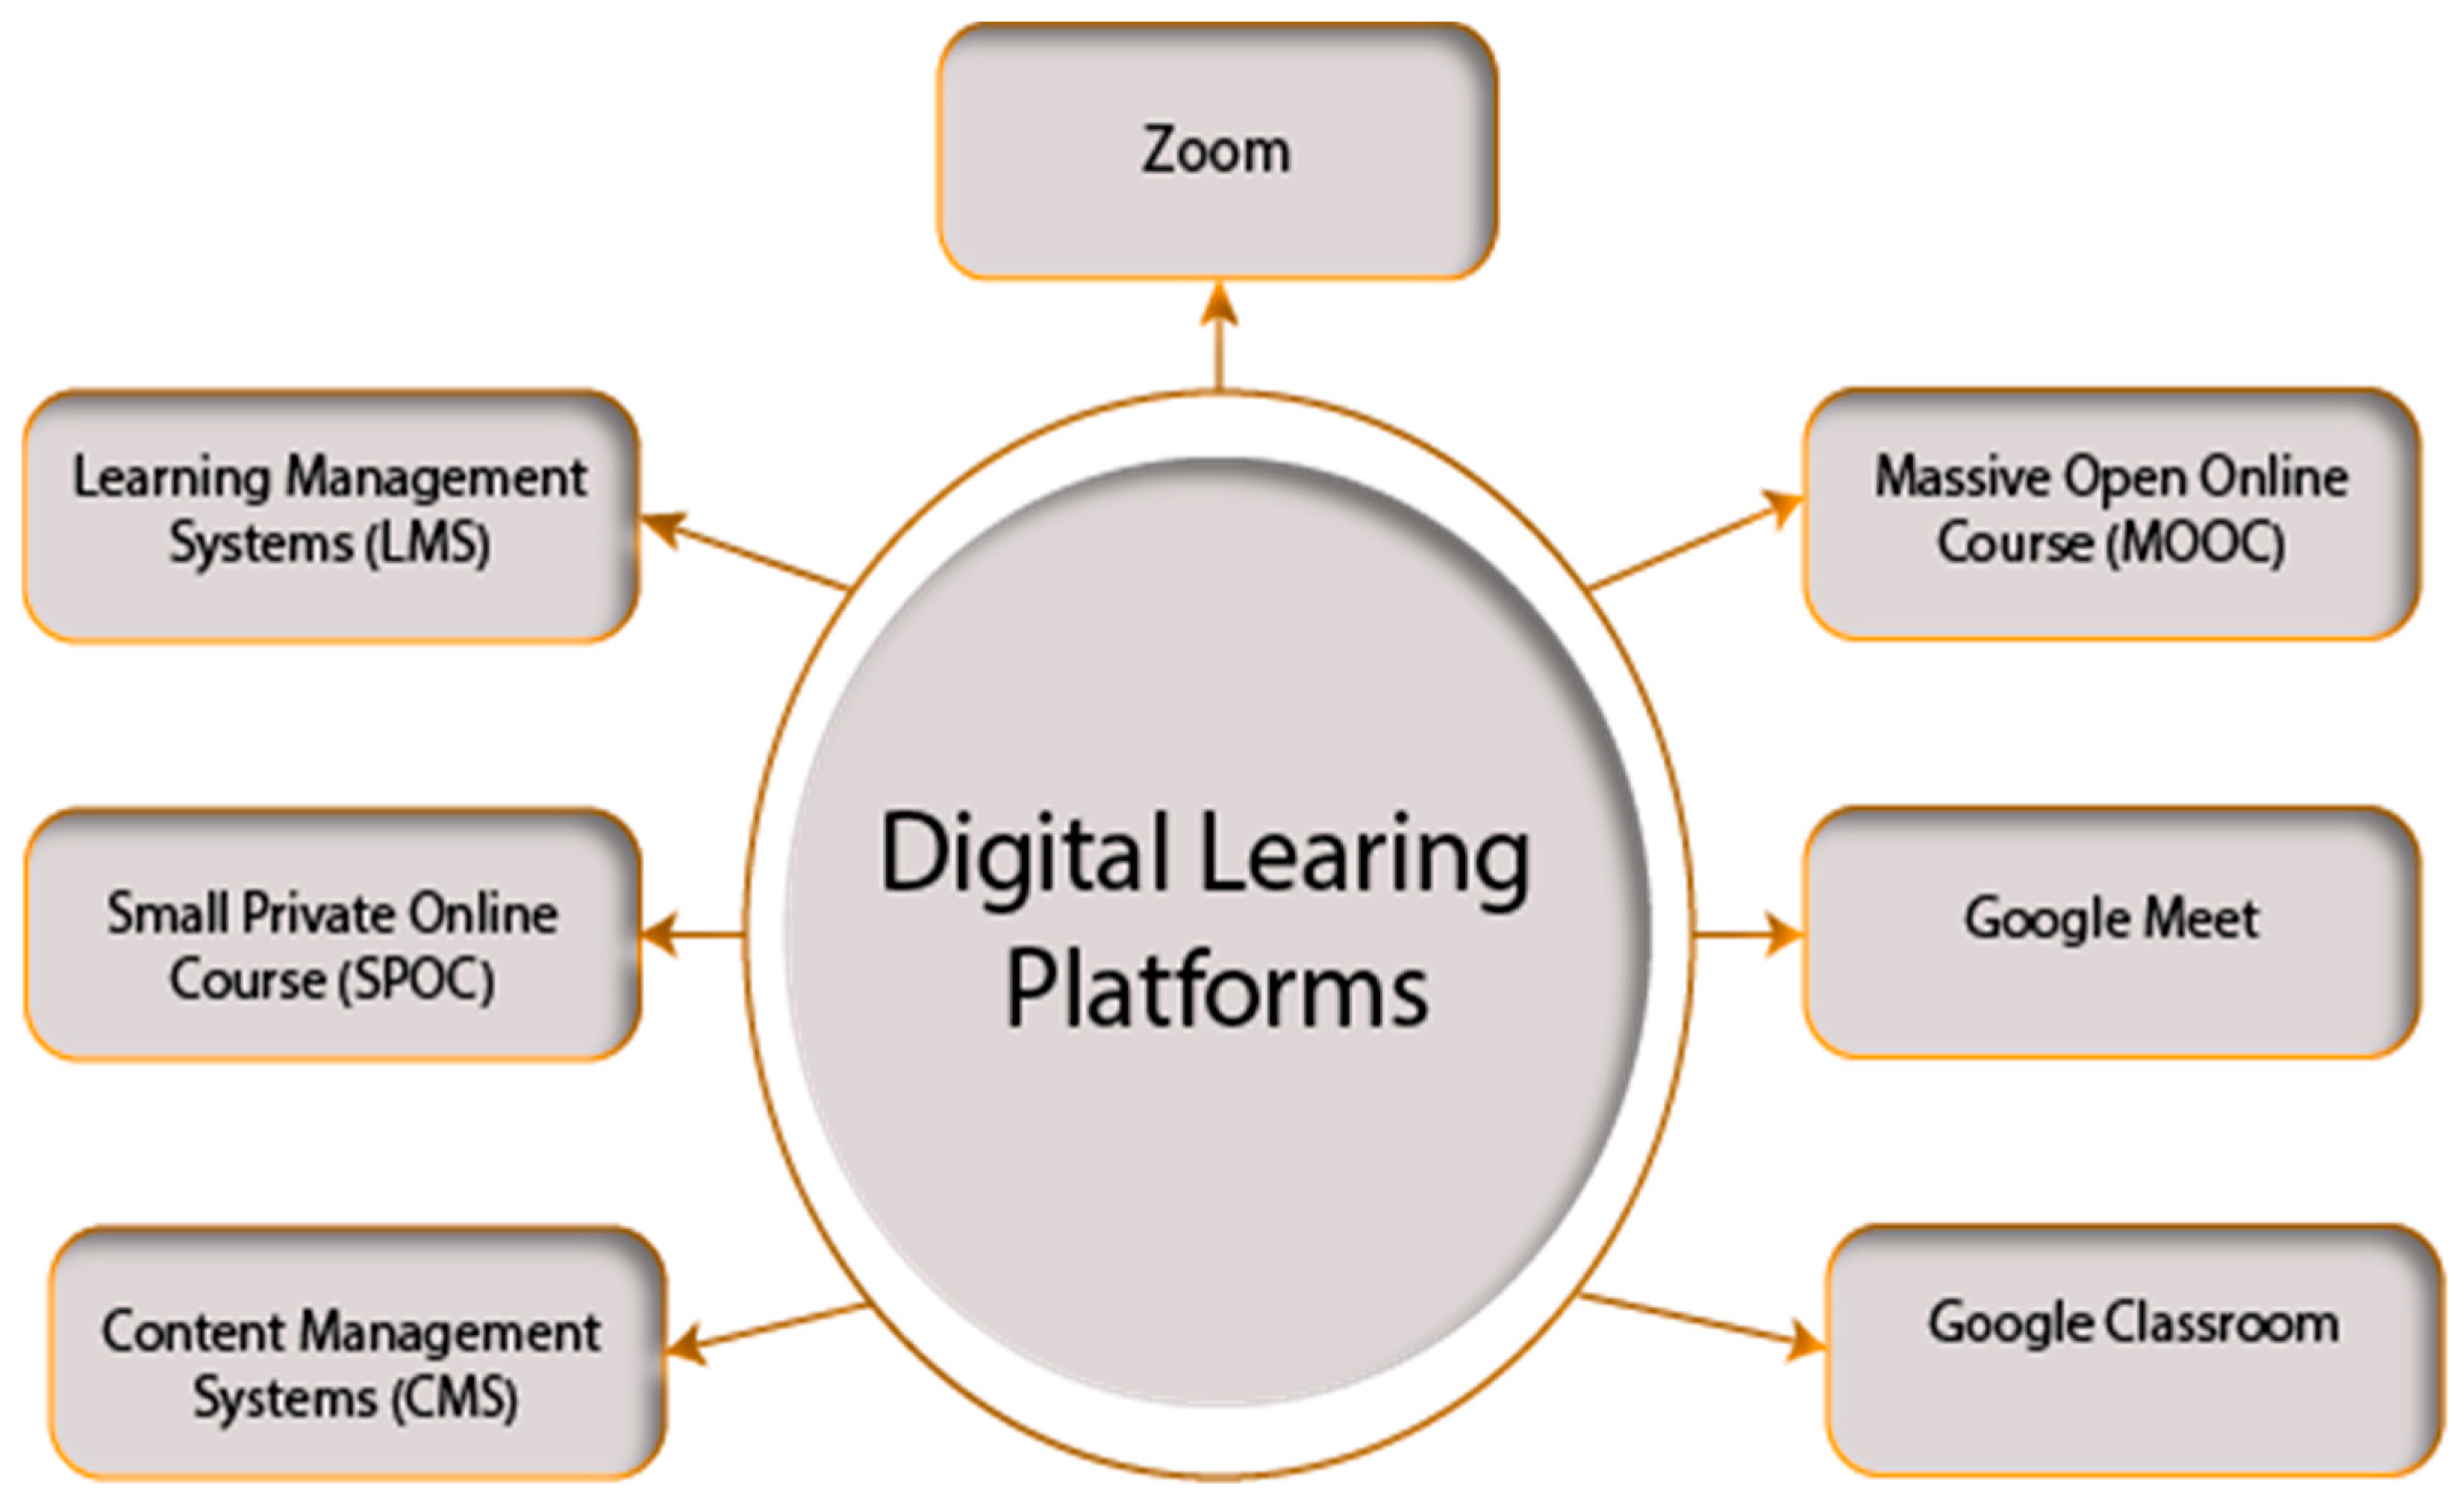
Table 2. Only 15 out of the thirty sampled questions were chosen as the best attributes for conducting the research necessary to achieve precision education. The total number of samples collected from higher education students was 4000. These responses were reduced to 2200 by selecting only those students who were enrolled in degrees of computer science and management science during the COVID-19 period. This sampled data included bachelor’s, master’s, and Ph.D. students in proportions of 60%, 30%, and 10%, respectively. Fifteen sample questions that were considered to be best were treated as the attributes to study the impacts of these 15 factors on the performance of students during the COVID-19 period. The primary attributes considered are related to on-site classes, medium of online classes, workload during online sessions, student satisfaction level, mentor feedback, availability of resources required for online classes, issues regarding lectures and practical work, preferred method of mentorship, experience of using digital platforms, and participation during lectures.
The sample questions used for surveys are presented in 
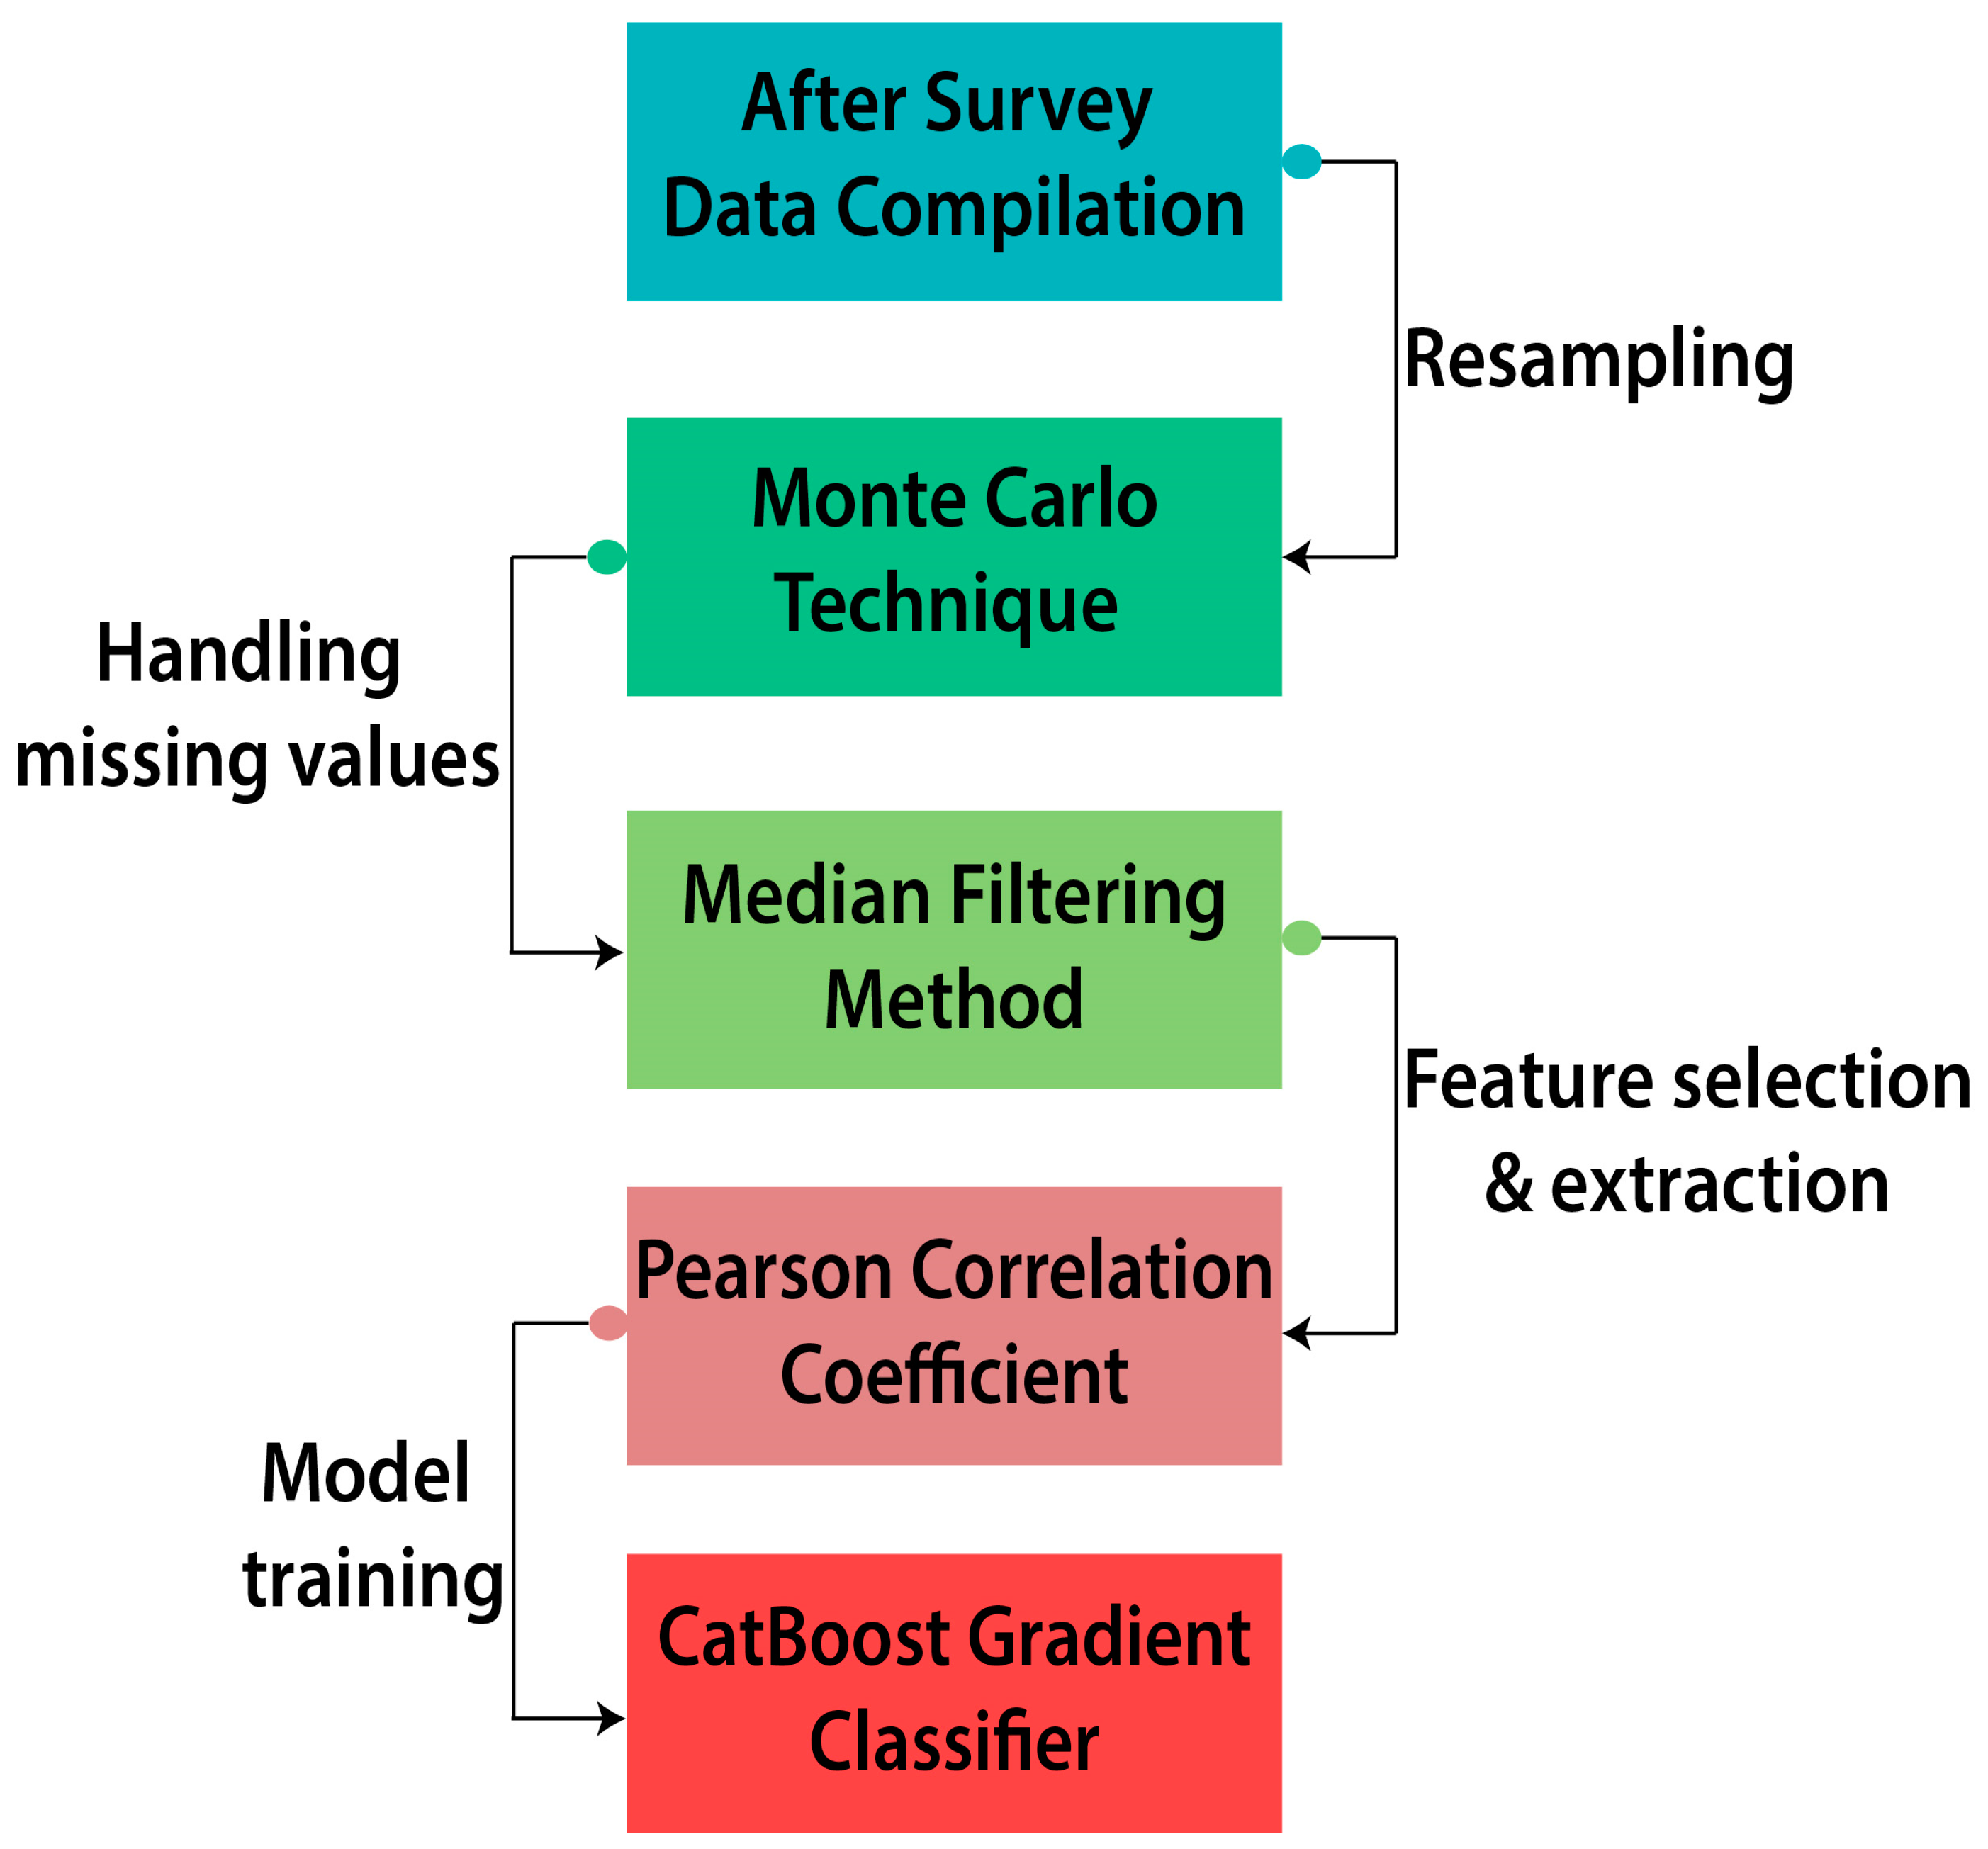
Table 3. Responses from students to these questions were later used as potential performance evaluation criteria for each degree student. Then, the proposed framework’s phases were followed. The Monte Carlo method was chosen to rebalance the data. Next, data were preprocessed to eliminate outliers and eliminate missing data. Using the label encoding technique, categorical data characteristics were converted to numeric values through preprocessing. This study’s model was trained using Google Collaboratory’s “Catboost classifier” for machine learning. Python’s Numpy and Pandas libraries were utilized to perform effective numerical operations on the data.
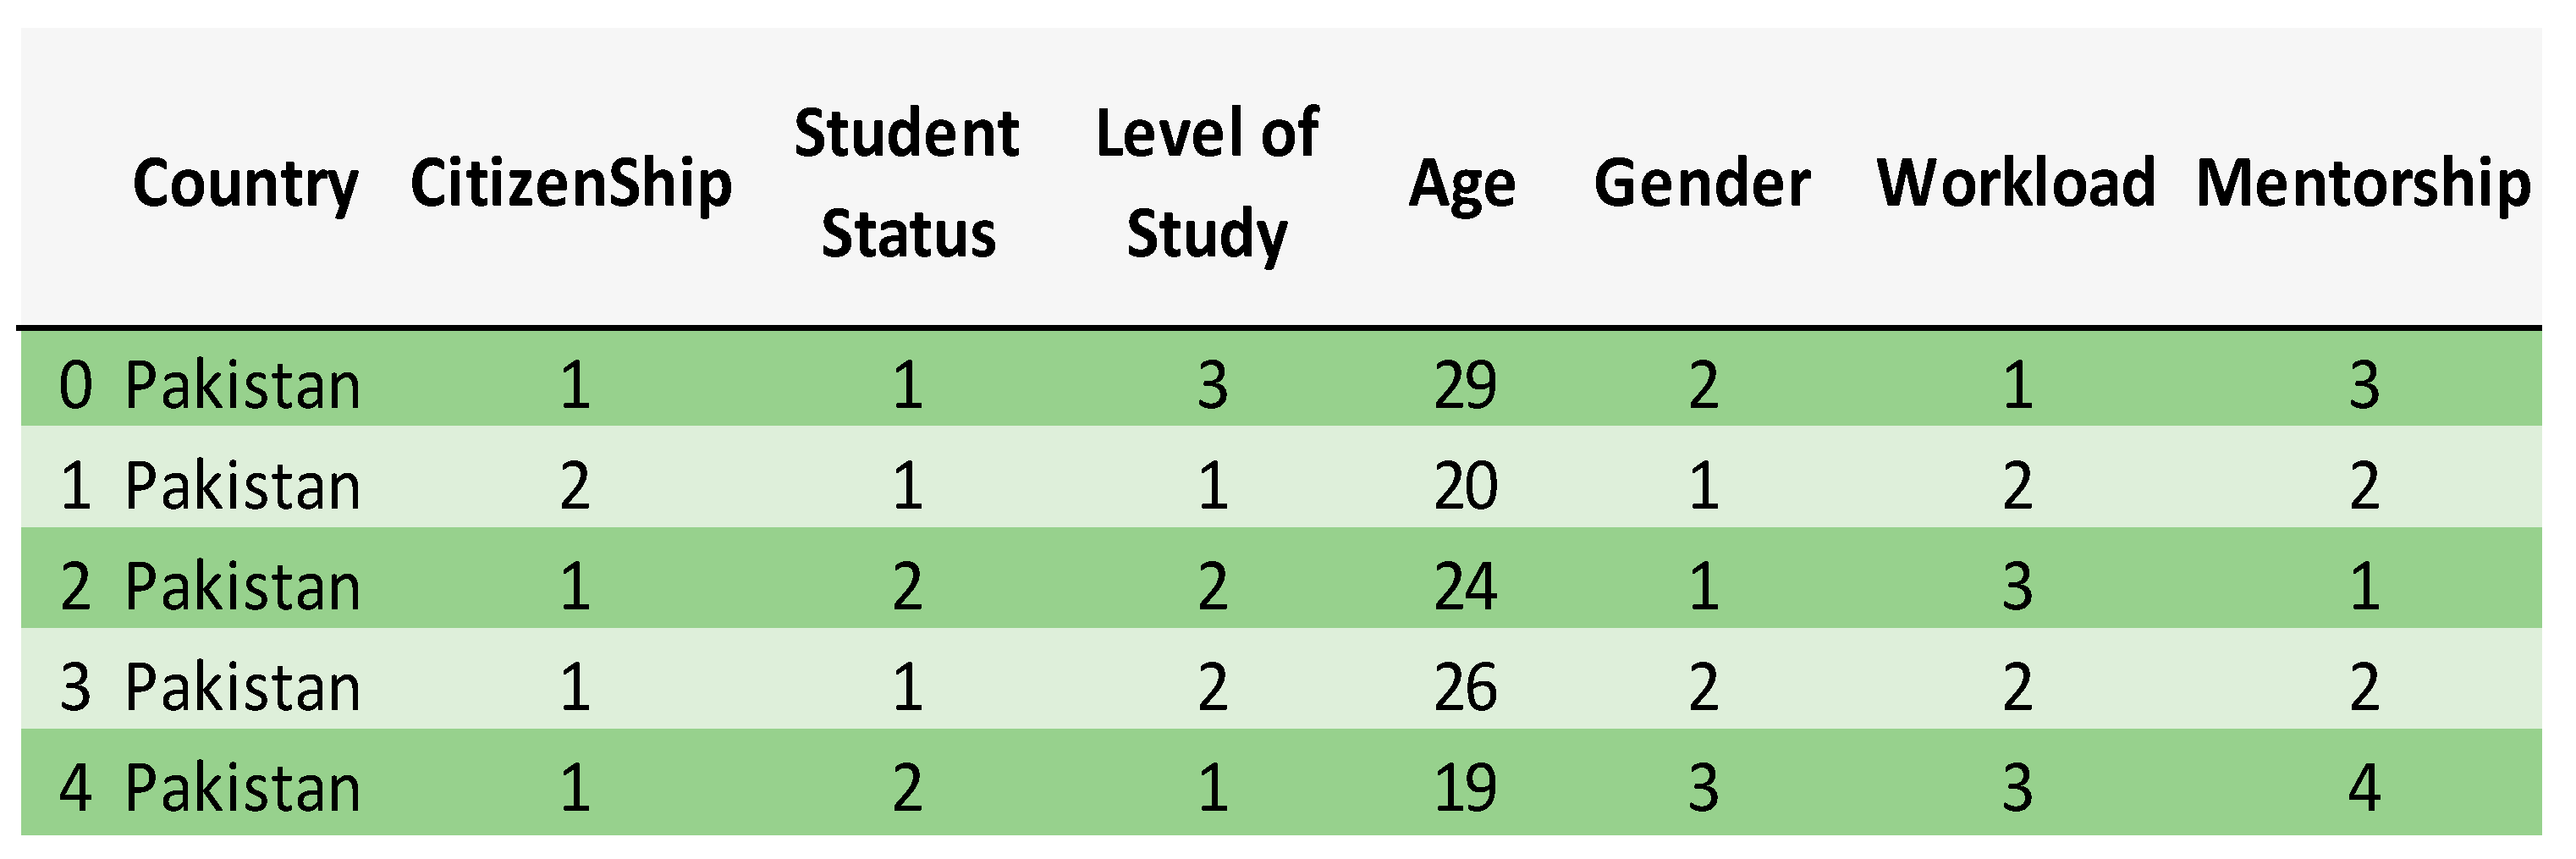
Figure 4 demonstrates a sample of the pre-processed data that was converted to numeric values by the Catboost classifier. One is a Pakistani national, while the other two are dual citizens with another country. This refers to students with dual nationalities who were studying in Pakistan during COVID-19. Regarding Student Status, 1 corresponds to full-time student status, while 2 corresponds to part-time student status. In the classification of students according to their level of education, levels 1, 2, and 3 correspond to bachelor’s, master’s, and doctoral degrees, respectively. For Gender, 1 corresponds to male students, 2 to female students, and 3 to students who did not wish to disclose their gender. Regarding Workload, 1, 2, and 3 correspond to increased, decreased, and average, respectively. For Mentorship 1, 2, 3, and 4 correspond to video-call, audio-call, e-mail, and social networking, respectively, i.e., the online mentorship methods used to instruct students.
The central tendency measure was used for imputing missing values in data. The median interpolation method was applied on a data frame for this purpose. The Pearson correlation technique was used to determine the relationship of features with one another to select the best of the features. Through this, feature selection was performed. 
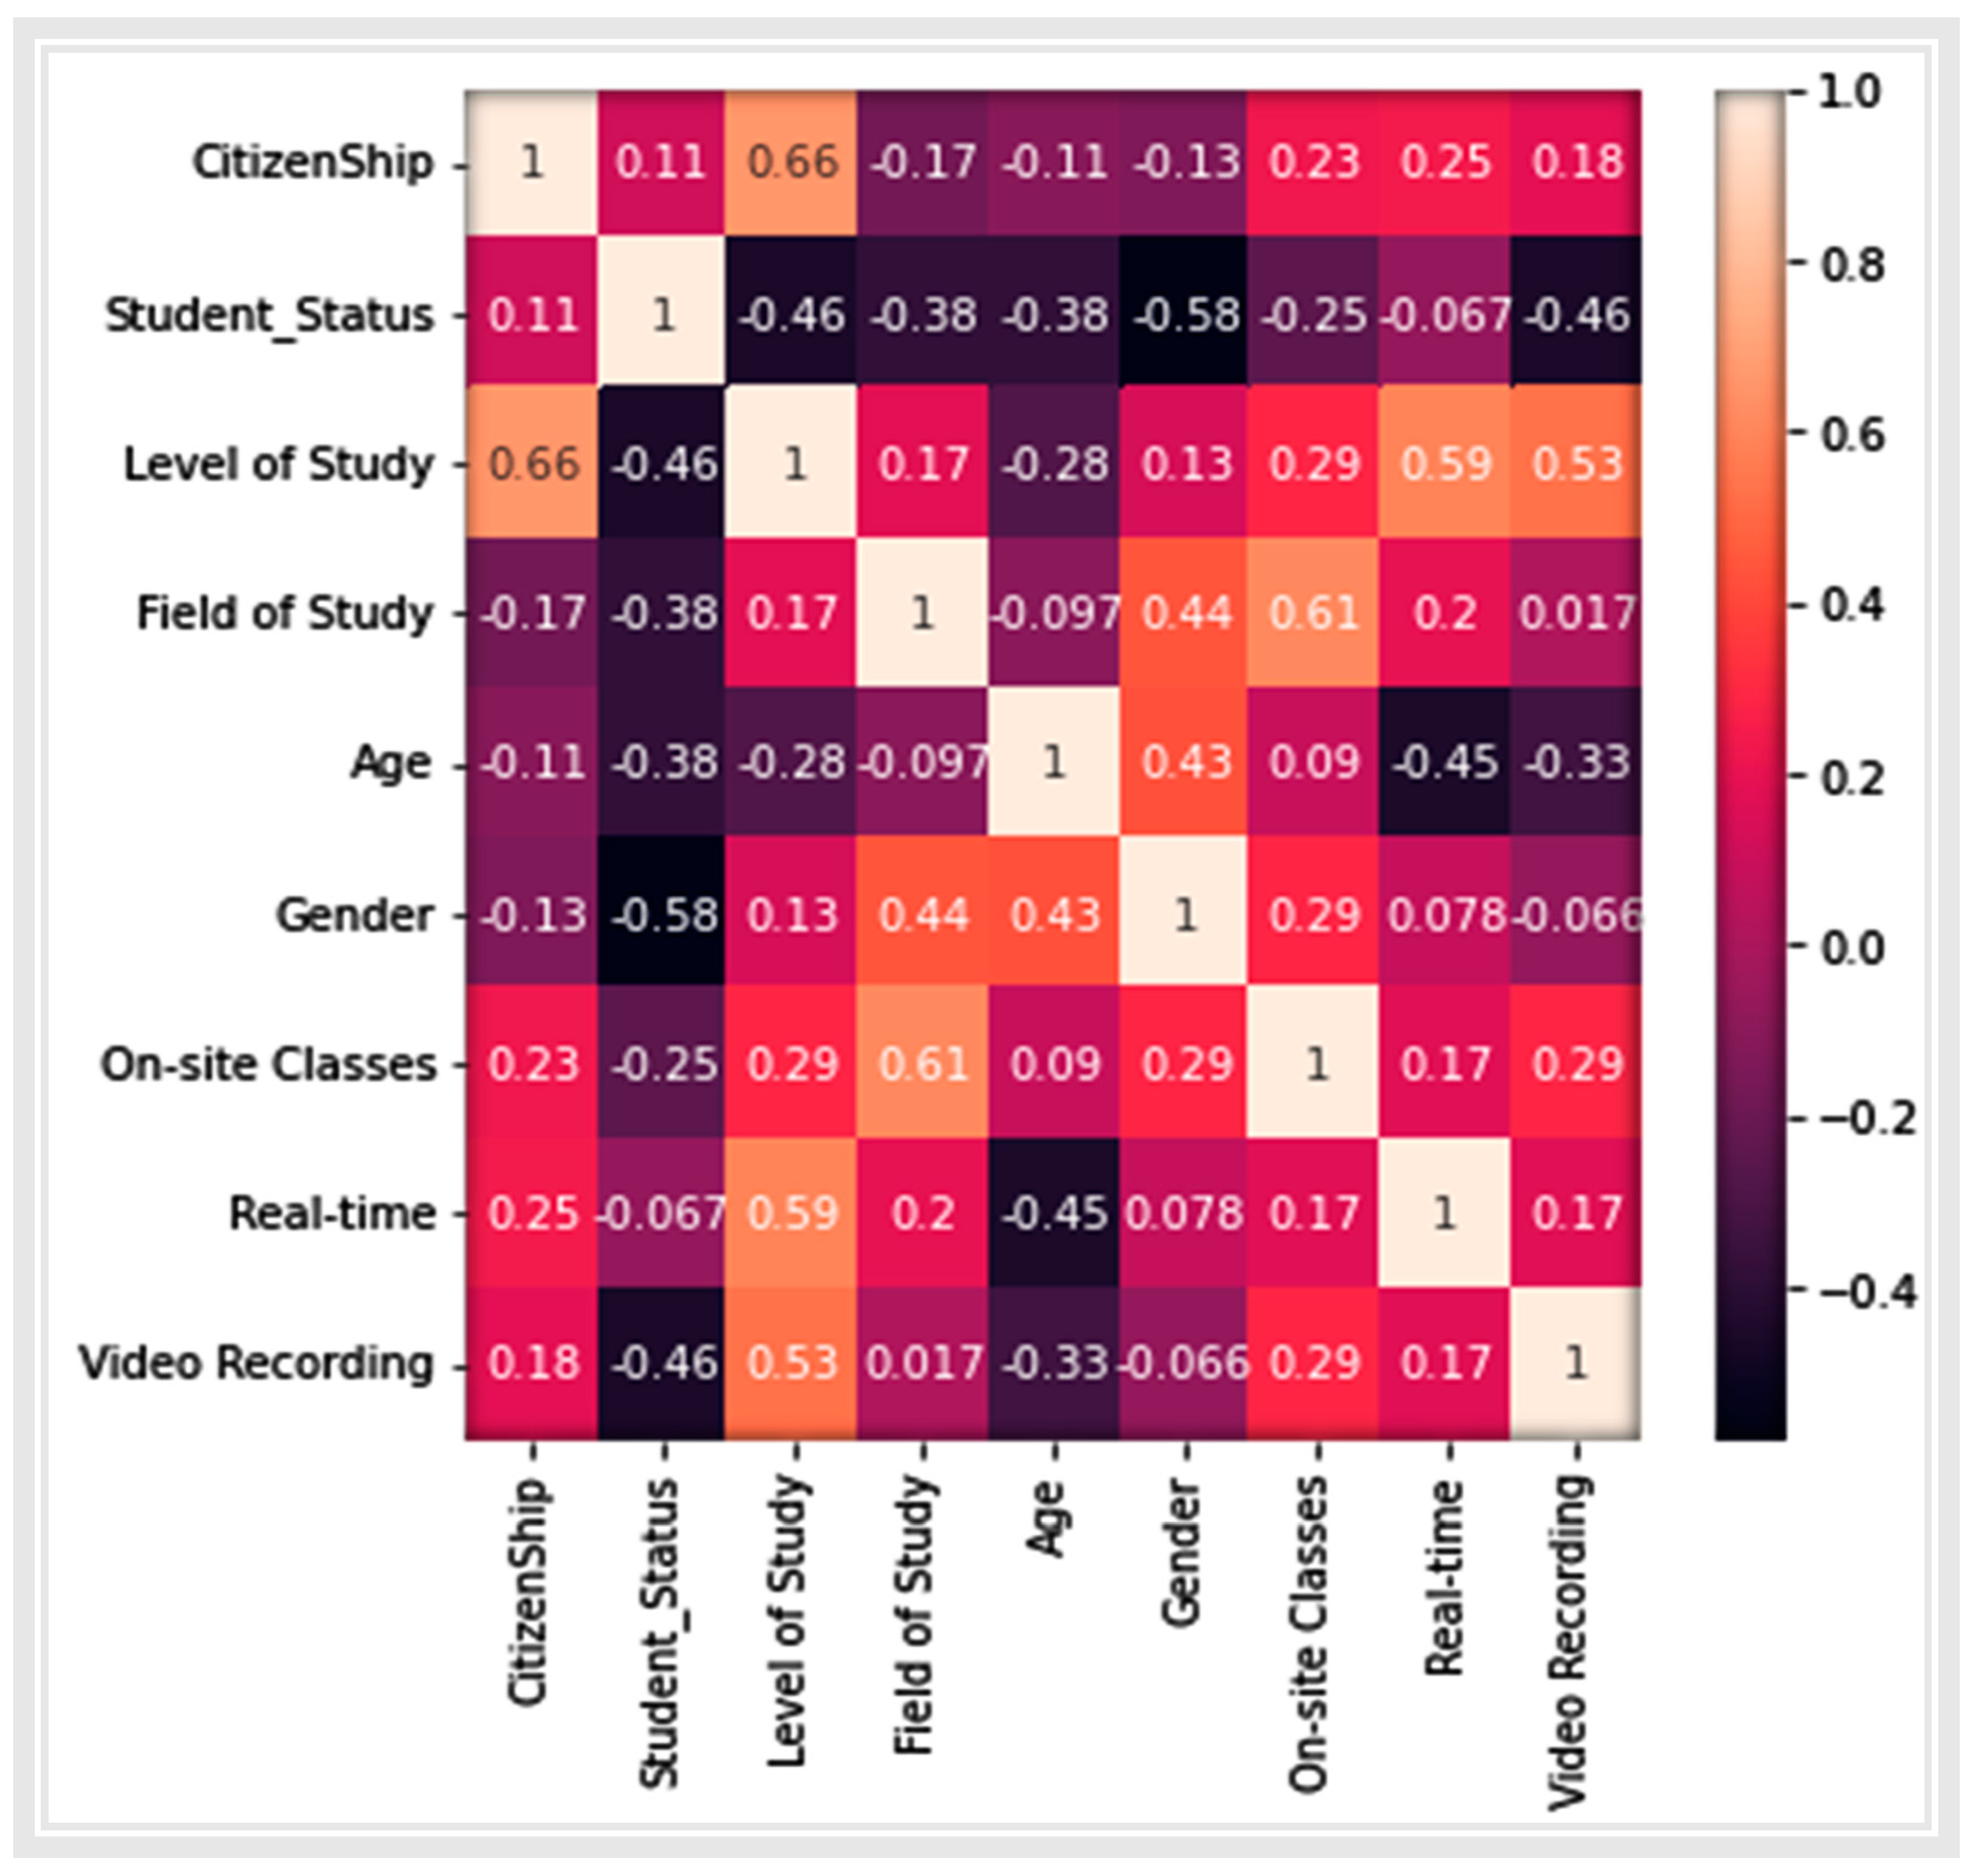
Figure 5 represents a matrix that shows the dependency of some of the features that accurately play a part in the prediction of students’ performance. The value calculated for each feature depicts the strength of the relationship that exists between these features.
The value of correlation lies between −1 to +1. A value of +1 illustrates those values that have a positive linear relationship; 0 depicts no correlation; and −1 represents a total negative relationship between features. Potential features were thus selected using a correlation matrix. The students’ outcomes were affected by a combination of these factors. Some students were not affected at all by certain factors, while others were profoundly impacted by them.
Feature importance analysis is the most important aspect of machine learning because it enables researchers to determine the significant features that are useful for making predictions. Due to this analysis, it has become simple to determine how much each data feature contributes to the model’s final outcome. 
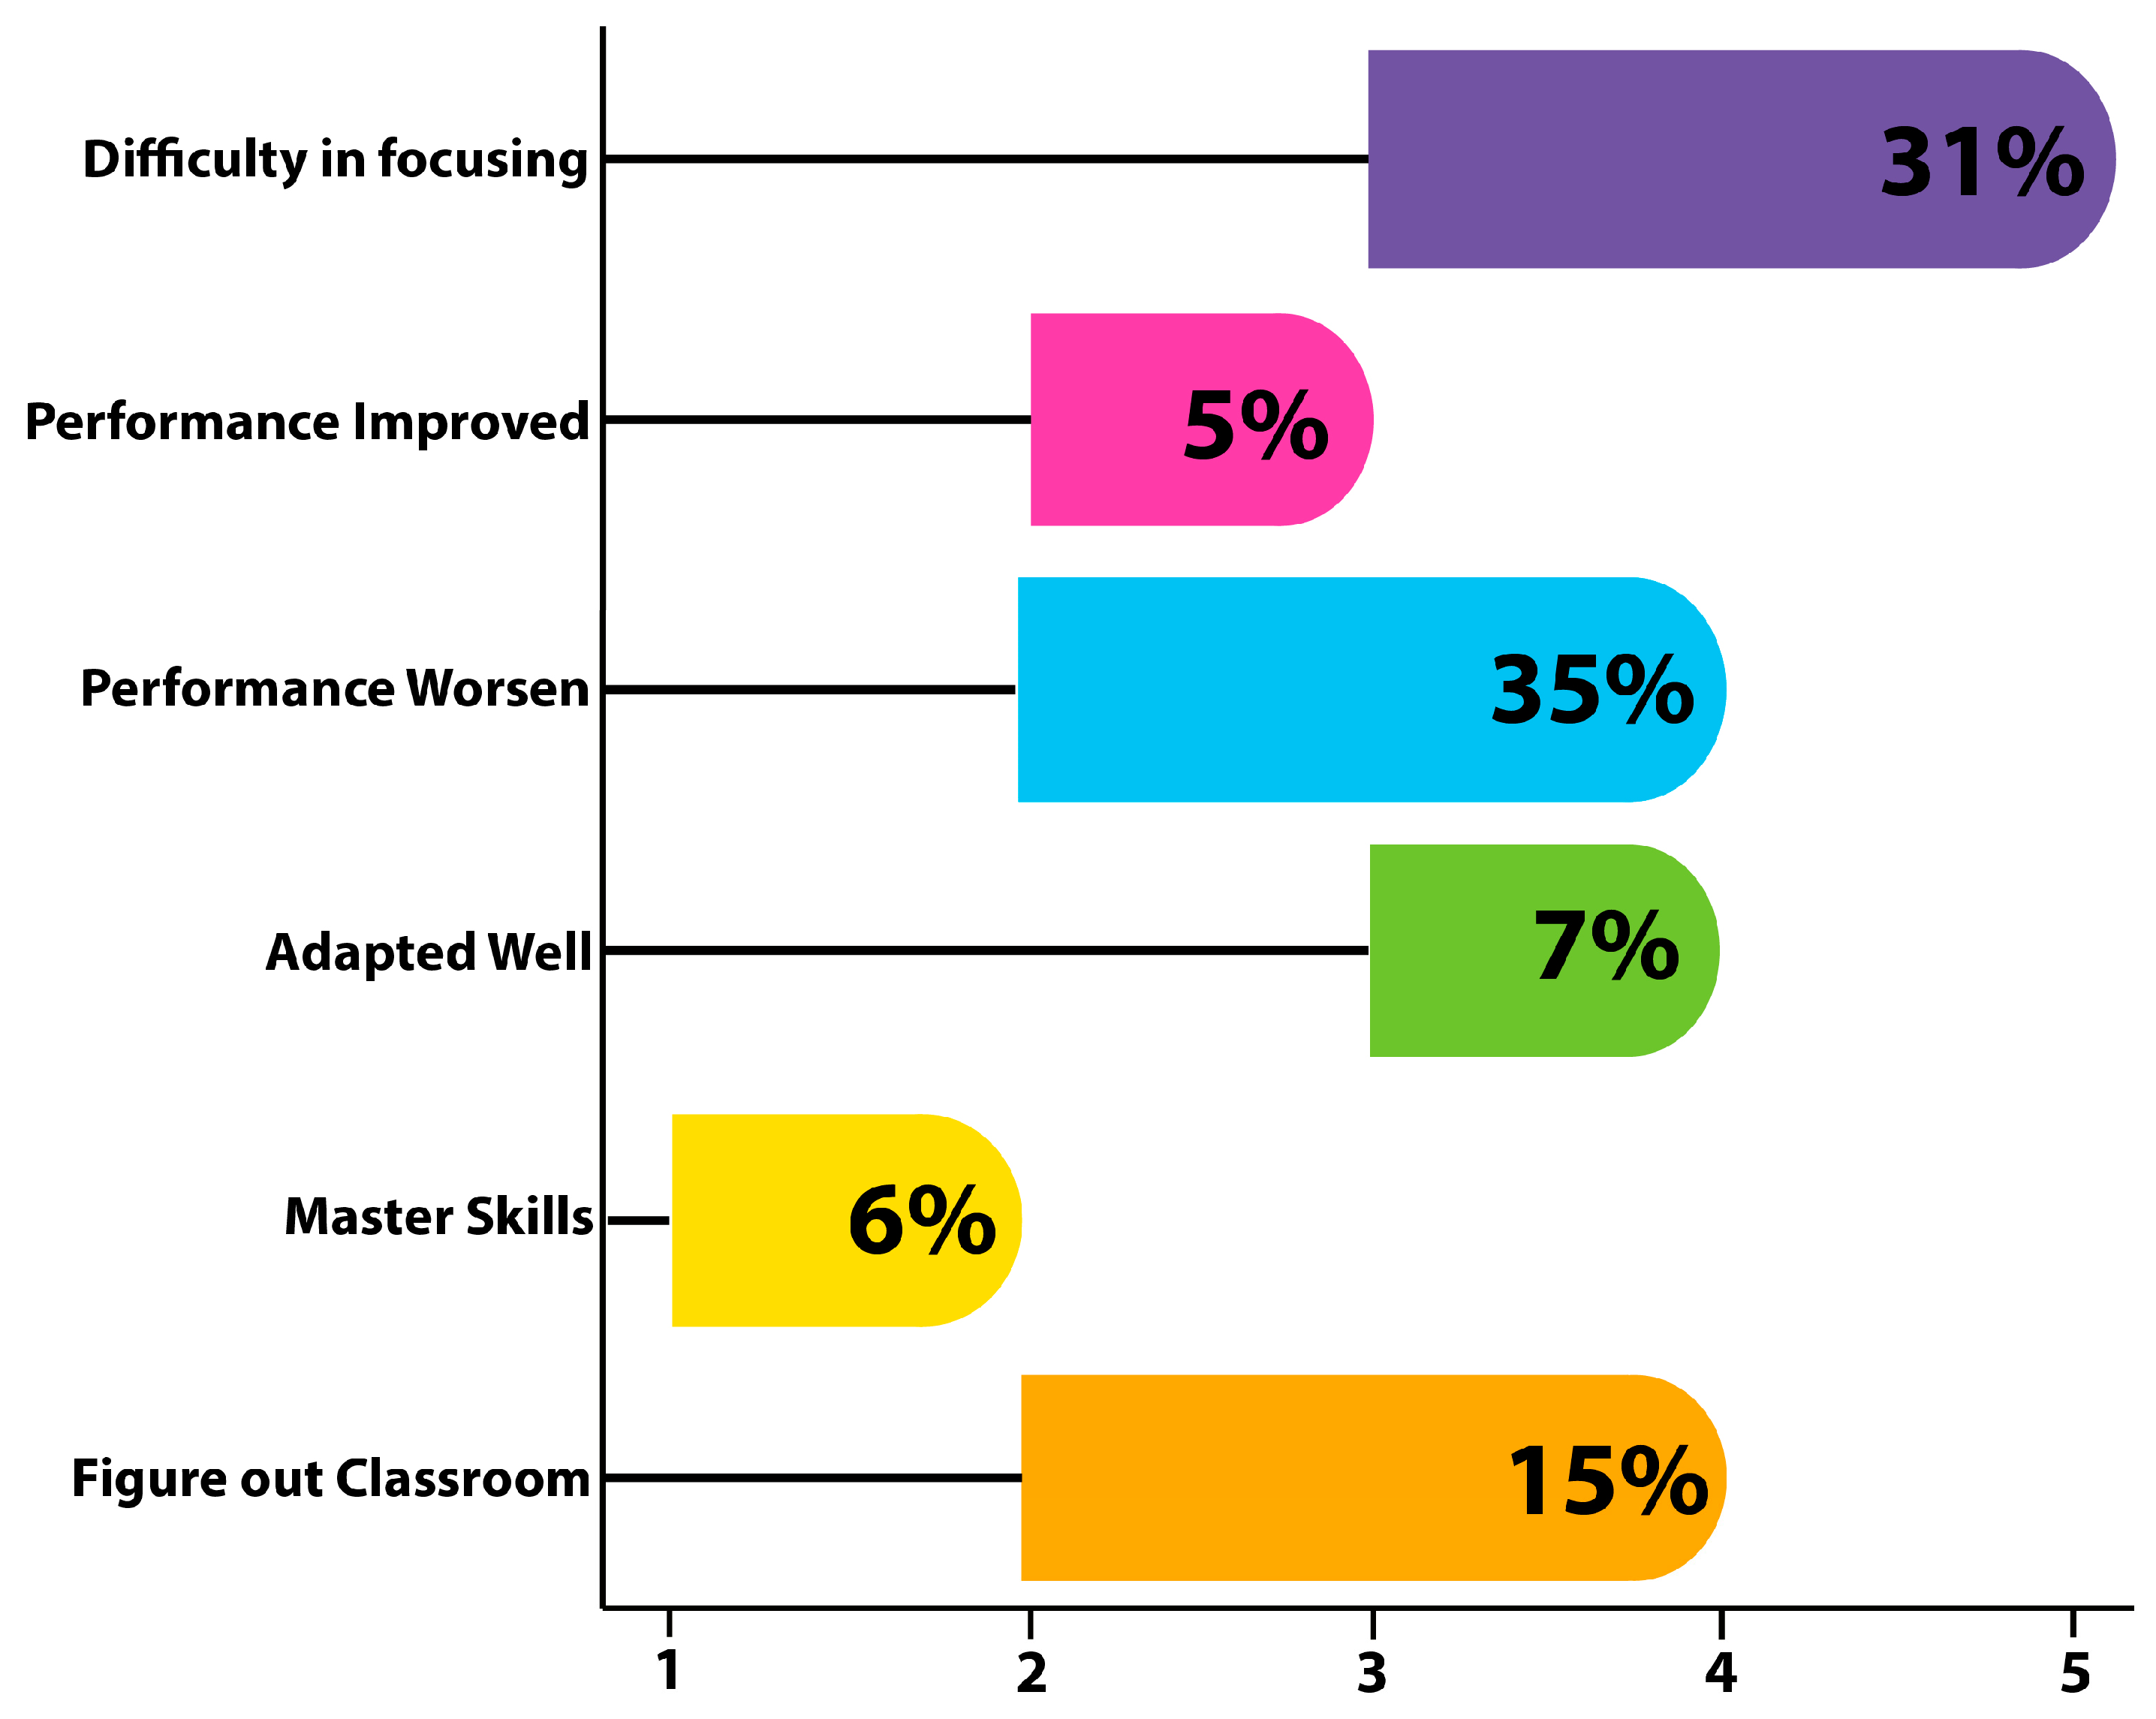
Figure 6 depicts the effect of a new learning and teaching environment on students’ final performance during an online session.
In Figure 6, the Y-axis represents the factors and the X-axis represents the degree to which each factor has affected a student’s performance. In Figure 6, a value of 4–5 indicates that difficulties in focusing during online sessions had a significant impact on 31% of students, followed by a decline in performance affecting 35% of scholars, adaptation to these environments affecting 7% of students, and mastery skills affecting 6% of students, indicating that these factors all had an effect to some degree during online sessions. The performance improvement plotted between 2 and 3 indicates that, during the entire online session, students’ performance improved marginally, affecting a total of 5% of students. During the lockdown period of COVID-19, students encountered a greater number of challenges relating to online study. Due to increased difficulty encountered by students during online sessions, performance was negatively impacted.
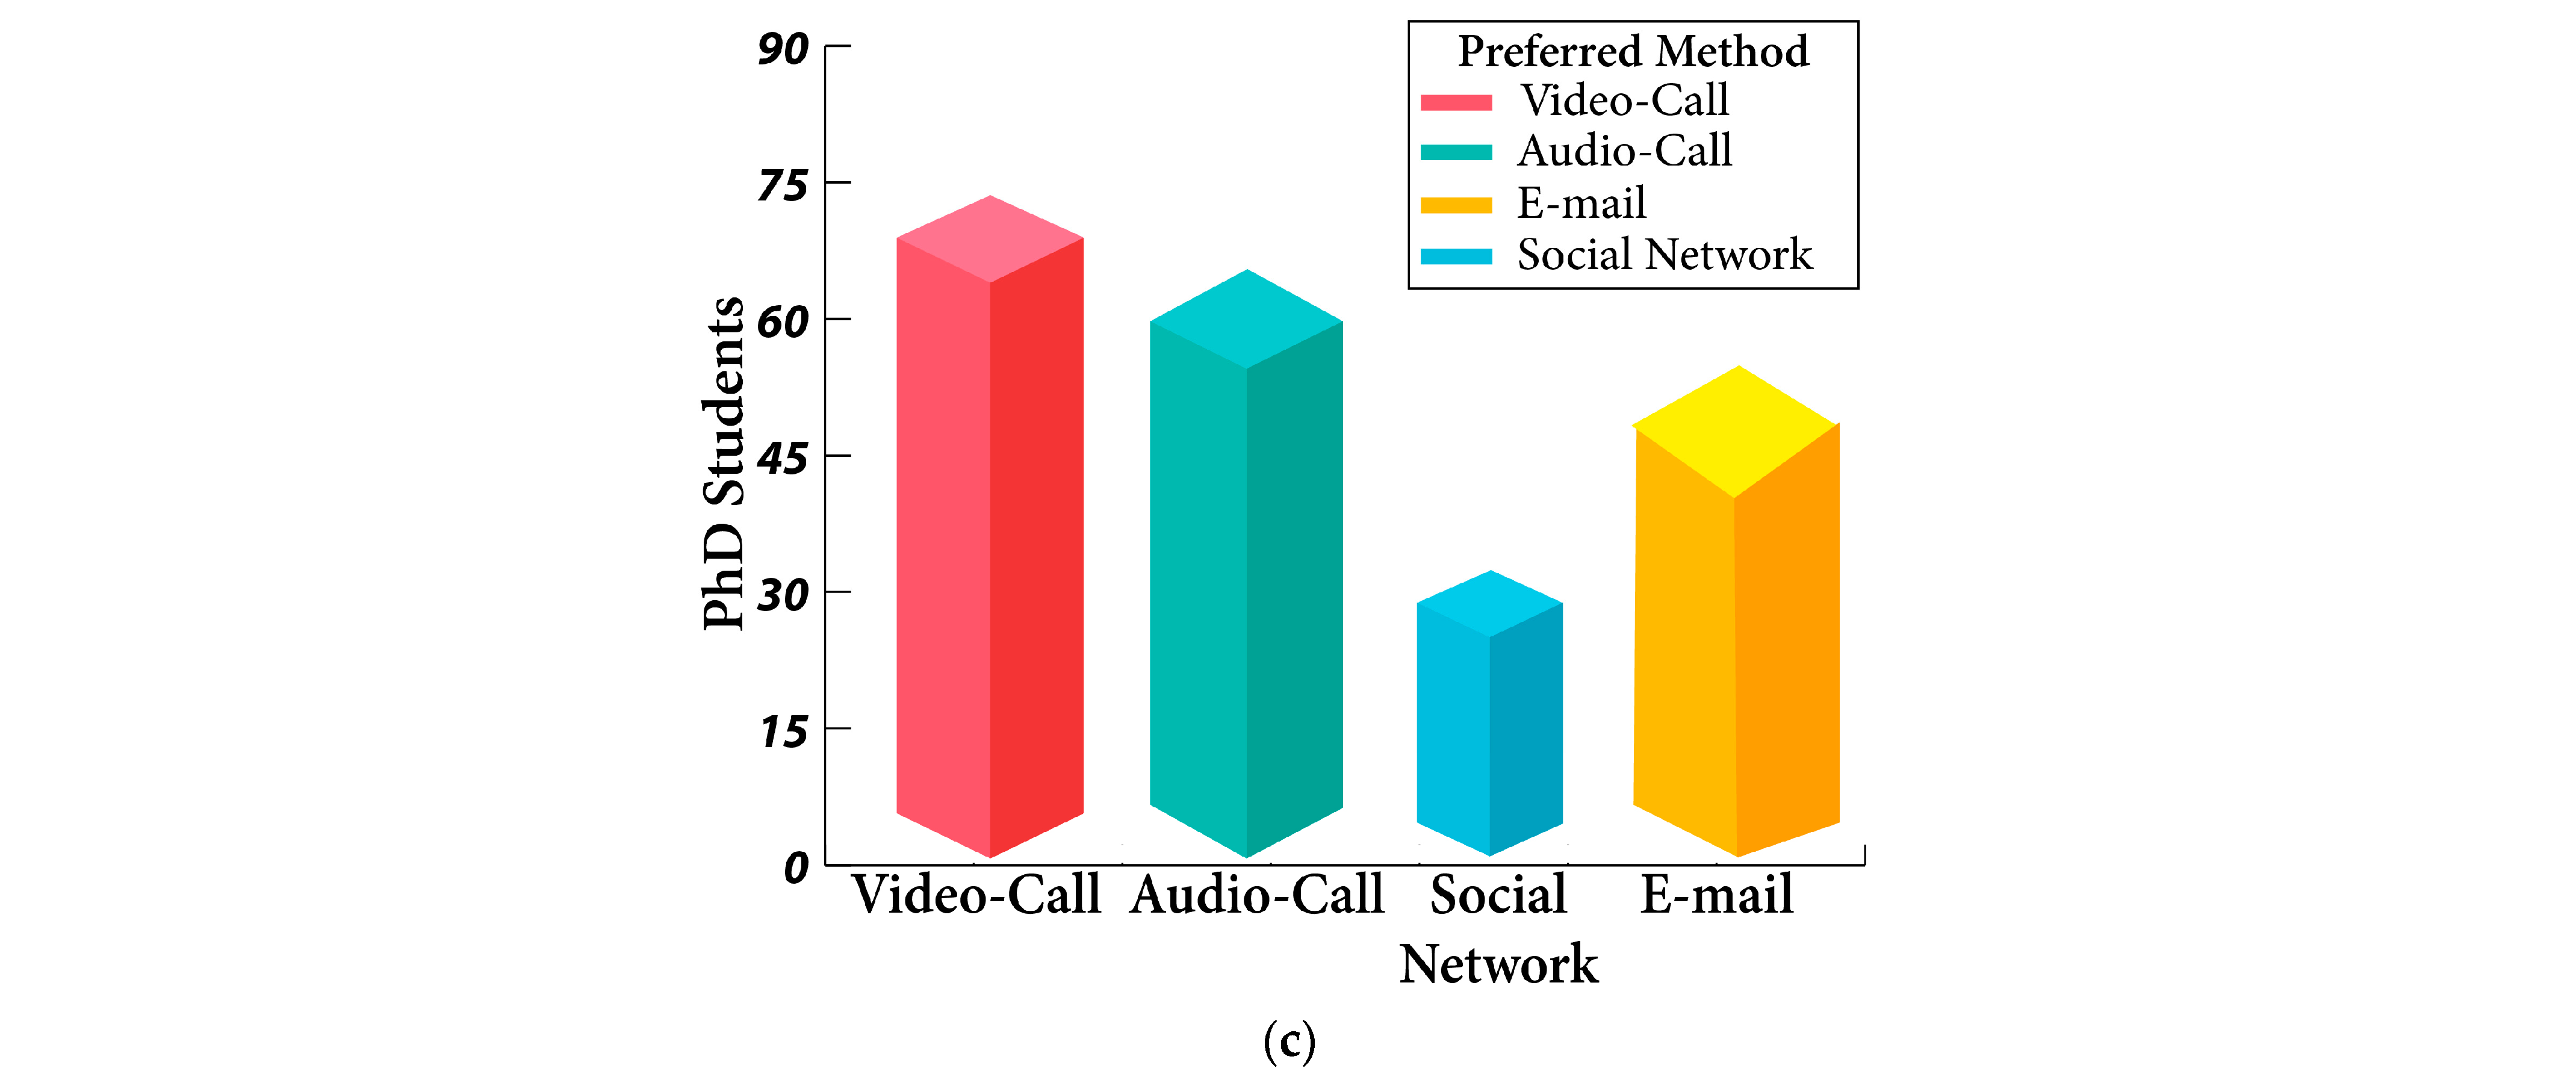
Figure 7 demonstrates the type of mentorship that was utilized to facilitate student learning. Figure 7a indicates that video and audio calls were the most popular tutoring methods for bachelor’s students, while email and social media were the least popular. Figure 7b demonstrates that video calls and social networks were the most popular tutoring platforms for master’s level students. Figure 7c demonstrates that audio calls, followed by video calls, were utilized most frequently by teachers to guide and support PhD students. 
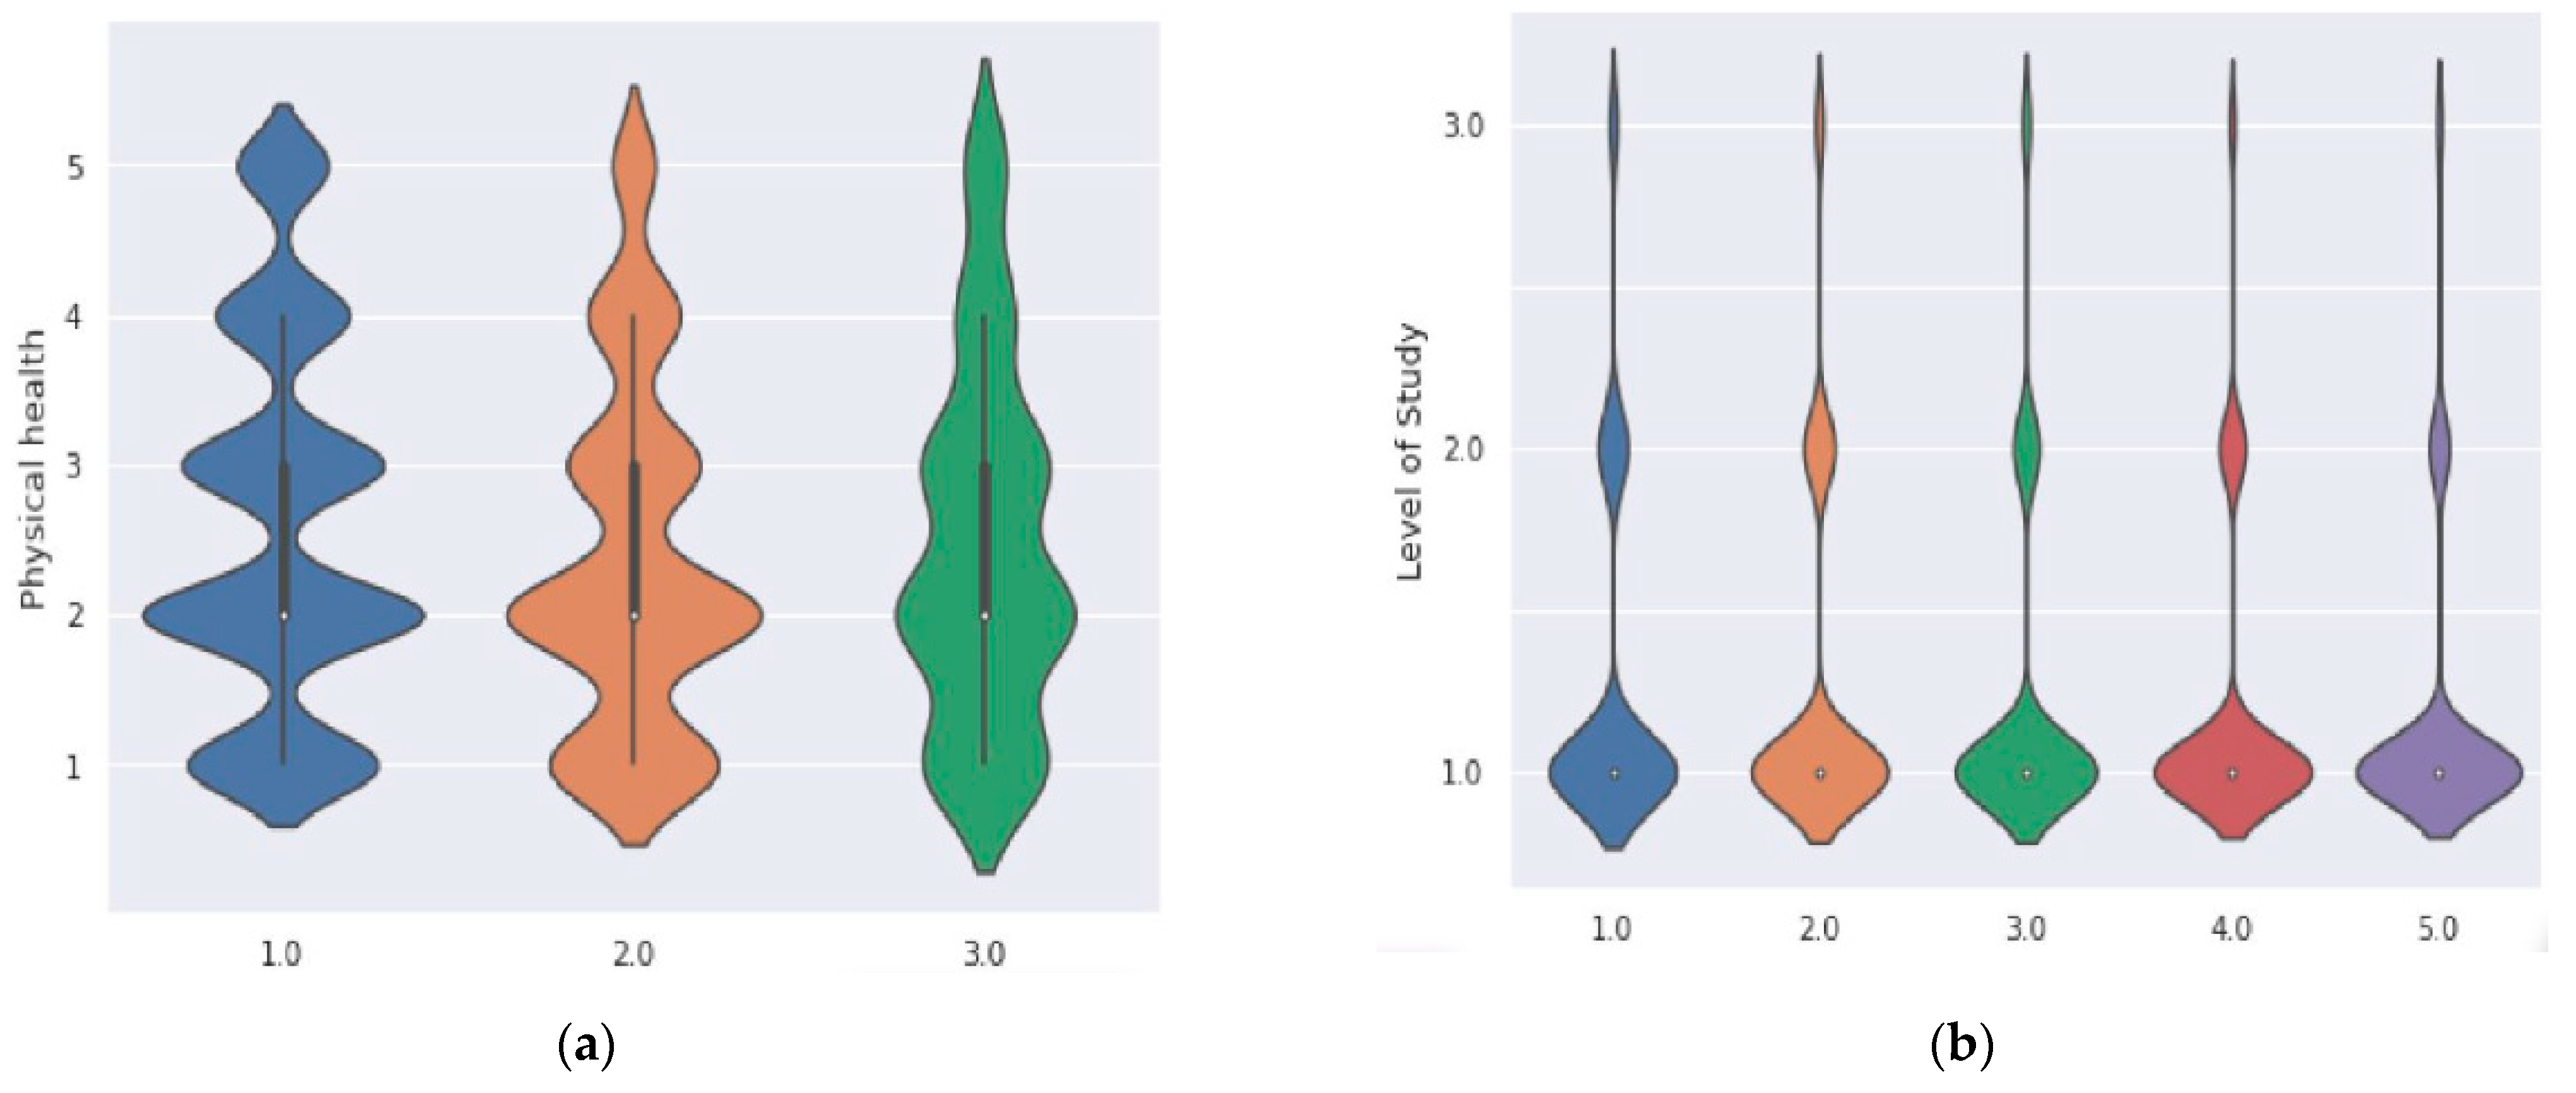
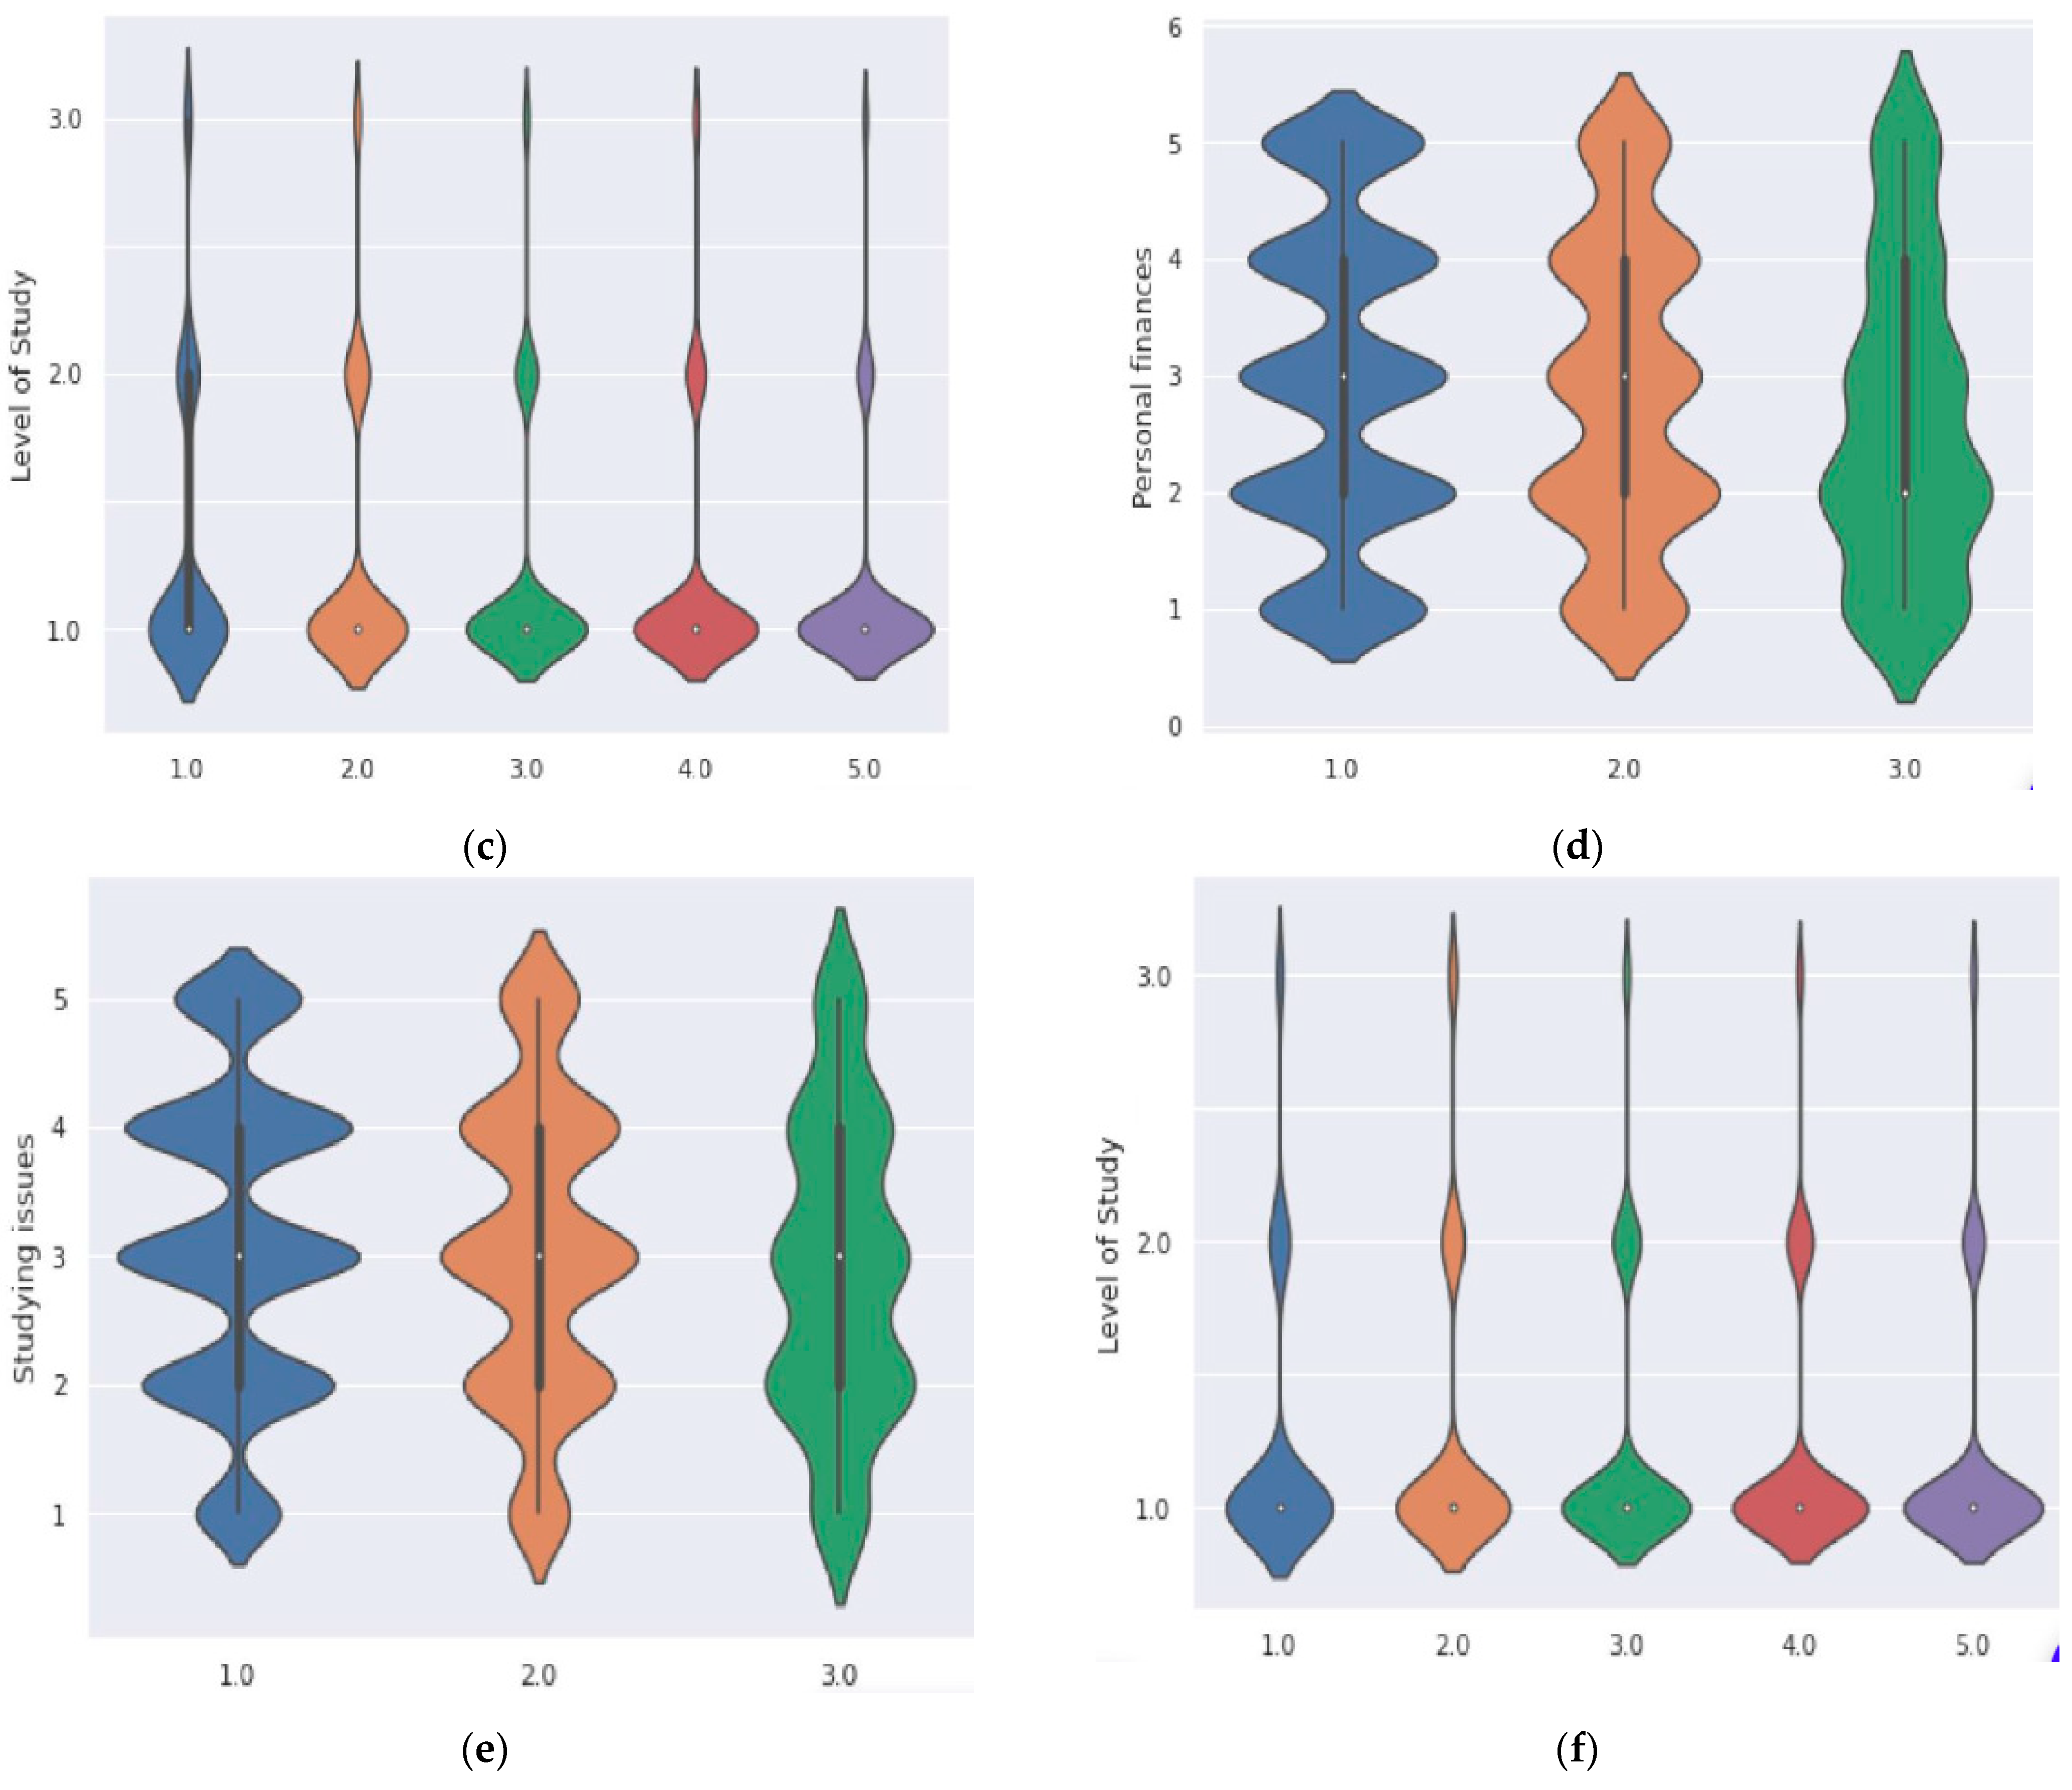
Figure 8 depicts a data visualization of how personal circumstances (physical health, mental health, future education, personal finances, studying issues, and professional career) affected each group of studies (1 corresponds to bachelor’s, 2 to masters, and 3 to doctoral).
Figure 8a depicts the physical health for each level of study, where 1 corresponds to no effect, 2 to a small effect, and 3 to a strong effect. Therefore, ascending from 1 to 5 represents an increase in the intensity of effectiveness. In this manner, the figure demonstrates that the effects of these factors vary for each student. Regarding physical health, bachelor’s degree students were most affected, followed by master’s degree students, and then doctoral degree students. Each group’s mental health is depicted in Figure 8b. From 1 to 5, the intensity of its effectiveness increases. The mental health of bachelor’s students was most affected, while that of doctoral students was least affected. The impact of future education, personal finances, studying issues, and professional career are shown in Figure 8c–f, one for each level of study. The effectiveness of each factor on these students is quantified on a scale from 1 to 5.
After feature selection, supervised learning was adapted to train the model. Out of the 2200 responses collected, data were split between training and testing phases with a proportions of 70% and 30%, respectively. Using that 70% of the data, the model was trained successfully using the Catboost algorithm. The model attained accuracy of 96.8% in achieving precision education for students. 
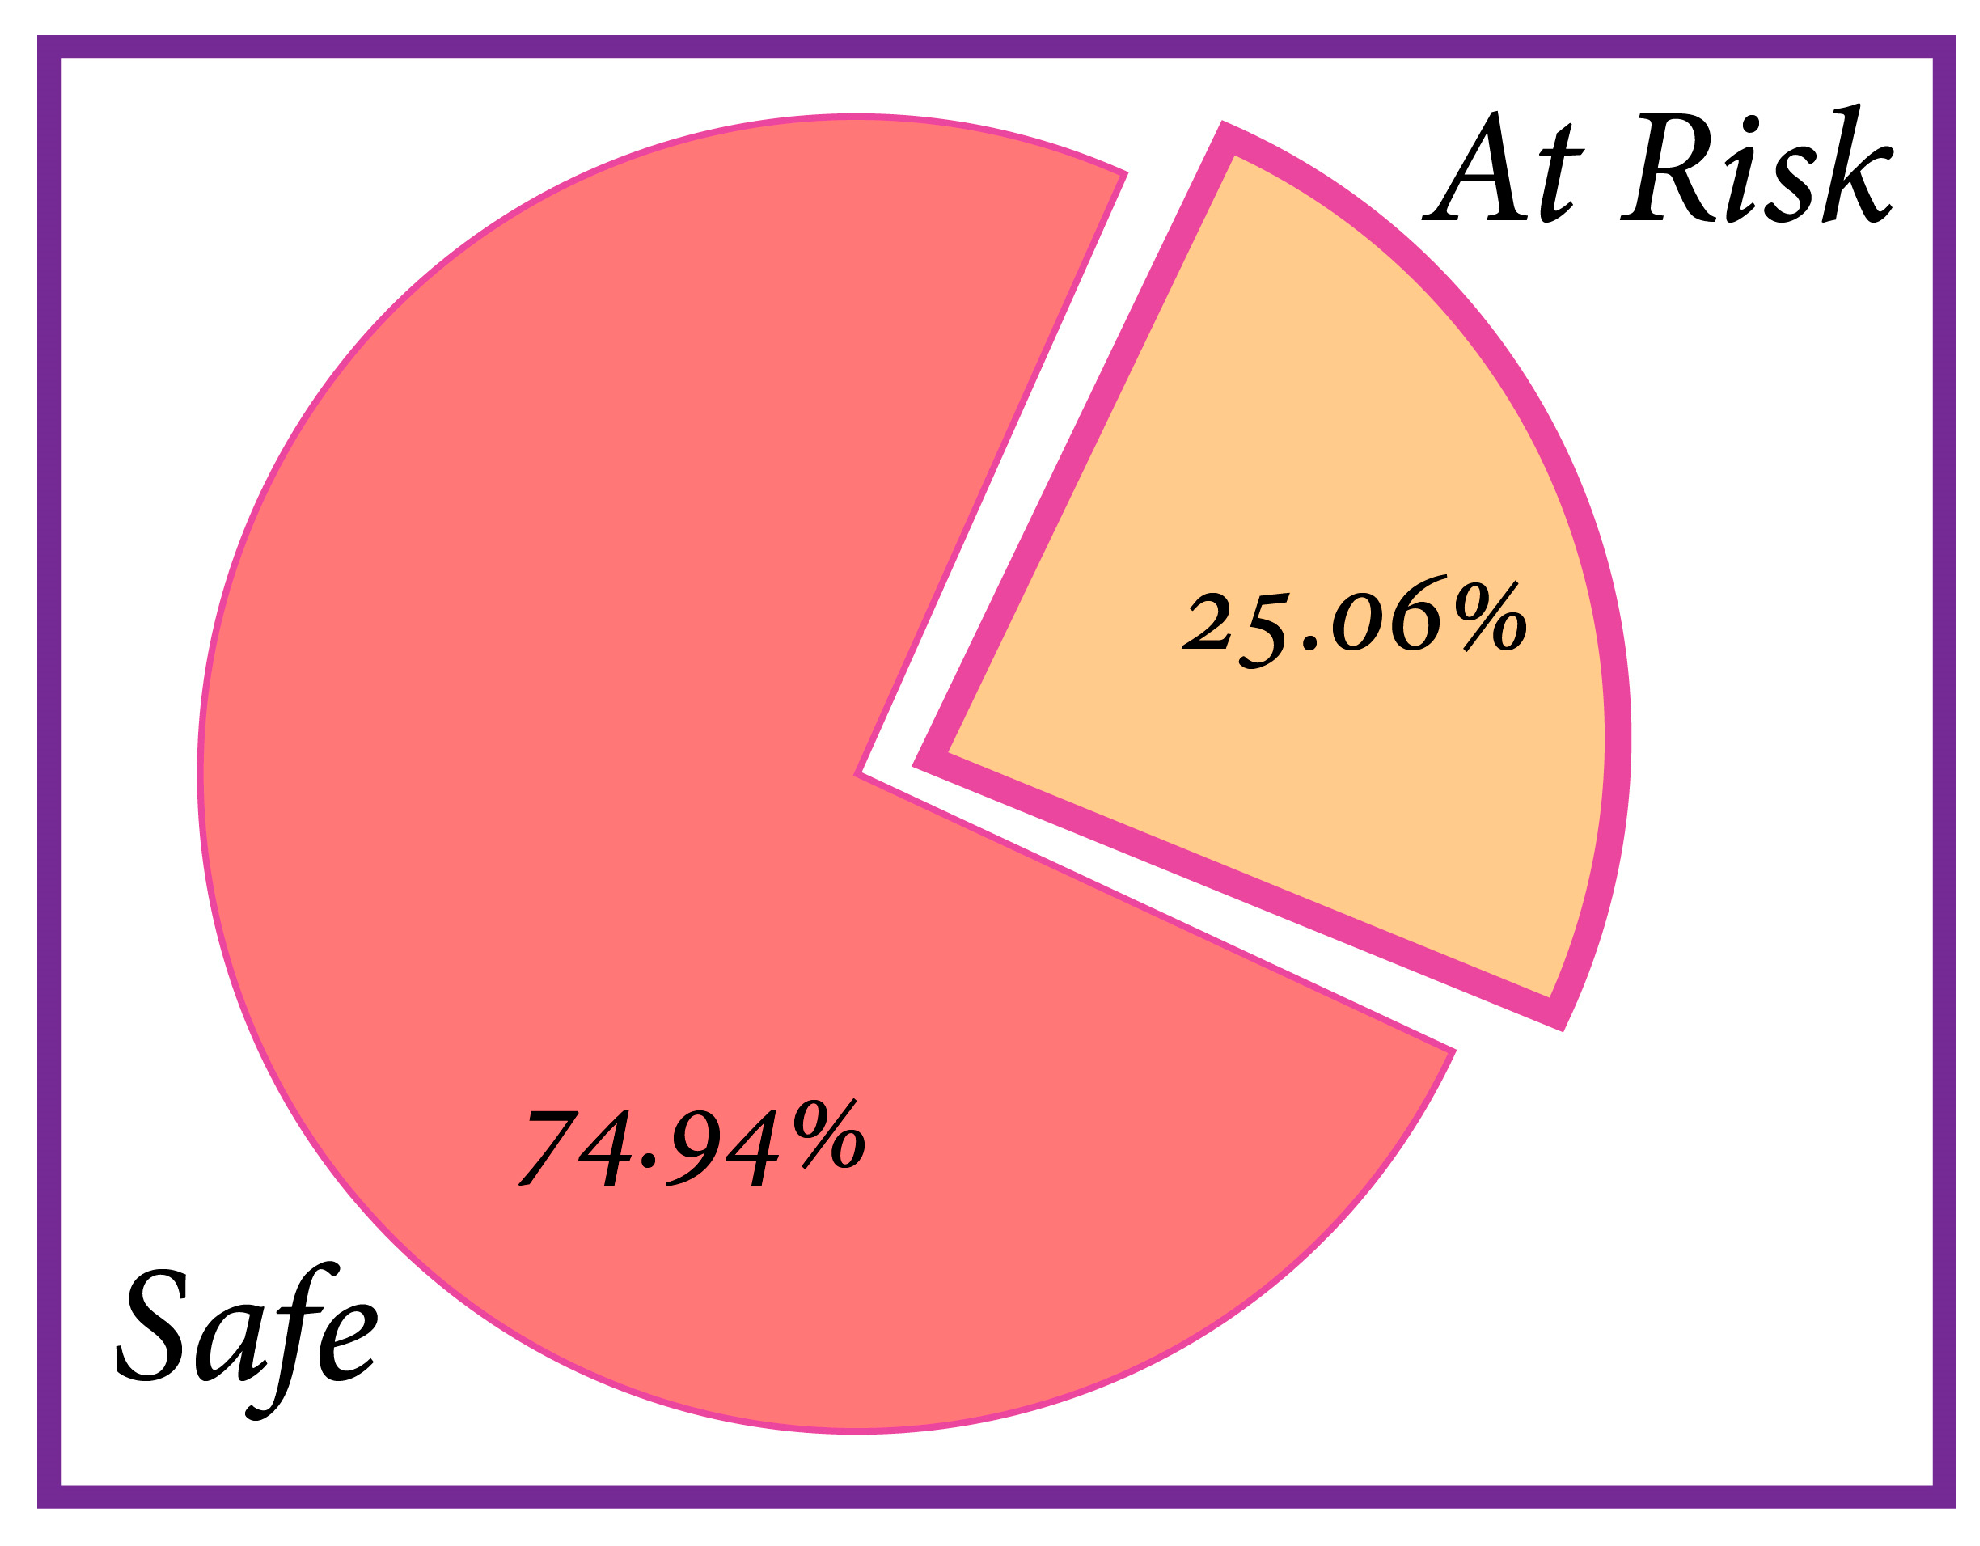
Figure 9 illustrates the pictorial view of the whole dataset, in which 74.94% of students have the safe label and 25.06% students are shown to be at risk of failure.
Validation of the model’s performance revealed 96.2% precision, 94.6% recall, and 92.6% F-measure for the safe class. For the at-risk classification, the achieved precision, recall, and F-measure were 97.4%, 96.1%, and 96.6%, respectively.
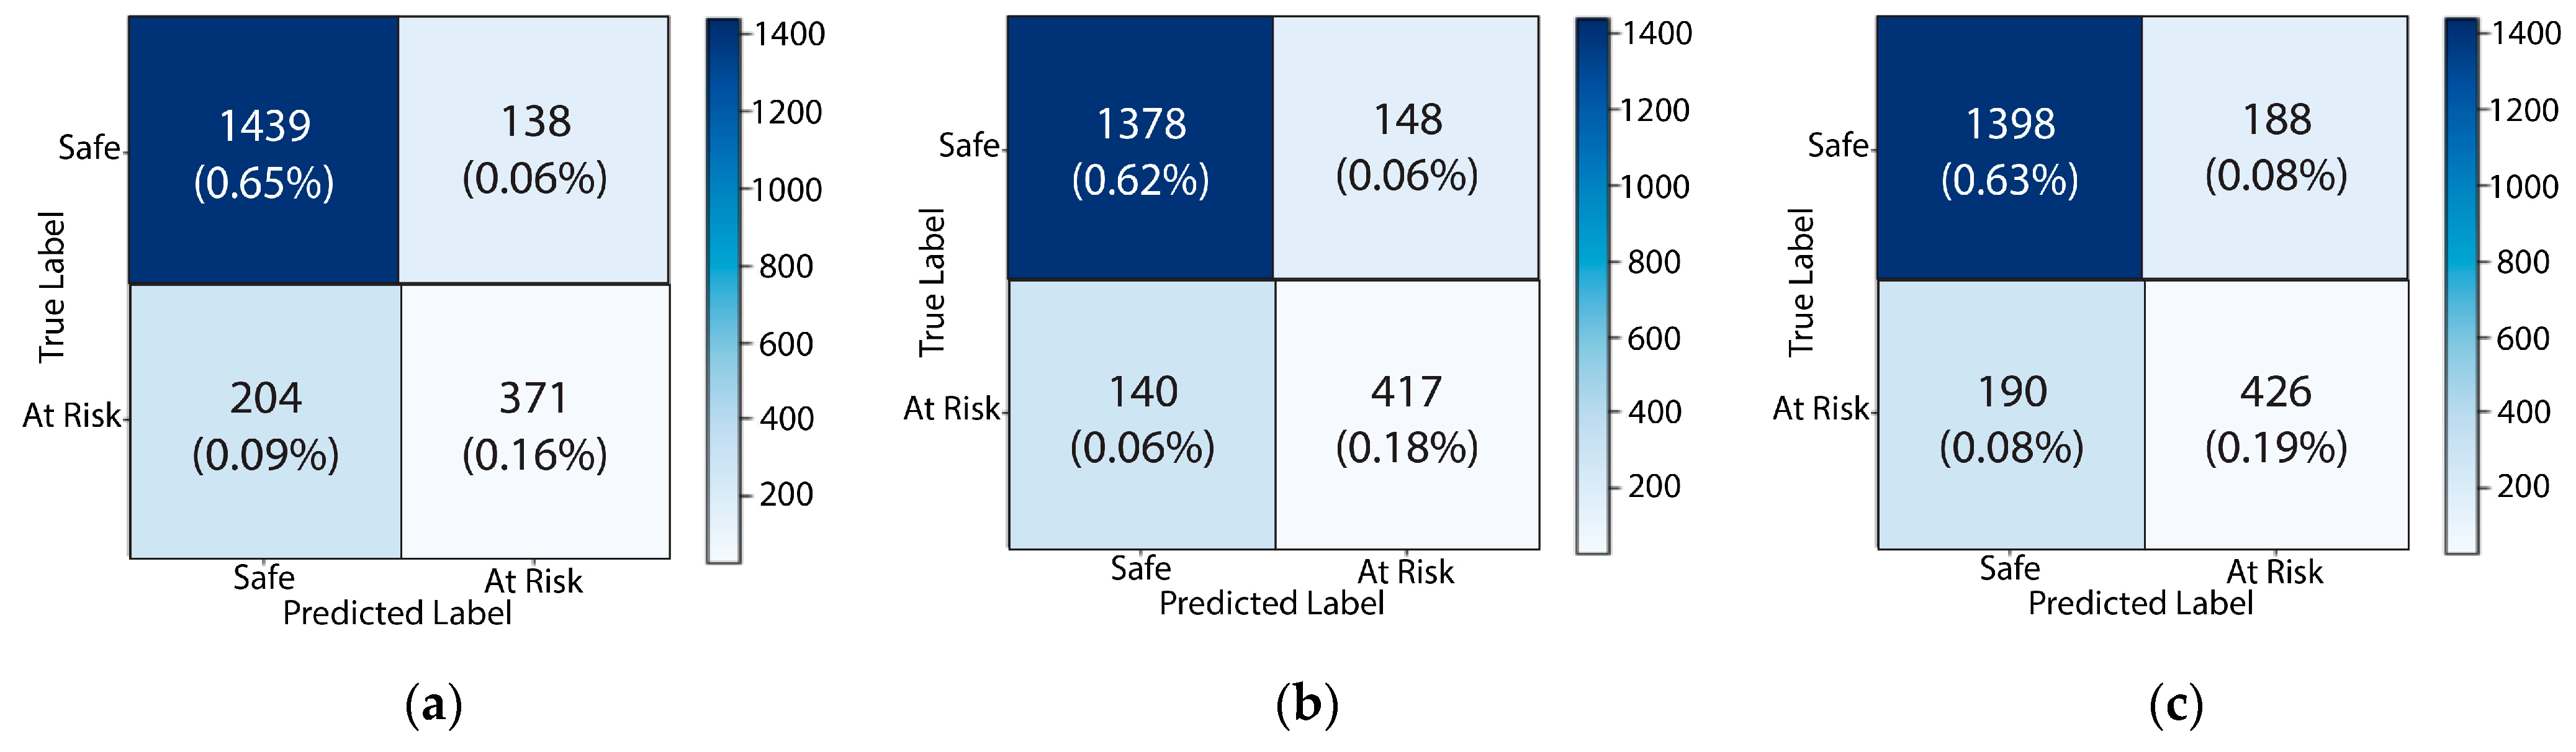
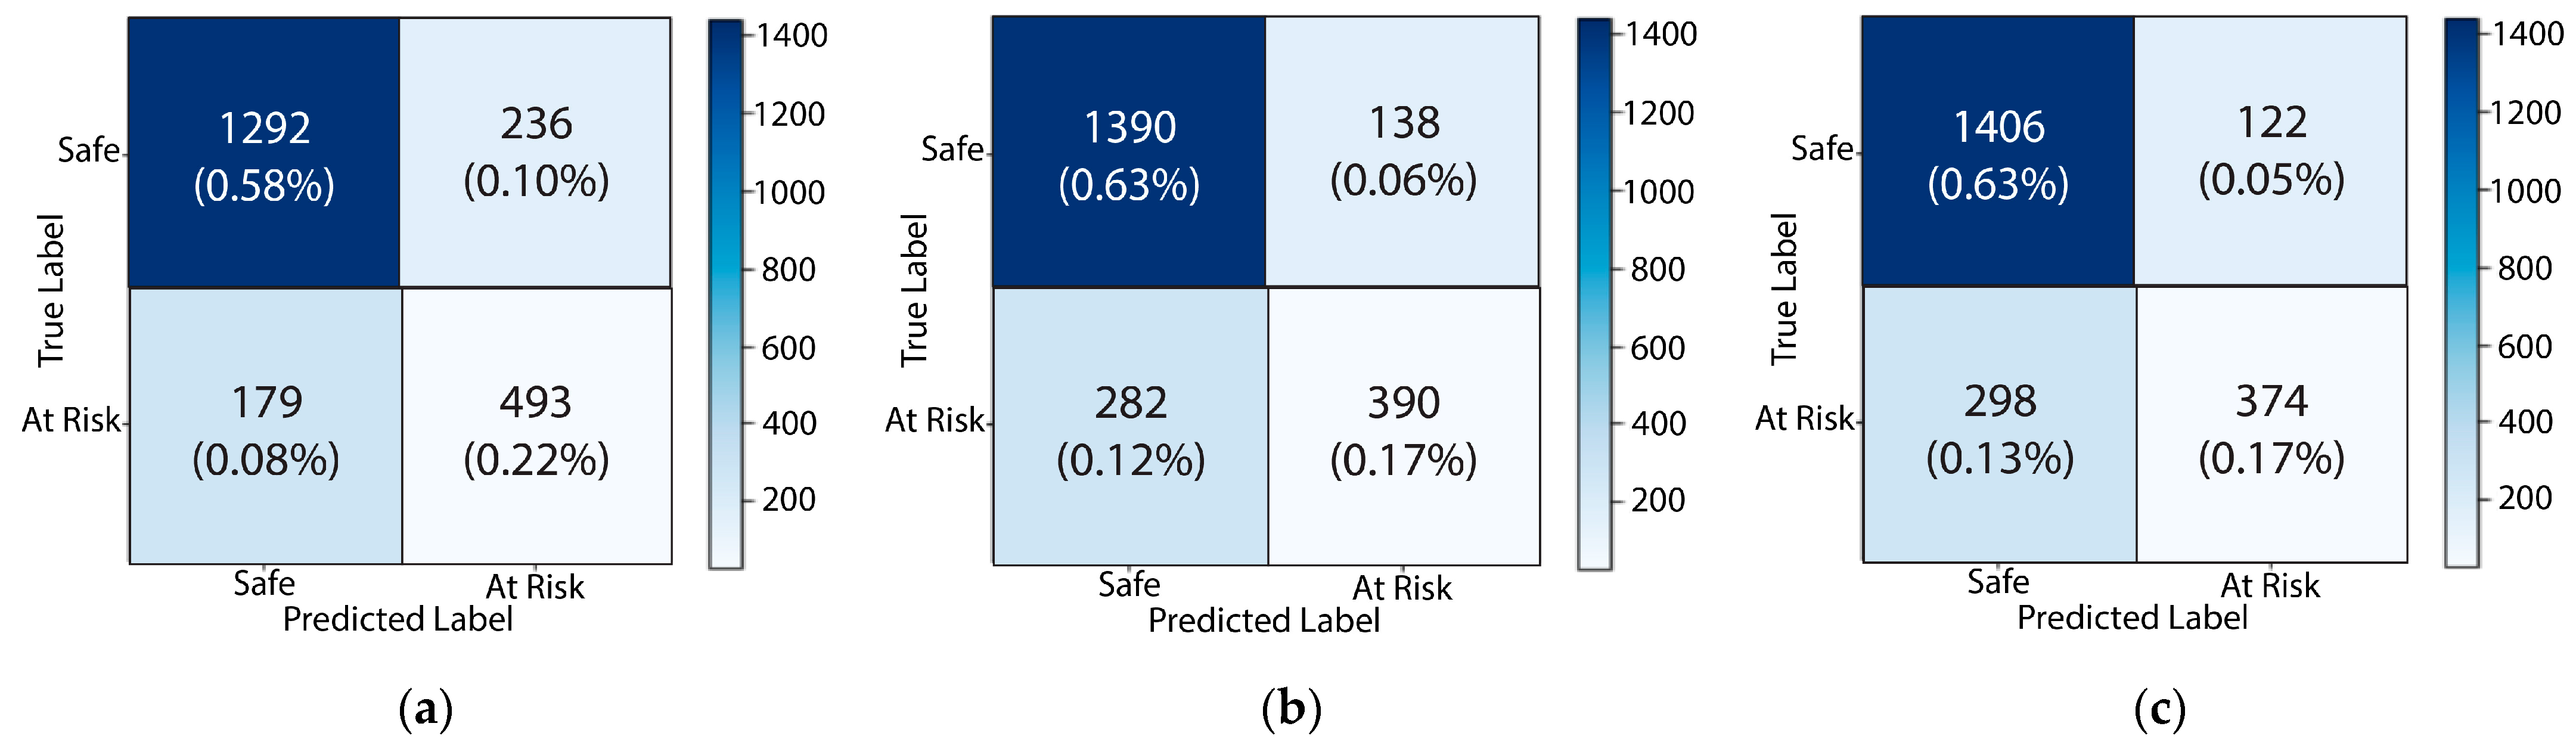
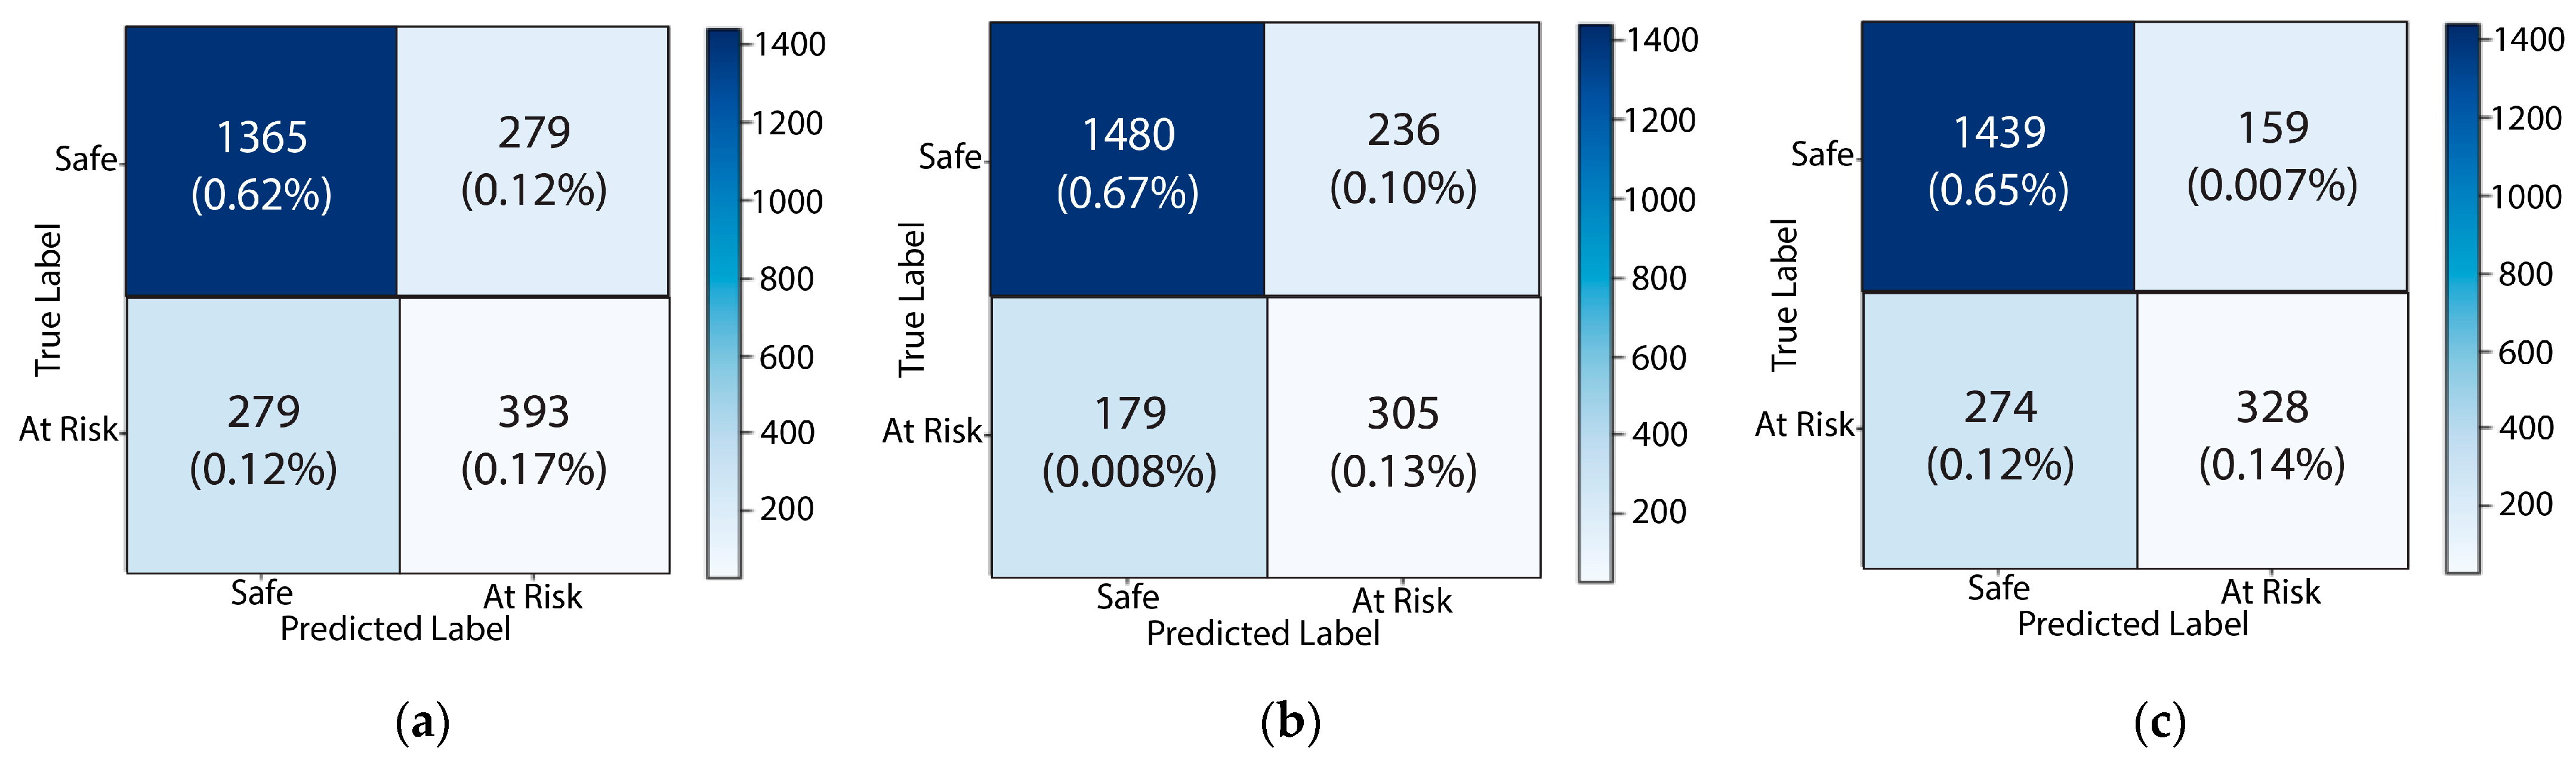
Figure 10, Figure 11, Figure 12, Figure 13 and Figure 14 plot the confusion matrices for each of the individual attributes (Q1–Q15) that influenced the performance of students. In these matrices, 0 corresponds to the safe class and 1 corresponds to the at-risk class.
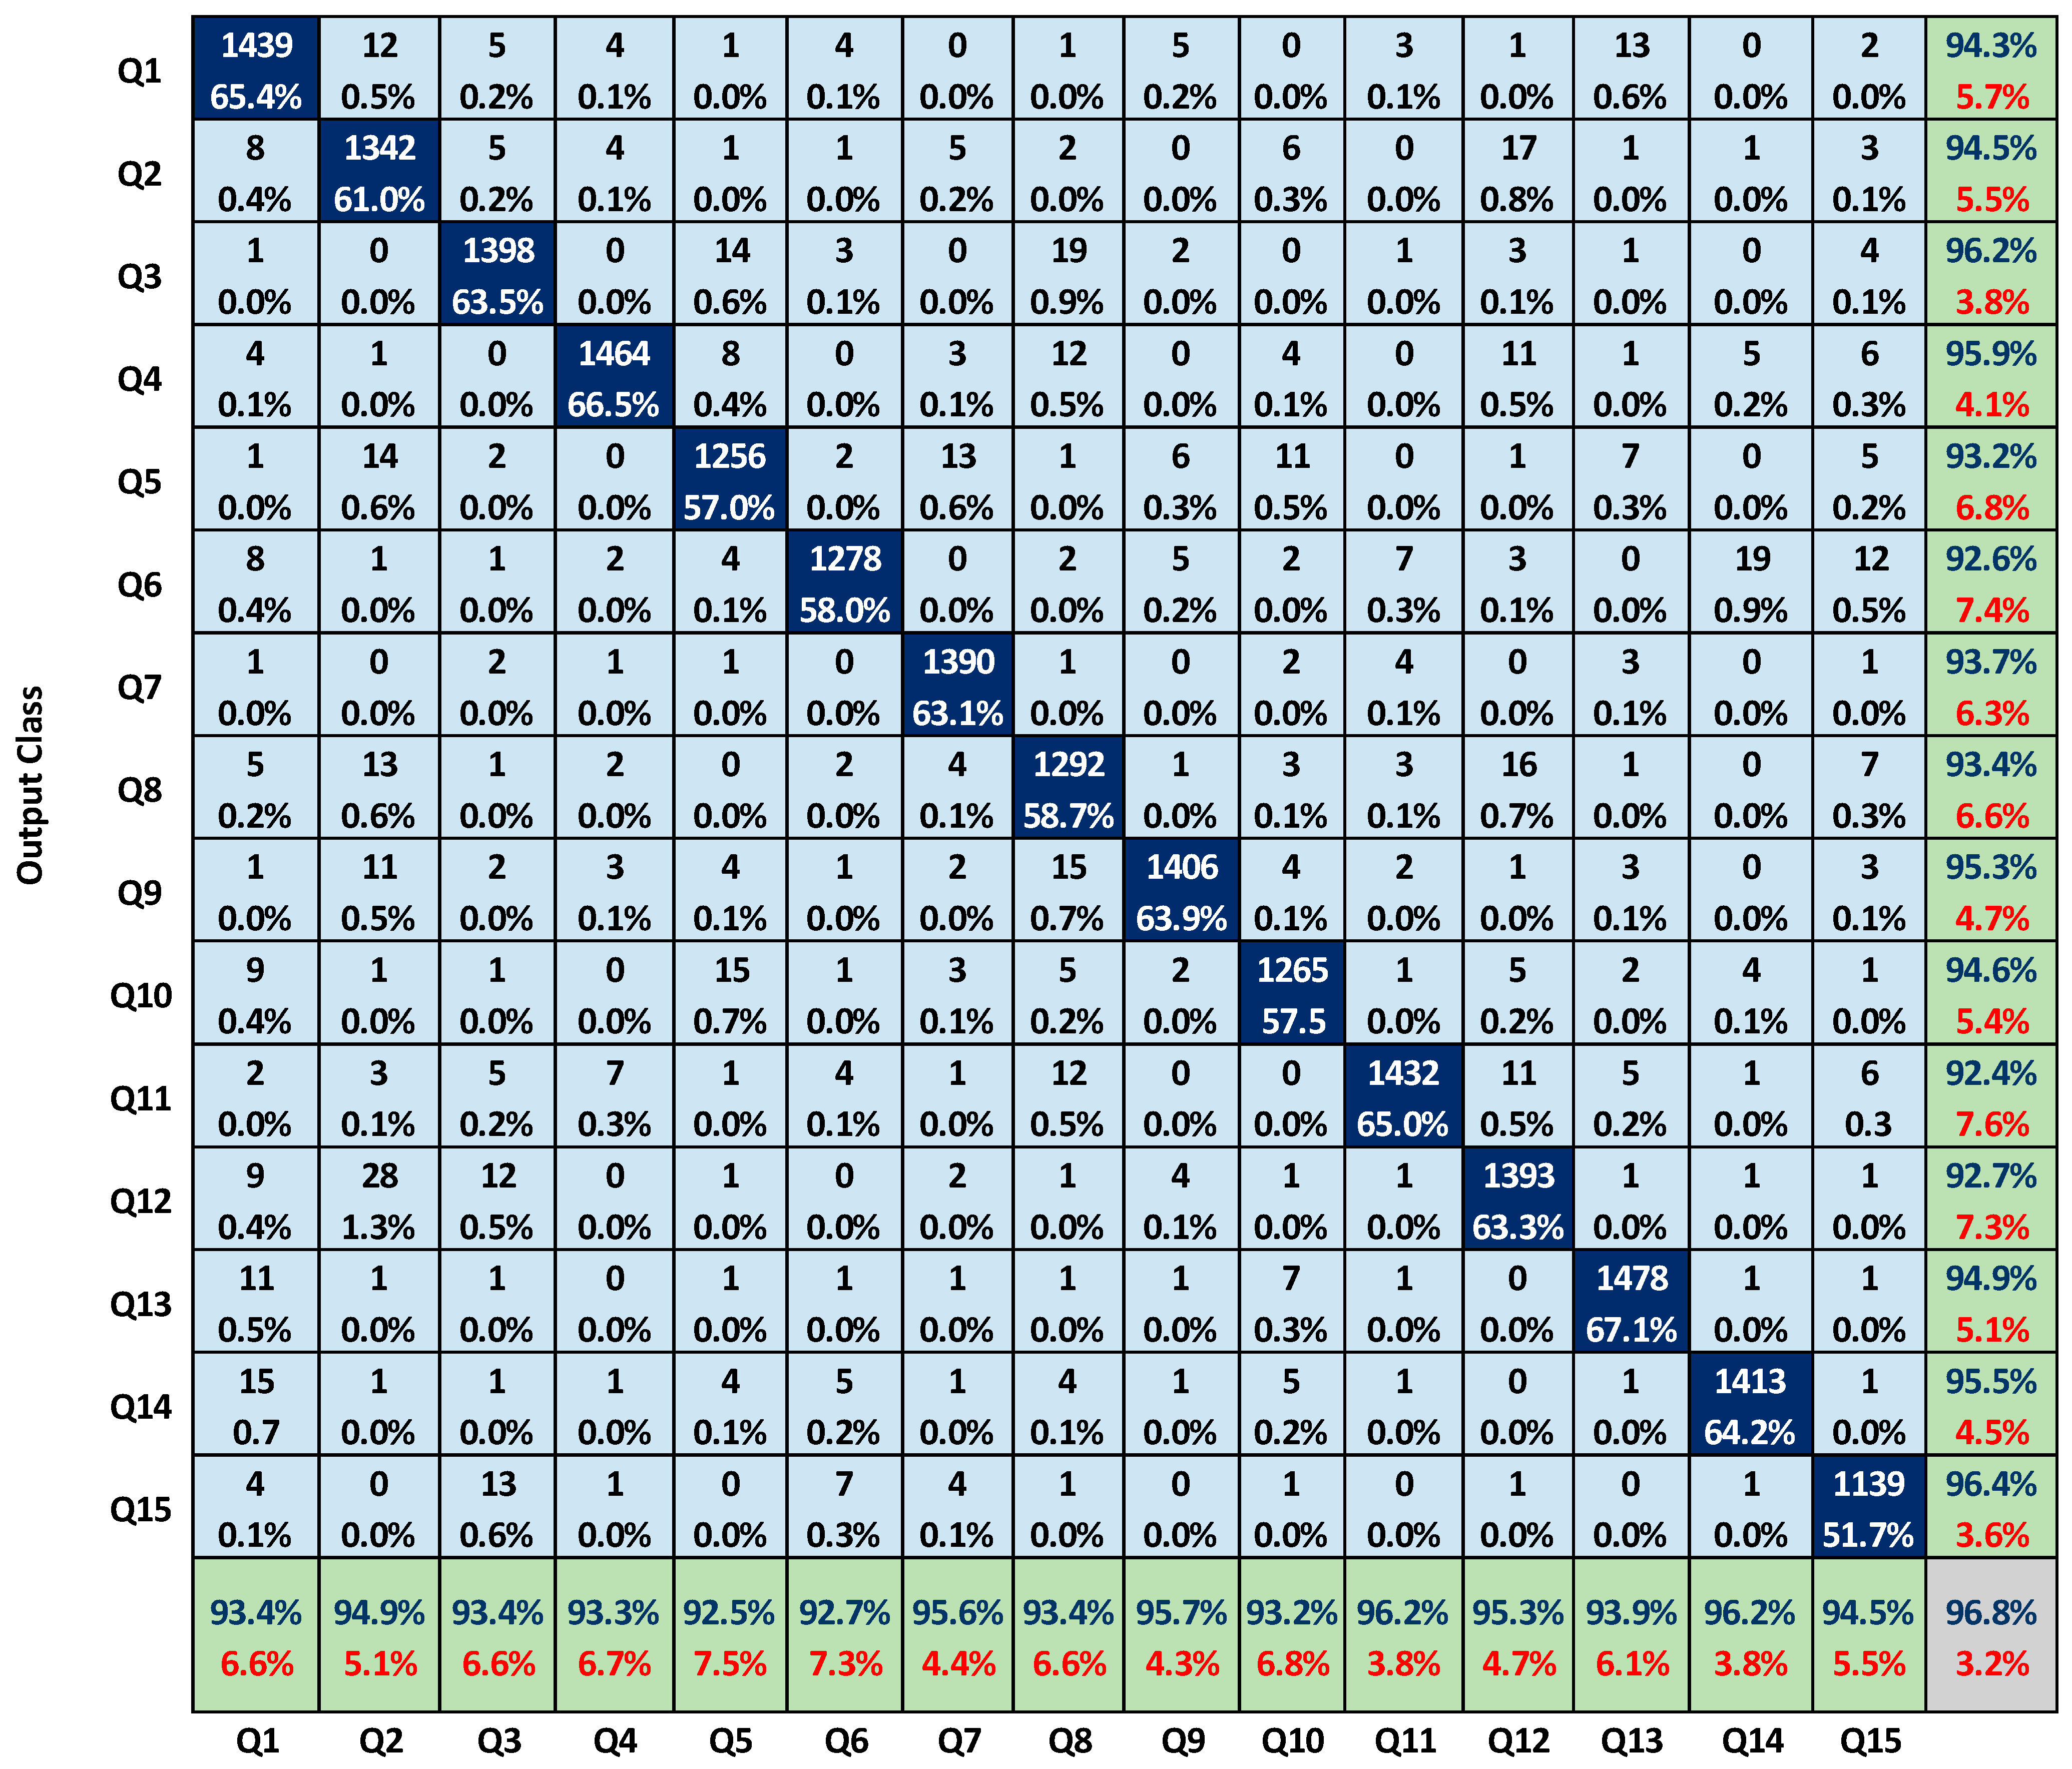
As shown in Figure 15, the full confusion matrix takes into account all the factors that affect students’ performance in the pursuit of precision education. The attribute-by-attribute evaluation of the trained model is represented by a full confusion matrix for all survey questions. Overall, a 96.8% accuracy rate was achieved, with a 3.2% error rate. In green cells, the achieved precision and error rates are displayed for each of the 15 attributes used to correctly predict the output class. The remaining color blocks show, respectively: the highest weighted factor for each question (in dark blue); the maximum accuracy (and error rate) achieved (in grey); and the analyzed weightage percentage (in light blue) with the relating error of each attribute.
Table 4 represents a comparison of the accuracy achieved by previous studies, as well as the error rate and methodology used to conduct each study, with those of our study. As shown in the table, the accuracy values achieved by the models of other studies are comparatively lower than that of the CatBoost model of this study. Hence, it is shown that the CatBoost model is more efficient than the models of existing studies. The experimental results demonstrate that the Catboost classifier is optimal for precision education, as the F-measure is 92.6% for the safe class and 96.6% for the at-risk class, as shown in Table 5 for the precision, recall, F-measure, and ROC area of both classes. This classifier accurately predicted student performance with the provided data and features. Thus, this research enabled the development of a generalizable model capable of predicting the early academic performance of students, so that those who are at risk of dropping out may receive appropriate interventions, especially during the lock-down period of COVID-19.

5. Conclusions and Future Recommendations

The educational data that are associated with the interaction between the learner and the teacher conceal facts and figures that are relevant to the behavior of the student while they are learning. Using prediction models, data mining techniques can help improve students’ academic performance in a more nuanced way. These models can be applied to online education evaluation to help determine which students are struggling and, therefore, require additional support. To prevent these students from dropping out and having to redo the entire session, it is important to provide them with the necessary interventions.
This study aimed to address the shortcomings of prediction models that are not specific to any one course and are, instead, highly coupled with a small number of data features characteristic of various courses. Due to their inaccuracy over a broad dataset, such models are unnecessary. Therefore, this research addressed this problem by developing a universally applicable model of prediction. With this proposed model, large datasets can be processed quickly and accurately. Due to its portability, this model is valuable because it is quite simple to maintain and has a lower probability of overfitting in particular situations.
The model formulation for this research study was conducted using a supervised learning technique of machine learning which can operate over disparate courses considering different attributes for achieving precision education. The machine learning problem was formulated in this study as a binary classification problem, in order to categorize each student under the label of safe or at-risk. The dataset was collected through a survey distributed to different universities in Pakistan for the period of COVID-19. To ensure the model was robust enough, it was trained using the Catboost classifier considering diverse parameters that are independent of disparate courses. After feature selection, supervised learning was adapted to train the model. Out of the 2200 responses collected, data were split between training and testing phases with proportions of 70% and 30%, respectively. Using this 70% of the data, the model was trained successfully using the Catboost algorithm. The model attained accuracy of 96.8% in achieving precision education for students. The results showed that, for the whole dataset, 74.94% of students had the safe label and 25.06% of students were found to be at risk of failure. The experiment was conducted, and the model was trained and later tested using different model evaluation metrics. Further results demonstrated that the Catboost classifier is optimal for precision education, as the F-measure was 92.6% for the safe class and 96.6% for the at-risk class, for precision, recall, F-measure, and ROC area of both classes. This classifier accurately predicted student performance with the provided data and features. The attribute-by-attribute evaluation of the trained model was represented by a full confusion matrix for all survey questions. Overall, a 96.8% accuracy rate was achieved, with a 3.2% error rate. Thus, this research enabled the development of a generalizable model capable of predicting the early academic performance of students, so that those who are at risk of dropping out may receive appropriate interventions, especially during the lock-down period of COVID-19. The limitations of this study include the small size of the dataset, and the small number of attributes considered to predict their influence on student performance. Using more potential attributes could enhance the model robustness and its accuracy.
The future extension of this work is needed to predict the performance of students in traditional educational systems as well as online educational systems after the period of COVID-19, as follows:
  • To improve the model’s generalizability and consider more attributes for precision teaching in higher education, it is important to think about larger student datasets;
  • The performance of the model and the accuracy can be enhanced by training the Catboost classifier on a large dataset;
  • The scope of this work can be extended to include the utilization of hybrid models by combining deep learning and machine learning strategies;
  • Academic disciplines other than information technology and management sciences can be considered to generate complexity and diverse student feedback;
  • This work could be expanded to predict the performance of students from developed countries and developing countries during COVID-19 in order to develop a meaningful comparison between the two groups of students;
  • Future development should emphasize both synchronous and asynchronous classes in different academic disciplines.

Author Contributions

Conceptualization, R.A., A.S.N.M., S.A. (Shafiq Ahmad) and S.A. (Saud Altaf); methodology, R.A., S.A. (Saud Altaf) and A.S.N.M.; software, R.A.; validation, R.A., S.A. (Shafiq Ahmad) and S.I.; formal analysis, R.A., A.S.N.M., S.A. (Shafiq Ahmad) and S.A. (Saud Altaf); investigation, R.A.; resources, S.A. (Saud Altaf); data curation, S.A. (Saud Altaf), A.S.N.M. and S.A. (Shafiq Ahmad); writing—original draft preparation, R.A., S.H. and S.I.; writing—review and editing, S.A. (Saud Altaf) and S.A. (Shafiq Ahmad); visualization, R.A., S.A. (Saud Altaf) and A.S.N.M.; supervision, S.A. (Saud Altaf) and S.H.; project administration, S.I. and A.S.N.M.; funding acquisition, S.A. (Shafiq Ahmad) and A.S.N.M. All authors have read and agreed to the published version of the manuscript.

Funding

This research has received funding from King Saud University through Researchers Supporting Project number RSP2023R387), King Saud University, Riyadh, Saudi Arabia.

Institutional Review Board Statement

Not applicable.

Informed Consent Statement

Informed consent was obtained from all subjects involved in the study.

Data Availability Statement

The datasets generated during and/or analyzed during the current research is available from the corresponding author on reasonable request.

Acknowledgments

The authors extend their appreciation to King Saud University for funding this work through Researchers Supporting Project number (RSP2023R387), King Saud University, Riyadh, Saudi Arabia.

Conflicts of Interest

The authors declare no conflict of interest.

References

  1. Yang, S.J.H. Precision education: New challenges for AI in education [conference keynote]. In Proceedings of the 27th International Conference on Computers in Education (ICCE), Kenting, Taiwan, 2–6 December 2019; Asia-Pacific Society for Computers in Education APSCE: Kenting, Taiwan, 2019; pp. 105–108. [Google Scholar]
  2. Hart, S.A. Precision education initiative: Moving toward personalized education. Mind Brain Educ. 2016, 10, 209–211. [Google Scholar] [CrossRef]
  3. Cook, C.R.; Kilgus, S.P.; Burns, M.K. Advancing the science and practice of precision education to enhance student outcomes. J. Sch. Psychol. 2018, 66, 4–10. [Google Scholar] [CrossRef]
  4. Maldonado-Mahauad, J.; Pérez-Sanagustín, M.; Kizilcec, R.F.; Morales, N.; Munoz-Gama, J. Mining theory-based patterns from big data: Identifying self-regulated learning strategies in Massive Open Online Courses. Comput. Hum. Behav. 2018, 80, 179–196. [Google Scholar] [CrossRef]
  5. Wilson, M.S.; Ismaili, P.B. Toward maximizing the student experience and value proposition through precision education. Bus. Educ. Innov. J. 2019, 11, 119–124. [Google Scholar]
  6. Agarwal, R.; Dhar, V. Big data, data science, and analytics: The opportunity and challenge for IS research. Inf. Syst. Res. 2014, 25, 443–448. [Google Scholar] [CrossRef]
  7. Hwang, G.-J.; Spikol, D.; Li, K.-C. Guest editorial: Trends and research issues of learning analytics and educational big data. Educ. Technol. Soc. 2018, 21, 134–136. [Google Scholar]
  8. Tempelaar, D.; Rienties, B.; Nguyen, Q.; Tempelaar, D.; Rienties, B.; Nguyen, Q. The contribution of dispositional learning analytics to precision education. Educ. Technol. Soc. 2021, 24, 109–122. [Google Scholar]
  9. Wu, J.Y.; Yang CC, Y.; Liao, C.H.; Nian, M.W. Analytics 2.0 for Precision Education: An Integrative Theoretical Framework of the Human and Machine Symbiotic Learning. Educ. Technol. Soc. 2021, 24, 267–279. [Google Scholar]
  10. Dias, S.B.; Hadjileontiadou, S.J.; Diniz, J.; Hadjileontiadis, L.J. DeepLMS: A deep learning predictive model for supporting online learning in the COVID-19 era. Sci. Rep. 2020, 10, 19888. [Google Scholar] [CrossRef]
  11. Andrei, P.C.; Stanculescu, M.; Andrei, H.; Caciula, I.; Diaconu, E.; Bizon, N.; Mazare, A.G.; Ionescu, L.M.; Gaiceanu, M. Comparative and Predictive Analysis of Electrical Consumption during Pre-and Pandemic Periods: Case Study for Romanian Universities. Sustainability 2022, 14, 11346. [Google Scholar] [CrossRef]
  12. Abdullah, N.A.; Shamsi, N.A.; Jenatabadi, H.S.; Ng, B.K.; Mentri, K.A.C. Factors affecting undergraduates’ academic performance during COVID-19: Fear, stress and teacher-parents’ support. Sustainability 2022, 14, 7694. [Google Scholar] [CrossRef]
  13. Dascalu, M.D.; Ruseti, S.; Dascalu, M.; McNamara, D.S.; Carabas, M.; Rebedea, T.; Trausan-Matu, S. Before and during COVID-19: A Cohesion Network Analysis of students’ online participation in moodle courses. Comput. Hum. Behav. 2021, 121, 106780. [Google Scholar] [CrossRef] [PubMed]
  14. Atlam, E.S.; Ewis, A.; El-Raouf MM, A.; Ghoneim, O.; Gad, I. A new approach in identifying the psychological impact of COVID-19 on university student’s academic performance. Alex. Eng. J. 2022, 61, 5223–5233. [Google Scholar] [CrossRef]
  15. Yang, C.C.Y.; Chen, I.Y.L.; Ogata, H. Toward Precision Education: Educational Data Mining and Learning Analytics for Identifying Students’ Learning Patterns with Ebook Systems. Educ. Technol. Soc. 2021, 24, 152–163. [Google Scholar]
  16. Lu, O.; Huang, A.; Huang, J.; Lin, A.; Ogata, H.; Yang, S. International Forum of Educational Technology & Society Applying Learning Analytics for the Early Prediction of Students’ Academic Performance in Blended Learning. J. Educ. Technol. Soc. 2018, 21, 220–232. [Google Scholar]
  17. Moreno-Marcos, P.M.; Pong, T.C.; Munoz-Merino, P.J.; Kloos, C.D. Analysis of the Factors Influencing Learners’ Performance Prediction with Learning Analytics. IEEE Access 2018, 8, 5264–5282. [Google Scholar] [CrossRef]
  18. Azcona, D.; Hsiao, I.H.; Smeaton, A.F. Detecting students-at-risk in computer programming classes with learning analytics from students’ digital footprints. User Model. User-Adapt. Interact. 2019, 29, 759–788. [Google Scholar] [CrossRef]
  19. Yasuura, H.; Kyung, C.M.; Liu, Y.; Lin, Y.L. Learning Analytics for E-Book-Based Educational Big Data in Higher Education. In Smart Sensors at the IoT Frontier; Springer: Berlin/Heidelberg, Germany, 2017; pp. 1–378. [Google Scholar] [CrossRef]
  20. Tsai, S.C.; Chen, C.H.; Shiao, Y.T.; Ciou, J.S.; Wu, T.N. Precision education with statistical learning and deep learning: A case study in Taiwan. Int. J. Educ. Technol. High. Educ. 2020, 17, 12. [Google Scholar] [CrossRef]
  21. Latheef, A.; Ali, M.F.L.; Bhardwaj, A.B.; Shukla, V.K. Structuring learning analytics through visual media and online classrooms on social cognition during COVID-19 pandemic. J. Phys. Conf. Ser. 2021, 1714, 012019. [Google Scholar] [CrossRef]
  22. Nkomo, L.M.; Nat, M. Student Engagement Patterns in a Blended Learning Environment: An Educational Data Mining Approach. TechTrends 2021, 65, 808–817. [Google Scholar] [CrossRef]
  23. Weng, J.-X.; Huang, A.Y.; Lu, O.H.; Chen, I.Y.; Yang, S.J. The implementation of precision education for learning analytics. In Proceedings of the 2020 IEEE International Conference on Teaching, Assessment, and Learning for Engineering, TALE, Takamatsu, Japan, 8–11 December 2020; pp. 327–332. [Google Scholar]
  24. Wu, J.-Y.; Hsiao, Y.-C.; Nian, M.-W. Using supervised machine learning on large-scale online forums to classify course-related Facebook messages in predicting learning achievement within the personal learning environment. Interact. Learn. Environ. 2020, 28, 65–80. [Google Scholar] [CrossRef]
  25. Zhu, X.; Goldberg, A.B. “Introduction to Semi-Supervised Learning,” Synthesis Lectures on Artificial Intelligence and Machine Learning; Morgan and Claypool Publishers: San Rafael, CA, USA, 2009; Volume 3, pp. 1–130. [Google Scholar]
  26. Soltaninejad, M.; Yang, G.; Lambrou, T.; Allinson, N.; Jones, T.L.; Barrick, T.R.; Howe, F.A.; Ye, X. Supervised learning based multimodal MRI brain tumour segmentation using texture features from supervoxels. Comput. Methods Programs Biomed. 2018, 157, 69–84. [Google Scholar] [CrossRef] [PubMed]
  27. Ramaswami, G.; Susnjak, T.; Mathrani, A. On Developing Generic Models for Predicting Student Outcomes in Educational Data Mining. Big Data Cogn. Comput. 2022, 6, 6. [Google Scholar] [CrossRef]
Figure 1. Different digital learning platforms.
Sustainability 15 02714 g001
Figure 2. Proposed model for achieving acceptable accuracy in precision education.
Sustainability 15 02714 g002
Figure 3. Different phases of pre-processing steps.
Sustainability 15 02714 g003
Figure 4. Pre-processed data of students.
Sustainability 15 02714 g004
Figure 5. Correlation matrix for feature selection.
Sustainability 15 02714 g005
Figure 6. Difficulties in focusing during online sessions during COVID-19.
Sustainability 15 02714 g006
Figure 7. (a) Preferred method for mentorship of bachelor’s students; (b) master’s students; (c) PhD students.
Sustainability 15 02714 g007aSustainability 15 02714 g007b
Figure 8. Effect of personal situations on study groups: (a) physical health of students; (b) mental health of students; (c) future education of students; (d) personal finances of students; (e) studying issues of students; (f) professional career of students.
Sustainability 15 02714 g008aSustainability 15 02714 g008b
Figure 9. Dataset classification between safe and at-risk students.
Sustainability 15 02714 g009
Figure 10. Confusion Matrix for (a) Q1; (b) Q2; (c) Q3.
Sustainability 15 02714 g010
Figure 11. Confusion matrices for (a) Q4; (b) Q5; (c) Q6.
Sustainability 15 02714 g011
Figure 12. Confusion matrices for (a) Q7; (b) Q8; (c) Q9.
Sustainability 15 02714 g012
Figure 13. Confusion matrices for (a) Q10; (b) Q11; (c) Q12.
Sustainability 15 02714 g013
Figure 14. Confusion matrices for (a) Q13; (b) Q14; (c) Q15.
Sustainability 15 02714 g014
Figure 15. Overall confusion matrix for precision education for all questionnaire questions.
Sustainability 15 02714 g015
Table 1. Comparison of existing techniques.
PaperContributionTechniqueResultsLimitations
[15]Student performance evaluationSVM, ANN, Naïve Bayes, KNN, and DT94.75% accuracySmaller number of attributes
[16]Final performancePrinciple Component Regression (PCR)85% accuracyLack LA interventions
[18]Predicted weak studentsData Mining classifiersK-neighbors performed best Speech and video sources not considered
[19]Final scoresDiscrete GraphsProposed model outperformedData integration and visualization were not tackled
[20]Predicted dropout rateMultilayer Perceptron77% accuracyLess accuracy
[23]Precision educationSVC, LR, XGB, and RF80% accuracyModel not generic enough
[24]Improved learner efficiencySVM, RF, and ANN91% accuracy rateSmaller dataset
Table 2. Some sample information of students collected through survey.
Student_StatusLevel of StudyField of StudyAgeGender
Full-timeBachelorApplied Sciences20Female
Full-timeDoctoralNatural and Life Sciences34Male
Part-timeBachelorArts and Humanities23Male
Full-timeMasterApplied Sciences24Female
Part-timeMasterSocial Sciences28Male
Part-timeBachelorNatural and Life Sciences22Female
Part-timeMasterSocial Sciences23Female
Part-timeBachelorSocial Sciences19Male
Part-timeBachelorApplied Sciences23Female
Table 3. Sample questions of the survey.
Q. NODescription
Q # 1Were you a full time or a part time student?
Q # 2Your enrolled level of study at that period (Bachelor’s, Master’s or Doctoral)?
Q # 3 What was your main field of study (arts, social, applied or natural science)?
Q # 4Due to COVID-19, have your on-site classes been cancelled or not?
Q # 5Through which medium your online classes had been organized?
Q # 6Had your workload increased during the online classes?
Q # 7During COVID-19 which was your preferred method of mentorship?
Q # 8How much you were satisfied with the method of mentorship?
Q # 9Have you been provided with assignments and quizzes on regular basis?
Q # 10Have your mentor responded to your queries on time?
Q # 11Have you been satisfied with practical classes arranged during online session?
Q # 12Were you having access of proper tools and equipment’s needed for taking online classes during COVID-19 period?
Q # 13Have you faced studying issues regarding lectures, seminars and practical work?
Q # 14Have your professional career, mental or physical health affected during COVID-19 period?
Q # 15Having you faced difficulty while coordinating with your teacher openly, during online session?
Table 4. Comparison of Catboost with other models of previous studies.
PaperTechniqueAccuracy (%)Error Rate (%)
[13]ANN94.755.25
[18]Multilayer Perceptron7723
[21]SVC8020
[25]CatBoost7525
[26]GA8020
[27]LR8317
[Our work]CatBoost96.83.2
Table 5. Detailed accuracy by class.
ClassPrecisionRecallF-MeasureROC Area
Safe96.2%94.6%92.6%93.0%
At Risk97.4%96.1%96.6%95.2%
Disclaimer/Publisher’s Note: The statements, opinions and data contained in all publications are solely those of the individual author(s) and contributor(s) and not of MDPI and/or the editor(s). MDPI and/or the editor(s) disclaim responsibility for any injury to people or property resulting from any ideas, methods, instructions or products referred to in the content.

