Psychometric Analysis and Coupling of Emotions Between State Bulletins and Twitter in India During COVID-19 Infodemic
 Palash Aggrawal1†
  Baani Leen Kaur Jolly1†
  Amogh Gulati1 Amarjit Sethi2 Ponnurangam Kumaraguru3
  Tavpritesh Sethi4*
- 1Department of Computer Science and Engineering, Indraprastha Institute of Information Technology, Delhi, India
- 2Punjab School of Economics, Guru Nanak Dev University, Amritsar, India
- 3Computer Science and Engineering Department, International Institute of Information Technology, Hyderabad, India
- 4Department of Computational Biology, Indraprastha Institute of Information Technology, Delhi, India
COVID-19 infodemic has been spreading faster than the pandemic itself. The misinformation riding upon the infodemic wave poses a major threat to people’s health and governance systems. Managing this infodemic not only requires mitigating misinformation but also an early understanding of underlying psychological patterns. In this study, we present a novel epidemic response management strategy. We analyze the psychometric impact and coupling of COVID-19 infodemic with official COVID-19 bulletins at the national and state level in India. We looked at them from the psycholinguistic lens of emotions and quantified the extent and coupling between them. We modified Empath, a deep skipgram-based lexicon builder, for effective capture of health-related emotions. Using this, we analyzed the lead-lag relationships between the time-evolution of these emotions in social media and official bulletins using Granger’s causality. It showed that state bulletins led the social media for some emotions such as Medical Emergency. In contrast, social media led the government bulletins for some topics such as hygiene, government, fun, and leisure. Further insights potentially relevant for policymakers and communicators engaged in mitigating misinformation are also discussed. We also introduce CoronaIndiaDataset, the first social-media-based Indian COVID-19 dataset at the national and state levels with over 5.6 million national and 2.6 million state-level tweets for the first wave of COVID-19 in India and 1.2 million national tweets for the second wave of COVID-19 in India.
1 Introduction
COVID-19 was declared a pandemic by the WHO on March 11, 2020. Months before this announcement, the (mis)information surrounding COVID-19 was already raging across the world, and the “infodemic” threat was announced on February 15, 2020, at the Munich Security Conference.1 The excessive volume and velocity of (mis)information can put global systems at risk by compromising access to accurate, reliable, and trustworthy guidance when needed.2
Social media has a major contribution to the spread of the infodemic. Within social media, Twitter is the most popular microblogging platform for expressing public opinions. It has seen a sharp 45% increase in the usage of its curated events page since March 6, 2020, during the COVID-19 emergency3. Thus, the massive volume of COVID-19 data provides an opportunity to use data mining techniques to understand the trends in language patterns indicative of government and public emotion.
Previous research has shown the potential of Twitter to capture public sentiment during a health crisis. Ritterman et al. (2009) modeled public belief on the spread of the Swine Flu in 2009 using market prediction models on Twitter to predict the spread of the pandemic. During the swine flu and H1N1 epidemics, Signorini et al. (2011) examined Twitter based-information to track the swiftly evolving public sentiment and its correlation with the actual spread of disease. Twitter was used as a surveillance system by Jain and Kumar (2015) to track the spread of the 2015 H1N1 pandemic in India and the general public awareness. While sentiment polarity is useful, none of the previous studies has captured emotions, which are far more nuanced than sentiments. Analyzing emotions from text was traditionally accomplished through the use of lexical categories curated by human experts, such as in the work by Pennebaker et al. (2001). More recently, psychometric analyses have leveraged natural language processing and machine learning to capture moods. For example, Fast et al. (2016) created a state-of-the-art based on word embeddings to mine lexical categories representing emotions and demonstrated how mood on Twitter relates to the time of the day and how deception in hotel reviews correlated with strong emotional content.
This article presents a novel strategy to effectively manage crisis response using psycholinguistic insights, shedding light upon the relation between the government bulletins and the public sentiment present on social media. We extract the state-specific emotion content of COVID-19-related official state bulletins and tweets in India and analyzed the psychometric coupling between the two. We curate CoronaIndiaDataset having more than 5.6 million tweets, specific to India, which was collected using two approaches—content-based and location-based queries—as explained in the Dataset section. To capture emotions more effectively in public health settings, we modified Empath— an open-source lexicon builder. We expanded its lexical categories to include contemporary and contextual words related to COVID-19. Granger’s causality analysis on the time-series of the extracted psycholinguistic markers showed that state bulletins were leading social media for some emotions such as Medical Emergency. Finally, we present our insights based on the CoronaIndiaDataset, as an interactive web portal, CoVibes (https://covibes.herokuapp.com/).
Several studies have examined public sentiment and attitudes toward pandemics. During the Ebola pandemic, Lazard et al. (2015) examined public sentiment in the live Twitter chat by the Centers for Disease Control and Prevention. They identified broad themes from the discourse to aid communication and alleviate public panic. Wong et al. (2017) also conducted a qualitative analysis on the Ebola-related tweets by the local health departments to identify the major themes. The work by Kim et al. (2016) examined a topic-based sentiment analysis of the Ebola virus on Twitter and in the news.
With the global pandemic of COVID-19, the world’s efforts shifted focus toward tackling it. Chen et al. (2020) provided the first Twitter dataset by collecting tweets related to #COVID19. This dataset is an ongoing collection, starting from January 22, 2020. Over time, they tracked more keywords on Twitter to collect a broader context in the dataset. Haouari et al. (2020) also presented ArCov-19, a large Arabic Twitter dataset collected from January 27, 2020, to March 31, 2020.
During the COVID-19 infodemic, Zhao et al. (2020) examined the attention of the Chinese public to COVID-19 by analyzing search trends on Sina Microblog and evaluated public opinion through word frequency and sentiment analysis. Alhajji et al. (2020) analyzed public sentiment by collecting up to 20,000 tweets within 48 h of crucial events in Saudi Arabia’s timeline, using transfer learning to do the sentiment analysis. Kayes et al. (2020) measured community acceptance of social distancing in Australia, reporting that the majority of tweets were in favor of social distancing. Li et al. (2020b) extracted psychological profiles of active Weibo users during COVID-19 spread in China to analyze linguistic, emotional, and cognitive indicators.
Analyzing user behavior and response can provide a critical understanding of what policies and decisions worked. Hou et al. (2020) assessed the public’s response to the situation and the government guidelines in terms of attention, risk perception, the emotional and behavioral response by analyzing search trends, shopping trends, and blog posts on popular Chinese services. Li. et al. (2020a) analyzed how information regarding COVID-19 was disseminated, suggesting valuable insights into the need for information. The work by Tahmasbi et al. (2020) shows how the current pandemic situation has caused an unfortunate rise in Sinophobic behavior on the web. Therefore, our study sought to examine how Government tweets were linked to emotional responses in the public using the method outlined below.
2 Methods
2.1 Dataset
We curated the CoronaIndiaDataset(CID), collected using Twitter’s official Tweepy API. The dataset is split into two parts, collected during the first and second waves of COVID-19 in India, respectively. The first part of the dataset, CoronaIndiaDataset-W1, contains tweets from March 1, 2020, to April 27, 2020. CoronaIndiaDataset-W1 contains 5.6 million tweets talking about COVID-19 in Indian settings and 2.6 million state-specific tweets during the first wave of COVID-19 in India. The second part of the dataset, CoronaIndiaDataset-W2, contains tweets from March 10, 2021, to May 29, 2021. CoronaIndiaDataset-W2 contains 1.2 million tweets talking about COVID-19 in Indian settings during the second wave of COVID-19 in India. While sharing the dataset according to Twitter’s policies, we have only shared the tweet IDs. This redaction allows us to respect the user’s privacy, and thus, the analysis is only limited to the tweets available in the public domain. Table 1 shows the state-wise frequency of tweets available for the most popular states in our dataset. Figure 2 shows the availability of tweets in our database with time, for the first and second wave of Covid-19 in India.
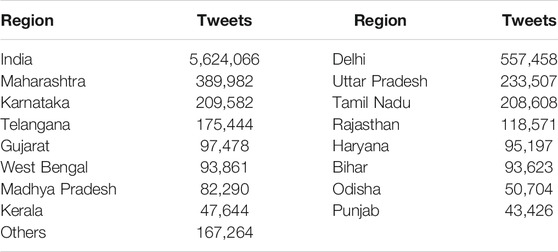
TABLE 1. CoronaIndiaDataset statistics.
2.1.1 Twitter Data Collection
For data collection, the computing specifications we used were an Ubuntu 16.04 server with 64 GB of Ram, a 1 TB hard drive, and an Intel quad-core processor. For CoronaIndiaDataset-W1, the data were collected using two separate approaches in parallel–content-based query and location-based query. For CoronaIndiaDataset-W2, only the content-based query was used.
Content-based query: The trending and most popular hashtags for each of the Indian states were explored to manually create the list of hashtags related to COVID-19. We also went through several COVID-19-related tweets manually to find and subsequently mine the most popular hashtags related to COVID-19, which may not be trending. Further, to automate the collection of relevant tweets, we formulated generic queries like “corona < state >” and collected the state-wise COVID-19-related Twitter data in the same manner.
The focus is on getting a broad set of tweets that talk about COVID-19 in the context of India or the Indian states. We built multiple queries by joining terms related to COVID-19 with the name or common aliases of the region and collected data from March 1, 2020, to April 23, 2020. Some of the terms we used were—“corona”, “covid19”, “coronavirus”, “lockdown”, etc. In addition, popular hashtags like #coronavirusin < region >, #coronain < region >, #corona < region >, # < region > fightscorona were used, where “<region>”replaced by the name or popular alias of India or various states. Examples of a popular alias are “Orissa” for Odisha, “TN” for Tamil Nadu, “UP” for Uttar Pradesh, or spelling mistakes like “chatisgarh” for Chhattisgarh.
Location-based query: We collected tweets for globally trending COVID-19-related hashtags and filtered tweets based on the User Location. We collected tweets for the following hashtags and keywords—#COVID19, “CoronaVirusUpdates”, “coronavirus”, “corona virus outbreak”, “corona wuhan”, #Coronavirus, #NCOV19, #CoronavirusOutbreak, #coronaviruschina, #coronavirus, “COVID19” from March 14, 2020, to April 27, 2020. This strategy resulted in a collection of a total of 12 million tweets from all over the world. We also created a list of location filters for various states. These are the state names, aliases (as explained above), and names of popular cities in those states. Using these, we first filtered out all tweets having “India” in their user location and then sorted them based on the keyword matches of tokens in the user location with the above list. The user location was lowercased before matching.
2.1.2 Indian State Government n-CoV2019-Related Bulletins
DataMeet Community has curated a database of COVID-19-related government bulletins from the Indian States4,5. These bulletins have statistics about COVID-19 cases in the state, the government’s response to them, advisories, and other helpful information. We have analyzed all the reports that are in English language and belong to the states of Delhi, West Bengal, Punjab, Tamil Nadu, Odisha, and Kerala.
2.2 Preprocessing
We started with preprocessing the data and reducing the noise. Firstly, we lowercased the text, followed by tokenization or breaking the text into smaller units like words. Next, we removed stopwords, links, non-roman character words, whitespace, punctuations, and numbers, followed by Lemmatization.
2.3 Quantitative Empath Analysis
Empath (Fast et al. (2016)) is an open vocabulary-based tool to generate and validate lexical categories. It is based on a deep skip-gram model to draw a correlation between many words and phrases starting from a small set of seed words. It has some inbuilt categories, including emotions, which can be used to identify the emotion associated with a text. We analyzed Empath scores of emotions related to positive sentiment, negative sentiment, country, and government, the pandemic caused by COVID-19, and the fight against COVID-19. Details of the specific categories used are in Table 2.
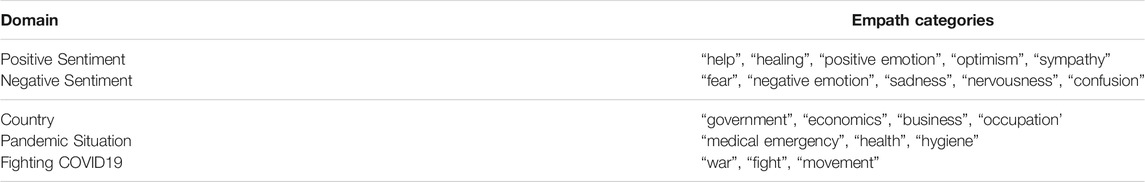
TABLE 2. Empath Categories used for analysis.
Empath provides three types of datasets to build the lexicon from—“reddit” (social media), “nytimes” (news articles), and “fiction”, and models a category by finding the words closest to the “seed words” of that category. Preliminary analysis using the Empath library showed that the current lexicon (including all three categories) was inadequate to analyze the current situation properly. A case in point would be that the word “positive” had a connotation with positive emotion in the Empath categories. However, in the COVID-19 scenario, it was often used in the context of “tested positive”. By itself, it was not a positive or negative emotion, and instead hinted at the activity of testing positive for COVID-19.
To rectify this, we manually examined the most frequent unigrams and bigrams as well as some common bigrams in the collected data, which may be classified incorrectly in the given context. We manually annotated them into the most relevant categories or created new categories to help better analyze the emotional content of the tweets. Table 3 shows some important modifications. The complete list of categories and their respective word lexicon can be found in the open-source repository of Empath.
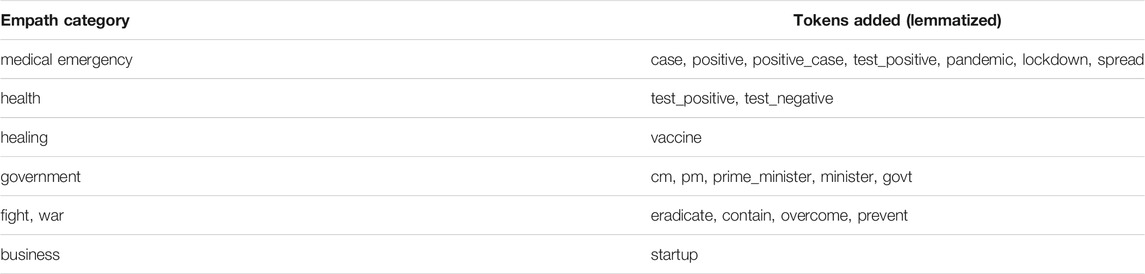
TABLE 3. Important modifications to Empath categories.
2.4 Granger’s Causality Analysis
As a prerequisite for studying the causal mechanism between the time series on Delhi bulletin and Delhi tweets, both sets of data were subjected to the Augmented Dickey–Fuller (ADF) test of unit root (to see whether the series are stationary or not). The formulation adopted for the ADF test was as follows:
where t stands for the time variable, △ for the difference operator, and ut for the disturbance terms. The null and alternative hypotheses for the test are:
△H0 : τ = 0 (meaning that the series possesses a unit root and is, therefore, non-stationary);
△H1 : τ < 1 (meaning that the series does not possess a unit root and is, therefore, stationary).
For examining causality, each of the corresponding pairs of variables from the first-differenced data sets was subjected to the estimation of Eqs 2, 3:
which were then compared for their predictive power through Wald’s test. If Eq. 2 turns out to be statistically superior to Eq. 1 (thus implying that the current value of Y can be better predicted through its past values as well as the past values of X than through the past values of Y alone), then we say X Granger causes(G-causes) Y. The series Y and X were then interchanged and the process repeated to examine if Y G-causes X.
The optimum number p of lagged terms to be included was decided through the min AIC criterion which, in the present analysis, turned out to be 1, in general.
All analysis was done on a HP ProBook G3 laptop with 8 GB RAM, 1 Tb hard drive, and Google Colaboratory with 12 GB RAM and 100 GB space. It takes us 6 h of total runtime to execute one pass of the analysis code on our data. All the data and code for this article are available here: http://bit.ly/Covibes.
3 Results
The analysis in this work focuses on the first wave of COVID-19, because of the limited availability of government bulletins in the second wave. The Empath time series and Granger causality analysis only use CoronaIndiaDataset-W1 and Datameet Government bulletins dataset.
3.1 Theme 1: National Analysis of Twitter Content
Using Empath, we analyzed the tweets collected in March 2020, along with various psycholinguistic attributes, as shown in Figure 3. The most common categories being discussed in the tweets were “medical emergency”, “government”, and “health”, which reflects that while discussing the pandemic, the public is bringing the government into the discourse, be it referring to some government policy or some information released by the government (see Figure 1). A significant frequency of words belonging to the business category was observed, where people are using words like workers, business, company, economy, etc. “Workers” was one of the most used words in this category. Suresh et al. (2020) sheds light on the migrant worker crisis during the lockdown in India. Many laborers and workers lost their jobs and were left without food and shelter. They had to migrate from cities back to their hometowns on foot. We observed that this was an important and widely raised issue in public discussions. Table 4 shows the list of the most frequently occurring words in each Empath category with an Empath score of > 1. The categories are sorted by their total Empath score in this analysis. Further, we analyzed the collected Twitter data based on psycholinguistic attributes as shown in Figure 5 and observed temporal patterns over short and long time scales.
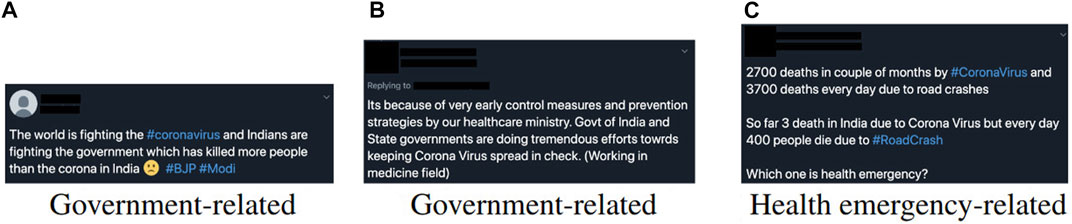
FIGURE 1. Sample tweets belonging to the popular Empath categories.
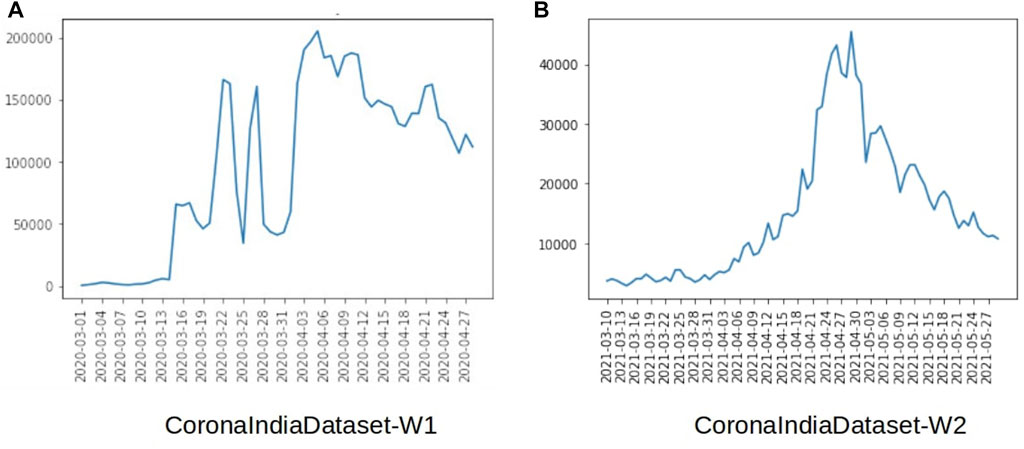
FIGURE 2. Frequency of tweets v/s dates available in our Dataset.
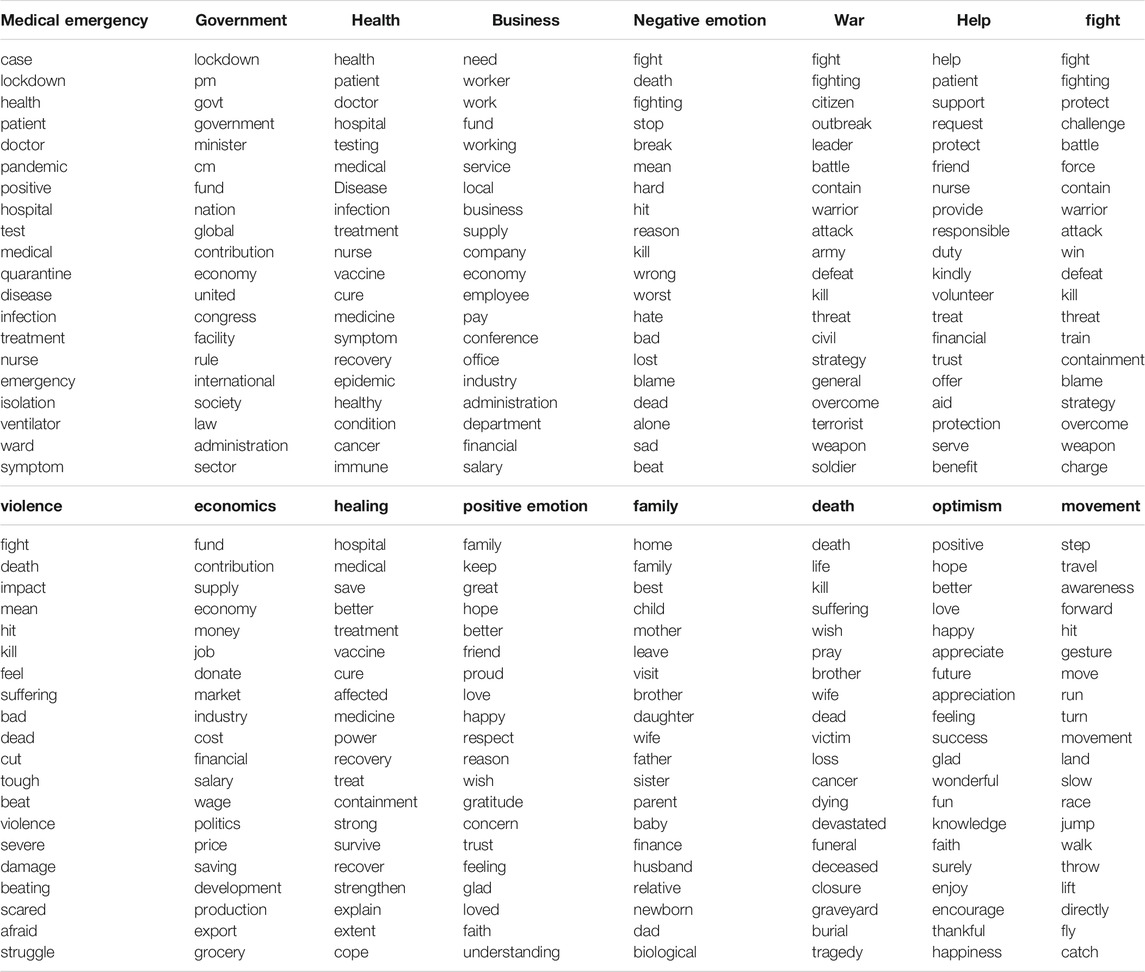
TABLE 4. The top 20 most frequently occurring words for each empath category which had a score of >0.01 in the national level tweets analysis.
We observed the long-term patterns in the Empath time series to identify how the sentiments observed in the discourse around COVID-19 on Indian Twitter evolve. “Health” and “government” have been the most popular categories for the Indian Twitter data in the long term. The frequency of nervousness-related words has sharply declined over time, with the peak around the time when COVID-19 started becoming popular. The discourse shifts from those related to hygiene and nervousness to those related to business and optimism. The discourse related to “hygiene” became very popular near the time when the lockdown was first imposed in India. Over time the frequency has declined, possibly hinting at the normalization of certain aspects of the COVID-19 narrative on Indian Twitter.
On looking at short-term temporal patterns, we find that certain short-term patterns coincide with on-ground events. On March 28, 2020, India crossed a total number of 1,000 confirmed COVID-19 cases. We observed that while the frequency of “health”-related tweets take a sharp dip near March 28, 2020, the frequency of tweets related to “government” observes its peak on the same day. On April 18, 2020 due to the imposition of a nationwide lockdown, the time taken for doubling COVID-19 cases came down from every 3 days to every 8 days. We observed that the presence of optimism-related keywords in the tweets has increased over time, with the highest frequency of optimistic words from April 18, 2020, to April 21, 2020. We also observed that the frequency of business-related words increases over time, with the peak being observed around April 20, 2020, when the government allowed certain relaxation for shops selling essential items to reopen up for the first time post the COVID-19 lockdown. The reflection of the on-ground situation in the Empath signals is also evident in the long-term patterns. We have compared the radar plot of Empath signals from the first and the second wave as well (Figure 3). While the distribution is largely similar, a major difference is that the “help” and “death” categories are much more prominent in the second wave. This is because the second wave hit India much more severely. With the country’s medical infrastructure overwhelmed, we saw people asking desperately for help on Twitter from anyone who could help. The death count was also significantly larger during the second wave.
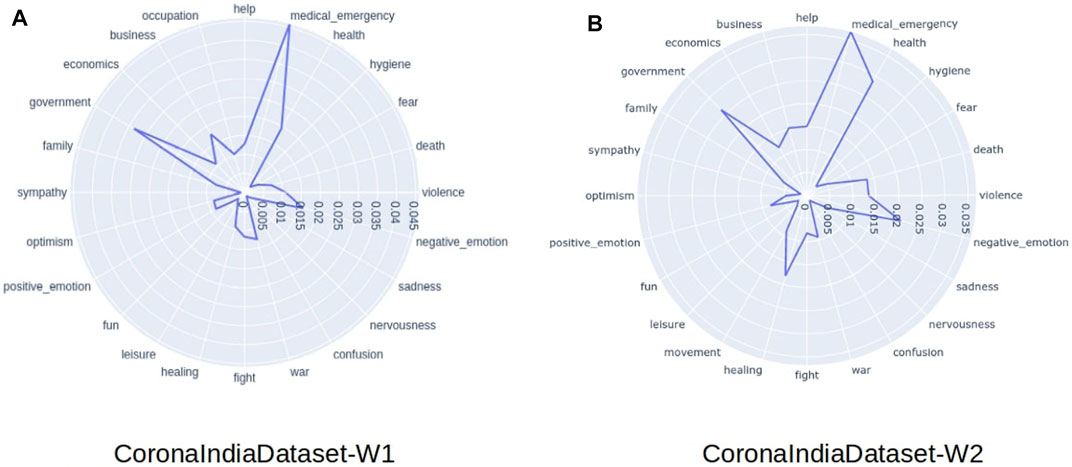
FIGURE 3. Empath Analysis for Indian Twitter in both waves. medical_emergency is the most frequently talked about Empath category. The main difference between the two waves is that the “help” and “death” categories are much more prominent in the second wave.
We thus, observed that the rapidly evolving public sentiment is reflective of the public’s response to the on-ground COVID-19 situation and the government response.
3.2 Theme 2: Influence of State Bulletins on Public Emotion on Twitter
3.2.1 Emotion Mining in Tweets
We analyzed the psycholinguistic features of COVID-19-related discourses on Twitter at a state level, as shown in Figure 4. Although the magnitudes of psycholinguistic features vary across different states, their relative frequency remains the same.
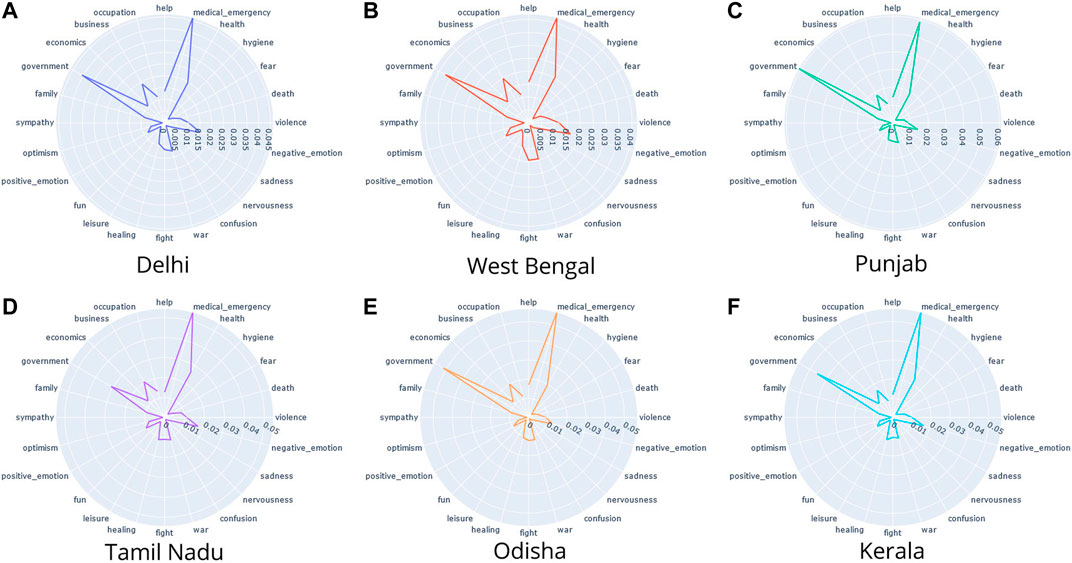
FIGURE 4. Empath analysis of tweets particular to Indian states: The most prominent categories across all states were medical_emergency and government.
We observed that while in some states like Delhi (Figure 4A), Punjab (Figure 4C), and Odisha (Figure 4E) tweets talking about government-related words were the most common on Twitter, few states like Tamil Nadu (Figure 4D) and West Bengal (Figure 4B) talked more about the “medical emergency” topic. Kerala (Figure 4F), on the other hand, had an equal frequency of words related to the “medical emergency” and “government” topics. West Bengal (Figure 4B) and Kerala (Figure 4F) also have a higher frequency of words related to negative emotion compared to other states. West Bengal (Figure 4B) showed higher levels of healing and positive emotions in the tweets. Interestingly, it also showed an even higher frequency of words related to war or fight.
3.2.2 Emotion Mining in State Government Bulletins
Looking at the COVID-19 government bulletins of the six states we were studying, we observed that they frequently use words related to “medical emergency” and “health” (Figure 6). The government bulletins released by the Delhi and West Bengal governments have a higher frequency of linguistic features related to the topic “healing” than other states. Interestingly, the state government bulletins in Odisha have a significantly higher inclination towards using words related to government, while for most other states, the primary focus is toward medical emergency. Also, all government bulletins show no “fear” or “confusion”-related psycholinguistic markers.
3.2.3 Causal Relationship Between Government Bulletins and Public Emotion
The causality analysis was done between the Delhi Government bulletins and tweets with the context of Delhi. The emotions fear, sadness, nervousness, confusion, fun, positive emotion, and economics were found to be stationary in the ADF test. However the large majority of categories, for example, Help time series were nonstationary (p-value > 0.05). However, the first-order difference of these time series was found to be stationary, therefore implying suitability for further G-causality analysis. See Table 5 for details. Consequently, for examining causality behavior, we have uniformly considered the first-differenced series on all the variables in respect of both data sets.
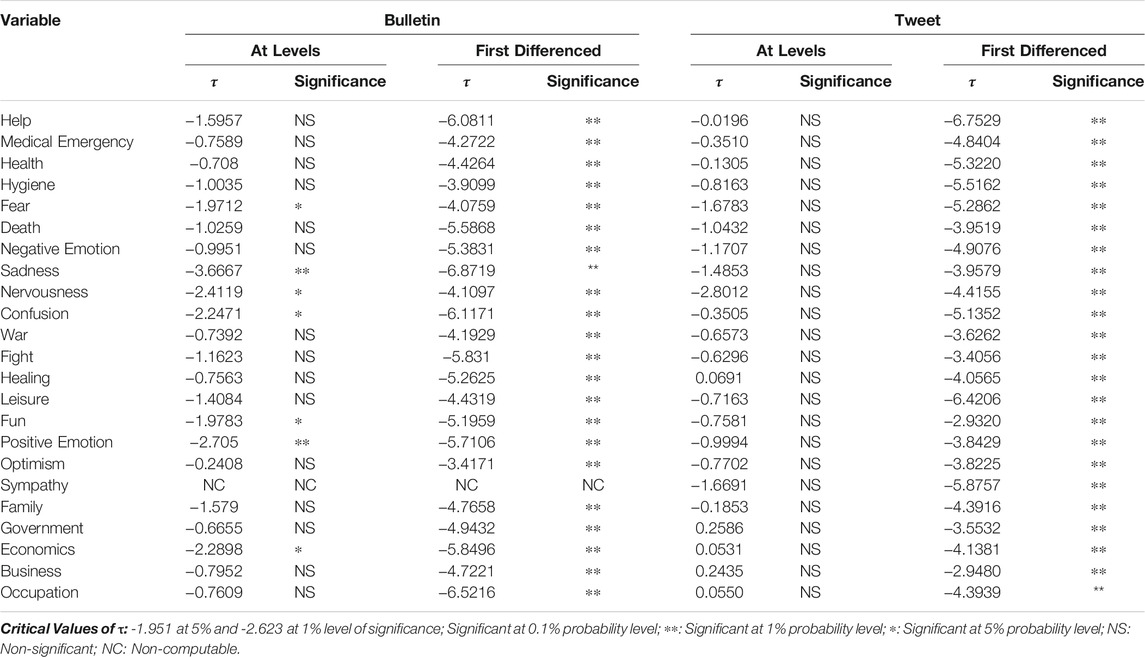
TABLE 5. Results in respect of Augmented Dickey–Fuller test of Unit Root.
For each topic/emotion, we tested Granger causality in both directions—the data set on Delhi Tweets (TWT) G-Causes the data set on Delhi Bulletins (BLT) or vice-versa. For example, in respect of “Medical Emergency”, the strength of causality was found to be higher in the direction of bulletin to tweets as found by interchanging these variables and assessing statistical significance at a 1% probability level. We may thus say that although there was an indication of feedback (bi-directional causality) between the two sets of data in respect of “Medical Emergency”, the strength of causality was more pronounced from bulletin to tweet. Similarly, significant (at 5% probability level) unidirectional causality (from bulletin to tweet) was also detected in respect of each of “death” and “war”. “health” demonstrated bi-directional causality (feedback) (at 5% level). Very strong causality (at < 0.1% probability level) from tweet to bulletin was indicated in respect of the variables “hygiene”, “leisure”, “fun,” and “government”. Topics that induced causality in any direction (TWT G-Causing BLT or BLT G-Causing TWT or both) are listed in Table 6. The table is sorted by the direction of Granger Causality. But for the rest of the variables, causal linkages between the two sets of data failed to be established. Thus, on the whole, the direction and strength of causality between the two sets of data were peculiar to the variable under consideration.
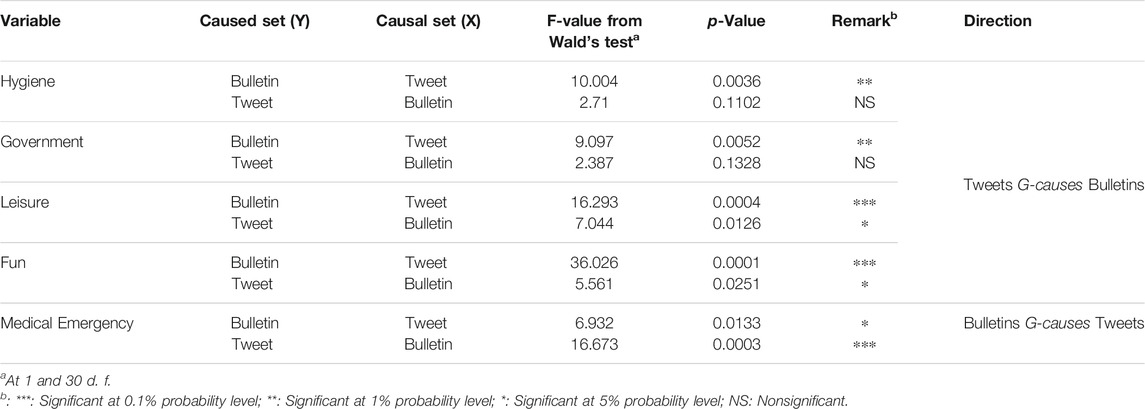
TABLE 6. Results in respect of Granger’s Causality Test. Sorted by direction of the causality.
4 Discussion
The purpose of our study is to provide suggestions for the government to devise more effective bulletins during a pandemic to dissipate negative emotions in public like fear and panic, taking India and its various states as case studies.
A Novel Twitter Dataset on National and State Level COVID-19 Discourse in India
We present a novel CoronaIndiaDataset with more than 5.6 million COVID-19-related Indian tweets, including geographically tagged tweets related to the Indian states. Specific to Indian states, this is the largest Covid-19 Twitter dataset to the best of our knowledge. We also use a government bulletin dataset in addition to the Twitter dataset to understand their evolution and their relationship with each other. The approach can be expanded to study this relationship on a wider scale. Lamsal (2021)’s geo-tagged Covid-19 tweets dataset can be used to shed light on the psycholinguistic relation between the government or WHO bulletins and the sentiment expressed by the residents on Twitter on a global scale. We can further use it to explore the differences between the induced public emotions globally.
Empath Time Series
We observed how Twitter sentiment reflects Twitter users’ reactions to on-ground situations, with sharp dips or peaks in certain topic signals. The topics or emotions which peak during a crisis are more important to the users. Abdullah et al. (2015) performed a study to show that, during a crisis, users retweet what they think is important; this is different from the user thinking it is correct. The same applies to user behavior during a pandemic—users would more often retweet what they think is important than what is correct. An entity that aims to tackle misinformation should look at these reactions (peaks and dips) to identify the topics or emotions users feel are important and address those topics in addition to talking about the facts so that the user behavior mentioned above can be used as an advantage to tackle misinformation.
The discourse related to “hygiene” became very popular near the time when the lockdown first got imposed, however, over time the frequency has declined possibly hinting at the normalization of certain aspects of the COVID-19 narrative on Indian Twitter. Bhuyan (2021) discusses how India’s complacency was a major factor in causing the second wave of COVID-19. A population that is unaware of a threat can be educated. But an aware population that starts normalizing a known threat is much more vulnerable and can even cause harm to the mitigation efforts. Analysis of these signals can help identify this behavior and can be used to take measures to reduce normalization. We also observed that the frequency of business-related words increases over time. This category includes words like shop, business, job, startup, company, corporation, salary, etc. This hints at people’s increasing concerns about the impact of COVID-19 on their business or occupation. This can also be seen in the Empath Radar charts (Figures 3, 4), as the business category is one of the major signals from the Twitter Empath analysis.
Lockdowns, inorganic human interactions through virtual media, and the increasing restrictions also affect the mental and emotional health of people. Chehal et al. (2020) found that although in India, people had a positive outlook toward Lockdown 2.0, they developed a negative outlook toward lockdown restrictions when Lockdown 3.0 was imposed, indicating declining emotional health. Using the methods discussed above, governments can understand the problems people are facing and also identify the general trends in negative emotions. Partnering with leading mental health institutions, these can then be studied and used to devise effective strategies and programs to help people cope with this unprecedented time.
We observed how there are similarities as well as differences in the Psychometric signals from the tweets of various states. While “medical emergency” is the most prominent category in almost all states, we see clear differences as we go to the next rank of most prominent category in the discourse. For example, the discourses corresponding to Punjab have “government” as the most prominent topic. While in Tamil Nadu discourses, the prominence of the “government” topic is significantly less. The similarity across all states highlights the need for state governments to work in coordination with the central government to devise a unified common strategy, but at the same time also monitor local developments and take appropriate action. The discussed methods can help state governments identify the unique patterns in the discourse for their states, and at the same time understand how similar the situation is with other states.
Granger-Causality
We discussed how addressing the topics important to users can help tackle the spread of misinformation. Studying the lead-lag relationships between the psychometric signals of government bulletins and Twitter discourse can help understand whether government bulletins were able to adapt to the evolving Twitter discourse and address the change in the importance of these topics. In Table 6, we observed how the Twitter topic signals are g-causing (or leading) the government bulletin signals for the same topic. In other words, the government bulletins are adapting and incorporating the discourse on Twitter for these emotions into their discourse. But most of these emotions—“hygiene”, “leisure,” and “fun”—do not rank high on the topics which are important for the users. See Table 4 for the topics which are most talked about in the national level Twitter discourse. For example, in the Empath time series (Figure 5), we see how the discourse related to business is increasing over time, indicating the growing importance of the topic “business”. But we see in Figure 6 that the government bulletins from some state governments have minimal or no discourse about business. Governments and several leaders can use this analysis to check whether their discourse addresses the important topics, allowing them to be more effective in communication and at the same time tackle misinformation.
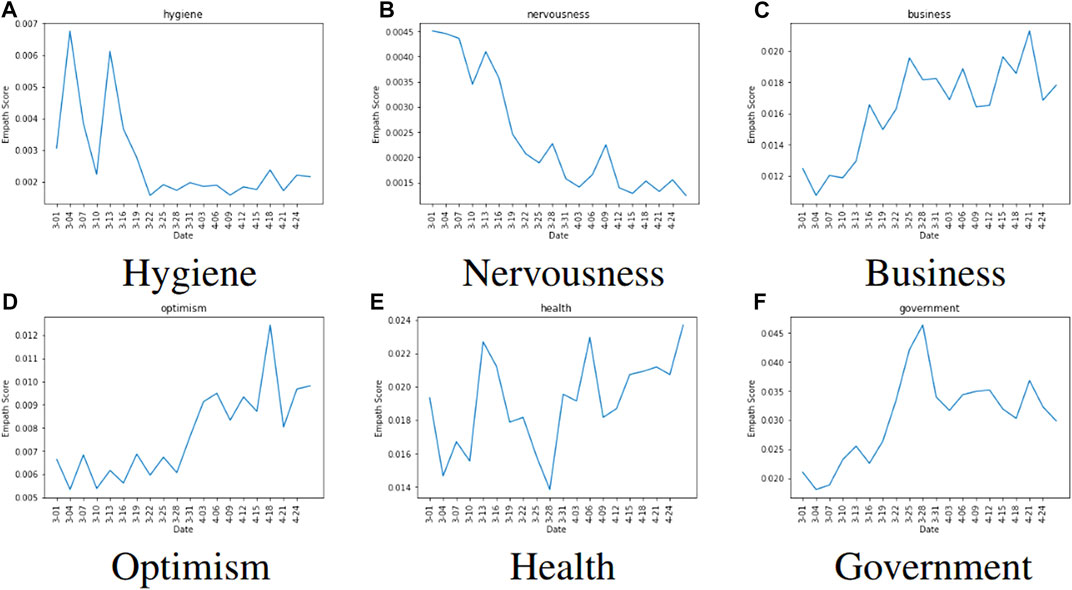
FIGURE 5. Time Series analysis of emotions in India-related Tweets. Clear patterns of consistent decline/increase can be seen in the time series plots of various emotions, which correlate to on ground events related to COVID-19.
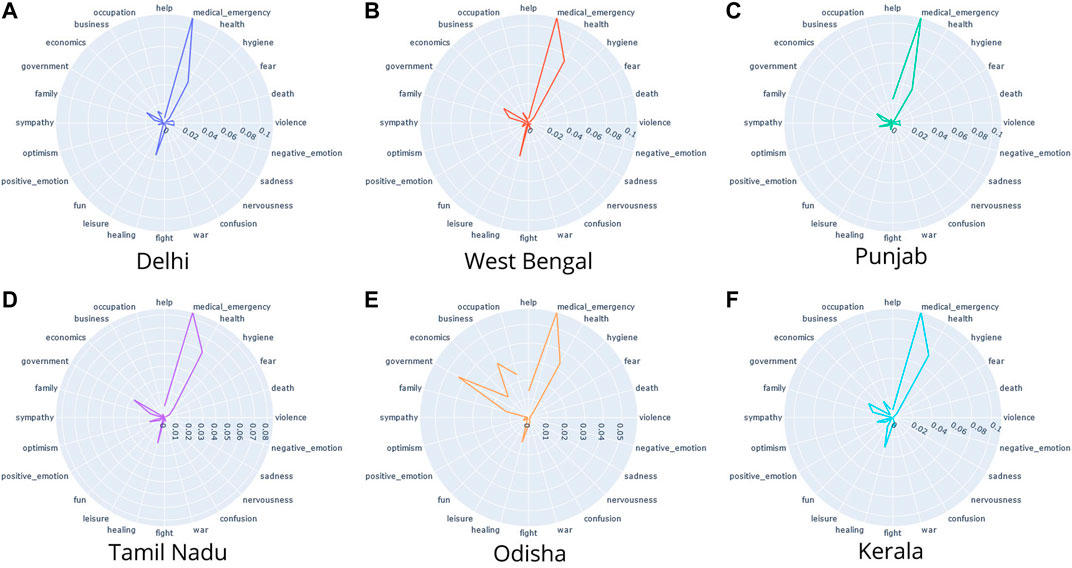
FIGURE 6. Empath analysis of government bulletins related to COVID-19 in India.
Using the modified Empath pipelines discussed in this article, similar to the work by Dubey (2020), we can compare the Twitter sentiments for the leadership of different Indian states during the COVID-19 pandemic. Using text analysis tools, after removing abusive speech, is a useful approach to get the on-ground pulse and feedback from the people. This can help governments and servant leaders to focus on delivering user needs more effectively. Further to this, the g-causality analysis method can be used to monitor whether the strategy is adaptive to what is important for the users.
5 Conclusion
We present a novel CoronaIndiaDataset with more than 5.6 million COVID-19-related Indian tweets, including tweets related to the Indian states. We link the rapidly changing psycholinguistic attributes of the public sentiment to the real-life on-ground situations arising due to COVID-19. We also present the analysis of lead-lag relationships between the time series of extracted emotions from official state bulletins and social media using Granger’s causality to show that for emotions like Medical Emergency, the state bulletin was leading the social media. We further designed an interactive web portal COVibes (https://covibes.herokuapp.com), to present our psychometric insights gained both at a national and state level, from the CoronaIndiaDataset. This dataset and analysis technique can be used for further research into understanding the public perceptions and making more effective policy decisions. We restricted our work to the English language. Future work in this direction can be done to increase the scope of the analysis to various Indian languages. Furthermore, we can explore how the combination of central government bulletins and state government bulletins relate to the tweets across the country. Further, one can also understand the globalized and localized relationship between the psycholinguistic markers displayed in the social media posts globally and those displayed within India, which can be used by policymakers to device effective policy decisions learning from other countries.
Data Availability Statement
The datasets presented in this study can be found in online repositories. The names of the repository/repositories and accession number(s) can be found in the article/Supplementary Material.
Ethics Statement
The data used in this study are collected from bulletins published by the State Governments in India and tweets published by users in the public domain.
Author Contributions
BJ collected data, trained models, conducted analysis, and wrote the article. PA collected data, trained modes, conducted analysis, and wrote the article. AG collected data and constructed the dashboard. AS conducted analysis and wrote the article. PK guided data collection and platform development. TS designed the study, supervised analysis and edited the article. All authors read the article and approved it for publication.
Funding
This study did not receive any funding.
Conflict of Interest
The authors declare that the research was conducted in the absence of any commercial or financial relationships that could be construed as a potential conflict of interest.
Publisher’s Note
All claims expressed in this article are solely those of the authors and do not necessarily represent those of their affiliated organizations, or those of the publisher, the editors and the reviewers. Any product that may be evaluated in this article, or claim that may be made by its manufacturer, is not guaranteed or endorsed by the publisher.
Acknowledgments
Tavpritesh Sethi thanks the Wellcome Trust/DBT India Alliance Fellowship IA/CPHE/14/1/501504.
Footnotes
1https://www.who.int/dg/speeches/detail/munich-security-conference.
2https://bit.ly/COVID19-infodemic.
3https://blog.twitter.com/en_us/topics/company/2020/An-update-on-our-continuity-strategy-during-COVID-19
4http://projects.datameet.org/covid19/
5https://github.com/datameet/covid19
References
Abdullah, N. A., Nishioka, D., Tanaka, Y., and Murayama, Y. (2015). User’s Action and Decision Making of Retweet Messages towards Reducing Misinformation Spread during Disaster. J. Inf. Process. 23, 31–40. doi:10.2197/ipsjjip.23.31
[Dataset] Alhajji, M., Al Khalifah, A., Aljubran, M., and Alkhalifah, M. (2020). Sentiment Analysis of Tweets in Saudi Arabia Regarding Governmental Preventive Measures to Contain Covid-19. ResearchGate [Preprint].
Bhuyan, A. (2021). Experts Criticise India's Complacency over COVID-19. The Lancet. 397, 1611–1612. doi:10.1016/s0140-6736(21)00993-4
Chehal, D., Gupta, P., and Gulati, P. (2020). Covid-19 Pandemic Lockdown: An Emotional Health Perspective of Indians on Twitter. Internat. J. Soc. Psychiatry doi:10.1177/0020764020940741
Chen, E., Lerman, K., and Ferrara, E. (2020). Tracking Social Media Discourse About the Covid-19 Pandemic: Development of a Public Coronavirus Twitter Data Set. JMIR Public Health Surveill. 6 (2), e19273. doi:10.2196/19273
Dubey, A. D. (2020). Decoding the Twitter Sentiments Towards the Leadership in the Times of COVID-19: A Case of USA and India Available at SSRN: https://ssrn.com/abstract=3588623 (Accessed April 29, 2020).
Fast, E., Chen, B., and Bernstein, M. S. (2016). Empath. Conf. Hum. Factors Comput. Syst. - Proc., 4647–4657. doi:10.1145/2858036.2858535
Haouari, F., Hasanain, M., Suwaileh, R., and Elsayed, T. (2021). “Arcov-19: The First Arabic Covid-19 Twitter Dataset with Propagation Networks,” in Proceedings of the Sixth Arabic Natural Language Processing Workshop (Kyiv, Ukraine: (Virtual): Association for Computational Linguistics), 82–91.
Hou, Z., Du, F., Jiang, H., Zhou, X., and Lin, L. (2020). Assessment of Public Attention, Risk Perception, Emotional and Behavioural Responses to the COVID-19 Outbreak: Social Media Surveillance in China. SSRN Electron. J. [Preprint]. doi:10.2139/ssrn.3551338
Jain, V. K., and Kumar, S. (2015). An Effective Approach to Track Levels of Influenza-A (H1n1) Pandemic in India Using Twitter. Proced. Computer Sci. 70, 801–807. doi:10.1016/j.procs.2015.10.120
Kayes, A., Islam, M. S., Watters, P. A., Ng, A., and Kayesh, H. (2020). Automated Measurement of Attitudes towards Social Distancing Using Social media: A Covid-19 Case Study. doi:10.5210/fm.v25i11.10599
Kim, E. H.-J., Jeong, Y. K., Kim, Y., Kang, K. Y., and Song, M. (2016). Topic-Based Content and Sentiment Analysis of Ebola Virus on Twitter and in the News. J. Inf. Sci. 42, 763–781. doi:10.1177/0165551515608733
Lamsal, R. (2021). Design and Analysis of a Large-Scale Covid-19 Tweets Dataset. Appl. Intell. 51, 2790–2804. doi:10.1007/s10489-020-02029-z
Lazard, A. J., Scheinfeld, E., Bernhardt, J. M., Wilcox, G. B., and Suran, M. (2015). Detecting Themes of Public Concern: A Text Mining Analysis of the Centers for Disease Control and Prevention's Ebola Live Twitter Chat. Am. J. Infect. Control. 43, 1109–1111. doi:10.1016/j.ajic.2015.05.025
Li, L., Zhang, Q., Wang, X., Zhang, J., Wang, T., Gao, T.-L., et al. (2020a). Characterizing the Propagation of Situational Information in Social Media during COVID-19 Epidemic: A Case Study on Weibo. IEEE Trans. Comput. Soc. Syst. 7, 556–562. doi:10.1109/tcss.2020.2980007
Li, S., Wang, Y., Xue, J., Zhao, N., and Zhu, T. (2020b). The Impact of Covid-19 Epidemic Declaration on Psychological Consequences: A Study on Active Weibo Users. Int. J. Environ. Res. Public Health. 17, 2032. doi:10.3390/ijerph17062032
Pennebaker, J. W., Francis, M. E., and Booth, R. J. (2001). Linguistic Inquiry and Word Count: Liwc 2001. Mahway: Lawrence Erlbaum Associates. 71, 2001.
Ritterman, J., Osborne, M., and Klein, E. (2009). “Using Prediction Markets and Twitter to Predict a Swine Flu Pandemic,” in 1st international workshop on mining social media. 9, 9–17.
Signorini, A., Segre, A. M., and Polgreen, P. M. (2011). The Use of Twitter to Track Levels of Disease Activity and Public Concern in the U.S. During the Influenza A H1N1 Pandemic. PloS one. 6, e19467. doi:10.1371/journal.pone.0019467
Suresh, R., James, J., and R. S.j, B. (2020). Migrant Workers at Crossroads-The Covid-19 Pandemic and the Migrant Experience in India. Soc. Work Public Health. 35, 633–643. doi:10.1080/19371918.2020.1808552
Tahmasbi, F., Schild, L., Ling, C., Blackburn, J., Stringhini, G., Zhang, Y., et al. (2021). “Go Eat a Bat, Chang!”: An Early Look on the Emergence of Sinophobic Behavior on Web Communities in the Face of COVID-19. In Proceedings of the Web Conference 2021. 1122–1133.
Wong, R., Harris, J. K., Staub, M., and Bernhardt, J. M. (2017). Local Health Departments Tweeting about Ebola: Characteristics and Messaging. J. Public Health Management Pract. 23, e16–e24. doi:10.1097/phh.0000000000000342
Keywords: COVID-19, social media, pandemic, psychometric analysis, government response, government
Citation: Aggrawal P, Jolly BLK, Gulati A, Sethi A, Kumaraguru P and Sethi T (2021) Psychometric Analysis and Coupling of Emotions Between State Bulletins and Twitter in India During COVID-19 Infodemic. Front. Commun. 6:695913. doi: 10.3389/fcomm.2021.695913
Received: 15 April 2021; Accepted: 21 July 2021;
Published: 24 September 2021.
Edited by:
Paul Russell Ward, Flinders University, AustraliaReviewed by:
Douglas Ashwell, Massey University Business School, New ZealandSatarupa Dasgupta, Ramapo College, United States
Copyright © 2021 Aggrawal, Jolly, Gulati, Sethi, Kumaraguru and Sethi. This is an open-access article distributed under the terms of the Creative Commons Attribution License (CC BY). The use, distribution or reproduction in other forums is permitted, provided the original author(s) and the copyright owner(s) are credited and that the original publication in this journal is cited, in accordance with accepted academic practice. No use, distribution or reproduction is permitted which does not comply with these terms.
*Correspondence: Tavpritesh Sethi, tavpriteshsethi@iiitd.ac.in
†These authors have contributed equally to this work