Next Article in Journal
An App about Healthy Habits as an Educational Resource during the Pandemic
Previous Article in Journal
Sleep Medication in Older Adults: Identifying the Need for Support by a Community Pharmacist
 
 
Correction published on 31 March 2022, see Healthcare 2022, 10(4), 657.
Article

An Explainable Machine Learning Approach for COVID-19’s Impact on Mood States of Children and Adolescents during the First Lockdown in Greece

by
Charis Ntakolia
1,*,
Dimitrios Priftis
1,
Mariana Charakopoulou-Travlou
1,
Ioanna Rannou
1,
Konstantina Magklara
2,
Ioanna Giannopoulou
3,
Konstantinos Kotsis
4,
Aspasia Serdari
5,
Emmanouil Tsalamanios
6,
Aliki Grigoriadou
7,
Konstantina Ladopoulou
8,
Iouliani Koullourou
9,
Neda Sadeghi
10,
Georgia O’Callaghan
10 and
Eleni Lazaratou
2
1
University Mental Health Research Institute, 11527 Athens, Greece
2
First Psychiatric Department, Eginition Hospital, National and Kapodistrian University of Athens, 11528 Athens, Greece
3
Second Psychiatric Department, ‘Attikon’ University Hospital, National and Kapodistrian University of Athens, 12462 Athens, Greece
4
Department of Psychiatry, Faculty of Medicine, School of Health Sciences, University of Ioannina, 45110 Ioannina, Greece
5
Department of Child and Adolescent Psychiatry, Medical School, Democritus University of Thrace, University Hospital of Alexandroupolis, 68100 Alexandroupolis, Greece
6
Department of Child and Adolescent Psychiatry, Division of Psychiatry, ‘Asklepieion Voulas’ General Hospital, 16673 Attica, Greece
7
Hellenic Centre for Mental Health and Research, 10683 Athens, Greece
8
Athens Child and Adolescent Mental Health Centre, General Children’s Hospital ‘Pan. & Aglaia Kyriakou’, 11527 Athens, Greece
9
Mental Health Center, General Hospital ‘G. Hatzikosta’, 45445 Ioannina, Greece
10
Section of Clinical and Computational Psychiatry, National Institute of Mental Health, National Institutes of Health, Bethesda, MD 20892, USA
*
Author to whom correspondence should be addressed.
Healthcare 2022, 10(1), 149; https://doi.org/10.3390/healthcare10010149
Submission received: 13 December 2021 / Revised: 7 January 2022 / Accepted: 10 January 2022 / Published: 13 January 2022 / Corrected: 31 March 2022
(This article belongs to the Topic Burden of COVID-19 in Different Countries)

Abstract

:
The global spread of COVID-19 led the World Health Organization to declare a pandemic on 11 March 2020. To decelerate this spread, countries have taken strict measures that have affected the lifestyles and economies. Various studies have focused on the identification of COVID-19’s impact on the mental health of children and adolescents via traditional statistical approaches. However, a machine learning methodology must be developed to explain the main factors that contribute to the changes in the mood state of children and adolescents during the first lockdown. Therefore, in this study an explainable machine learning pipeline is presented focusing on children and adolescents in Greece, where a strict lockdown was imposed. The target group consists of children and adolescents, recruited from children and adolescent mental health services, who present mental health problems diagnosed before the pandemic. The proposed methodology imposes: (i) data collection via questionnaires; (ii) a clustering process to identify the groups of subjects with amelioration, deterioration and stability to their mood state; (iii) a feature selection process to identify the most informative features that contribute to mood state prediction; (iv) a decision-making process based on an experimental evaluation among classifiers; (v) calibration of the best-performing model; and (vi) a post hoc interpretation of the features’ impact on the best-performing model. The results showed that a blend of heterogeneous features from almost all feature categories is necessary to increase our understanding regarding the effect of the COVID-19 pandemic on the mood state of children and adolescents.

Graphical Abstract

1. Introduction

In December 2019 the World Health Organization (WHO) identified the novel coronavirus (COVID-19) as the cause of pneumonia in Wuhan, China, and on 11 March 2020 the WHO declared COVID-19 as a pandemic [1,2]. Between 31 December 2019 and 4 May 2020, over 184 countries adopted strict measures to limit the spread of COVID-19, such as lockdown restrictions and quarantine time, which led to socioeconomic, environmental, and mental health challenges. Within those restrictions, specific measures ranged from working from home, to online education (e-learning), to social restrictions to border closures (Table 1) [3]. Even though the lockdown policies contributed to the control and decrease in the spread of COVID-19, they also resulted in the deterioration of the mental health of the population worldwide [3,4,5].
A plethora of studies have been conducted to examine the impact of COVID-19 and its restriction policies on the studied population [6,7,8]. Specifically, multivariable logistic regression analyses were adopted in various studies to: (i) identify the correlations of mental health with other factors [9,10,11], such as sociodemographic features [4,12,13,14] and/or school aspects [14] or health behaviors [15], mostly on university students [16,17,18]; (ii) assess the prevalence and the risk factors associated with self-reported psychological distress [19]; and (iii) evaluate the effects of COVID-19 measures upon the mental health of children and adolescents, with or without pre-existing diagnoses [20]. Binomial or binary logistic regression analysis was used to: (i) identify sleeping problems of adolescents and young adults (12–29 years) during the pandemic [21,22]; (ii) assess depression and anxiety amongst university students [23]; and (iii) examine the prevalence of anxiety among children and the possible association to COVID-19 [24]. Other studies focused on youths used univariate logistic regression to identify mental health issues [25]. Hierarchical logistic regression analyses were used to examine variables associated with mental health problems during the COVID-19 outbreak to university students [26]. Adjusted logistic regression analyses were used to examine the association between stress due to COVID-19 and worries to children and adolescents [27]. However, limited studies have been employed with machine learning prediction models such as the XGBoost model, to predict anxiety and insomnia in undergraduate students during the COVID-19 pandemic [28], or random forest and regression trees to identify predictors of psychological distress during COVID-19 in participants aged 18–85 [29].
Most of the above presented studies focused on Chinese regions [14,16,26] and college students [16,19,26], and used traditional statistical approaches such as logistic regression and chi-square tests [23,24,25,27] to identify correlations among risk factors and mental health problems, while only few of them employ machine learning methodologies [29]. Furthermore, to the best our knowledge, there has not been any study focused on children and adolescents with diagnosed mental disorders. Therefore, this study aims to fill this gap by proposing the development of an explainable machine learning pipeline to create a deeper understanding of the consequences and impact of the first lockdown in Greece on the mental health of children and adolescents. The study includes 71 heterogenous factors. The proposed methodology consists of: (i) clustering the examined population based on their mood state alteration during lockdown; (ii) identifying the main features that contribute to the mood alteration of the examined population; (iii) developing calibrated machine learning models to predict the alteration of mood state; (iv) post hoc explainability analysis to rank features in terms of their impact on the final machine learning outputs.
The current study focuses on children and adolescents that had been attending Children and Adolescents Mental Health Services (CAMHS) in Greece during the year prior to the pandemic.

2. Background

Recent studies have focused on a statistical or machine learning approach to predict or interpret the impact of COVID-19 on the mental health of children and adolescents. Regarding participants, only a limited number of studies have focused on children and young adults (Table 2). Specifically, a multivariable logistic regression analysis was performed in order to identify correlations between sociodemographic features and mental health problems in Chinese adolescents during the outbreak of COVID-19. The population was composed of 8079 Chinese students aged 12–18. The data were collected by the Patient Health Questionnaire (PHQ-9) and the Generalized Anxiety Disorder (GAD-7) questionnaire with the goal of assessing depressive and anxiety symptoms. Results showed that female students and those with higher grades had an elevated risk of presenting symptoms of anxiety and depression [2]. Moreover, a second survey was conducted with regards to the mental health of Chinese children aged 7–15 years during COVID-19, with a total of 668 parents across different regions of China. Multiple logistic regression analysis was used to analyze the data, identifying the main factors that contribute to the education and the mental health of Chinese children, and found the school system and province of origin to be significant factors associated with developing PTSD, and the majority of participants having a positive opinion about online education [4]. Liang et al. studied the effects of COVID-19 on youth mental health in China by collecting data from the General Health Questionnaire (GHQ-12), the PTSD Checklist—Civilian Version (PCL-C) and the Negative coping styles scale from 584 youths. The univariate analysis and univariate logistic regression showed that almost 40.4% of the sampled youth were found to be prone to psychological problems, and 14.4% to post-traumatic stress disorder (PTSD) symptoms [25].
A comparison among two cross-sectional studies was conducted to evaluate the factors that contributed to depression and anxiety among Chinese adolescents during the COVID-19 pandemic [14]. The first study took place between 20 February and 27 February, while the second between 11 April and 19 April 2020; The studies had 9554 and 3886 participants, respectively. Multivariable logistic regression analyses revealed that group membership in the second survey, female gender, senior secondary school enrollment, and concerns about entering a higher grade were positively associated with both depression and anxiety [14].
Another study assessed prevalence and risk factors associated with self-reported psychological distress amongst 1,199,320 school-aged children and adolescents in China, between 8 March and 30 March 2020. Multivariate logistic regression and odds ratio showed that 126,355 students reported psychological distress, and that older children had an increased risk of experiencing psychological distress, as did students who never wore face masks and those who spent less than 0.5 h exercising [19]. Another online survey focusing on 11,835 Chinese adolescents and young adults (12–29 years) was conducted regarding sleeping problems during the pandemic [21]. The Pittsburgh Sleep Quality Index (PSQI), the PHQ-9, and GAD-7 questionnaires were used to assess insomnia, depression, and anxiety symptoms, respectively, while the Social Support Rate Scale was used to assess social support. Binomial logistic regression analysis revealed that high risk factors for presenting insomnia symptoms were being female and residing in the city [21].
Most of the studies have focused on college students. Ge et al. used the XGBoost model to predict anxiety and insomnia in Chinese undergraduate students during the COVID-19 pandemic. In total, 2009 students participated by answering questionnaires during the two first moths attending university, between 10 and 13 February 2020. The results showed that the most related variables in predicting anxiety included romantic relationships, suicidal ideation, sleep problems, and a history of anxiety symptoms, while the prediction of insomnia was found to be associated with aggression, psychotic episodes, suicidal ideation, and romantic relationships [28]. Another study focused on 746,217 Chinese university students, which conducted univariate and hierarchical logistic regression analyses to examine variables associated with mental health problems during the COVID-19 outbreak in 2019. Results showed that being in close relation to others who had contracted the virus, exposure to social media coverage of COVID-19 for more than three hours daily, and inadequate social support were the main contributing factors to mental health problems among participants [26]. Additionally, a study of 89,588 Chinese university students found that 36,865 students reported anxiety symptoms, and multivariate logistic regression models showed that risk factors for anxiety symptoms included being 26–30 years old, being in sophomore, junior and senior grades, having a higher paternal education level, low economic status, or low social support [16]. Among 933 medical students who participated in a cross-sectional survey evaluating the impact of COVID-19 between 4 and 12 February 2020 and completed the PHQ-9 and GAD-7, anxiety was found in 17.1% of participants and depression in 25.3% of participants. Furthermore, anxiety levels were higher among those located in the Wuhan epicenter, rather than Beijing [17].
Several studies have also focused on French university students. A study with a total of 69,054 participants who completed a survey between 17 April and 4 May 2020 showed a high prevalence of mental health issues among students who experienced quarantine, which highlighted the need for prevention, surveillance, and access to care [18]. Another study with a sample of 3671 participants who completed an online retrospective survey between the 13 March and 11 May 2020 found a significant reduction in tobacco smoking, binge drinking, and cannabis use, while reductions in physical activity were associated with higher depression levels and being male [15].
A web-based cross-sectional survey assessed depression and anxiety amongst 476 university students during the COVID-19 pandemic in Bangladesh, using binary logistic regression. Results showed that older students were more likely to have greater depression, whereas students who afforded private tuition during the pre-pandemic period had depression [22]. Furthermore, an online cross-sectional study conducted in Bangladesh between 15 April and 9 May, gathered data from 384 parents with at least one child aged 5–15 [23]. Results indicated that 43% of children rated over the subthreshold on mental disturbances, 30.5% mild disturbances, 19.3% moderate disturbances, and 7.2% severe disturbances. Lastly, higher percentages of mental health disturbances were associated with higher parental education levels, parents attending to the workplace, and relatives infected with COVID-19 [23].
Cost et al. (2021) [20] evaluated the effects upon the mental health of children and adolescents, with or without pre-existing diagnoses, in response to the emergency measures set in place for COVID-19 in Canada. For parents of children aged 6–18, the Coronavirus Health and Impact Survey (CRISIS) questionnaire, along with self-reports, was used in order to examine mental and behavioral changes, while for children aged 2–5, the Strengths and Difficulties Questionnaire (SDQ) was used. Multinomial logistic regression identified that during the first wave of the pandemic there was a deterioration in the mental health of children and adolescents with and without previous diagnosis, with the former experiencing greater deterioration and greater stress related to social isolation. For some children, the impact of a pre-existing diagnosis was associated with deterioration in depression, irritability, hyperactivity, and obsessions/compulsions, while for others it was associated with an improvement in anxiety, attention, and obsessions/compulsions.
An additional study examined the prevalence of anxiety among Brazilian children, and the possible association to COVID-19, during April and May 2020 [24]. 157 girls and 132 boys aged 6–12, along with their parents or guardians, participated in the study. Using the Children’s Anxiety Questionnaire (CAQ) and the Numerical Rating Scale (NRS), data showed that children whose parents had essential jobs and were social distancing had higher levels of anxiety, while results from the logistic regression suggested that social distancing without parents, a higher number of people per household, and the education level of parents or guardians, were also associated with higher anxiety scores in CAQ.
Tamarit et al. (2020) examined the association between sociodemographic factors and COVID-19-related variables and their effect on depression, anxiety, and stress among adolescents in Spain [13]. A total of 523 adolescents (13–17 years) completed the Depression, Anxiety and Stress Scale (DASS-21) along with the Oviedo Infrequency Scale (INFO-OV), with results indicating that girls who work voluntarily and those who stayed home more frequently were more likely to show symptoms of depression, anxiety, or stress. In addition, the study indicated an association between mental distress and stressful life events whilst conducting research related to COVID-19. Finally, participants who were in a romantic relationship, along with those who had already been infected with COVID-19, were more likely to have an improved mental health state.
In addition to the above, a study focused on children and adolescents aged 5–17 with attention deficit hyperactivity disorder (ADHD) aimed to identify the impact of COVID-19 restrictions in Australia [27]. Parents of 213 children who had been diagnosed with ADHD participated on the survey in May 2020, during COVID-19 restrictions. The study focused on: (i) child physical health, media use, and mental health; (ii) life changes; (iii) changes and/or barriers to healthcare, among others. Statistical analysis indicated that COVID-19 restrictions were associated with decreased exercise, outdoor time, and enjoyment in activities, and an increase in watching television, social media use, and gaming, as well as increases in depressed mood and loneliness. On the contrary, 64% of parents identified increased family time and positive changes.
Another cross-sectional study based on machine learning examined the psychological impact of COVID-19 on 478 college students after school reopening [19]. Results indicated that students who experienced fear of being infected, a pessimistic attitude, friends of family contracting COVID-19, and higher grades easily experienced anxiety or depression. Multivariate logistic regression indicated a variety of significant factors influencing anxiety or depression, including alcohol use, school reopening, taking temperature routinely, sleep quality, lockdown restrictions, and availability of package deliveries.
A Belgian survey examined mental distress and its contributing factors among 2008 young people aged 16–25 years during the first wave of COVID-19, using Bivariate and multivariable logistic regression analyses. The results showed that approximately two-thirds of the participants experienced mental distress. They also found that low social support, loneliness, social media use, decreased participation in social situations, being female, and decreased completion of home activities to be significant predictors of mental distress [31]. Another study focused on identifying predictors of psychological distress during COVID-19 in 2787 participants aged 18–85. Random forest machine learning algorithm and regression trees suggest that female participants, participants with underlying medical conditions, and those with emotional-based coping experienced higher levels of severe anxiety [29]. Finally, another cross-sectional study examined the mental health of 280 school-aged children in Florida, during the first COVID-19 long-distance-learning mandates. Bivariate analysis and logistic and multinomial logistic regression models showed that loss of household income and being female were associated with being at higher risk for anxiety symptoms, depressive symptoms, and OCD symptoms, whereas parental protective practices against COVID-19 were found to increase the risk of depressive symptoms [10].
Most of the above presented studies focused on Chinese regions [14,16,26] and college students [16,19,26], and used traditional statistical approaches, such as logistic regression and chi-square tests [23,24,25,27] to identify correlations among risk factors and mental health problems, while only few of them employed machine learning methodologies [29]. Furthermore, to the best our knowledge, there has not been any study focused on children and adolescents with diagnosed mental disorders, apart from a study focused on specific diagnosis [27]. Therefore, the contribution of our study is summarized as:
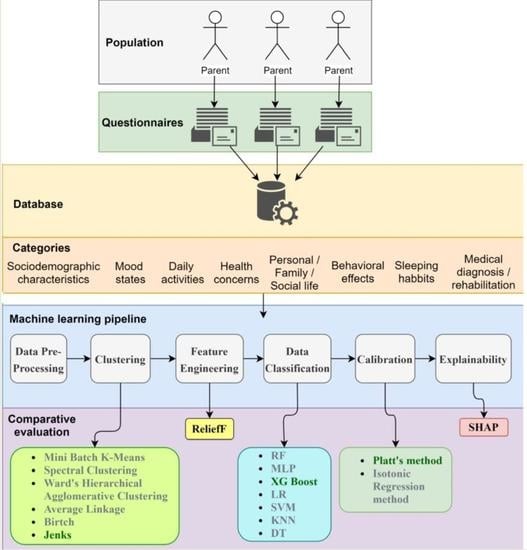
  • The use of an explainable machine learning pipeline with multiple comparative evaluations among the ML stages to guarantee the development of an accurate prediction model;
  • The use of a post hoc explainability model to diagnose and interpret the most contributed factors to the prediction output of the model and thus to identify the factors that led to mood alteration or stability during the first lockdown in Greece;
  • The incorporation of 71 heterogeneous features from 10 different categories, such as demographics, social life, personal life, family life, daily activities, health concerns and behavioral effects, sleep habits, mood state, and medical diagnosis/rehabilitation;
  • The application to the vulnerable group of population [31], such as children and adolescents with pre-existing psychiatric and/or developmental disorders, is incorporated in order to further understand the impact of COVID-19 and its restrictions by identifying the factors that contributed most to the mood state alteration of the population under examination during the first lockdown in Greece. To achieve this, machine learning tools were employed following a post-hoc explainability analysis.

3. Materials and Methods

To predict the impact of COVID-19 due to the first lockdown imposed in Greece during the period from 23 March 2020 to 4 May 2020, we focused on the sensitive group of children and adolescents. The data from the Hellenic COVID-19 imPact survEy (HOPE) were used, a longitudinal study surveying parents of children that had been attending, during the year prior to the pandemic (1 March 2019 to 1 March 2020), CAMHS in Greece (seven in Athens Greater Metropolitan Area, two in Ioannina, one in Alexandroupolis, one in Thessaloniki, and one on Crete). A machine learning pipeline (Figure 1) was proposed that included: (i) data collection via questionnaires and medical reports; (ii) data preprocessing; (iii) a competitive evaluation of state-of-the art clustering methods and evaluation metrics; (iv) a feature selection based on a state-of-the-art and robust method, named ReliefF, that has been proven effective for medical data; (v) a competitive evaluation of various ML models following calibration; and (vi) a post hoc explainability of the best performed model with SHAP to identify the features’ impact on the model.

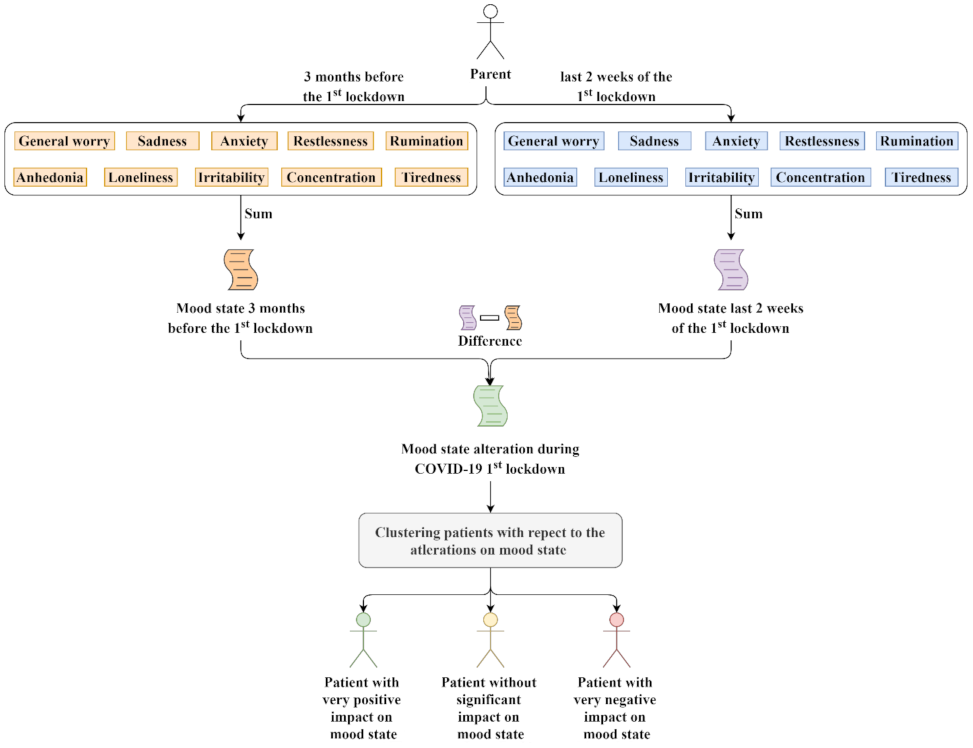
3.1. Data Collection

To collect the data and form the dataset, children who attended the service of CAMHS participated. Specifically, 744 children whose parents (738 parents) answered the online questionnaire on their behalf participated in this study. This process took place between 8 May and 1 June 2020. The questionnaire included questions relevant to demographic information, parent’s evaluation of the child’s condition 3 months (3m) before the lockdown and 2 weeks (2w) after the first lockdown in Greece. Table 3 shows the sociodemographic characteristics of the dataset, while Table 4 presents the description of the variables used in the study as they were extracted from the questionnaires.

3.2. Data Preprocessing

Data imputation was not needed since there were no missing values of categorical or numerical variables in the final dataset. Furthermore, as a common requirement for many ML classifiers, the standardization of the dataset was implemented.

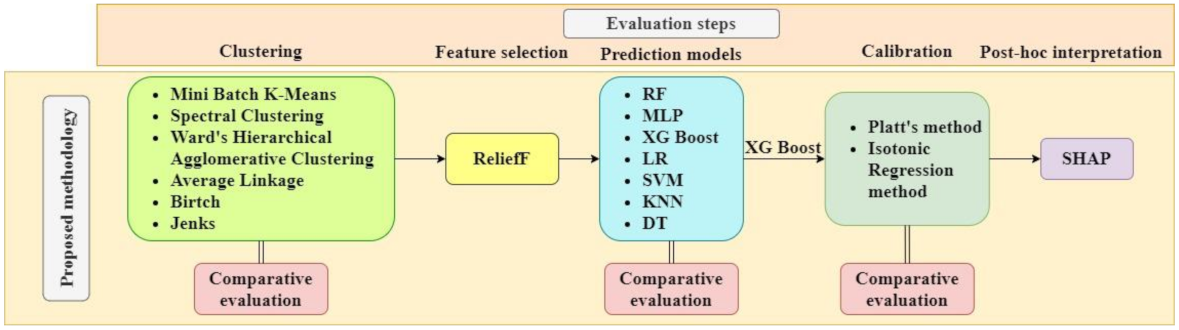
3.3. Clustering Methods

For the clustering process, six popular methods were employed, such as Mini Batch K-Means [32], Spectral Clustering [33], Ward [34,35], Average Linkage [36,37], Balanced Iterative Reducing and Clustering using Hierarchies (Birch) [38,39], and Jenks natural breaks optimization method (Jenks) [40,41,42]. Clustering was performed on the values of the variable mood_change, that represents the change in mood state (Figure 2). Specifically, the mood state score prior to the lockdown (Equation (1)) and during the lockdown (Equation (2)) is calculated by the sum of the variables general_worry, sadness, anxiety, restlessness, anhedonia, loneliness, irritability, concentration, tiredness, and rumination (Table 4). The change in mood state is the difference between their mood state score during the last 2 weeks and 3 months before the first lockdown in Greece (Equation (3)). Hence, a negative value of the predicted variable mood_change indicates an overall improvement of the subject’s mood state score, while a positive value indicates an overall worsening of the subject’s mood state score. Values close to zero show that there was no change in the subject’s mood state score during the lockdown.
3 m _ mood _ state   =   3 m _ general _ worry   +   3 m _ sadness   +   3 m _ anxiety   + 3 m _ restlessness   +   3 m _ anhedonia   +   3 m _ loneliness   +   3 m _ irritability   + 3 m _ concentration   +   3 m _ tiredness   +   3 m _ rumination
2 w _ mood _ state   =   2 w _ general _ worry   +   2 w _ sadness   +   2 w _ anxiety   + 2 w _ restlessness   +   2 w _ anhedonia   +   2 w _ loneliness   +   2 w _ irritability   + 2 w _ concentration   +   2 w _ tiredness   +   2 w _ rumination
mood _ change   =   2 w _ mood _ state     3 m _ mood _ state

3.4. Feature Engineering

The feature selection process was performed by using the ReliefF algorithm, due to its effectiveness in medical diagnosis and medical classification problems [43,44,45,46,47]. ReliefF is an extension of the original Relief which can deal with multiclass problems due to its enhancement with noise resistance [48,49], and therefore it is considered suitable for the current medical multiclass classification problem, as defined in Section 3.3, Figure 2.

3.5. Data Classification

To solve the defined multiclass classification problem, seven popular classifiers (Table 5) are employed and tested: Random Forest (RF), Multi-Layer Perceptron (MLP), Extreme Gradient Boosting (XG Boost), Logistic Regression (LR), Support Vector Machine (SVM), K-Nearest Neighbor (KNN), and Decision Trees (DT). The adopted models are frequently used for medical classification problems while covering various types of prediction models such as tree-based, linear, or neural networks [50,51,52,53,54,55].

3.6. Post Hoc Explainability

In the current study, the Shapley Additive exPlanations (SHAP) is employed to rank the features of the dataset with respect to their impact on the final machine learning outputs. SHAP calculates optimal Shapley values from coalitional game theory. These values show how fairly the impact on a model’s prediction is distributed among the features of the dataset. Then, SHAP develops a mini-explainer model that corresponds to a single-row-prediction pair in order to explain how this prediction was achieved [62].

4. Results

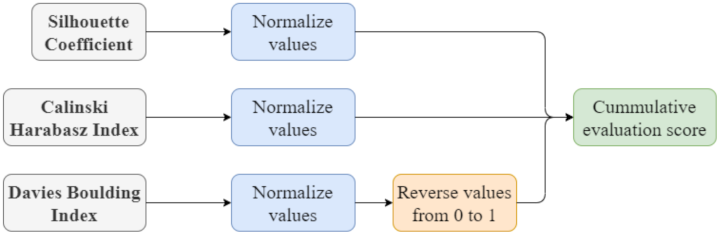
4.1. Evaluation Methodology

The proposed methodology was applied in the context of predicting the change in the mood state of children and youths that are diagnosed with a mental disease, by using the medical data derived from the dataset (Section 3.1). Initially, an evaluation of the best-performed clustering method is performed; then, based on the results of the feature selection method, various prediction models are evaluated to choose the best-performed based on the accuracy metric following a calibration process. For the best-performing calibrated model, a post hoc explainability analysis is performed for a deeper understanding and interpretation of the most contributing features to the model’s output (Figure 3).
The three clustering evaluation criteria that are combined are the Silhouette Coefficient, the Calinski–Harabasz Index, and the Davies–Bouldin Index. Specifically, the normalized scores of the evaluation criteria are summed for calculating a cumulative evaluation score (Figure 4). The default parameter settings from sklearn.cluster module (https://scikit-learn.org/stable/modules/classes.html#module-sklearn.cluster, accessed on 1 August 2021) were used for the clustering methods, while the additional settings are shown in Table 6 Then, the feature selection is performed with ReliefF on the three clusters derived by the prevailing clustering method (Figure 4). For the classification, a repeated stratified 5-fold cross validation with grid search was adopted with SMOTE method [63,64]—oversampling to training dataset for the minority classes. The prediction models were evaluated in subsets of features with increasing dimensionality. The accuracy was chosen as the evaluation criterion for the performance of the prediction models. Table 7 presents the hyperparameters of the classification models for tuning.

4.2. Results

4.2.1. Clustering

Table 8 shows the results from the clustering methods that were employed to group the population among the individuals with positive change to their mood state (Cluster 0), without significant change (Cluster 1) and with negative change (Cluster 2). Table 9 shows the evaluation score achieved by each clustering method.

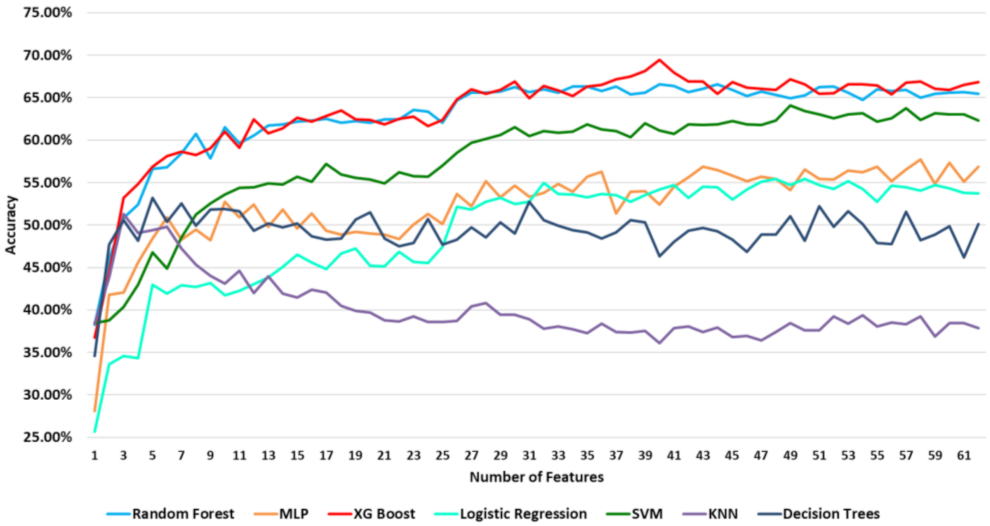
4.2.2. Feature Selection

Table 10 shows the 40 most significant features of our dataset derived from ReliefF, while Figure 5 illustrates the spider plot with the number of features from each category for the first 40 features where the best performance was achieved.

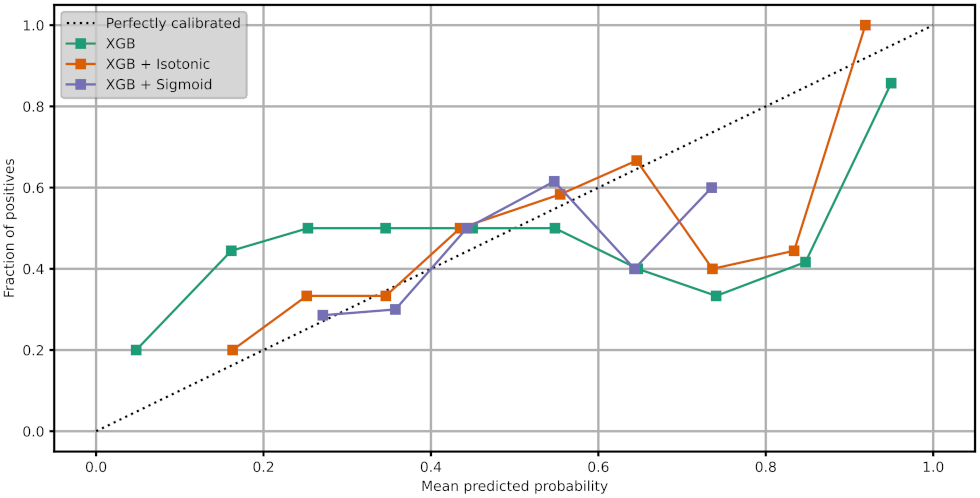
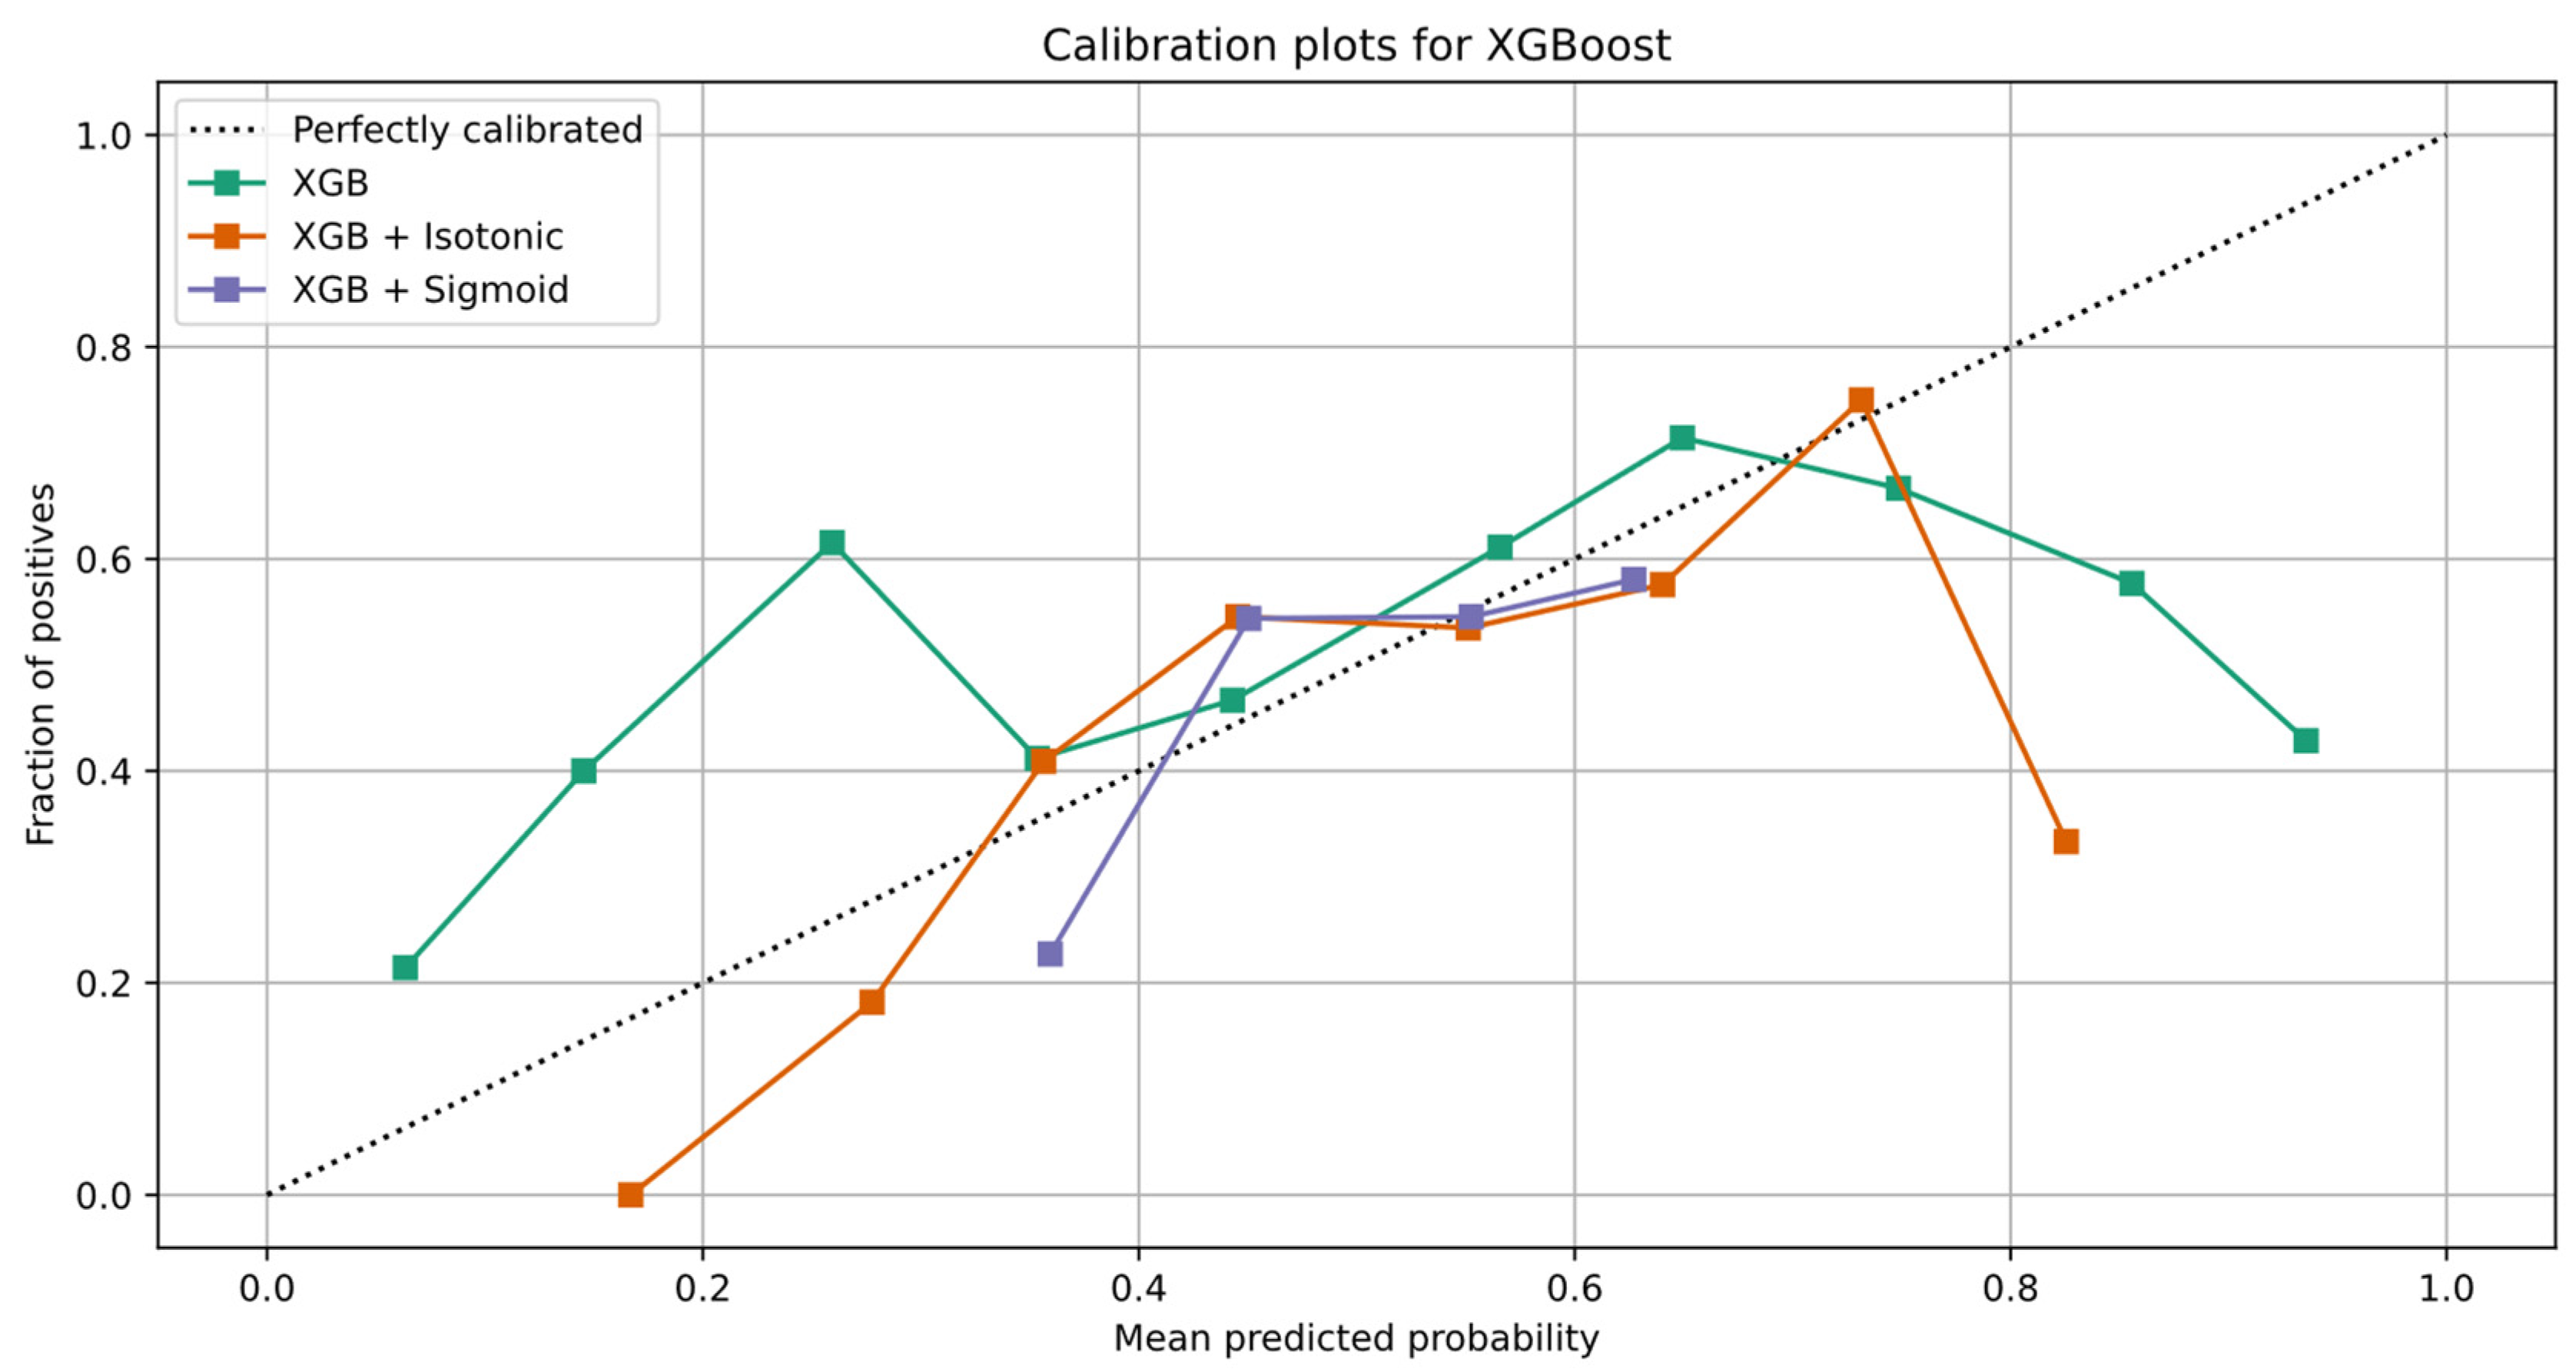
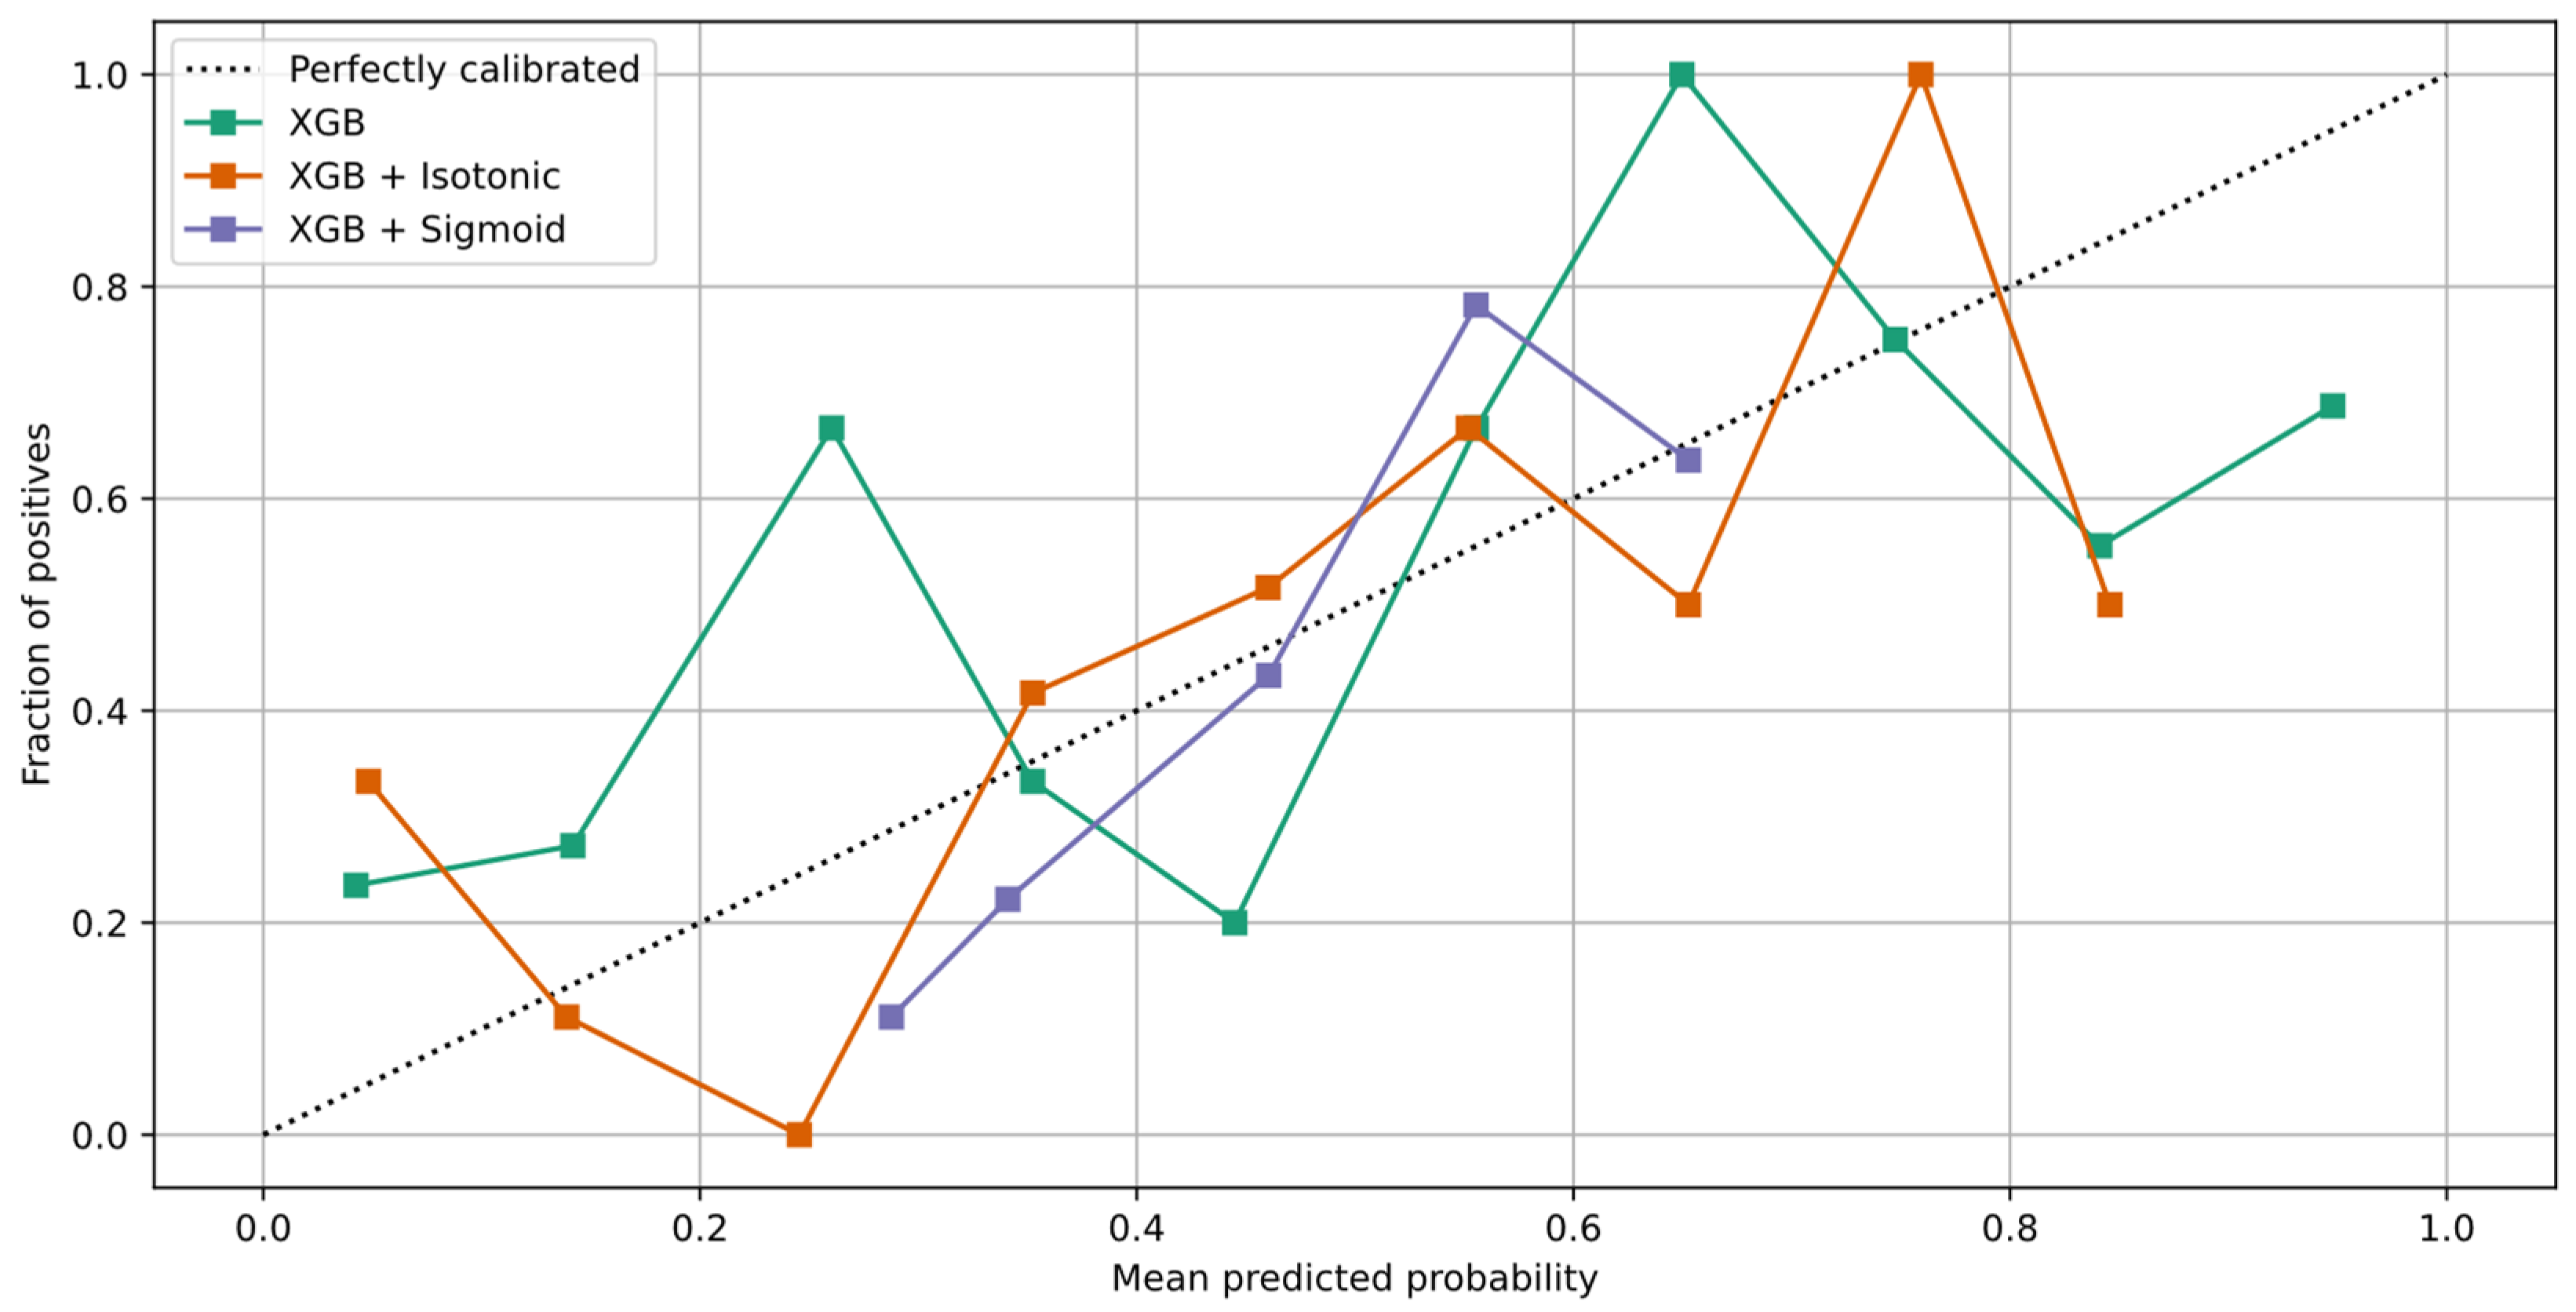
4.2.3. Classification and Calibration

Figure 6 illustrates the accuracy of the comparative prediction models per number of features. Table 11 shows the maximum achieved accuracy of each prediction model used in the experimental evaluation and the number of features where the maximum accuracy was reached.
To increase the performance of the XG Boost model, we perform calibration with Isotonic Regression and Platt’s methods. We use the logistic regression loss (Log-loss) and the accuracy to evaluate the models. Table 12 shows the results after XG Boost classifier calibration with Isotonic Regression and Platt’s methods. Figure 7a,b depicts the change of predicted probabilities on test samples after calibration with Isotonic Regression and Platt’s (sigmoid) methods, respectively. The red, green, and blue colors of an arrow represent the true classes 0, 1, and 2, respectively. Class 0, class 1, and class 2 represent the patients with negative, neutral, and positive change on their mood state, respectively. Figure 8a,b depicts the learned calibration maps. The learned calibration map consists of a grid of possible uncalibrated probabilities over the 2-simplex by computing the corresponding calibrated probabilities and plot arrows for each. The arrows are colored according to the highest uncalibrated probability. Figure 9, Figure 10 and Figure 11 illustrate the calibration plots for each class over the others.

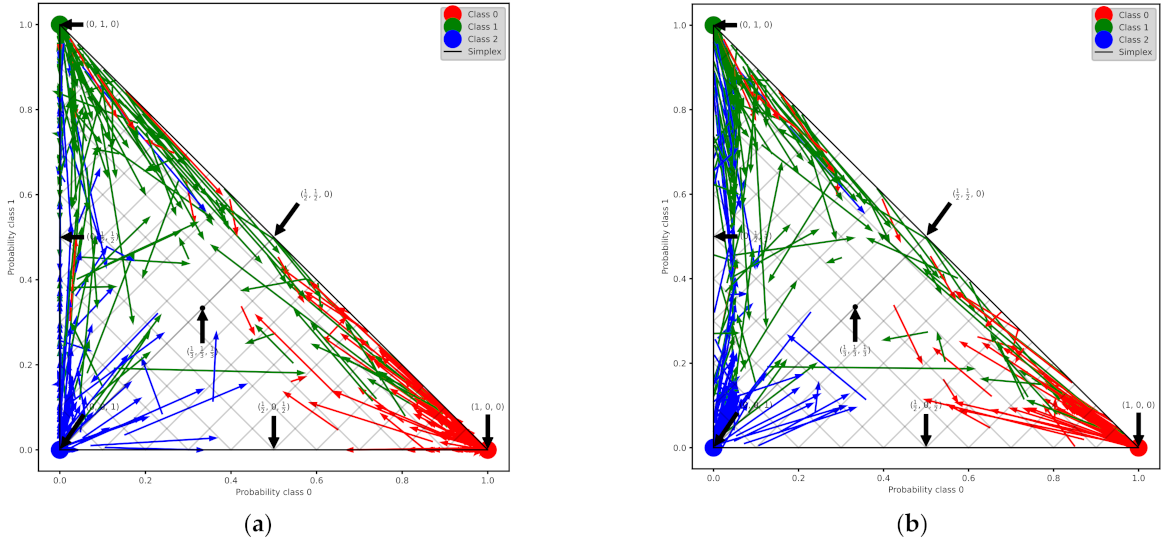
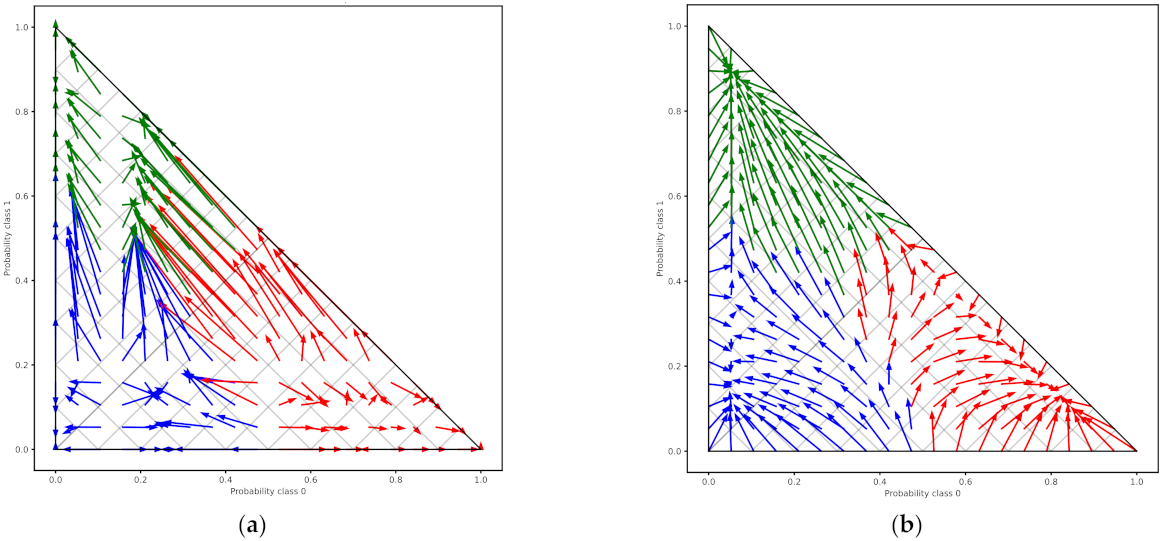
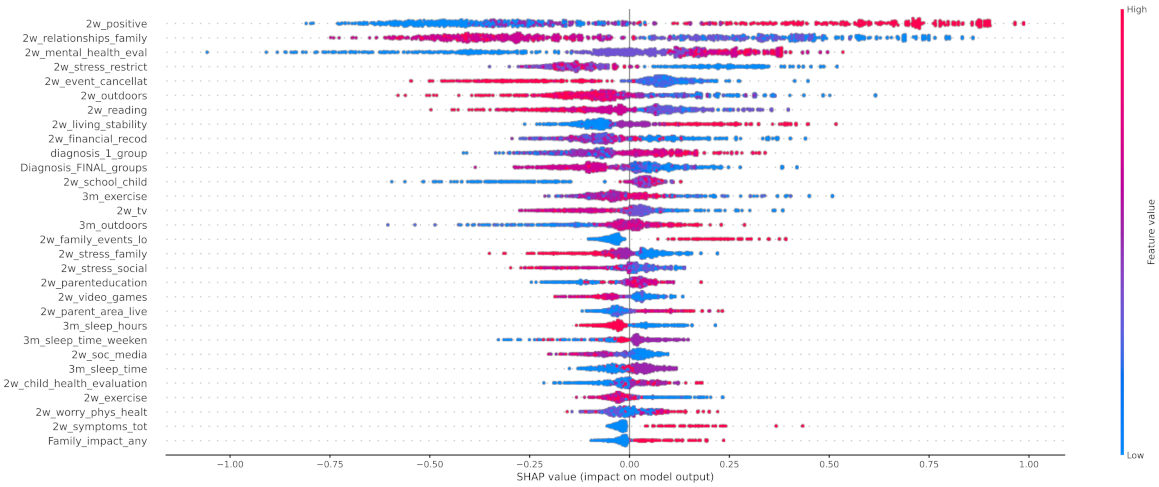
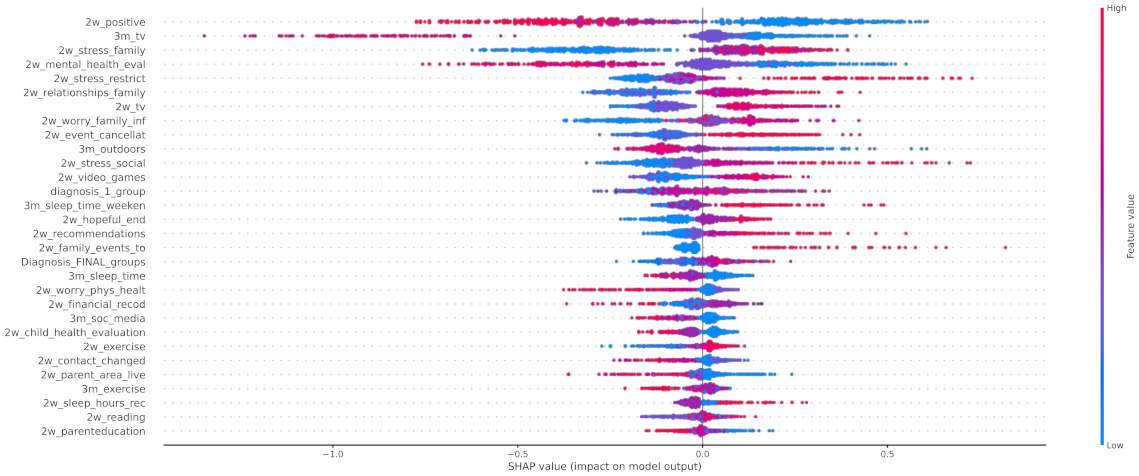
4.2.4. Post-Hoc Explainability

In Figure 12 the x-axis represents the average magnitude change in model output when a feature is excluded from the model. The higher the value, the higher the importance of this feature in the prediction outcome of the model. In Figure 13, Figure 14 and Figure 15, the feature names are presented in y-axis based on their importance from top to bottom, while the x-axis indicates the mean SHAP value showing the change in log-odds. Gradient color (red to blue) indicates the original value of that feature. Each point represents a patient from the original dataset. Figure 16, Figure 17 and Figure 18 show the mean SHAP values of each feature that affects the classification of a patient between two groups.

5. Discussion

5.1. Clustering

The clustering results indicated that the Jenks method is the most suitable to be adopted in our study, reaching the highest evaluation score (Table 9). The clusters derived from the Jenks method indicate that most of the individuals that participated in this study (469 out of 744, 63.04%) did not have any significant alteration to their mood state (Table 8). Also, it is important to mention that the first lockdown in Greece had a negative impact on more individuals (169, 22.71%) than it had positive (106, 14.25%).

5.2. Feature Selection

The results revealed that social life aspects play a significant role in the prediction output (Table 10, Figure 5). Indeed, the spider plot, depicted in Figure 5, reveals that nine features from the social life category appeared in the 40 most significant features. Furthermore, daily activities is the second most important category, with six features in the feature selection subset. Finally, behavioral effects and demographics contribute with five features each. The remaining features belong to the categories of medical diagnosis/rehabilitation, sleeping habits, health concerns, family life, and personal life (Figure 5). The above results clearly indicate that features from all categories are needed to accurately predict the impact of COVID-19 on the mood states of children and adolescents.

5.3. Classification and Calibration

The results in Table 11 showed that the XG Boost model presented a more stable performance compared to the other models, achieving the maximum accuracy (69.47%) at 40 features. A comparable performance (66.60%) was also achieved by Random Forest at 44 features.
The calibration results showed that the calibrated XG Boost with Isotonic Regression achieved lower log-loss but also slightly lower accuracy compared to the calibrated XG Boost with Platt’s method (Table 10). In Figure 7a,b the vertexes of the simplex represent the perfectly predicted classes (e.g., 0, 0, 1). The middle point ( 1 3 , 1 3 , 1 3 ) inside the simplex represents the prediction of the three classes with equal probability ( 1 3 , 1 3 , 1 3 ) . The start of an arrow is at the uncalibrated probabilities, while the head of an arrow shows the calibrated probability. For a lower overconfident model, the arrows point away from the edges where the probabilities of a class are zero. This can be better observed to the calibrated XG Boost with Platt’s method, which produces more accurately predicted probabilities, incurring a lower log-loss.
The learned calibration maps showed that Platt’s method succeeded in calibrating the model better compared to the Isotonic Regression method. Indeed, this can also be observed in Figure 9, Figure 10 and Figure 11 where the calibration plots for each class over the others are illustrated. In all cases, the XG Boost model calibrated with Platt’s (sigmoid) method verges more to the perfectly calibrated line compared to the non-calibrated model or the XG Boost model calibrated with the Isotonic Regression method.

5.4. Post Hoc Explainability

In this study, the predicted variable was set to be the mood_change, i.e., the change in mood state before and during the first lockdown in Greece. The results showed that the change in the child’s mood state was highly associated with the parent’s perception on whether the COVID-19 crisis led to positive changes in their child’s life (2w_positive), their relationships among the family (2w_relationships_family) and the evaluation of their mental health before the COVID-19 crisis (3m_tv), as it is illustrated in Figure 12. In addition, an important contribution was proved to be the increase in the child’s time spent on watching TV or using digital means during the 3 months before and 2 weeks after the lockdown. Therefore, we can observe that there was a negative impact on children who did not use to spend much time watching TV but whose time increased due to lockdown. It is important to mention that the first diagnosis defined by a medical expert played a significant role in the change in the children’s mood state.
Regarding local exploration, Figure 15 shows that the most important features that contribute to classifying an individual to the group with negative change of mood state include the lack of positive changes to their life, the increase in watching tv, the stress derived from the restrictions, and the stress caused to the child by changes in family contacts. Regarding the individuals who had not been affected by the first lockdown imposed in Greece, the following features were found to contribute most to this category: 3m_tv, diagnosis_1_group, 2w_positive, and 2w_sleep_time_week. Based on Figure 14, responses indicate that a neutral attitude towards these features led to the classification of an individual as a child without mood state alteration. For instance, a child’s time spent watching TV was not affected significantly during the lockdown, but a more acceptable sleeping schedule for a child (sleeping time at 20:00–22:00) could lead to a more stable mood state. On the other hand, from the beeswarm in Figure 13, it is shown that more positive changes to their lives due to COVID-19, and better relationships with their family members, can lead to more positive behavior during the lockdown. Family cohesion and continuity in functional routines are protective factors that enhance mental resilience, involving a balance between adversity and availability of support. Protective factors act as a buffer against stress and moderate its impact on emotional well-being, as they enable children to cope with significant life events. Resilient family function provides children a sense of connectedness, healthy family attachments, and stability. Supportive parenting and family warmth facilitate stress exposure, and thus result in positive emotional development [65].
When it comes to the pairwise comparison among the groups, Figure 16 indicates that the main features that contributed to the distinction among the individuals who improved during the first lockdown and those whose mood state was not significantly affected were as follows: 2w_positive, 2w_mental_health_eval, and 2w_relationships_family. The most contributed features among the groups of children that had positive (class 0) or negative (class 2) changes to their mood state were 2w_event_canellat, 2w_positive, 2w_relationships_family, and 2w_mental_health_eval (Figure 17). Finally, the main features that contributed to the classification output among class 1 and class 2 were the 2w_event_canellat, 2w_positive, 2w_relationships_family, and 2w_mental_health_eval (Figure 18).
Overall, we can conclude that if the first lockdown did not lead to positive changes, or negatively impacted the daily activities and family relationships of the child, then a deterioration in the mood state of a child was noticed. On the other hand, if COVID-19 restrictions did not affect the daily life and habits of the child (i.e., time spent watching TV, sleeping schedule), then no significant change to the mood state was noticed. Indeed, the stability on the functional routines constitutes a critical factor for the management of stressful events, such as a pandemic [66]. Finally, if during the first lockdown, children managed to change their life habits in a positive way, improved their relationships with family members, and were not affected by the cancellation of social events, then the change in their mood state was positive. Based on these conclusions, we can generalize that more outgoing and active children that did not use to spend more time at home watching TV prior to the pandemic were the most affected by the lockdown. On the other hand, children whose habits and daily life schedule did not alter significantly were the least affected by the COVID-19 restrictions.
Apart from the features that have been included in the analysis, another perspective that should be considered and could probably explain the significant larger size of class 1 compared to the others (class 0 and 2) is the resilience in children and youth. Based on [67], resilience is defined as the capacity of a dynamic system to adapt successfully to challenges that threaten the function, survival, or development of the system. Various studies in the literature have highlighted the ability of children to adapt and benefit from their strengths and protective factors to succeed, despite biological and environmental influences, such as poverty, illness, violence, disasters, and family dissonance, among others [68,69,70], while few of them have focused on the case of COVID-19 [71]. Protective factors mainly include individual characteristics, environmental support, and family conditions. Indeed, in Figure 12, six factors are directly related to family conditions, such as relationships with family members, parental education, and financial stress, and nine factors are indirectly related to family and parental control, such as sleeping schedule and time dedicated to social media and TV. Moreover, nine factors are related to the ability of the child or youth to adapt to COVID-19 changes, such as changes to school attendance and social contacts, etc., while the remaining factors are linked with environmental supports, such as outdoor activities.

6. Conclusions

In this study, an explainable machine learning pipeline was proposed to identify and interpret the most important features that contributed to the changes in the mood state of children and youths during the first lockdown in Greece. The aim of this study is to identify and understand, through the adopted ML pipeline, the factors that impacted the mental health of the examined population during the first COVID-19-related lockdown. Hence, to identify the changes in the mood state of the individuals under examination, the problem was formulated as a three-class classification problem. The classes included individuals with positive (class 0) and negative (class 2) changes in their mood state and individuals without a significant change in their mood state (class 1). A thorough comparative evaluation was conducted to identify the best-performed clustering method and prediction model for this problem. Jenks method was selected as the clustering method, following by a feature selection performed by ReliefF. The best-performed prediction model, XG Boost, was then used for calibration and a post hoc explainability analysis to justify the main features that contributed to the prediction output of the model. In addition, insights were given about the influence of each feature among the classes.
Overall, we can conclude that the positive changes to a child’s life due to the first lockdown—the relationships among the family members, the time spent watching TV, and parental evaluation of the child’s mental health and the stress caused by COVID-19 restrictions—could play crucial role to the change in the mood state of the child. These results are aligned with the results of relevant studies found on the literature that incorporated pre-pandemic clinical samples or population-based cohorts of children at high risk for transition from subclinical to clinically significant levels of psychopathology [72,73,74]. Moreover, the finding that that most of the children and youths managed to maintain stable mood (63.04%: 469 out of 744) or even have positive mood change (14.25%: 106 out of 744) may be related to the concept of resilience. This is aligned to the psychological approach and perspectives on resilience in children and youth [68,69,70] and specifically on COVID-19 [71]. Specifically, these children seem to maintain their capacity for resilience, even under these difficult restrictive conditions. People may experience conditions of loss or high anxiety, but these may have little effect on their mental health, and positive aspects may even be experienced [75]. In a recent meta-analysis conducted by Prati and Mancini (2021), which also includes studies of children and adolescents, the psychological impact of COVID-19 lockdowns was small in magnitude, highlighting that most people are psychologically resilient to their effects [76]. There can be a positive adjustment of children after an acute life event, and the factors that contribute to it are both intra-individual and contextual factors (e.g., supportive relations) [77], as well as relationships with parents or the school’s ability to respond to the emergency [78]. Also, it seems that stability in functional routines is a key factor in managing stressful events. In accordance with this are the results of Giuntella et al. (2020), who found that disruptions in physical activity, sleep, and screen time among young adults at the onset of the pandemic are more closely linked to depression during the pandemic [79]. The results of the present study may be used to inform policy makers and clinicians in order to be prepared for similar crises or subsequent restriction periods (e.g., guidance for parents attending CAMHS).
The main limitations of this work that should be taken into account are the unexpected end of therapies by some children, and the fact that parents answered the questionnaires on the behalf of their children considering different time periods. Moreover, the large diversity of clinical diagnoses in combination with the small number of children falling into separate specifically defined diagnostic codes imposed the necessity to use broader diagnostic categories, and therefore to not succeed in observing the relation between the impact of COVID-19-related restrictions to children and diagnostic criteria from a specific disorder (e.g., ADHD). Future work includes a within-subject analysis of the data from the longitudinal study of the first and second lockdowns. It remains to be seen whether the second prolonged lockdown (six months) had a greater impact on the clustering of the population.

Author Contributions

Conceptualization, C.N.; methodology, C.N.; software, C.N.; validation, C.N.; formal analysis, C.N., I.R., I.G., A.S. and E.L.; data curation, C.N., D.P., K.M., I.G., K.K., A.S., E.T., A.G., K.L., I.K., N.S. and G.O.; writing—original draft preparation, C.N., D.P., I.R., A.S., E.L. and M.C.-T.; writing—review and editing, C.N., I.R., I.G. and M.C.-T.; visualization, C.N.; supervision, E.L.; project administration, E.L. All authors have read and agreed to the published version of the manuscript.

Funding

This research received no external funding.

Institutional Review Board Statement

Each CAMHS contacted the parents of all children and adolescents who attended the service from 1 March 2019 to 1 March 2020. All parents interested in taking part in the survey were sent an email containing information about the study, along with a unique identification code number and the link to log into Google Forms Survey app. After reading the information about the goals of the study, the process of data collection and confidentiality, and providing informed consent online, they proceeded to answer the questionnaire. The study was approved by the Ethics Committee of each hospital, with which the service is affiliated. The study was performed in line with the principles of the Declaration of Helsinki.

Informed Consent Statement

Informed consent was obtained from all subjects involved in the study.

Data Availability Statement

The gathered data are strictly for use within the research project and are not publicly available for the moment.

Acknowledgments

The authors would like to thank all the respondents to this study who took the time to complete the questionnaire. We would like to thank Argyris Stringaris for his contributions to coordinating sample collection and discussions regarding the clinical aspects of the paper. We would also like to thank the Hellenic COVID-19 imPact survEy (HOPE) Consortium for their contribution during the data collection process: Lagakou E., First Psychiatric Department, Eginition Hospital, National and Kapodistrian University of Athens, Athens, Greece; [email protected]. Mamaki, E., Mental Health Center, General Hospital “G. Hatzikosta”, Ioannina, Greece; [email protected]. Neou, E., Hellenic Centre for Mental Health and Research, Athens, Greece; [email protected]. Polaki, O., Community Mental Health Center for Children and Adolescents in N.Smyrni, Division of Psychiatry, “Asklepieion Voulas’ General Hospital, Attica, Greece; [email protected]. Priftis D., University Mental Health Research Institute; [email protected]. Triantafyllou, G., Second Psychiatric Department, “Attikon” University Hospital, National and Kapodistrian University of Athens, Athens, Greece; [email protected]. Valvi E., Athens Child and Adolescent Mental Health Centre, General Children’s Hospital “Pan. & Aglaia Kyriakou”, Athens, Greece. Vassara, V., Community Mental Health Center for Children and Adolescents, Department of Psychiatry, University Hospital of Ioannina, Ioannina, Greece; [email protected].

Conflicts of Interest

The authors declare no conflict of interest.

References

  1. Chakraborty, I.; Maity, P. COVID-19 outbreak: Migration, effects on society, global environment and prevention. Sci. Total Environ. 2020, 728, 138882. [Google Scholar] [CrossRef] [PubMed]
  2. World Health Organization. World Health Organization Statement on the Second Meeting of the International Health Regulations (2005) Emergency Committee Regarding the Outbreak of Novel Coronavirus (2019-nCoV); World Health Organization: Geneva, Switzerland, 2020. [Google Scholar]
  3. Bonardi, J.-P.; Gallea, Q.; Kalanoski, D.; Lalive, R. Fast and Local: How Did Lockdown Policies Affect the Spread and Severity of COVID-19? Covid Econ 2020, 23, 325–351. [Google Scholar]
  4. Ma, Z.; Idris, S.; Zhang, Y.; Zewen, L.; Wali, A.; Ji, Y.; Pan, Q.; Baloch, Z. The impact of COVID-19 pandemic outbreak on education and mental health of Chinese children aged 7–15 years: An online survey. BMC Pediatr. 2021, 21, 95. [Google Scholar] [CrossRef]
  5. Abas, M.A.; Weobong, B.; Burgess, R.A.; Kienzler, H.; Jack, H.E.; Kidia, K.; Musesengwa, R.; Petersen, I.; Collins, P.Y.; Nakimuli-Mpungu, E. COVID-19 and global mental health. Lancet Psychiatry 2021, 8, 458–459. [Google Scholar] [CrossRef]
  6. Vindegaard, N.; Benros, M.E. COVID-19 pandemic and mental health consequences: Systematic review of the current evidence. Brain Behav. Immun. 2020, 89, 531–542. [Google Scholar] [CrossRef] [PubMed]
  7. Xiong, J.; Lipsitz, O.; Nasri, F.; Lui, L.M.W.; Gill, H.; Phan, L.; Chen-Li, D.; Iacobucci, M.; Ho, R.; Majeed, A.; et al. Impact of COVID-19 pandemic on mental health in the general population: A systematic review. J. Affect. Disord. 2020, 277, 55–64. [Google Scholar] [CrossRef]
  8. Vizheh, M.; Qorbani, M.; Arzaghi, S.M.; Muhidin, S.; Javanmard, Z.; Esmaeili, M. The mental health of healthcare workers in the COVID-19 pandemic: A systematic review. J. Diabetes Metab. Disord. 2020, 19, 1967–1978. [Google Scholar] [CrossRef]
  9. Qin, Z.; Shi, L.; Xue, Y.; Lin, H.; Zhang, J.; Liang, P.; Lu, Z.; Wu, M.; Chen, Y.; Zheng, X.; et al. Prevalence and Risk Factors Associated with Self-reported Psychological Distress Among Children and Adolescents During the COVID-19 Pandemic in China. JAMA Netw. Open 2021, 4, e2035487. [Google Scholar] [CrossRef]
  10. McKune, S.L.; Acosta, D.; Diaz, N.; Brittain, K.; Beaulieu, D.J.; Maurelli, A.T.; Nelson, E.J. Psychosocial health of school-aged children during the initial COVID-19 safer-at-home school mandates in Florida: A cross-sectional study. BMC Public Health 2021, 21, 603. [Google Scholar] [CrossRef]
  11. Ren, H.; Luo, X.; Wang, Y.; Guo, X.; Hou, H.; Zhang, Y.; Yang, P.; Zhu, F.; Hu, C.; Wang, R.; et al. Psychological responses among nurses caring for patients with COVID-19: A comparative study in China. Transl. Psychiatry 2021, 11, 273. [Google Scholar] [CrossRef]
  12. Zhou, S.-J.; Zhang, L.-G.; Wang, L.-L.; Guo, Z.-C.; Wang, J.-Q.; Chen, J.-C.; Liu, M.; Chen, X.; Chen, J.-X. Prevalence and socio-demographic correlates of psychological health problems in Chinese adolescents during the outbreak of COVID-19. Eur. Child Adolesc. Psychiatry 2020, 29, 749–758. [Google Scholar] [CrossRef]
  13. Tamarit, A.; de la Barrera, U.; Mónaco, E.; Schoeps, K.; Montoya-Castilla, I. Psychological Impact of COVID-19 Pandemic in Spanish Adolescents: Risk and Protective Factors of Emotional Symptoms. Rev. Psicol. Clin. Con Ninos Y Adolesc. 2020, 7, 73–80. [Google Scholar] [CrossRef]
  14. Chen, X.; Qi, H.; Liu, R.; Feng, Y.; Li, W.; Xiang, M.; Cheung, T.; Jackson, T.; Wang, G.; Xiang, Y.-T. Depression, anxiety and associated factors among Chinese adolescents during the COVID-19 outbreak: A comparison of two cross-sectional studies. Transl. Psychiatry 2021, 11, 148. [Google Scholar] [CrossRef]
  15. Tavolacci, M.; Wouters, E.; Van de Velde, S.; Buffel, V.; Déchelotte, P.; Van Hal, G.; Ladner, J. The Impact of COVID-19 Lockdown on Health Behaviors among Students of a French University. Int. J. Environ. Res. Public Health 2021, 18, 4346. [Google Scholar] [CrossRef]
  16. Fu, W.; Yan, S.; Zong, Q.; Anderson-Luxford, D.; Song, X.; Lv, Z.; Lv, C. Mental health of college students during the COVID-19 epidemic in China. J. Affect. Disord. 2020, 280, 7–10. [Google Scholar] [CrossRef]
  17. Xiao, H.; Shu, W.; Li, M.; Li, Z.; Tao, F.; Wu, X.; Yu, Y.; Meng, H.; Vermund, S.H.; Hu, Y. Social Distancing among Medical Students during the 2019 Coronavirus Disease Pandemic in China: Disease Awareness, Anxiety Disorder, Depression, and Behavioral Activities. Int. J. Environ. Res. Public Health 2020, 17, 5047. [Google Scholar] [CrossRef] [PubMed]
  18. Wathelet, M.; Duhem, S.; Vaiva, G.; Baubet, T.; Habran, E.; Veerapa, E.; Debien, C.; Molenda, S.; Horn, M.; Grandgenèvre, P.; et al. Factors associated with mental health disorders among College students in France confined during the COVID-19 pandemic. JAMA Netw. Open 2020, 3, e2025591. [Google Scholar] [CrossRef]
  19. Ren, Z.; Xin, Y.; Ge, J.; Zhao, Z.; Liu, D.; Ho, R.C.M.; Ho, C.S.H. Psychological Impact of COVID-19 on College Students After School Reopening: A Cross-Sectional Study Based on Machine Learning. Front. Psychol. 2021, 12, 641806. [Google Scholar] [CrossRef] [PubMed]
  20. Cost, K.T.; Crosbie, J.; Anagnostou, E.; Birken, C.S.; Charach, A.; Monga, S.; Kelley, E.; Nicolson, R.; Maguire, J.L.; Burton, C.L.; et al. Mostly worse, occasionally better: Impact of COVID-19 pandemic on the mental health of Canadian children and adolescents. Eur. Child Adolesc. Psychiatry 2021, 6, 1–14. [Google Scholar] [CrossRef] [PubMed]
  21. Zhou, S.-J.; Wang, L.-L.; Yang, R.; Yang, X.-J.; Zhang, L.-G.; Guo, Z.-C.; Chen, J.-C.; Wang, J.-Q.; Chen, J.-X. Sleep problems among Chinese adolescents and young adults during the coronavirus-2019 pandemic. Sleep Med. 2020, 74, 39–47. [Google Scholar] [CrossRef]
  22. Islam, A.; Barna, S.D.; Raihan, H.; Alam Khan, N.; Hossain, T. Depression and anxiety among university students during the COVID-19 pandemic in Bangladesh: A web-based cross-sectional survey. PLoS ONE 2020, 15, e0238162. [Google Scholar] [CrossRef]
  23. Yeasmin, S.; Banik, R.; Hossain, S.; Hossain, M.N.; Mahumud, R.; Salma, N.; Hossain, M.M. Impact of COVID-19 pandemic on the mental health of children in Bangladesh: A cross-sectional study. Child. Youth Serv. Rev. 2020, 117, 105277. [Google Scholar] [CrossRef] [PubMed]
  24. De Avila, M.A.G.; Filho, P.T.H.; Jacob, F.; Alcantara, L.R.S.; Berghammer, M.; Nolbris, M.J.; Olaya-Contreras, P.; Nilsson, S. Children’s Anxiety and Factors Related to the COVID-19 Pandemic: An Exploratory Study Using the Children’s Anxiety Questionnaire and the Numerical Rating Scale. Int. J. Environ. Res. Public Health 2020, 17, 5757. [Google Scholar] [CrossRef]
  25. Liang, L.; Ren, H.; Cao, R.; Hu, Y.; Qin, Z.; Li, C.; Mei, S. The Effect of COVID-19 on Youth Mental Health. Psychiatr. Q. 2020, 91, 841–852. [Google Scholar] [CrossRef] [PubMed]
  26. Ma, Z.; Zhao, J.; Li, Y.; Chen, D.; Wang, T.; Zhang, Z.; Chen, Z.; Yu, Q.; Jiang, J.; Fan, F.; et al. Mental health problems and correlates among 746 217 college students during the coronavirus disease 2019 outbreak in China. Epidemiol. Psychiatr. Sci. 2020, 29, e181. [Google Scholar] [CrossRef] [PubMed]
  27. Sciberras, E.; Patel, P.; Stokes, M.A.; Coghill, D.; Middeldorp, C.M.; Bellgrove, M.A.; Becker, S.P.; Efron, D.; Stringaris, A.; Faraone, S.V.; et al. Physical Health, Media Use, and Mental Health in Children and Adolescents With ADHD during the COVID-19 Pandemic in Australia. J. Atten. Disord. 2020, 1087054720978549. [Google Scholar] [CrossRef] [PubMed]
  28. Ge, F.; Zhang, D.; Wu, L.; Mu, H. Predicting Psychological State Among Chinese Undergraduate Students in the COVID-19 Epidemic: A Longitudinal Study Using a Machine Learning. Neuropsychiatr. Dis. Treat. 2020, 16, 2111–2118. [Google Scholar] [CrossRef] [PubMed]
  29. Prout, T.A.; Zilcha-Mano, S.; Doorn, K.A.-V.; Békés, V.; Christman-Cohen, I.; Whistler, K.; Kui, T.; Di Giuseppe, M. Identifying Predictors of Psychological Distress During COVID-19: A Machine Learning Approach. Front. Psychol. 2020, 11, 586202. [Google Scholar] [CrossRef] [PubMed]
  30. Rens, E.; Smith, P.; Nicaise, P.; Lorant, V.; Broeck, K.V.D. Mental Distress and Its Contributing Factors Among Young People During the First Wave of COVID-19: A Belgian Survey Study. Front. Psychiatry 2021, 12, 575553. [Google Scholar] [CrossRef] [PubMed]
  31. Blakemore, S.-J.; Mills, K.L. Is Adolescence a Sensitive Period for Sociocultural Processing? Annu. Rev. Psychol. 2014, 65, 187–207. [Google Scholar] [CrossRef]
  32. Peng, K.; Leung, V.C.M.; Huang, Q. Clustering Approach Based on Mini Batch Kmeans for Intrusion Detection System Over Big Data. IEEE Access 2018, 6, 11897–11906. [Google Scholar] [CrossRef]
  33. Von Luxburg, U. A tutorial on spectral clustering. Stat. Comput. 2007, 17, 395–416. [Google Scholar] [CrossRef]
  34. Ward, J.H., Jr. Hierarchical Grouping to Optimize an Objective Function. J. Am. Stat. Assoc. 1963, 58, 236–244. [Google Scholar] [CrossRef]
  35. Murtagh, F.; Legendre, P. Ward’s Hierarchical Agglomerative Clustering Method: Which Algorithms Implement Ward’s Criterion? J. Classif. 2014, 31, 274–295. [Google Scholar] [CrossRef] [Green Version]
  36. Sokal, R.R.; Michener, C.D. A Statistical Method of Evaluating Systematic Relationships. Univ. Kans. Sci. Bull. 1958, 38, 1409–1438. [Google Scholar]
  37. Yim, O.; Ramdeen, K.T. Hierarchical Cluster Analysis: Comparison of Three Linkage Measures and Application to Psychological Data. Quant. Methods Psychol. 2015, 11, 8–21. [Google Scholar] [CrossRef]
  38. Zhang, T.; Ramakrishnan, R.; Livny, M. BIRCH: An efficient data clustering method for very large databases. ACM SIGMOD Rec. 1996, 25, 103–114. [Google Scholar] [CrossRef]
  39. Zhang, T.; Ramakrishnan, R.; Livny, M. BIRCH: A New Data Clustering Algorithm and Its Applications. Data Min. Knowl. Discov. 1997, 1, 141–182. [Google Scholar] [CrossRef]
  40. Anchang, J.; Ananga, E.O.; Pu, R. An efficient unsupervised index based approach for mapping urban vegetation from IKONOS imagery. Int. J. Appl. Earth Obs. Geoinf. 2016, 50, 211–220. [Google Scholar] [CrossRef]
  41. North, M.A. A Method for Implementing a Statistically Significant Number of Data Classes in the Jenks Algorithm. In Proceedings of the 2009 Sixth International Conference on Fuzzy Systems and Knowledge Discovery, Tianjin, China, 14–16 August 2009; Volume 1, pp. 35–38. [Google Scholar]
  42. Zhang, L.; Zhang, X.; Yuan, S.; Wang, K. Economic, Social, and Ecological Impact Evaluation of Traffic Network in Beijing–Tianjin–Hebei Urban Agglomeration Based on the Entropy Weight TOPSIS Method. Sustainability 2021, 13, 1862. [Google Scholar] [CrossRef]
  43. Robnik-Šikonja, M.; Kononenko, I. Theoretical and Empirical Analysis of ReliefF and RReliefF. Mach. Learn. 2003, 53, 23–69. [Google Scholar] [CrossRef] [Green Version]
  44. Spolaôr, N.; Cherman, E.A.; Monard, M.C.; Lee, H.D. ReliefF for Multi-Label Feature Selection. In Proceedings of the 2013 Brazilian Conference on Intelligent Systems, Fortaleza, Brazil, 19–24 October 2013; pp. 6–11. [Google Scholar]
  45. Alelyani, S. Stable bagging feature selection on medical data. J. Big Data 2021, 8, 11. [Google Scholar] [CrossRef]
  46. Huang, Y.; McCullagh, P.J.; Black, N.D. An optimization of ReliefF for classification in large datasets. Data Knowl. Eng. 2009, 68, 1348–1356. [Google Scholar] [CrossRef]
  47. Kilicarslan, S.; Adem, K.; Celik, M. Diagnosis and classification of cancer using hybrid model based on ReliefF and convolutional neural network. Med. Hypotheses 2020, 137, 109577. [Google Scholar] [CrossRef]
  48. Kononenko, I. Estimating Attributes: Analysis and Extensions of RELIEF. In Lecture Notes in Computer Science; Springer: Berlin/Heidelberg, Germany, 1994; Volume 784, pp. 171–182. [Google Scholar]
  49. Kononenko, I.; Robnik-Sikonja, M.; Robnik, M.; Pompe, U. ReliefF for Estimation and Discretization of Attributes in Classification, Regression, and ILP Problems. Artif. Intell. Methodol. Syst. Appl. 1996, 31–40. [Google Scholar]
  50. Ntakolia, C.; Kokkotis, C.; Moustakidis, S.; Tsaopoulos, D. Prediction of Joint Space Narrowing Progression in Knee Osteoarthritis Patients. Diagnostics 2021, 11, 285. [Google Scholar] [CrossRef]
  51. Ntakolia, C.; Kokkotis, C.; Moustakidis, S.; Tsaopoulos, D. A Machine Learning Pipeline for Predicting Joint Space Narrowing in Knee Osteoarthritis Patients. In Proceedings of the 2020 IEEE 20th International Conference on Bioinformatics and Bioengineering (BIBE), Cincinnati, OH, USA, 26–28 October 2020; pp. 934–941. [Google Scholar]
  52. Liu, M.; Xu, X.; Tao, Y.; Wang, X. An Improved Random Forest Method Based on RELIEFF for Medical Diagnosis. In Proceedings of the 2017 IEEE International Conference on Computational Science and Engineering (CSE) and IEEE International Conference on Embedded and Ubiquitous Computing (EUC), Guangzhou, China, 21–24 July 2017; Volume 1, pp. 44–49. [Google Scholar]
  53. Jamshidi, A.; Pelletier, J.-P.; Martel-Pelletier, J. Machine-learning-based patient-specific prediction models for knee osteoarthritis. Nat. Rev. Rheumatol. 2018, 15, 49–60. [Google Scholar] [CrossRef]
  54. Harimoorthy, K.; Thangavelu, M. Multi-disease prediction model using improved SVM-radial bias technique in healthcare monitoring system. J. Ambient. Intell. Humaniz. Comput. 2020, 12, 3715–3723. [Google Scholar] [CrossRef]
  55. Ntakolia, C.; Kokkotis, C.; Moustakidis, S.; Tsaopoulos, D. Identification of most important features based on a fuzzy ensemble technique: Evaluation on joint space narrowing progression in knee osteoarthritis patients. Int. J. Med. Inform. 2021, 156, 104614. [Google Scholar] [CrossRef]
  56. Shaik, A.B.; Srinivasan, S. A Brief Survey on Random Forest Ensembles in Classification Model. In Proceedings of the International Conference on Innovative Computing and Communications, Technical University of Ostrava, Ostrava, Czech Republic, 21–22 March 2019; Bhattacharyya, S., Hassanien, A.E., Gupta, D., Khanna, A., Pan, I., Eds.; Springer: Singapore, 2019; pp. 253–260. [Google Scholar]
  57. Ogunleye, A.A.; Wang, Q.-G. XGBoost Model for Chronic Kidney Disease Diagnosis. IEEE/ACM Trans. Comput. Biol. Bioinform. 2019, 17, 2131–2140. [Google Scholar] [CrossRef]
  58. Dreiseitl, S.; Ohno-Machado, L. Logistic regression and artificial neural network classification models: A methodology review. J. Biomed. Inform. 2002, 35, 352–359. [Google Scholar] [CrossRef] [Green Version]
  59. Li, H.; Chung, F.-L.; Wang, S. A SVM based classification method for homogeneous data. Appl. Soft Comput. 2015, 36, 228–235. [Google Scholar] [CrossRef]
  60. Mucherino, A.; Papajorgji, P.J.; Pardalos, P.M. K-Nearest Neighbor Classification. In Data Mining in Agriculture; Mucherino, A., Papajorgji, P.J., Pardalos, P.M., Eds.; Springer Optimization and Its Applications; Springer: New York, NY, USA, 2009; pp. 83–106. ISBN 978-0-387-88615-2. [Google Scholar]
  61. Kotsiantis, S.B. Decision trees: A recent overview. Artif. Intell. Rev. 2011, 39, 261–283. [Google Scholar] [CrossRef]
  62. Lundberg, S.M.; Lee, S.-I. A Unified Approach to Interpreting Model Predictions. In Proceedings of the Advances in Neural Information Processing Systems, Long Beach, CA, USA, 4–9 December 2017; Curran Associates, Inc.: New York, NY, USA, 2017; Volume 30. [Google Scholar]
  63. SMOTE|Overcoming Class Imbalance Problem Using SMOTE. Available online: https://www.analyticsvidhya.com/blog/2020/10/overcoming-class-imbalance-using-smote-techniques/ (accessed on 16 August 2021).
  64. Douzas, G.; Bacao, F.; Last, F. Improving imbalanced learning through a heuristic oversampling method based on k-means and SMOTE. Inf. Sci. 2018, 465, 1–20. [Google Scholar] [CrossRef] [Green Version]
  65. Hornor, G. Resilience. J. Pediatr. Health Care 2017, 31, 384–390. [Google Scholar] [CrossRef] [PubMed] [Green Version]
  66. Koome, F.; Hocking, C.; Sutton, D. Why Routines Matter: The Nature and Meaning of Family Routines in the Context of Adolescent Mental Illness. J. Occup. Sci. 2012, 19, 312–325. [Google Scholar] [CrossRef]
  67. Masten, A.S. Resilience Theory and Research on Children and Families: Past, Present, and Promise. J. Fam. Theory Rev. 2018, 10, 12–31. [Google Scholar] [CrossRef] [Green Version]
  68. Zolkoski, S.M.; Bullock, L.M. Resilience in children and youth: A review. Child. Youth Serv. Rev. 2012, 34, 2295–2303. [Google Scholar] [CrossRef]
  69. Masten, A.S. Global Perspectives on Resilience in Children and Youth. Child Dev. 2013, 85, 6–20. [Google Scholar] [CrossRef]
  70. Masten, A.S.; Barnes, A.J. Resilience in Children: Developmental Perspectives. Children 2018, 5, 98. [Google Scholar] [CrossRef] [Green Version]
  71. Masten, A.S.; Motti-Stefanidi, F. Multisystem Resilience for Children and Youth in Disaster: Reflections in the Context of COVID-19. Advers. Resil. Sci. 2020, 1, 95–106. [Google Scholar] [CrossRef] [PubMed]
  72. Bouter, D.; Zarchev, M.; de Neve-Enthoven, N.; Ravensbergen, S.; Kamperman, A.M.; Hoogendijk, W.; Grootendorst, N. A Longitudinal Study of Mental Health in Adolescents before and during the COVID-19 Pandemi 2021. PsyArXiv 2021. [Google Scholar] [CrossRef]
  73. Lopez-Serrano, J.; Díaz-Bóveda, R.; González-Vallespí, L.; Santamarina-Pérez, P.; Bretones-Rodríguez, A.; Calvo, R.; Lera-Miguel, S. Psychological impact during COVID-19 lockdown in children and adolescents with previous mental health disorders. Rev. Psiquiatr. Y Salud Ment. 2021. [Google Scholar] [CrossRef]
  74. Penner, F.; Ortiz, J.H.; Sharp, C. Change in Youth Mental Health During the COVID-19 Pandemic in a Majority Hispanic/Latinx US Sample. J. Am. Acad. Child Adolesc. Psychiatry 2020, 60, 513–523. [Google Scholar] [CrossRef]
  75. Bonanno, G.A. Loss, Trauma, and Human Resilience: Have We Underestimated the Human Capacity to Thrive After Extremely Aversive Events? Am. Psychol. 2004, 59, 20–28. [Google Scholar] [CrossRef] [PubMed] [Green Version]
  76. Prati, G.; Mancini, A.D. The psychological impact of COVID-19 pandemic lockdowns: A review and meta-analysis of longitudinal studies and natural experiments. Psychol. Med. 2021, 51, 201–211. [Google Scholar] [CrossRef] [PubMed]
  77. Bonanno, G.A.; Diminich, E. Annual Research Review: Positive adjustment to adversity-trajectories of minimal-impact resilience and emergent resilience. J. Child Psychol. Psychiatry 2012, 54, 378–401. [Google Scholar] [CrossRef] [PubMed] [Green Version]
  78. Masten, A.S. Resilience of children in disasters: A multisystem perspective. Int. J. Psychol. 2020, 56, 1–11. [Google Scholar] [CrossRef]
  79. Giuntella, O.; Hyde, K.; Saccardo, S.; Sadoff, S. Lifestyle and mental health disruptions during COVID-19. Proc. Natl. Acad. Sci. USA 2021, 118, e2016632118. [Google Scholar] [CrossRef]
Figure 1. Machine learning pipeline adopted in this study.
Healthcare 10 00149 g001
Figure 2. Clustering process.
Healthcare 10 00149 g002
Figure 3. Evaluation methodology.
Healthcare 10 00149 g003
Figure 4. Evaluation process of clustering methods.
Healthcare 10 00149 g004
Figure 5. Spider plot of the number of features that belong to each feature category for the first 40 features where the best performance was achieved.
Healthcare 10 00149 g005
Figure 6. Classification results.
Healthcare 10 00149 g006
Figure 7. Change of predicted probabilities on test samples after calibration with: (a) Isotonic Regression method; (b) Platt’s (sigmoid) method.
Healthcare 10 00149 g007
Figure 8. Learned calibration map with: (a) Isotonic Regression method; (b) Platt’s (sigmoid) method.
Healthcare 10 00149 g008
Figure 9. Calibration plot of XG Boost classifier for class 0.
Healthcare 10 00149 g009
Figure 10. Calibration plot of XG Boost classifier for class 1.
Healthcare 10 00149 g010
Figure 11. Calibration plot of XG Boost classifier for class 2.
Healthcare 10 00149 g011
Figure 12. Mean SHAP values.
Healthcare 10 00149 g012
Figure 13. SHAP values of patients from class 0.
Healthcare 10 00149 g013
Figure 14. SHAP values of patients from class 1.
Healthcare 10 00149 g014
Figure 15. SHAP values of patients from class 2.
Healthcare 10 00149 g015
Figure 16. Mean SHAP values of patients from class 0 and class 1.
Healthcare 10 00149 g016
Figure 17. Mean SHAP values of patients from class 0 and class 2.
Healthcare 10 00149 g017
Figure 18. SHAP values patients from class 1 and class 2.
Healthcare 10 00149 g018
Table 1. Lockdown policies implemented worldwide adapted from [3].
Type of MeasuresMeasuresExplanation
International MeasuresCurfewThe effective date when a country announced a restriction on the movement of individuals within a given time of the day
State of emergencyThe effective date when a country announced a state of emergency
Within-country regional lockdownThe effective date when a region within a country announced a total lockdown
Partial selective lockdownThe earliest effective date for the partial restriction of the movement of people, i.e. school closures or limitations regarding the number of gathered people allowed
External measuresSelective international border closuresThe earliest effective date when a country decided to close its borders with a region or country that has been significantly affected by COVID-19
Selective border closuresThe earliest effective date following the selective international border closure, when a country closed its border to individuals from one or multiple other countries that have been significantly affected by COVID-19
International lockdownThe effective date when a country banned all flights, rail, and automotive movements internationally
Table 2. Summarization of studies related to the first COVID-19 outbreak, including children and young adults.
StudyCountryPopulationTargetMethod
[2]China8079 Chinese students aged 12–18To identify correlations between sociodemographic features and mental health problems in Chinese adolescents during the outbreak of COVID-19Multivariable logistic regression analysis
[4]China668 Chinese children aged 7–15 To identify the main factors that contribute to the education and the mental health of Chinese children during COVID-19Multiple logistic regression analysis
[25]China584 youthsTo study the effects of COVID-19 on youth mental healthUnivariate analysis and univariate logistic regression
[14]ChinaTwo cross-sectional studies of 9554 and 3886 participantsTo evaluate the factors that contribute to depression and anxiety among Chinese adolescents during COVID-19Multivariable logistic regression analyses
[19]China1,199,320 school-aged children and adolescentsTo assess the prevalence and the risk factors associated with self-reported psychological distressMultivariate logistic regression
[21]China11,835 Chinese adolescents and young adults (12–29 years)To identify sleeping problems during COVID-19Binomial logistic regression analysis
[28]China2009 Chinese undergraduate studentsTo predict anxiety and insomnia during COVID-19XGBoost model
[26]China746,217 Chinese university studentsTo examine variables associated with mental health problems during COVID-19Univariate and hierarchical logistic regression analyses
[16]China89,588 Chinese university studentsTo identify the risk factors for anxiety symptoms during COVID-19Multivariate logistic regression models
[17]China933 medical studentsTo evaluate the impact of COVID-19 on anxietyMultivariate logistic regression
[18]France69,054 French university studentsTo study mental health issues due to COVID-19Multivariate logistic regression
[15]France3671 participantsTo identify the risk factors for depression during the COVID-19 pandemicMultivariate logistic regression
[22]Bangladesh476 university studentsTo identify the risk factors for depression due to COVID-19Binary logistic regression
[23]Bangladesh384 parents with at least one child aged 5–15To identify mental health disturbances during COVID-19Binary logistic regression
[20]Canada1013 children and adolescents aged 6–18, with or without pre-existing diagnosesTo evaluate the effects on mental health during COVID-19Multinomial logistic regression
[24]Brazil157 girls and 132 boys aged 6–12To examine the prevalence of anxiety during COVID-19Logistic regression
[13]Spain523 adolescents (13–17 years)To examine the association between sociodemographic factors and COVID-19-related variables and their effect on depression, anxiety, and stressMultivariable logistic regression
[27]Australia Parents of 213 children and adolescents aged 5–17 who have been diagnosed with ADHDTo identify the impact of COVID-19 restrictionsAdjusted logistic regression analyses
[19]China478 college students after school reopeningTo examine the psychological impact of COVID-19Multivariate logistic regression
[30]Belgium2008 young people aged 16–25To examine mental distress and its contributing factorsBivariate and multivariable logistic regression analyses
[29]Cross-sectional study2787 participants aged 18–85To identify predictors of psychological distress during COVID-19Random forest machine learning algorithm and regression trees
[10]Florida, USA280 school-aged childrenTo examine mental health during COVID-19Bivariate analysis and logistic and multinomial logistic regression models
Table 3. Sociodemographic characteristics of the dataset.
Sociodemographic CharacteristicsPopulation (%)
Age, Mean ± Standard Deviation10.7 ± 4.1
Sex
Male
Female
Not willing to answer

466 (62.63%)
273 (36.7%)
5 (0.67%)
Participant parent
Mother Father
Other (grandparents, uncle/aunt, foster parents, other)

588 (79.7%)
142 (19.2%)
8 (1.1%)
Parent’s ethnicity
Greek
Other
725 (98.2%)
13 (1.8%)
Health insurance type
National/Military
Private
Other
None

650 (87.7%)
63 (8.7%)
9 (1.3%)
16 (2.3%)
Residential area
City
Suburbs of a city
Town/village
Rural area
Island

382 (51.8%)
200 (27.1%)
131 (17.7%)
10 (1.4%)
15 (2.0%)
Reporting parent’s educational level
Compulsory 9 years’ education
Senior high school
Institute of Vocational Training
Technical College or University degree
Postgraduate degree (M.Sc./PhD)

26 (3.5%)
146 (19.8%)
118 (16.0%)
280 (37.9%)
168 (22.8%)
Second parent’s educational level
Compulsory 9 years’ education
Senior high school
Institute of Vocational Training
Technical College or University degree
Postgraduate degree (M.Sc., PhD)

80 (10.8%)
221 (29.9%)
105 (14.3%)
211 (28.6%)
121 (16.4%)
Essential worker (yes): healthcare, delivery worker, store worker, security, building maintenance321 (43.5%)
Worker in a facility treating COVID-19 (yes)105 (14.2%)
Job loss during the pandemic (yes)38 (5.1%)
Limited ability to earn money (yes)81 (10.9%)
Table 4. Dataset description.
CategoryFeaturesDescription
Demographicsage_groupAge group of child
gender_childGender of child
parent_area_liveArea of residence
gender_parentGender of the parent or guardian
parenteducationEducation level of parent or guardian
school_childSchool enrolment and attendance
2w_essential_workerWhether any adults living with the child are essential workers (health care, delivery services, pharmacies, law enforcement and security, store worker, cleaning services, other)
Social life3m_outdoorsDays per week the child spent outside the house (parks, outdoor spaces) in 3 months and the past 2 weeks, respectively
2w_outdoors
2w_time_outsideAmount of time per week the child spent/dedicated out of the house (e.g., shopping, parks, etc.)
2w_event_cancellatHow difficult the cancellation of important events in the child’s life (graduation, vacation, Easter recess) was for him/her
2w_recommendationsDifficulty following recommendations regarding social distancing
2w_contact_changedChange in the child’s contact with people outside home relatives compared to before the coronavirus/COVID-19 crisis
2w_relationships_friendsChange in the quality of the child’s relationships with his/her friends
3m_soc_mediaTime spent using social media (e.g Facetime, Facebook, Instagram, Snapchat, Twitter, Tiktok) for 3 months and the past 2 weeks, respectively
2w_soc_media
Personal life2w_positivePositive changes in the child’s life due to the coronavirus/COVID-19 crisis
Family lifeFamily_impact_anyIf any event that affected the family occurred due to COVID-19
2w_financial_recodFinancial problems faced by the family due to the coronavirus/COVID-19 crisis
2w_relationships_familyChanges in the quality of relationships between the child and members of his/her family
2w_family_events_lost_jobWhether either of the following have happened to the child’s family members because of coronavirus/COVID-19: loss of job, loss of earnings
2w_family_events_loss_earnings
Daily activities3m_exercise Days per week the child engaged in exercise (e.g., increased heart rate, breathing) for at least 30 min, for 3 months and the past 2 weeks, respectively
2w_exercise
2w_video_gamesTime spent playing video games, for 3 months and the past 2 weeks, respectively
3m_video_games
3m_tvTime spent watching TV or digital means (e.g., Netflix, Youtube, or web surfing) for 3 months and the past 2 weeks, respectively
2w_tv
2w_readingHow frequently the child asked questions, read, or talked about coronavirus/COVID-19
Health concerns2w_worry_self_infectedChild’s worry about becoming infected
2w_worry_family_infChild’s worry about family members or friends becoming infected
2w_worry_phys_healtWorry that physical health will be affected by coronavirus/COVID-19
2w_worry_ment_healthWorry that the child’s mental/emotional health will be affected by coronavirus/COVID-19
Behavioral effects2w_stress_restrictStress caused by the curfew
2w_stress_familyStress caused to the child by changes in family contacts
2w_worry_food_recoWorry about food in the family running out due to loss of income
2w_stress_socialStress caused to the child by changes to his/her social contacts
2w_living_stabilityChild’s concern about the stability of the family’s living situation
2w_hopeful_endHow hopeful the child is that the coronavirus/COVID-19 crisis will end
Sleeping habits3m_sleep_hoursAverage sleep duration on weekdays, for 3 months and the past 2 weeks, respectively
2w_sleep_hours_rec
3m_sleep_timeSleep schedule on weekdays, for 3 months and the past 2 weeks, respectively
2w_sleep_time_reco
3m_sleep_hours_weekeAverage sleep duration on weekends, for 3 months and the past 2 weeks, respectively
2w_sleep_hours_wee
3m_sleep_time_weekenSleep schedule on weekends, for 3 months and the past 2 weeks, respectively
2w_sleep_time_week
Medical diagnosis/rehabilitation2w_child_health_evaluationParental evaluation of the child’s overall physical health before the coronavirus/COVID-19 crisis
2w_mental_health_evalParental evaluation of the child’s overall mental/emotional health before the coronavirus/COVID-19 crisis
diagnosis_1_groupDiagnosis defined by the medical expert
Diagnosis_FINAL_groupsFinal diagnostic category defined by the medical expert
2w_symptoms_totSymptoms the child had
2w_all_exposure_tot Child exposed to someone likely to have coronavirus/COVID-19
2w_support_activitSupports which were in place for the child and have been disrupted
2w_family_diagnosisWhether any members of the child’s family have been diagnosed with COVID-19
2w_family_events_ho Whether any of the following have happened to the child’s family members because of Coronavirus/COVID-19: Hospitalization, self-quarantine, death, physical illness; and total number of the above family events
2w_family_events_qu
2w_family_events_di
2w_family_events_il
2w_family_events_to
Mood state3m_general_worry
2w_general_worry
How worried the child generally was, 3 months ago and over the past 2 weeks, respectively
3m_sadness
2w_sadness
How happy versus sad the child was, 3 months ago and over the past 2 weeks, respectively
3m_anxiety
2w_anxiety
How relaxed versus anxious the child was, 3 months ago and over the past 2 weeks, respectively
3m_restlessness
2w_restlessness
How fidgety or restless the child was, 3 months ago and over the past 2 weeks, respectively
3m_anhedonia
2w_anhedonia
Ability of the child to enjoy his/her usual activities, 3 months ago and over the past 2 weeks, respectively
3m_loneliness
2w_loneliness
How lonely the child was, 3 months ago and over the past 2 weeks, respectively
3m_irritability
2w_irritability
How irritable or easily angered the child was, 3 months ago and over the past 2 weeks, respectively
3m_concentration
2w_concentration
How well the child was able to concentrate or focus, 3 months ago and over the past 2 weeks, respectively
3m_tiredness
2w_tiredness
How fatigued or tired the child was, 3 months ago and over the past 2 weeks, respectively
3m_rumination
2w_rumination
How often the child was expressing negative thoughts, 3 months ago and over the past 2 weeks, respectively
Table 5. Summarization of classifiers.
ClassifierDescription
Random ForestAn extended version of a decision tree that predicts the future instances with multiple classifiers, rather than a single classifier, to reach an accurate and correct prediction. RF constructs a large number of decision trees. Each decision tree denotes a class prediction, and the class with the most votes represents the model’s prediction [56].
Multi-Layer PerceptronMLP belongs in the category of Artificial Neural Networks (ANN) and it is the most common neural network. MLP is based on a supervised training procedure to generate a nonlinear model for prediction. It consists of layers, such as the input layer, output layer, and hidden layers. Thus, MLP is a layered feedforward neural network where the information is transferred unidirectionally from the input layer to the output layer through the hidden layers [29].
Extreme Gradient BoostingXG Boost is an extendible and cutting-edge application of gradient-boosting machines. Gradient boosting is an algorithm in which new models are created to predict the residuals of prior models, and then added together to make the final prediction. It uses a gradient descent algorithm to minimize the loss when adding new models [57].
Logistic RegressionA mathematical model that describes the relationship of data to a dichotomous dependent variable. The model is based on the logistic function, f ( x )   =   1 1 + e x where x ∈ (−∞, +∞) and 0 ≤ f(x) ≤ 1. Thus, regardless the value of x the model is designed to describe the data with a probability in the range of 0 and 1 in a A-shaped graph [58].
Support Vector MachineSVM is a supervised learning model based on the statistical learning framework, called VC theory. SVM targets to create a decision boundary, the hyperplane, between two classes, which enables the prediction of labels from one or more feature vectors, such that the distance between the closest points of each class, called support vectors, and the hyperplane to be maximized [59].
K-Nearest NeighborKNN is a non-parametric classification method that tries to classify an unknown sample based on the known classification of its neighbors [60].
Decision TreesDTs are sequential models, which logically combine a sequence of simple tests. Each test compares a numeric attribute against a threshold value or a nominal attribute against a set of possible values [61].
Table 6. Parameter settings for clustering methods.
Clustering MethodParameter Settings
Mini Batch K-Means3 classes
Spectral Clustering3 classes, arpack eigen solver, nearest_neighbors affinity
Ward’s Hierarchical Agglomerative Clustering3 classes, ward linkage, symmetric connectivity
Average Linkage3 classes, average linkage, cityblock affinity, symmetric connectivity
Birch3 classes
Jenks3 classes, include lowest value
Table 7. Hyper parameter settings for tuning the ML algorithms.
Classification ModelHyper Parameters Tuning
Random Forestn_estimators = [int(x) for x in np.linspace(start = 10, stop = 500, num = 10)]; max_features = [‘auto’, ‘sqrt’]; max_depth = [int(x) for x in np.linspace(3, 10, num = 1)]; min_samples_split = [3, 4, 5, 6, 7, 10]; min_samples_leaf = [1, 2, 4]; bootstrap = [True, False].
Multi-Layer Perceptronhidden_layer_sizes = [(2, 5, 10), (5, 10, 20), (10, 20, 50)]; activation = [‘tanh’, ‘relu’]; solver = [‘sgd’, ‘adam’]; alpha = [0.0001, 0.05]; learning_rate = [‘constant’, ‘adaptive’]
XG Boostmax_depth = [2, 3, 4, 5, 6, 7, 8]; min_child_weight = [1, 2, 3, 4, 5, 6]; gamma = [0, 0.4, 0.5, 0.6]
Logistic RegressionC = [0.001, 0.01, 0.1, 1, 2, 3, 4, 5, 6, 7, 8, 9, 10]; warm_star = [True, False]; multi_class = [‘ovr’, ‘multinomial’]; solver = [‘newton-cg’, ‘lbfgs’, ‘sag’, ‘saga’]
Support Vector MachineC = [0.001, 0.01, 0.1, 1, 2, 3, 4, 5, 6, 7, 8, 9, 10]; kernel = [‘linear’, ‘sigmoid’, ‘rbf’, ‘poly’]
K-Nearest Neighborn_neighbors = [5, 7, 9, 12, 14, 15, 16, 17]; leaf_size = [1, 2, 3, 5]; weights = [‘uniform’, ‘distance’]; algorithm = [‘auto’, ‘ball_tree’, ‘kd_tree’, ‘brute’]
Decision Treesmax_features = [‘auto’, ‘sqrt’, ‘log2’]; min_samples_split = [2, 3, 4, 5, 6, 7, 8, 10, 12, 15]; min_samples_leaf = [1, 2, 3, 4, 5, 6, 7, 8, 10]
Table 8. Clustering results.
Clustering MethodsCluster InformationClusters
Cluster 0Cluster 1Cluster 2
Mini Batch K-MeansSet[−24, −4][−3, 4][5, 25]
Number of elements144468132
Spectral ClusteringSetUnable to create continuous sets
Number of elements48523029
WardSet[−24, −7][−6, 1][2, 25]
Number of elements66418260
Average LinkageSet[−24, −7][−6, 4][5, 25]
Number of elements66546132
BirchSet[−24, −6][−5, 8][9, 25]
Number of elements8060856
JenksSet[−24, −5][−4, 3][4, 25]
Number of elements106469169
Table 9. Evaluation of clustering methods. The best evaluation score is shown in bold.
Clustering MethodEvaluation MethodCumulative Normalized Score
Silhouette CoefficientCalinski–Harabasz Index Davies–Bouldin Index
Mini Batch K-Means0.551106.780.602.94
Spectral Clustering0.1224.9514.790.00
Ward0.54989.180.582.80
Average Linkage0.571048.060.522.94
Birch0.55784.600.492.64
Jenks0.561112.730.582.96
Table 10. Results from feature selection with the categories of the 40 first features.
FeaturesCategoryFeaturesCategory
1st featureSocial life21st featureDaily activities
2nd featureBehavioral effects22nd featureBehavioral effects
3rd featureMedical diagnosis/rehabilitation23rd featureBehavioral effects
4th featureSocial life24th featureSocial life
5th featurePersonal life25th featureDaily activities
6th featureMedical diagnosis/rehabilitation26th featureDaily activities
7th featureDemographics27th featureMedical diagnosis/rehabilitation
8th featureFamily life28th featureDemographics
9th featureFamily life29th featureBehavioral effects
10th featureSocial life30th featureHealth concerns
11th featureSocial life31st featureSleeping habits
12th featureDaily activities32nd featureSocial life
13th featureDaily activities33rd featureDemographics
14th featureHealth concerns34th featureSocial life
15th featureDaily activities35th featureMedical diagnosis/rehabilitation
16th featureHealth concerns36th featureSocial life
17th featureDemographics37th featureSleeping habits
18th featureBehavioral effects38th featureSleeping habits
19th featureSocial life39th featureSleeping habits
20th featureHealth concerns40th featureDemographics
Table 11. The maximum accuracy achieved from the classification models. The best performance is shown in bold.
ModelsMaximum Accuracy (%)Number of Features for Maximum Accuracy
Random Forest66.6044
MLP57.7358
XG Boost69.4740
Logistic Regression55.4450
SVM64.0549
KNN51.283
Decision Trees53.235
Table 12. Results after XG Boost classifier calibration with Isotonic Regression and Platt’s methods. The best scores are shown in bold.
ModelsLog-Loss Accuracy (%)
XG Boost1.19569.47
XG Boost + Isotonic0.51372.03
XG Boost + Platt0.48976.52
Publisher’s Note: MDPI stays neutral with regard to jurisdictional claims in published maps and institutional affiliations.

