Article

Grassroots Mirroring under COVID-19: Does Community Resilience Affect Residents’ Responses? The Case of Shenzhen, China

1
College of Marxism, Harbin Institute of Technology, Shenzhen 518055, China
2
College of Public Administration, South China Agricultural University, Guangzhou 510642, China
3
College of Chinese National Community, Northwest University for Nationalities, Lanzhou 730030, China
4
College of Marxism, East China University of Science and Technology, Shanghai 200231, China
*
Author to whom correspondence should be addressed.
Sustainability 2022, 14(16), 10159; https://doi.org/10.3390/su141610159
Submission received: 6 June 2022 / Revised: 4 August 2022 / Accepted: 13 August 2022 / Published: 16 August 2022
(This article belongs to the Special Issue Advances in Community Resilience and Sustainable Urban Governance)

Abstract

:
In the face of the sudden outbreak of COVID-19, the community has played a large role in stemming the impact of COVID-19, and community resilience has become a key part of community governance. Community resilience is the ability of a community to respond effectively to risk and keep the community functioning by strengthening governance and leveraging community relationships in the face of external-disaster disruptions; this gives community participants a real sense that the community is equipped to face adversity and challenges. However, the evasive response of some residents is an important factor that hinders the community’s emergency response capabilities. Therefore, this study selected different types of communities in Shenzhen, China, from 9–23 July 2021, conducted a field survey, and obtained 2256 questionnaires using multi-segment random sampling. Based on the questionnaire data, this study uses factor analysis, correlation analysis, multiple linear regression analysis, and cluster analysis to explore the mechanisms of community resilience on residents’ risk coping styles, and the differences between community resilience and residents’ risk coping styles in different types of communities. The study found that, first, community resilience has a significant positive impact on proactive risk response, among which governance performance has a more significant impact; second, community resilience has a negative correlation with evasive coping styles, in which governance performance has a more significant impact; third, there are obvious differences in the level of resilience between different types of communities, with urban communities being the best, mixed communities being second, and transition communities being last. The government’s role in guiding and organizing the population was extremely significant during the COVID-19 pandemic, highlighting the superiority of the socialist system. The role of the community in social management has become increasingly prominent, and community resilience has become a key factor in controlling COVID-19.

1. Introduction

The sudden arrival of the new crown pneumonia epidemic was not only a test of the city’s capacity to handle emergencies and public-health management systems, but also a major test of the community’s resilience. Under the COVID-19 storm, the community, as the interface between the state and the population, became a grassroots bastion in the fight against the epidemic. Communities did play a large role in responding to public-health emergencies and resisting shocks. However, it should not be overlooked that community resilience is in urgent need of improvement, as evidenced by the community’s practice of responding to epidemics [1]. When hit by a major epidemic, many community organizing systems are temporarily dysfunctional. This suggests that current urban and rural communities generally lack the ability to withstand shocks between the norm and the extraordinary and to adapt quickly to environmental changes. Communities that lack resilience will suffer from localized collapse due to difficulties in withstanding disasters and attrition, which will ultimately have a serious impact on the overall health of the city.
The community is the last kilometer of the state’s contact with the masses, and community resilience is a key part of community governance construction [2]. Only when grassroots communities achieve “good governance” and have the resilience to deal with “extraordinary situations” can state building cope with various risk challenges. Community building in Shenzhen, China, has been underway for many years and has achieved milestones in various aspects, including community party-building. It is because of the role of grassroots bastions and the resistance of community resilience that the epidemic interdiction war was won [3]. However, the community protection-logic of object consciousness neglects the creation of the community and treats community residents as passive receptive individuals. Although the community provides material support for residents’ risk response to a certain extent, it neglects the shaping of the community environment and does not start with community residents; thus, it is difficult to realize the essential improvement of the whole community’s risk resistance [4].
In recent years, community resilience has become a hot topic of multidisciplinary discussion as a new perspective on social risk management. Community resilience focuses on improving the resilience of communities and community residents, and has two characteristics. First, it embodies the concept of “bottom-line thinking”. Enhancing community resilience can effectively improve the risk coping capacity of individuals, reduce the losses caused by risks, and improve the community’s ability to save itself at critical times [5]. Second, it embodies the concept of “bending beyond the curve”, which advocates “living with risk” and no longer considers risk as a threat, but emphasizes the sustainable development of community residents in an uncertain and unpredictable risk environment [6]. In fact, community resilience does not only emphasize the positive significance of the improvement of the physical environment of the community to improve individual resilience to risk; it also sees the dynamic role of actors’ subjective socially constructed community resilience to individual risk coping, highlighting the autonomy of relevant subjects in risk coping. Based on this, this study selects the impact of community resilience on residents’ risk coping styles as a research question, expecting to enrich the theories and management models related to community risk, to summarize the experience of the case sites, and to propose corresponding countermeasures to promote the improvement of community risk resilience and effectively counter the impact of COVID-19. It is also hoped that by understanding and analyzing individual risk coping styles, we can further grasp the social risks that may be accumulated and transformed by individuals, so that we can better judge and more easily prevent the epidemic situation all of society.

2. Literature Review

2.1. Community Resilience

Resilience is derived from the Latin word “resillo”, which means to jump back to the original state [7]. Most of the literature considers that the concept of resilience originated from psychological and psychiatric research in the 1940s and is largely attributed to Norman Garmezy, Emmy Werner, and Ruth Smith [8,9]. The concept of resilience was fleshed out in the understanding of pathogenesis and the development of psychopathology. Pioneers of resilience research have shown greater interest in analyzing the dangerous and negative effects of adverse life events on children, such as divorce or traumatic stressors (e.g., abuse, neglect, and war). In the course of these studies, terms such as “resilience” and “stress-resistance” emerged. Of these three, “resilience” has become one of the most controversial concepts. Today, the concept of resilience has been applied in many fields, especially in disaster management. Resilience can be thought of as the inherent capacity of a system, community, or society to change its non-core properties after being affected by a shock or stress [10], adopting positive adaptive behaviors to rebuild themselves [11], and thus, adapt and survive. Resilient subjects are reflected in differences in spatial scales [6]. When the spatial pattern is confined to the community, it is referred to as community resilience. There is no uniform interpretation of the concept of community resilience in the academic community to date. Community resilience refers mainly to the acquisition of community capacity and is the result of successful adaptation; it is a collection of competencies, as well as the process of community capacity enhancement and disaster adaptation, and can be the goal of sustainable community development [12]. Community resilience is the ability of communities to cope with external pressures and perturbations brought about by social, political, and environmental change [13] and the ability to attract resource concentrations and cope with challenges and changes [14]; it reflects the conditions inherent in community systems to withstand and absorb negative impacts [15]. Community resilience is also reflected in the various adaptive capacities of communities as the basic unit of society in the face of risk, which help to mitigate the adverse effects of risk [16]. The positive role that community resilience can play in resilience to risk is due to its pursuit of a risk-adaptive approach to adaptation. The positive role that community resilience can play in risk resilience is due to its pursuit of risk adaptation as a means of influencing individuals through enhanced self-organization and active agency [17]. In addition, the effects of community resilience do not have the same outcomes in different communities due to differences in their intrinsic characteristics that make them vulnerable, and their adaptive capacity varies across communities [15].
In order to deepen the practical application of community resilience, research on community resilience evaluation indicators is emerging. Current academic research on community resilience measures can be divided into two major categories: measures based on objective indicators and measures based on the perceptions of community actors.
First, the theoretical starting point of the objective indicator-based measurement approach is that community resilience comes from the intrinsic characteristics of the community, and the coupling and interaction between community characteristics constitute community resilience. The scholars listed in Table 1 mainly measure community resilience from the physical characteristics of the community, hoping to improve the resilience capacity of the community through physical means. The community resilience measurement method based on objective indicators mainly uses socioeconomic statistics for index calculation, but the selected indicators are too heterogeneous, and the data of some indicators are difficult to obtain in small-scale research units such as communities; this affects the validity of the measurement index. In addition, objective measurement methods do not take into account the actors’ perceptions of disasters and crises [18], lacking in-depth analysis of dimensions such as rights, institutions, and culture [19].
Due to the shortcomings of objective measurement, the measurement of community resilience has gradually shifted to the direction of “actor subjective perception”. Community resilience is not objectively endowed, and individuals’ perceived coping behaviors to disasters vary greatly across spatial and temporal scales. Successful social systems management requires not only the development of objective measures of community resilience, but also a deeper understanding of the mechanisms by which socioeconomic mechanisms, empirical knowledge, and individual perceptions of crises and disasters influence community resilience [25]. Community resilience measures based on the perceptions of community actors have yielded some results, and scholars have proposed and validated some community resilience scales (Table 2).
It can be found that in recent studies, the actors’ subjective perceptions of community resilience measures have been summarized in two main areas: community governance effectiveness and community relationship development. Community resilience is not objectively given, but lies in the individual’s perception that the community is equipped to face adversity, and it is the individual’s internalization of community resilience that determines the improvement in the community’s and residents’ risk coping capacity. The actor’s subjective perception of community resilience measure does not only emphasize the positive significance of the improvement of the physical environment of the community to enhance individual risk resilience; it also sees the dynamic role of the actor’s subjective socially constructed community resilience to individual risk coping. This measure pays much attention to participants’ attitudes toward the community [34], reflecting the participants’ respective relevant needs, placing great importance on the “voice” of the community members. The perceptions of community participants generate an understanding of behavioral norms and expectations that express the presence or absence of community values.
Further, community resilience at the local level includes components of both the physical and social domains [35]. On the one hand, physical resources include available infrastructure and services, which often reflect the socioeconomic status of the community. On the other hand, individuals’ perceptions of their communities (social trust, leadership, and community member relationships, among others) help communities overcome crises or disruptions. Actors’ subjective perceptions of community resilience, on the other hand, can just about encompass both of these measures. First, individuals measure the capacity that a community has to face adversity through their evaluation of the community’s governance performance. Second, individuals measure the community’s ability to cope with adversity by evaluating factors such as trust and belonging within the community.
Under the impact of COVID-19, many scholars have conducted studies on community resilience and public-health events. It has been found that community resilience has led to a shift in the approach to outbreak prevention and control; instead of relying solely on government and social forces, community residents are the main actors in community outbreak prevention and control [36]. Individual variables such as gender, age, socioeconomic status, education level, and political background also have an impact on community resilience and outbreak risk response [37]. Meanwhile, community resilience is closely related to epidemic prevention effectiveness. Resilient communities are able to have a physical basis for coping with risks, and community-minded community residents are more able to cope when an epidemic strikes; thus, they show great resilience to cope with extraordinary situations. Communities with high resilience are better able to mitigate disaster shocks and improve residents’ confidence in development [38]. The converse is also true. In the case of the Baibuting community in Wuhan, for example, the normative Baibuting was a model of community building; however, at the beginning of COVID-19, its community organization system temporarily failed due to insufficient experience in emergency management and insufficient community resilience. This ultimately led to disorderly conditions such as distrust and panic among residents in this community in the early stages of the epidemic, and triggered online public opinion. Communities are an important line of defense for epidemic prevention and control, and communities lacking resilience have difficulty in efficiently identifying and treating patients, which ultimately leads to the escalation of crisis spread [39]. Communities cannot only be used as a means to stop the spread of the virus, but also need to stimulate the vitality of community self-organization under the leadership of party building. Party-led construction is conducive to promoting communities to work together with the government, social organizations, and civic organizations; this strengthens the interactive ties among subjects, enhancing social mobilization and integration capabilities, and ensuring the material resources needed in the process of community governance [40]. In addition, in the face of the disturbance and impact of emerging risks, it is necessary to establish a multifaceted cross-network based on trust and cooperation under the mutual assistance of neighbors and technology embedding [41], gradually constructing a community-wisdom epidemic prevention and control system [42], strengthening the adaptation of community risk governance structure [43].

2.2. Risk Response

Risk coping is the process of cognitive and behavioral efforts made by individuals to mitigate their negative effects when faced with stress [44]. The current academic research on risk coping has been carried out mainly from three perspectives: macro, meso, and micro. The macro perspective of risk coping mainly reflects on the modernization process in order to find possible paths to cope with risks, i.e., the issue of institutional mechanisms in risk coping, including the issue of institutional arrangements in risk coping [45], the problem of pluralistic collaboration in risk response, etc. [46]. Risk response from a meso perspective dissects the role played by communities in risk response. In the shift from management to governance, the role played by community self-organization in risk response has received more and more attention from scholars. Communities not only assume the responsibility of emergency management [47], but also play an effective rebuilding role after the risk shock [48]. The microscopic study of risk response, on the other hand, is a study of the coping styles adopted by individual residents in specific scenarios, which can be specifically divided into weak action-willingness individualization tendency, strong action-willingness individualization tendency, and strong action-willingness group tendency [49]. In the fight against COVID-19, residents’ risk response is a prerequisite for effective epidemic prevention and control, and residents’ participation in consensus and attitude directly affects the effectiveness of community risk prevention and control. Risk coping is the process of cognitive and behavioral efforts made by individuals to mitigate their negative effects when facing stress [44].
Resident risk coping is influenced by multiple factors, which, in turn, present different coping styles. The classification and measurement of coping styles have been explored by scholars. The current research on residents’ risk coping styles has focused on exploring the relationship between scenarios and residents’ risk coping styles. Negative and healing information orientation [50], resident risk perception [51], individual differences: gender, age, education level, etc. [52] all influence the way residents cope with risk. The classification of resident risk coping has also been the focus of academic discussion. In specific scenarios, people may present eager problem-solving and de-escalation behavior [53]; positive response and behavioral avoidance [54]; primary control coping, secondary control coping or an escape from coping [55]; positive or negative dimensions [56]; pro-social or antisocial behavior [57]; or shocked helplessness, panicked flight or a pro-social response [58].
In fact, the behavioral tendencies of individuals who are part of the community in the presence of risk can be classified as proactive or evasive. In general, individuals who are “rational beings” when they perceive that they are at risk, choose the behaviors that will improve their situation. However, because each individual perceives risk differently, individuals choose to be proactive when they feel that their government and community are trustworthy and capable of coping with risk; otherwise, they choose to be evasive.

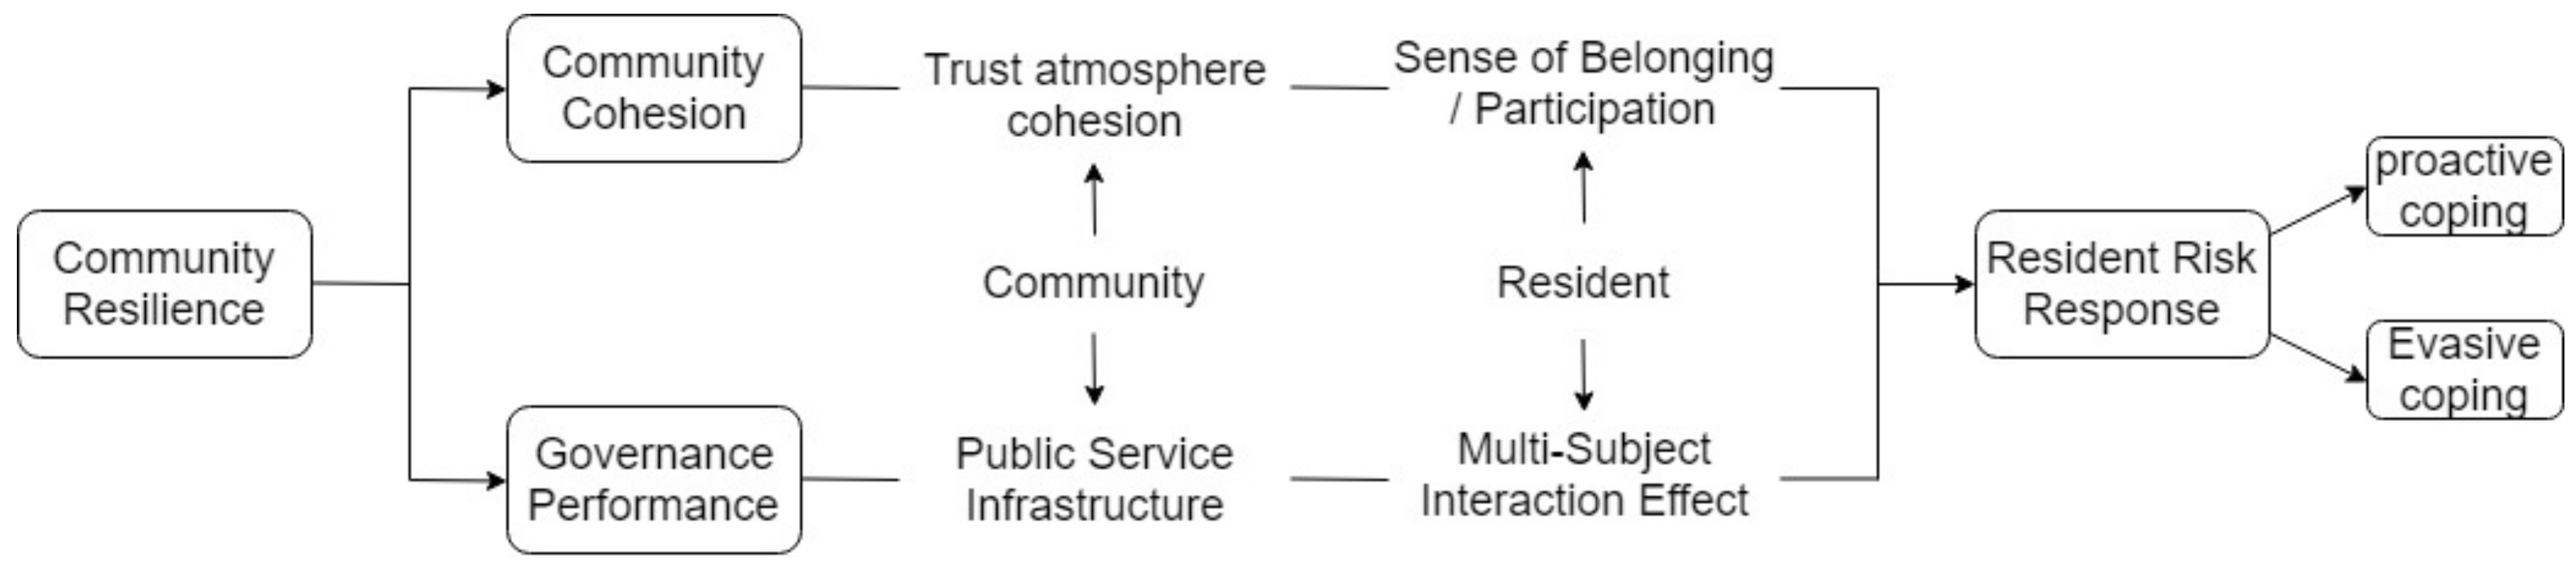
2.3. Impact of Community Resilience on Risk Response
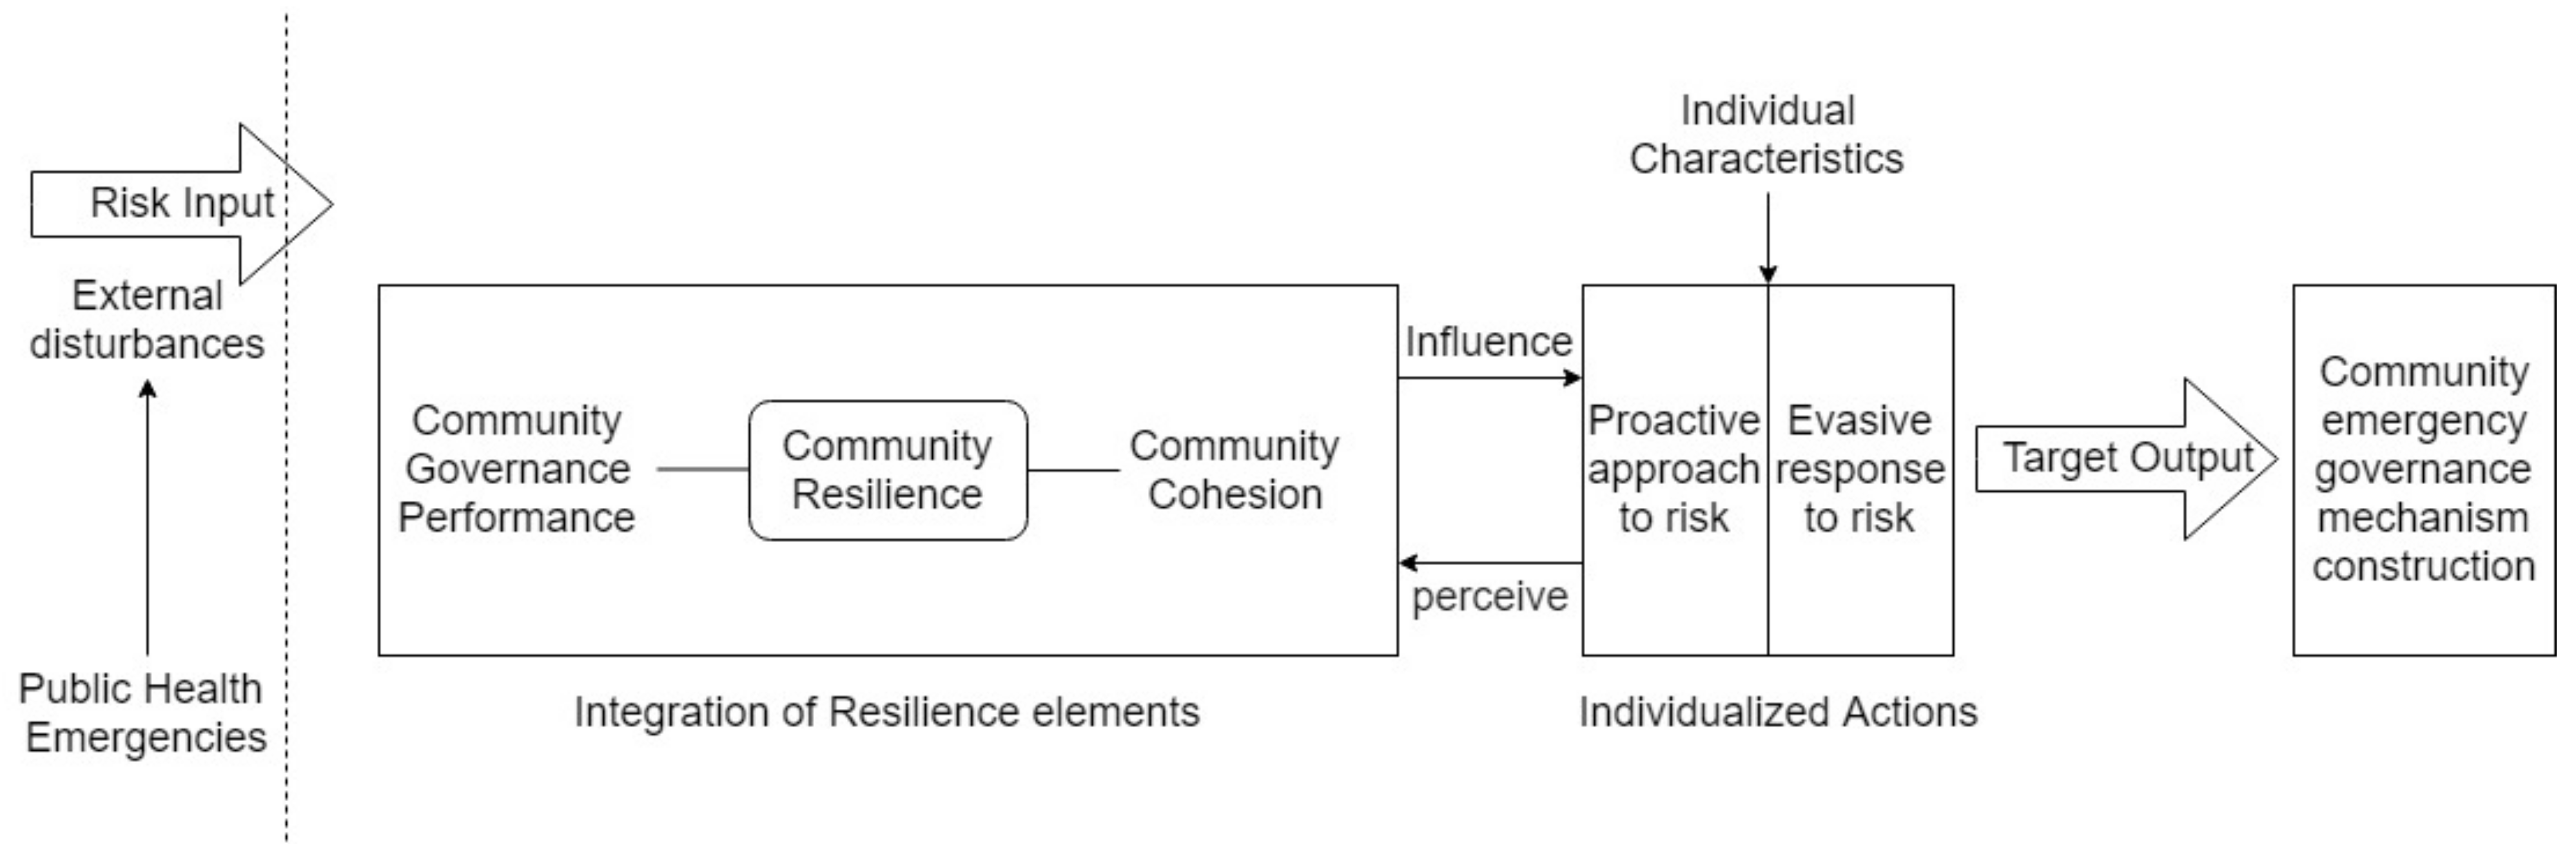
At the macro level, the effective response to community resilience and risk is a complex system that involves effective interactions across multiple economic, political, and social dimensions [59]. At the micro level, research on community resilience and coping approaches has focused on the process and ability of communities to respond effectively to risky disaster shocks by evaluating the perceived community resilience of individuals [29]. Community resilience has a positive impact and important role in residents’ risk coping. There is a coupling relationship between community resilience and risk governance, and the community’s ability to resist risk affects individual behavioral choices because individuals in a risk society cannot achieve it alone [60]; however, equally, individuals can make at-risk communities better through their ability to cope with disasters [14]. On the one hand, cumulative disasters significantly reduce community residents’ developmental confidence and coping options, and this effect varies depending on the level of community resilience: a more resilient community has not only a “cushion effect” to mitigate disaster shocks, but also an “engine effect” to improve residents’ developmental confidence and promote active coping with risks [61]. On the other hand, communication among community residents and the social resource network of the community have a significant positive effect on community risk preparedness and emergency response [62].
Community resilience focuses on the interactions between people and the natural and social environment. The social environment in which an individual grows up and lives, such as family and community, is a social ecosystem, and this social environment interacts with the individual and influences human behavior. Community resilience motivates the individual social-ecological system to reduce the systemic changes caused by disasters, so that the interaction between the systems tends to be benign, and thus, actively and effectively responds to various risk events. The ability of residents to perceive their community’s ability to face adversity is twofold. One aspect is community cohesion within the community. Community cohesion reflects the social capital that community residents may possess. The social capital, created by a high degree of intra-community ties, plays a positive role in helping community residents achieve a more effective risk response [63]. Social capital can reduce management costs, improve response efficiency, make up for the lack of government resources, and help people to get out of the crisis as soon as possible [64]. Second, residents’ evaluation of community governance performance is also a criterion to measure whether the community is equipped to face risky shocks. The stability of socioecological systems [65], the provision of emergency public services, and mobilization mechanisms enhance the active response of individuals in the face of risk [66]. However, individuals may also act evasively and not cooperate with government and community actions when faced with risk. When individual panic occurs, people are more concerned with their own well-being than with collective well-being [67] and are more susceptible to the emotional infection of the surrounding people, which can lead to their assimilation, and thus, to herd behavior [68].
The community, as the basic unit of society, can fundamentally improve its overall ability to cope with risk by effectively enhancing its “resilience”. Resilience is not the result of community self-construction, but the process of transforming community capacity into community action by multiple subjects [54]. Residents, who have the central role of multiple subjects, translate community capacity into community action, as reflected in the way residents respond to risk. What relationship exists between community resilience and residents’ risk coping? What are the mechanisms of influence involved? These questions have rarely been addressed by scholars, and most existing studies use qualitative methods, lack empirical analysis, have a single-indicator construct, and have less research on the consequential variables of community resilience. Answering these questions is critical to building a community emergency governance system in the post-epidemic era.
Therefore, this paper introduces the concept of “social resilience”, a popular concept in risk management in the West in recent years, and constructs a comprehensive index system based on the theory of “resilience” and the theory of self-reflexive modernization, to verify the relationship between community resilience and residents’ risk response. Through questionnaires, we verify the relationship between community resilience and residents’ risk coping, analyze the impact of resident characteristics on the adoption of a risk response approach, and further explore the differences in community resilience and residents’ risk coping among different types of communities in order to strengthen community governance.
Based on the previous literature review, in a period of social differentiation and rapid transition, individuals’ risk coping behaviors will present more and more differences, which are not only due to individual characteristics but are also influenced by the communities they live and interact with. Therefore, this study attempts to analyze the impact of community resilience perceptions on risk coping styles and proposes the following hypotheses:
H1. 
Community resilience perceptions have a significant positive effect on individual proactive risk coping, with more significant effect on governance performance perceptions.
H2. 
Community resilience perceptions have a significant negative effect on individual evasive risk coping, among which governance performance perceptions have a more significant effect.
H3. 
There is no difference between community resilience and residents’ risk coping in different types of communities.

3. Theory

3.1. Self-Reflexive Modernization Theory: Risk Response in the “Individualized Society”

In 1986, Ulrich Beck’s book “Risk Society” was published, in which Beck emphasized technological risk. It was only a few years later that “risk society” as a theory became more popular and accepted by Western scholars. It should be emphasized, however, that in the process of spreading risk society theory, Giddens, who focused on sociopolitical theoretical accounts, played a significant role in complementing Beck’s ideas. According to Beck and Giddens, early modernity addressed the risks of traditional societies, but also generated new risks, and the accumulation of these risks constituted the characteristics of late modernity [69].
Risk society is a holistic overview of the status, role, and possible impact of social risks that are constantly emerging in contemporary society. The first is the “self-reflexivity” of risk, which can be defined as the method of systematically dealing with the dangers and insecurities caused by modernization itself [70]. The second characteristic is the global nature of risk [71]. The impact of risk is no longer bound by nation-states. The “fly-by-night” effect of risk diffusion makes the creators of risk also victims, and the crisis brought by risk is inevitable for all.
Both the theme of “individualization” and the theme of “risk” are important themes of Beck’s self-reflexive modernization theory. The two consequences of self-reflexive modernization are risk society and individuation. He argues that in an “individualized society”, forces no longer develop in terms of the family, but in terms of the individual, forcing people to find a basis for their actions and make decisions. When individuation and risk society are intertwined, the search for individual behavior becomes a necessity.
Before its reform and development, Chinese society was a “total society”, forming a “state–unit–individual” chain, and the traditional organizational model and governance were still able to respond to various crises. However, after the reform and opening up, a social form characterized by an “individualized society” began to emerge. As the attachment of individuals to units gradually weakened and individuals were transformed from “unit people” to “social people”, the role of communities in social management became increasingly prominent. However, the state still embeds community residents into an all-powerful governance system in which the government plays an absolute role from the horizontal to the vertical. At the same time, due to the recurrence of the COVID-19 epidemic, the government has further strengthened the “stability maintenance” and “control” of grassroots communities to maintain social stability and properly handle various emergencies [72]. The advent of the “individualized society” has led to the increasing differentiation of individuals and is increasingly the basis for the analysis of many social problems. This “atomization” of society has led to a lack of security for individuals; moreover, the possibility of being exposed to risks has gradually increased, and various crises and anxieties brought about by risks have plagued each individual.
In the process of the transformation of Chinese society, the phenomenon of “individual fragmentation” has emerged. For this reason, it is necessary to reconstruct “society” as a subject of action that is different from the market and the state, but at the same time, can actively interact with both of them; the community is one of the bearers of this subject of action [73]. Community safety is the cornerstone of social security and, when risk strikes, of whether the community has thorough emergency preparedness and how well the community members’ emergency response capacity directly determines the effectiveness of risk response.
Based on the previous literature review, the tendency of individuals to behave in a particular manner in the presence of risk can be viewed from both proactive and evasive perspectives. Therefore, this study classifies residents’ risk coping into proactive and evasive coping in the explanatory framework.

3.2. Resilient-Community Theory

As a new governance concept, resilient-community theory attaches great importance to the ability of communities to self-organize, self-adapt, and self-restore after being disturbed by external disturbances. It advocates that the community will gradually develop into a system that can adapt to all kinds of changes after being disturbed; that is, community subjects with learning ability, self-organization ability, and flexibility turn passive into active, and enhance their capability for preparation, response, recovery, and reconstruction [74].
In addition to emphasizing the community’s adaptive capacity and learning ability, community resilience also focuses more on the community response to public emergencies in which community residents are involved in mitigation, preparedness, response, and recovery. The local traditions, knowledge, and personal experiences that community residents possess, as well as their identification and understanding of the community, are important, and community residents can both participate in and influence the community and explore new pathways for the future development of the community [6]. Additionally, distrust in the government may lead people to adopt evasive means of risk response. During the COVID-19 pandemic, unscientific decision-making and poor information management by the Bangladeshi government led to increased distrust in government risk management among the population, and people who lacked confidence in government decisions found it difficult to actively cooperate with control measures, thus making it difficult to contain the spread of the virus [75].
Thus, resilient communities play an important role in the social lives of individuals when faced with risks. First, the uncertainties embodied in a risk society create a sense of insecurity for the individuals, while the mutual support actions among neighbors and community members help to bring into play, or are more likely to incubate, the collective power to cope with risks, thus reducing the individual’s sense of insecurity [52]. Second, the place where individuals are provided with the various social services and social security they need is the community, and the social support services for individuals are accomplished in the community. These services improve the individual’s ability to cope with risk. In addition, the community is also the place where individuals achieve social interaction, and the social networks that individuals build in the community play a significant role in supporting their risk-taking [76]. From this perspective, community cohesion and governance performance can have a significant impact on individuals’ behavioral patterns. Based on this, this study divides community resilience into two dimensions in its explanatory framework: community cohesion and governance performance (Figure 1).

4. Methodology

4.1. Analysis of the Study Site

Located in the south-eastern part of China, in Guangdong Province, and adjacent to Hong Kong, Shenzhen is a modern international metropolis with a resident population of over 13 million, making it a well-deserved mega-city. As a new city that has grown with the reform and opening-up of China in the last 40 years, Shenzhen not only has a large population, but also strong concentration and mobility of the population. The rapid progress of industrialization has inevitably brought about a surge in the urban population and its agglomeration. According to statistics, Shenzhen’s normal population density of nearly 8000 people per square kilometer ranks among the highest in the world [77]. The high mobility of the population is due to the fact that Shenzhen is a famous migrant city with many migrant workers. Among the mega-cities swept by COVID-19, Shenzhen, with its highly mobile, concentrated, and heterogeneous population, is not only a difficult city in which to prevent and control the epidemic in general, but also a greater test of community resilience. Therefore, Shenzhen was chosen as the study site for this study.

4.2. Sampling and Surveys

In this study, Simple Random Sampling and Stratified Sampling were used to obtain the sample. The data were obtained from the Community Statistics and Demographics Directory published by the Shenzhen Bureau of Statistics. The specific sampling process was as follows. In the first step, three districts were randomly selected from Shenzhen. In the second step, two street offices were randomly selected from the selected districts. In the third step, stratified sampling was applied. The number of communities in all the streets selected for the current sample was counted to create the sampling frame. Then, based on the classification criteria of Shenzhen Community Statistical Directory, the communities in the sampling frame were divided into three categories, and based on the proportion of the three categories, 4 transition communities, 11 mixed communities and 9 urban communities were selected from the sampling frame. In the fourth step, 100 residents were randomly selected from within each of the selected communities and the selected residents were surveyed.
In order to ensure the reliability of the collected questionnaires, this paper was based on the Conjoint Community Resiliency Assessment Measure (CCRAM) and combined with the circular of Guangdong Province on strengthening community and rural epidemic prevention and control, to develop two scales of community resilience assessment and resident risk coping. The questionnaire consisted of three parts; the first part contained basic information about the respondents, the second part contained 16 community resiliency assessment indicators, and the third part contained 12 resident risk coping indicators.
Before conducting the formal survey, a pilot study round was conducted, including 100 preliminary questionnaires, which were used to test the validity of the questionnaire, the clarity of the questions, and subsequently adjusted according to the actual situation, followed by the finalization of the formal research questionnaire. Based on the analysis of the questionnaires collected in the pilot study, this study decided to streamline the original community resilience scales of leadership, collective efficacy, preparedness, attachment to place, and social trust into the two dimensions of governance performance and community cohesion, to improve the questionnaire’s reliability and validity. The other scales and survey questions were left unchanged.
From 9–13 July 2021 (during the COVID-19 pandemic), the research team conducted a sample survey in Shenzhen City through offline visits, and this study used a self-administered questionnaire model with community residents in Shenzhen City as the main respondents. The entire survey was conducted by 223 questionnaire respondents who entered different communities in Shenzhen in batches to distribute the questionnaires. Participants took about 5–8 min to complete a self-administered questionnaire. The questionnaire was anonymous, avoiding the emotional factor that may arise face-to-face, greatly protecting the privacy of the respondents, and providing more realistic answers for later data analysis. All data were obtained with prior explanation and consent of the respondents and indicated as necessary for scientific research. Investigator interviewers provided clarification of questions as requested. The questionnaire was considered invalid if any participant provided multiple answers to single-choice questions or if a significant number of questions were left unanswered. A total of 2400 questionnaires were distributed and 2380 were returned, and after screening and eliminating invalid questionnaires, a total of 2256 valid questionnaires were obtained, with a validity rate of 93.15%.

4.3. Community-Type Division

In the context of accelerated urbanization, urban communities have evolved and diffused into different community subtypes. In order to conduct a cross-sectional comparison of community resilience and risk coping mechanisms, and to explore the differences in community resilience and risk coping mechanisms among different types of communities under the impact of COVID-19, based on the Shenzhen community classification criteria [78], this study was combined with an investigation to actually divide the communities in Shenzhen into urban communities, mixed communities, and transition communities (Table 3).

4.4. Variable Measurement

Based on the questionnaire data, this study used community resilience as the core explanatory variable, demographic characteristics as the control variable, and selected residents’ risk coping as the explained variable, and conducted factor analysis, correlation analysis, and stepwise regression analysis. Meanwhile, this study explores the differences in community resilience and residents’ risk coping among different types of communities.
The independent variables in this study include two types of core explanatory variables and control variables, and the dependent variable is the explained variable. The specific operationalization process is shown below.

4.4.1. Core Explanatory Variables

The core explanatory variable in this study is community resilience. Community resilience is the ability of a community to effectively cope with risk and keep the community functioning under external-disaster disruptions by strengthening governance and leveraging community relationships so that community participants actually feel that the community is equipped to face adversity and challenges. Based on the Conjoint Community Resiliency Assessment Measure (CCRAM), this study compiles community resilience assessment indicators based on two dimensions—community governance performance and community cohesion—taking into account the current situation of Chinese communities’ resilience to COVID-19. The reasons for selecting actors’ subjective perceptions to evaluate community resilience in this study are as follows: first, research on community resilience has evolved from objective measures of overall community resilience to subjective measures of community resilience as perceived by community participants; second, CCRAM has been proven to be an effective and practical tool for assessing community resilience and has been used by several research institutions in China to measure community resilience; finally, actors’ subjective perception measurement approaches are based on the needs of community participants, focusing on individual feelings about risk and community resilience, and highlighting the autonomy of relevant subjects in risk response, which is very much in line with the concept of resilient-community building in China: to be people-centered and pay practical attention to people’s actual needs and feelings. Therefore, this study will follow the research trend and choose actors’ subjective perceptions as a measure of community resilience, taking into account the Chinese scenario.
The community resiliency survey has a total of 16 questions, all of which are on a 5-point Likert scale, where 1 means strongly disagree, 2 means disagree, 3 means neither agree nor disagree, 4 means agree, and 5 means strongly agree. The higher the score, the better the community’s ability to respond effectively to risk.

4.4.2. Control Variables

The control variables in this study included gender, age, education level, political affiliation, and occupational category. The gender variable was treated as a dummy variable, with women as the reference, and women were assigned a value of “0” and men were assigned a value of “1”. For age variables, dummy variables were processed; the most numerous and most vulnerable respondents were older than 60 years old and were assigned as the reference, i.e., “over 60 years old” was assigned a value of 0, “under 18 years old” was assigned a value of “1 “, “18–25 years old” was assigned a value of “2”, “26–35 years old” was assigned a value of “3 “, “36–45 years old” was assigned a value of “4”, and “46–59 years old” was assigned a value of “5“. The education level variable, transformed into years of education, was a continuous variable. For the political appearance variable, dummy variables were processed, taking the masses as the reference, i.e., “masses” was assigned a value of 0, “CPC member (including reserve member)” was assigned a value of “1”, and “democratic party member” was assigned a value of “1”. “Democratic Party members” was assigned a value of “2” and “Communist Youth League members” was assigned a value of “3”. Occupational category variables were treated as dummy variables, with “non-employed and others” assigned a value of 0, “state-owned and public institutions” assigned a value of “1”. Private enterprises” was assigned a value of “2”, “self-employed/freelancers” was assigned value of “3”. “Students” was assigned a value of “4”.

4.4.3. Explained Variables

Residents’ risk response mainly refers to the tendency of individuals to act and the way they respond to risks when they come. When residents find that negative information closely related to themselves, it is more likely to cause a high-risk evaluation, leading to irrational tension or panic, and thus, to the adoption of an evasive response; meanwhile, positive information such as healing information and governmental precautionary measures are more likely to reduce the level of individual risk perception and enable residents to maintain rational coping behavior [50]. Based on this, the present study comprehensively referred to Liu Yan et al.’s study [49] for the measurement of residents’ coping styles; we adapted it to the circular on strengthening community and rural epidemic prevention and control in Guangdong Province, China, to construct a scale for measuring residents’ coping styles, classifying coping styles according to proactive- and evasive-response dimensions, and asking survey respondents about their tendency to adopt possible behavioral styles.
The coping style measurement scale has a total of 12 items, all of which are on a 5-point Likert scale, where 1 means strongly disagree, 2 means disagree, 3 means neither agree nor disagree, 4 means agree, and 5 means strongly agree. The higher the individual’s score, the more likely he or she is to adopt a certain approach in dealing with the risk.

4.5. Statistical Model Setting

The basic idea of stepwise regression (SR) is to introduce variables into the model one by one, perform an F-test after each explanatory variable is introduced, and perform a t-test on each of the explanatory variables that have been selected; then, we remove the originally introduced explanatory variables when they become no longer significant due to the introduction of later explanatory variables. These steps are taken to ensure that only significant variables are included in the regression equation before the introduction of each new variable [79]. The specific steps are as follows.
A simple regression is first conducted for each of the explanatory variables considered, and then, the regression equation corresponding to the explanatory variable that contributes the most to the explanatory variable is used as the basis for progressively introducing the remaining explanatory variables [80]. After stepwise regression, so that the final explanatory variables retained in the model are both significant and free from severe multicollinearity. The process of selecting variables using the stepwise regression method consists of two basic steps: first, the elimination of the tested insignificant variables from the regression model, and second, the introduction of new variables to the regression model [38].
The idea of the forward method is that the variables are added from fewer to more, and it is a greedy algorithm, adding one at a time until there are no more variables that can be introduced [61]. The calculation is as follows.
  • Step 1
For each of the regression independent variables X1, X2, ..., Xp (“p” denotes the number of variables), a one-variable regression model with the dependent variable Y is developed.
Y = β0 + βiXi + ε, i = 1, ... p
The value of the F-test statistic is calculated for the variable Xi. The corresponding regression coefficient is denoted as F1(1), ..., Fp(1), of which the Fi1(1) is taken, i.e.,
Fi1(1) = max{F1(1), ..., Fp(1)}
For a given significance level α, note that the corresponding critical value is F(1) and Fi1(1) > F(1); then, Xi1 is introduced into the regression model, and note that I1 is the set of indicators for the selected variables.
  • Step 2
A binary regression model of the dependent variable Y with a subset of independent variables {Xi, X1}, ..., {Xi1, Xi1-1}, {Xi1, Xi1 = 1}, ..., {Xi1, Xp} is established (i.e., the regressors of this regression model are binary), with a total of p-1. The value of the statistic of the regression coefficient F-test of the variables is calculated and recorded as Fk(2) (k∉I1), and the largest of them is selected and recorded as Fi2(2), corresponding to the independent variable foot marked as i2, i.e.,
Fi2(2) = {Fi(2), ..., Fi1−1(2), Fi1+1(2), ..., Fp(2)}
For a given significance level α, note that the corresponding critical value is F(2) and Fi2(1) > F(2); then, the variable Xi2 is introduced into the regression model. Otherwise, the variable-introduction process is terminated.
  • Step 3
The regression of the dependent variable on the subset of variables {Xi1, Xi2, Xk} is considered, repeating Step 2. This method is repeated, each time selecting one of the independent variables and control variables not introduced into the regression model until no variables are introduced by the test.

5. Results and Discussion

5.1. Demographic Descriptive Statistics

In terms of demographic variables, the gender ratio in the selection of these sample data is relatively balanced, with slightly more women than men; the age group of the sample is concentrated between 26–45 years old, about 58.05%, which happens to be the age-concentrated part of the backbone of the prevention and control of this epidemic; the education level is mainly college education or above, accounting for 65.07%, indicating that the overall cultural level of the sample is high. For the political outlook, the highest percentage of people was 48.05%, followed by members of the Communist Party of China, while the number of democrats was low, which may affect the overall results of the sample inference; all the occupational categories were fully considered in the sample collection, with the most private enterprises at 34.57% (Table 4).

5.2. Factor Analysis

The analysis showed that the Cronbach’s α coefficients of the Community Resilience Scale and the Resident Risk Response Scale were 0.967 and 0.985, respectively, indicating the high reliability of the study data. Meanwhile, the KMO values of the two scales were 0.946 and 0.936, respectively, which were higher than the criterion of 0.6 required for factor analysis; additionally, the rank sum values of Bartlett’s spherical test were 32,749.881 (p < 0.05) and 23,580.625 (p < 0.05), indicating that the data were suitable for using factor analysis. Then, this paper used the maximum variance method to orthogonally rotate the loading matrix of the factors, refining the 16 indicators and 12 indicators into two dimensions; the results are shown in Table 5 and Table 6. According to the content of the indicators corresponding to each dimension, the following treatment can be performed (Table 5).
The above table is in line with the research expectation that community resilience can be divided into two dimensions: dimension one, named “perception of community cohesion”, and dimension two, named “perception of governance performance”. The contribution of perceived community cohesion is 45.509%, which is higher than the contribution of perceived governance performance. It is tentatively determined that the increase in community cohesion has a more significant effect on increasing community resilience.
In order to study the weighting of specific indicators of community resilience, this paper uses factor analysis to derive a matrix of component shares and finds that the highest weightings in the community cohesion indicators are for “community staff capacity” (0.934) and “residents can be reached for help in emergencies” (0.934). This indicates that: firstly, in the event of an epidemic, community residents place more importance on the ability of community staff to work on epidemic prevention, and community staff can take effective community prevention measures in an emergency situation to protect residents to a greater extent; second, when a crisis strikes, community residents are more likely to want help from their neighbors. Therefore, the key aspect of enhancing community cohesion is to build a good network of community relationships and to guide residents to “ride out the storm together” in times of crisis.
Among the governance performance indicators, the factor with the highest weight is community facilitation services (0.929). This indicates that when a community is closed to an epidemic, residents have difficulty going out to buy supplies, and what they need most is convenient services. Therefore, communities need to provide good public services in order to improve community epidemic prevention, control governance performance, and build strong community resilience.
In the same vein, the article conducts a factor analysis of residents’ coping styles, with the following results (Table 6).
The above table is in line with the research expectation that residents’ risk coping can be divided into two dimensions: dimension one, named “proactive coping risk”, and dimension two, named “evasive coping risk”. The factor contribution of proactive coping risk is 51.363%, which is higher than the contribution of evasive coping risk.
Based on the indicators of residents’ risk coping, further study using factor analysis revealed that the most influential factor on residents’ proactive risk coping was “caring for the vulnerable” (0.908). This indicates that residents who are affected by the epidemic prefer to receive care and help from the community and neighbors, which is conducive to encouraging residents to take a proactive approach to combating COVID-19 and enhances their sense of belonging; this is consistent with the previous finding that “a good social network can effectively enhance community cohesion and build strong community resistance”.
The most significant factor in the evasive risk response of the residents is “praying to God” (0.877). This indicates that when residents indulge in spiritual aspects such as prayers but do nothing for COVID-19 protection, their motivation to cope with risks is weakened, which is not conducive to community epidemic prevention and control management, suggesting that the community should provide the right guidance to its residents.

5.3. Related Analysis

The coefficient values of the correlations between a total of five items, namely, governance performance, community cohesion, community resilience, proactive coping with risk, and evasive coping with risk, showed significance. Specifically, the correlation coefficient between governance performance and community cohesion was 0.486, indicating that governance performance has a significant positive impact on community cohesion; the correlation coefficients between governance performance, community cohesion, and community resilience were 0.847 and 0.876, respectively, indicating that the first two have a significant positive impact on community resilience. Secondly, the correlation coefficients between community resilience and proactive coping risk and evasive coping risk are 0.882 and −0.712, respectively, indicating that there is a significant positive effect of community resilience on proactive coping risk and a significant negative effect on evasive coping risk. Finally, the correlation coefficients between governance performance and proactive coping risk and evasive coping risk were 0.804 and −0.661, respectively, and the correlation coefficients between community cohesion and proactive coping risk and evasive coping risk were 0.720 and −0.572, respectively; this indicates that a significant positive effect of governance performance and community cohesion on proactive coping risk is initially verified, and there is a significant negative effect on evasive coping risk (Table 7).

5.4. Regression Model Construction

From the results of factor analysis, it is clear that community resilience consists of two factors—governance performance and community cohesion—and coping style consists of proactive coping risk and evasive coping risk. To further verify the relationship between community resilience and coping styles, we considered community resilience and community cohesion as independent variables, and proactive coping risk and evasive coping risk as dependent variables; we analyzed them using stepwise regression models, incorporating demographic statistics, governance performance, and community cohesion in turn (Table 8 and Table 9).

5.4.1. Community Resilience Perception and Proactive Risk Response

Table 8 reports the stepwise regression model with proactive coping risk as the dependent variable. From the regression results, among the demographic variables put into Model 1, males will be less willing to adopt a proactive coping approach compared to females; this may be related to the fact that women experience more emotions and are more susceptible to tension contagion than men; those aged under 18, 26–35, 36–45, and 46–59 are more willing to adopt a proactive coping approach compared to those aged over 60; those who are in the state and institutional occupational categories or theprivate sector, who are self-employed/freelance practitioners, and respondents who are students are more likely to adopt proactive risk coping relative to those who are non-working and others; and respondents with higher education are more likely to adopt proactive risk coping. The other demographic variables do not differ significantly in the regression model. The other constant term was 1.197 (p = 0.001 < 0.01).
In Model 2, after adding the independent variable perception of governance performance on top of Model 1, respondents aged below 18, 18–25, 26–35, 36–45, and 46–59 are more willing to take proactive coping measures than those over 60, while respondents with political affiliations as Communist Party members are more willing to take proactive coping measures than those in the political affiliation category of mass respondents; moreover, respondents whose occupational category is state and public institutions or self-employed/freelance will be more willing to take proactive risk coping measures than those who are not working and others. Additionally, the main explanatory variable in the model, perceived governance performance, is significantly and positively related to residents’ risk coping style (p = 0.000 < 0.001) with a constant term of 0.479 (p = 0.001 < 0.01).
Model 3 adds a second main explanatory variable, community cohesion perception, to Model 2. The statistical results show that those aged under 18, 18–25, 26–35, and 36–45 are more likely to adopt proactive coping measures than those aged over 60; those with political affiliations as Communist Party members and democrats are more likely to adopt proactive coping measures than those in the political affiliation category of mass respondents; and the perceived community cohesion of new entrants is significantly and positively related with the dependent variable resident risk coping style (p = 0.000 < 0.001), with a constant term of 0.552 (p = 0.000 < 0.001). Thus, the two variables reflecting individual perceptions of community resilience, perceived governance performance and perceived community cohesion, can significantly demonstrate the role of community resilience on residents’ risk coping styles, predict the tendency of community residents to adopt proactive coping styles, and have a significant positive effect on individual risk coping tendencies; meanwhile, the positive effect of governance performance on proactive coping styles is greater than the positive effect of community cohesion. Accordingly, it can be seen that Hypothesis 1 is confirmed (Table 8).
Table 8. Regression analysis of community resilience perceptions on proactive coping styles.
Model 1Model 2Model 3
Male (female in reference group)−0.499 *** (−10.267)−0.273 *** (−7.484)−0.304 *** (−9.546)
Age (60+ for reference group)
Under 18 years old1.544 *** (8.027)1.338 *** (9.457)0.435 *** (3.286)
18–25 years0.163 (1.456)0.262 ** (3.188)−0.175 * (−2.332)
26–35 years0.709 *** (6.307)0.276 ** (3.292)0.203 ** (2.776)
36–45 years0.976 *** (8.905)0.639 *** (7.865)0.345 *** (4.756)
46–59 years0.735 *** (6.566)0.370 *** (4.444)0.117 (1.591)
Education level0.385 *** (14.176)0.269 *** (13.272)0.109 *** (5.572)
Political affiliation (mass for the reference group)
Chinese Communist Party members (including reserve members)0.142 (1.832)0.168 ** (2.940)0.139 ** (2.798)
Member of a democratic party0.102 (0.404)−0.218 (−1.173)−0.344 *(−2.121)
Communist Youth League member−0.025 (−0.398)−0.032 (−0.708)−0.008 (−0.211)
Occupational group (non-working and other for the reference group)
State-owned and business units0.913 *** (8.050)0.401 *** (4.717)0.320 *** (4.308)
Private business0.935 *** (9.661)0.337 *** (4.569)0.227 *** (3.511)
Individual/freelancer0.719 *** (8.099)0.302 *** (4.542)0.270 *** (4.658)
Students0.665 *** (3.702)−0.172 (−1.279)0.091 (0.767)
Governance performance 0.528 *** (30.809)0.447 *** (28.736)
Community Cohesion 0.315 *** (18.782)
a constant (math.)1.197 ** (10.239)0.479 ** (5.378)0.552 *** (7.107)
F153.928 ***329.336 ***428.471 ***
R20.6590.8160.861
n225622562256
Note: ***, **, and * represent signifificance at the 1%, 5%, and 10% levels, respectively. The table reports the unstandardized regression coefficients, and the numbers in parentheses are the standard errors.

5.4.2. Community Resilience Perception and Evasive Risk Response

Table 9 reports the stepwise regression model with evasive coping risk as the dependent variable. From the regression results, among the demographic variables placed in Model 1, males are more willing to adopt evasive coping than females; those aged under 18, 26–35, and 36–45 are less willing to adopt evasive coping than those over 60; those with political affiliations as members of the Chinese Communist Party and democrats are less likely to adopt evasive coping than those in the political affiliation category of the masses; and those with political affiliations as democrats are more likely to adopt evasive coping than those in the political affiliation category of the masses. This may be due to an error caused by the insufficient sample size of democrats. The other demographic variables did not differ significantly in the regression model. The other constant term was 5.320 (p = 0.001 < 0.01).
For Model 2, with the addition of the independent variable perception of governance performance on top of Model 1, those aged below 18 and 36–45 years old are more reluctant to adopt evasive coping measures relative to those aged above 60 years old; respondents whose occupational category is state and public sector, and private sector, who are self-employed/freelance workers, and who are students will be more reluctant to adopt an evasive risk coping approach relative to those who are not working and others. Additionally, the main explanatory variable in the model, perceived governance performance, is significantly and negatively related to residents’ risk coping style (p = 0.000 < 0.001) with a constant term of 5.990 (p = 0.001 < 0.01).
Model 3 adds a second main explanatory variable, perception of community cohesion, to Model 2, and the statistical results show that the newly added perception of community cohesion is significantly and negatively related to the dependent variable, resident risk coping (p = 0.000 < 0.001), with a constant term of 5.966 (p = 0.000 < 0.001). Thus, the two variables reflecting individuals’ perceptions of community resilience, perceived governance performance and perceived community cohesion, significantly predicted the tendency of community residents to adopt evasive coping styles, reduced the likelihood of individuals adopting evasive coping measures, and had a positive impact on their risk coping styles. Additionally, the negative effect of governance performance on evasive coping styles is greater than the negative effect of community cohesion. Accordingly, Hypothesis 2 is confirmed (Table 9).
Table 9. Regression analysis of perceived community resilience on evasive coping styles.
Model 1Model 2Model 3
Male (female in reference group)0.215 *** (−3.638)0.426 *** (−8.261)0.416 ***(−8.100)
Age (60+ for reference group)
Under 18 years old−0.864 *** (−3.689)−0.671 ** (−3.354)−0.368 (−1.724)
18–25 years0.011 (0.080)−0.082 (−0.703)0.065 (0.538)
26–35 years−0.513 *** (−3.751)−0.109 (−0.919)−0.084 (−0.716)
36–45 years−1.025 *** (−7.682)−0.710 *** (−6.178)−0.612 *** (−5.226)
46–59 years−0.209 (−1.535)0.132 (1.123)0.217 (1.824)
Education level−0.599 *** (−18.139)−0.491 *** (−17.116)−0.438 *** (−13.823)
Political affiliation (mass for the reference group)
Chinese Communist Party members (including reserve members)−0.728 *** (7.700)−0.704 *** (8.717)−0.713 *** (8.888)
Member of a democratic party1.063 ** (3.457)1.362 *** (5.175)1.405 *** (5.365)
Communist Youth League member0.044 (0.583)0.051 (0.792)0.043 (0.672)
Occupational group (non-working and other for the reference group)
State-owned and business units−0.245 (1.774)−0.723 *** (6.011)−0.750 *** (6.267)
Private business−0.024 (0.201)−0.582 *** (5.578)−0.619 *** (5.947)
Individual/freelancer−0.109 (1.013)−0.498 *** (5.284)−0.508 *** (5.430)
Students−0.358 (−1.637)−0.424 * (2.222)−0.335 (1.757)
Governance performance −0.493 *** (−20.318)−0.465 *** (−18.556)
Community Cohesion −0.106 *** (−3.912)
a constant (math.)5.320 ** (37.395)5.990 ** (47.563)5.966 *** (47.611)
F104.360 ***160.964 ***153.800 ***
R20.5680.6850.689
n225622562256
Note: ***, **, and * represent signifificance at the 1%, 5%, and 10% levels, respectively. The table reports the unstandardized regression coefficients, and the numbers in parentheses are the standard errors.

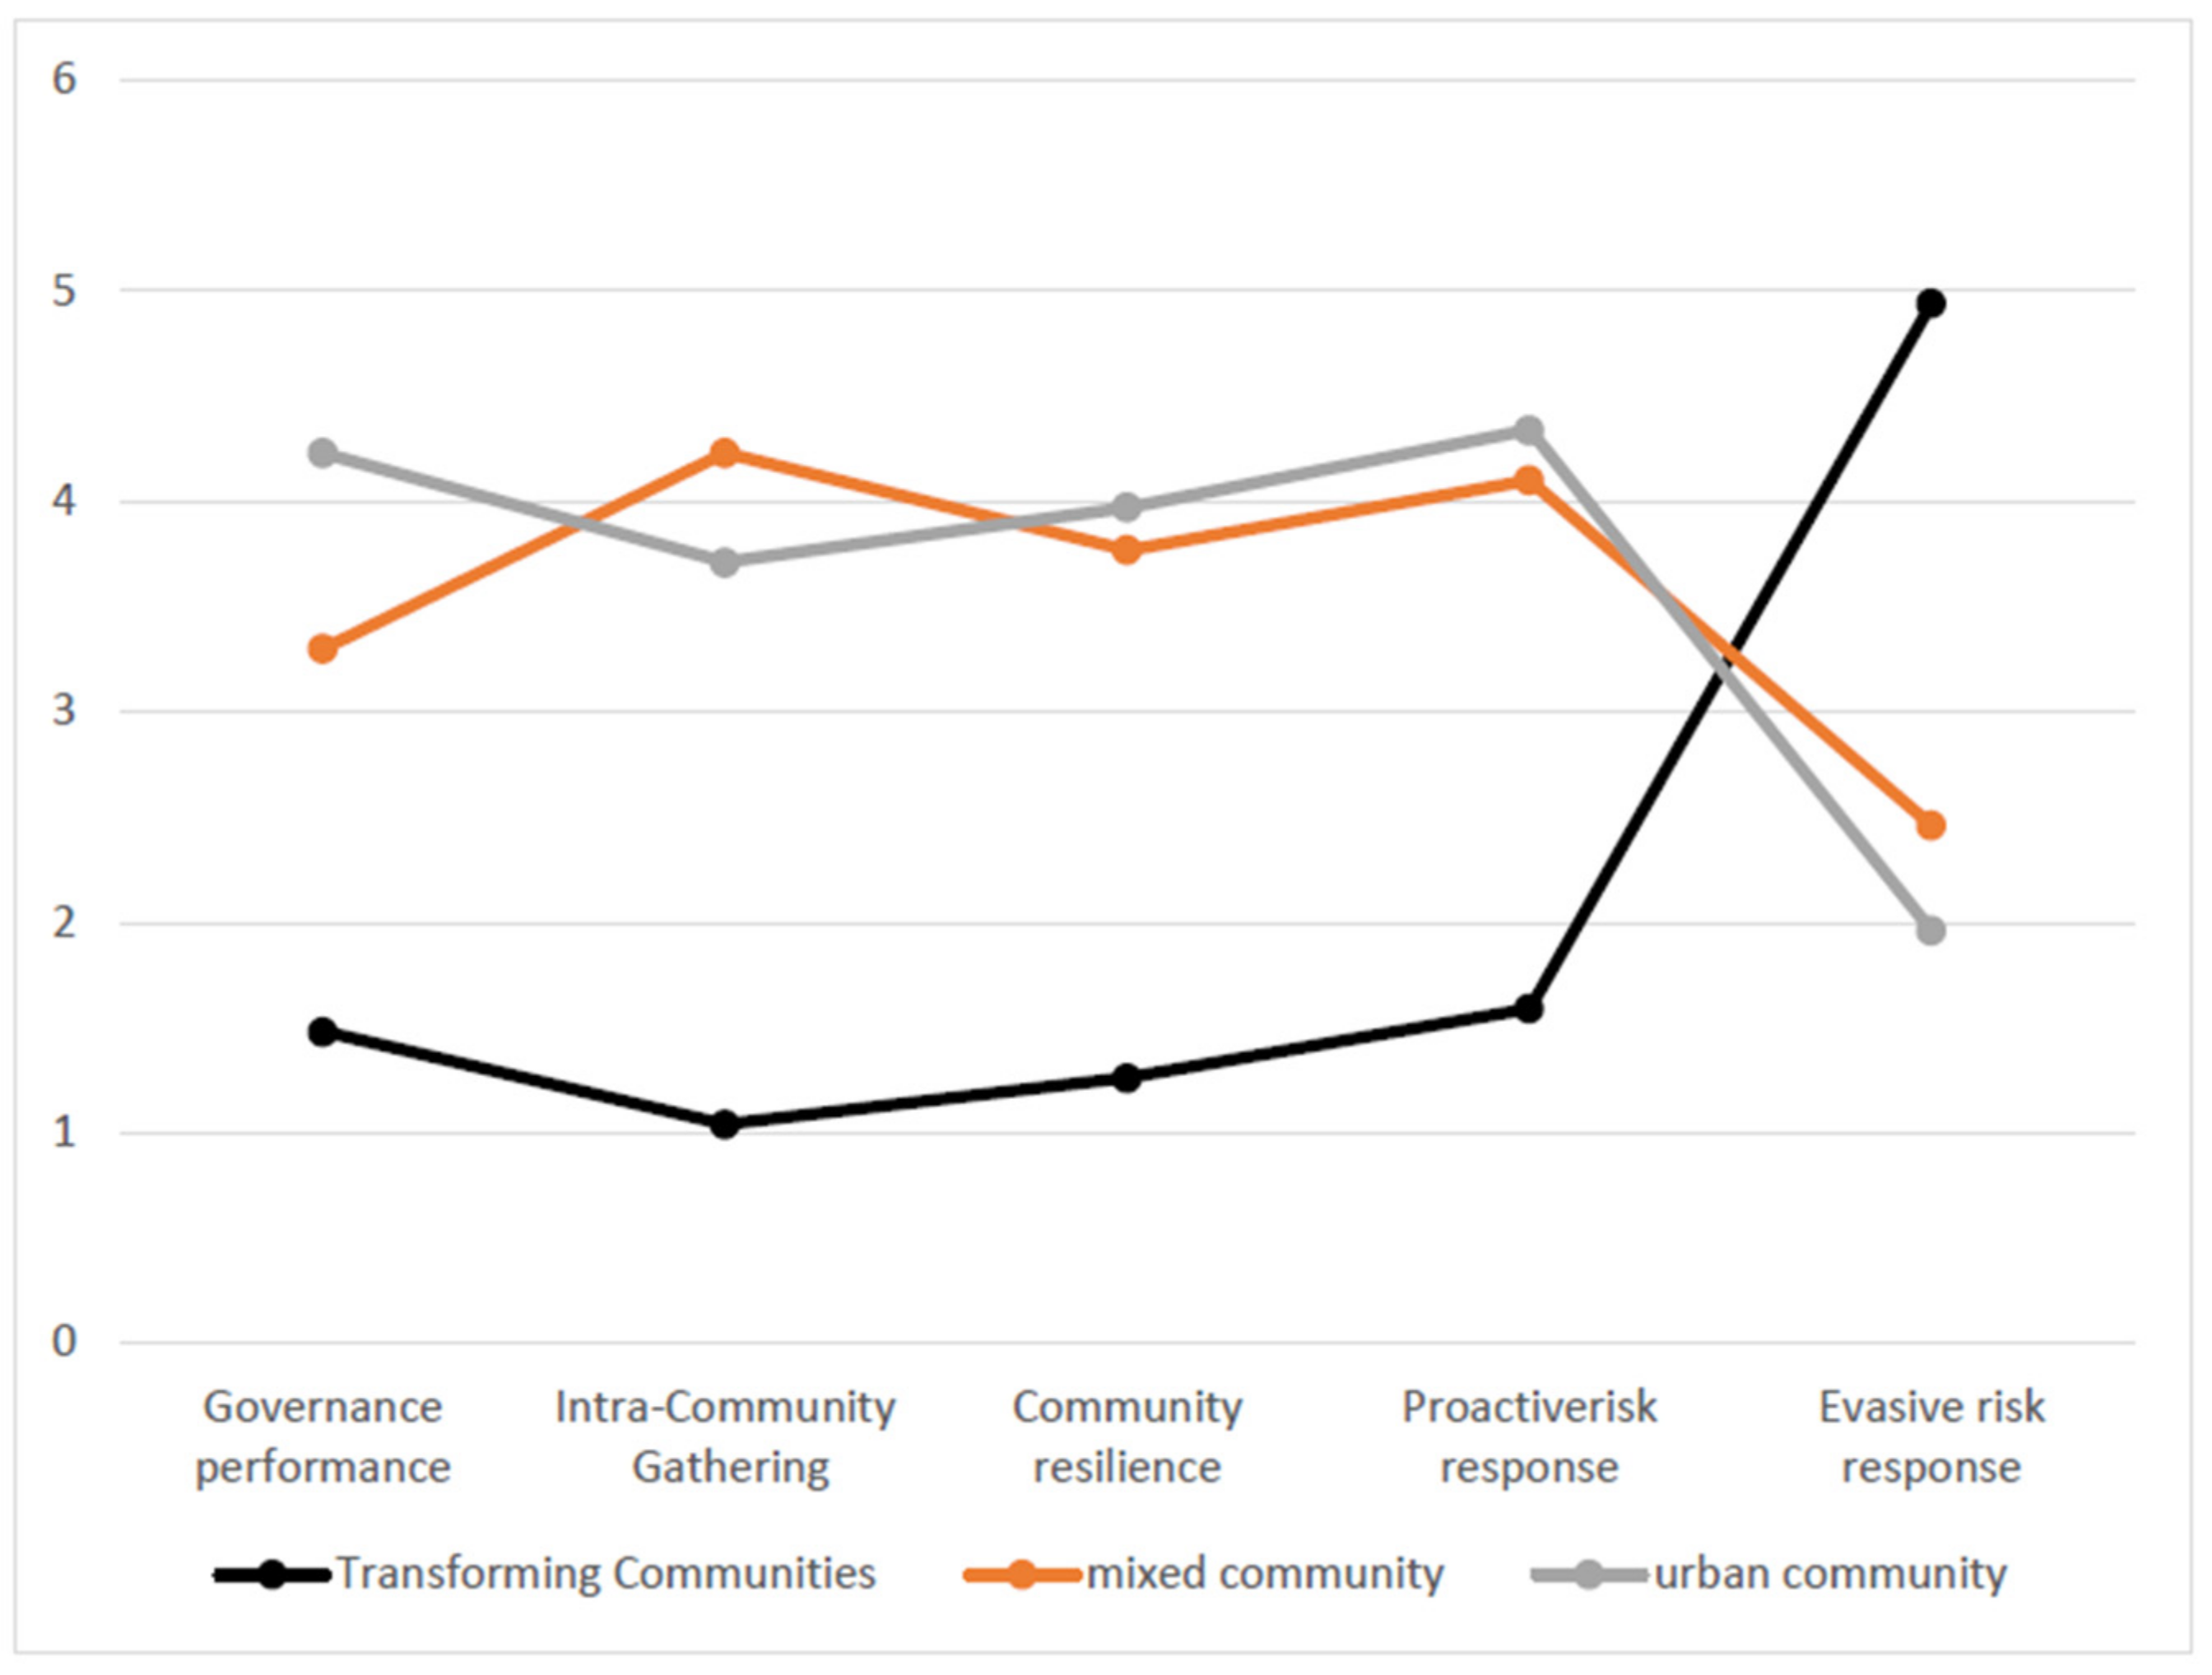
5.5. Analysis of Differences between Different Types of Communities

As can be seen from Table 10, the clustered category groups show significance (p < 0.05) for all the research items, implying that the clustering analysis yields three categories of groups that have significant differences in their characteristics on the research items. Based on the internal evolution and characteristics of the Shenzhen communities, this paper classifies communities into urban communities, mixed communities, and transition communities.
Specifically, first, the governance performance of urban communities is 4.23, of mixed communities is 3.30, and of transition communities is 1.48; this is due to the superior environment, diversified functions, and better-equipped public-service facilities in urban communities, which provide superior governance conditions for community epidemic prevention and control. Meanwhile, mixed communities and transition communities are usually old neighborhoods with less well-equipped infrastructure and functions, and their performance in epidemic prevention and control is poorer than that of urban communities.
Second, community cohesion in urban communities is 3.71, in mixed communities is 4.23, and in transition communities is 1.04; this is due to the fact that mixed communities in Shenzhen are usually the residential areas of unit workers and old-town residents built before the 1990s, which have a tighter social structure, complex social bonds among residents, stronger interpersonal interaction between neighbors, and a good community capital base. Urban communities, on the other hand, are newer neighborhoods and communities in transition, which are more mobile and have been transformed into “stranger societies”, with less intra-community cohesion than mixed communities.
Third, community resilience is ranked as urban communities (3.97) > mixed communities (3.77) > transition communities (1.26). Transition communities have the worst community resilience due to the fact that they are exposed to the radiation of urban functions, the gradual transformation of agricultural land into built-up areas, and functional chaos. The foreign population usually greatly exceeds the number of local household members, and the occupations of the residents oscillate, with a complex occupational composition, high mobility, and a lack of various facilities. Traditional rural-style blood- and geo-bonds are gradually disintegrating, the social control of neighborhoods is weakening, and heterogeneous interpersonal relationships in the city have not yet been established. The community has more potential problems than other urban communities, making it the most dynamic and chaotic area today. As a result, it is also the least resilient in terms of community resilience (Table 10).
The ranking of proactive coping risks is urban communities (4.34) > mixed communities (4.10) > transition communities (1.59), and that of evasive coping risks is transition communities (4.94) > mixed communities (2.46) > urban communities (1.96). This indicates that residents within urban communities with high governance performance and high levels of community resilience are more inclined to take proactive measures in terms of risk coping; residents within mixed communities with strong community cohesion and high levels of community resilience also respond with higher levels of positive attitudes, and thus, are more inclined to take proactive measures in response; however, residents within transition communities with poor community resilience choose to respond to risks with evasive measures. Based on the above analysis, a comparison of the current state of the three major communities was derived (Figure 2).
Finally, all of the different community-type samples showed significance (p< 0.05) for community resilience, and resident risk coping, implying that different community types showed significant differences for community resilience and for resident risk coping. Therefore, Hypothesis 3 was overturned.

6. Conclusions and Implications

Through questionnaire surveys with some community residents in Shenzhen, this article explored the impact of residents’ perceptions of community resilience and risk response methods. Specifically, this article has the following research findings: when residents’ perceptions of community cohesion and governance performance are stronger, their coping behaviors in the face of epidemic risks will be more active, and their evasive coping behaviors in the face of epidemic risks will be significantly reduced. This inclination is not only reflected in individuals, but also in the differences between different types of communities (Figure 3).
On one hand, the perception of governance performance is more embodied in the residents’ cognition of the basic public services and infrastructure construction provided by the grassroots government. Although the two voices of government dominance and community autonomy have always been controversial, the practice, at this stage, has proven that in the process of community governance, the development of social self-organization in the community is not sound, and it is temporarily unable to perform the function of self-service independently; this still has a great impact on the government. Therefore, the government cannot yet “absent”. A government with good resource allocation capabilities and public-service capabilities can effectively form a benign interaction between the party, government, residents, and social organizations when the community responds to the risk of the epidemic.
On the other hand, the perception of community cohesion emphasizes that residents have a sense of belonging and participation in the community. The community creates a good cultural atmosphere of mutual benefit. In the face of a risky society, it can quickly get rid of the independent state of the individual and form a tight group. The impact of this perception of community cohesion on the way residents respond to risks differs significantly in different types of communities; urban communities and mixed communities have long interpersonal interactions within the organization and frequent interpersonal interactions, and their residents’ perceptions of community cohesion are relatively high. The coordination of community work has enabled this type of community to perform better or steadily perform well in prevention and control during the epidemic, presenting an overall orderly community state. However, due to the strong population heterogeneity and high mobility of transition communities, epidemic prevention and control in this type of community is much more difficult than in other types of communities, and some potential problems in the community have been exposed.
The significant role of governance performance on residents’ risk response methods is greater than that of community cohesion; this, to a certain extent, indicates that the government’s guiding and organizing role for residents has been extremely important in such emergent public-health incidents, highlighting the superiority of the socialist system. At the same time, the impact of this difference in governance performance on the way residents respond to risks is more strongly contrasted in different community types. From the above analysis, it can be seen that the ranking of the strength of the community’s ability to cope with risk is as follows: urban communities are the best, mixed communities are the second best, and transitional communities are last. First, combined with the results of field visits, the specific performance of the three types of communities in risk coping is as follows: urban communities with rich social resources and integrated management effectively form a positive interaction of multiple social actors in coping with the risk of the epidemic; moreover, while driving residents to actively cope with risk and give full play to the performance of their governance, they also enhance the “stranger society”. The community’s resilience is further enhanced by the sense of community among residents in a “stranger society”. Second, mixed communities with a tighter social structure within the community, due to the formation of complex social bonds among residents and stronger interpersonal interactions among neighbors, effectively improved community resilience, enabling the community to achieve a smooth transition during the initial phase of the epidemic. Third, transition communities with high mobility, a lack of various facilities, and heterogeneous interpersonal relationships in the city have not yet been established; the community’s risk coping capacity is lacking when risks occur, and the evasive risk coping of some residents not only increases the pressure on grassroots staff to resist the epidemic, but also affects the overall community’s governance synergy. Under risk society, urban village communities with strong population heterogeneity and social conflicts need to build a sense of community and enhance governance performance.

6.1. Insights

When risk society and the rise of the individual are intertwined, can the individual rely on the community in the process of achieving an effective response to risk, as well as in its search for safety? We need to acknowledge the reality that individualization, as a feature of the great changes in contemporary Chinese society, has given individuals more rights, choices, and freedom in their private lives from the collectivist constraints of family, kinship, community, workplace, and the state. The pursuit of security is an effective support. First, as a community with geographical boundaries, it embodies the advantages of local accessibility and solidarity behavior, which greatly enhances the individual’s ability to resist risk in the event of a public-health emergency, and as the saying goes, “distant relatives are better than close neighbors. Secondly, the composition of the community is not only geographical, but is also reflected in its people’s common identity and cultural traits, with the same pursuit of interests. The effective response to risk is the most basic and urgent pursuit of individuals. In short, a basic living community will still exist, and even be strengthened, by people’s common pursuit of safety. Therefore, we need to pay attention to the cultural climate of trust, belonging, and reciprocity cultivated by community residents in their daily interactions; moreover, we need to evaluate how community governance performance will passively influence the risk coping process of individuals and organizations, further highlighting the autonomy of the relevant subjects in risk coping.

6.2. Research Limitations and Future Research Directions

This study is the first attempt to explore the influential relationship between community resilience and residents’ risk coping, the truth of which is yet to be studied and may have several limitations. First, this study uses a community in Shenzhen, China as a case site, and the generalizability of the findings needs further validation and in-depth research, which may also limit our ability to generalize the findings to all regions. Second, in terms of the analysis method, this study only conducted stepwise regression analysis to test the hypothesis, and the statistical method is relatively single, so it is difficult to compensate for the shortcomings in variable selection and data processing. The possible interaction effects were not further explained.
Based on the shortcomings of the existing studies, future improvements can be made to the following aspects: First, more targeted communities should be selected for the survey, for example, communities with more frequent epidemic shocks could be compared with ordinary communities, so as to increase the representativeness and validity of data collection while expanding the sample size. Second, based on larger-scale accurate sampling and improved measurement validity, we will try to use other statistical software and analysis methods to explore relevant variables that may affect the relationship between community resilience and residents’ risk coping.

Author Contributions

Conceptualization, J.X. and Z.Z.; methodology, J.X. and Y.H.; investigation, Z.P.; writing—original draft preparation, Z.Z., Z.X. and X.Z.; writing—review and editing, J.X., Z.Z., Y.H., Z.X. and X.Z.; project administration, J.X.; funding acquisition, J.X. All authors have read and agreed to the published version of the manuscript.

Funding

This research was conducted with the support of the 2021 the first batch of the Industry-University Cooperation Collaborative Education Project, Department of Higher Education, Ministry of Education, China (no. 202101067021), and the 2021 Key Project of the Party Political Construction Research Center, Ministry of Industry and Information Technology (no. GXZY2126).

Institutional Review Board Statement

Ethical review and approval were waived for this study because issues of human privacy were not involved.

Informed Consent Statement

Informed consent was obtained from all the subjects involved in the study.

Data Availability Statement

Not applicable.

Conflicts of Interest

The authors declare no conflict of interest.

References

  1. Zhang, F.X. The community resilience measurement throughout the COVID-19 pandemic and beyond—An empirical study based on data from Shanghai, Wuhan and Chengdu. Int. J. Disaster Risk Reduct. 2021, 67, 10–27. [Google Scholar]
  2. Zheng, L.Y.; Zheng, W.; Yang, W. Community resilience: Response and challenges of the new crown pneumonia epidemic at the grassroots level—A perspective based on community resilience theory. J. Fujian Med. Univ. Soc. Sci. Ed. 2020, 62, 22–25. [Google Scholar]
  3. Zhang, X.J.; Han, X.H. Community Resilience Theory: A Framework for Disaster Resilient Emergency Governance Based on Homeostatic Maintenance. J. Huaqiao Univ. Philos. Soc. Sci. Ed. 2021, 42, 59–70. [Google Scholar]
  4. Li, F.F.; Pang, S.L. Analysis of China’s community emergency management construction model based on the perspective of governance theory. Manag. Rev. 2015, 27, 197–208. [Google Scholar]
  5. Mileti, D. Disasters by Design: A Reassessment of Natural Hazards in the United States; National Academic Press: Washington, DC, USA, 1999; pp. 81–82. [Google Scholar]
  6. Kristen, M. Community Resilience: An Indicator of Social Sustainability. Soc. Nat. Resour. 2010, 23, 401–416. [Google Scholar]
  7. Klein, R.J.T.; Nicholls, R.J.; Thomalla, F. Resilience to Natural Hazards: How Useful Is This Concept? Environ. Hazards 2003, 5, 35–45. [Google Scholar] [CrossRef]
  8. Waller, M.W. Resilience in Ecosystemic Context: Evolution of the Concept. Am. J. Orthopsychiatry 2001, 71, 290–297. [Google Scholar] [CrossRef]
  9. Johnson, J.L.; Wielchelt, S.A. Introduction to the Special Issue on Resilience. Subst. Use Misuse 2004, 39, 657–670. [Google Scholar] [CrossRef]
  10. Shyam, B.B.M.; Zhang, Y.Z.; Liu, H.L. The concept of resilience revisited. Int. Urban Plan. 2015, 30, 13–21. [Google Scholar]
  11. Mallak, L.A. Measuring resilience in health care provider organizations. Health Manpow Manag. 1998, 24, 148–152. [Google Scholar] [CrossRef]
  12. Norris, F.H.; Stevens, S.P.; Pfefferbaum, B.; Wyche, K.F.; Pfefferbaum, R.L. Resilience as a Metaphor, Theory, Set of Capacities, and Strategy for Disaster Readiness. J. Am. Community Psychol. 2008, 36, 127–150. [Google Scholar] [CrossRef]
  13. Adger, W.N. Social and ecological resilience: Are they re-lated? Prog. Hum. Geogr. 2000, 24, 347–364. [Google Scholar] [CrossRef]
  14. Paton, D.; Johnston, D. Disasters and communities: Vulnerability, resilience and preparedness. Disaster Prev. Manag. 2001, 10, 270–277. [Google Scholar] [CrossRef]
  15. Cutter, S.L.; Barnes, L.; Berry, M.; Burton, C.; Evans, E.; Tate, E.; Webb, J. A place-based model for understanding community resilience to natural disasters. Glob. Environ. Chang. 2008, 18, 598–606. [Google Scholar] [CrossRef]
  16. Bruneau, M.; Chang, S.E.; Eguchi, R.T.; Lee, G.C.; O’Rourke, T.D.; Reinhorn, A.M.; Shinozuka, M.; Tierney, K.; Wallace, W.A.; Von Winterfeldt, D. A Framework to Quantitatively Assess and Enhance the Seismic Resilience of Communities. Earthq. Spectr. 2003, 19, 733–752. [Google Scholar] [CrossRef]
  17. Fikret, B.; Helen, R. Community Resilience: Toward an Integrated Approach, Society and Natural Approach. Soc. Nat. Resour. 2013, 26, 5–20. [Google Scholar]
  18. Sherrieb, K.; Norris, F.H.; Galea, S. Measuring capacities for community resilience. Soc. Indic. Res. 2010, 99, 227–247. [Google Scholar] [CrossRef]
  19. Calgaro, E.; Lloyd, K.; Dominey, H.D. From vulnerability to transformation: A framework for assessing the vulnerability and resilience of tourism destinations. J. Sustain. Tour. 2014, 22, 341–360. [Google Scholar] [CrossRef]
  20. Cutter, S.L.; Burton, C.G.; Emrich, C.T. Disaster resilience indicators for benchmarking baseline conditions. J. Homel. Secur. Emerg. Manag. 2010, 7, 1–22. [Google Scholar] [CrossRef]
  21. Peacock, W.G.; Brody, S.D.; Seitz, W.A.; Merrell, W.J.; Vedlitz, A.; Zahran, S.; Harriss, R.C.; Stickney, R. Advancing Resilience of Coastal Localities: Developing, Implementing, and Sustaining the Use of Coastal Resilience Indicators; Hazard Reduction and Recovery Center: College Station, TX, USA, 2010; pp. 31–33. [Google Scholar]
  22. Ainuddin, S.; Routray, J.K. Earthquake hazards and com-munity resilience in Baluchistan. Nat. Hazards 2012, 63, 909–937. [Google Scholar] [CrossRef]
  23. Joerin, J.; Shaw, R.; Takeuchi, Y.; Krishnamurthy, R. Action-oriented resilience assessment of communities in Chennai, India. Environ. Hazards 2012, 11, 226–241. [Google Scholar] [CrossRef]
  24. Maldonado, J.H.; Moreno, R.P. Estimating the adaptive capacity of local communities at marine protected areas in Latin America: A practical approach. Ecol. Soc. 2014, 19, 16. [Google Scholar] [CrossRef]
  25. Coulthard, S.; Johnson, D.; McGregor, J.A. Poverty, sustain-ability and human wellbeing: A social wellbeing approach to the global fisheries crisis. Glob. Environ. Chang. 2011, 21, 453–463. [Google Scholar] [CrossRef]
  26. Holladay, P.J.; Powell, R.B. Resident perceptions of social-ecological resilience and the sustainability of community-based tourism development in the commonwealth of Dominica. J. Sustain. Tour. 2013, 21, 1188–1211. [Google Scholar] [CrossRef]
  27. Biggs, D.; Hall, C.M.; Stoeckl, N. The resilience of for maland informal tourism enterprises to disasters: Reef tourism in Phuket, Thailand. J. Sustain. Tour. 2012, 20, 645–665. [Google Scholar] [CrossRef]
  28. Cohen, O.; Leykin, D.; Lahad, M.; Goldberg, A.; Aharonson-Daniel, L. The conjoint com-munity resiliency assessment measure as a baseline for profiling and predicting community resilience for emergencies. Technol. Forecast. Soc. Chang. 2013, 80, 1732–1741. [Google Scholar] [CrossRef]
  29. Leykin, D.; Lahad, M.; Cohen, O.; Goldberg, A.; Aharonson-Daniel, L. Conjoint community resiliency assessment measure-28/10 items (CCRAM28and CCRAM10): A self-report tool for assessing community resilience. Am. J. Community Psychol. 2013, 52, 313–323. [Google Scholar] [CrossRef] [PubMed]
  30. Marshall, N.A.; Marshall, P.A. Conceptualizing and operationalizing social resilience within commercial fisheries in northern Australia. Ecol. Soc. 2007, 12, 1. [Google Scholar] [CrossRef]
  31. Steiner, A.; Markantoni, M. Unpacking community resilience through capacity for change. Community Dev. J. 2014, 49, 407–425. [Google Scholar] [CrossRef]
  32. Nguyen, K.V.; James, H. Measuring household resilience to floods: A case study in the Vietnamese Mekong River Delta. Ecol. Soc. 2013, 18, 13. [Google Scholar] [CrossRef]
  33. Kulig, J.C.; Edge, D.S.; Townshend, I.; Lightfoot, N.; Reimer, W. Community resiliency: Emerging theoretical insights. J. Community Psychol. 2013, 41, 758–775. [Google Scholar] [CrossRef]
  34. Eames, M.; Egmose, J. Community foresight for urban sustainability: Insights from the Citizens Science for Sustainability (SuScit) Project. Technol. Forecast. Soc. Chang. 2011, 78, 769–784. [Google Scholar] [CrossRef]
  35. Ungar, M. Community resilience for youth and families: Facilitative physical and social capital in contexts of adversity. Child. Youth Serv. Rev. 2011, 33, 1742–1748. [Google Scholar] [CrossRef]
  36. Shi, C.; Liao, L.; Li, H.; Su, Z. Which urban communities are susceptible to COVID-19? An empirical study through the lens of community resilience. BMC Public Health 2022, 22, 70. [Google Scholar] [CrossRef]
  37. Zou, B.H.; Chen, S.T.; Liu, F.; Ran, X.Y. A study on factors influencing community resilience. Ind. Technol. Forum 2019, 14, 103–105. [Google Scholar]
  38. Li, Y.C.; Xie, Y. Research on the resilience of old urban communities in the prevention and control of new crown epidemics. J. Econ. Res. 2022, 18, 55–57. [Google Scholar]
  39. Gao, S.W.; Luo, J.; Ye, Y.C. Problems and reflections on community governance of Baibuting, Wuhan under the new crown epidemic, Spatial governance for high-quality development. In Proceedings of the 2020 China Urban Planning Annual Conference (19 Housing and Community Planning), Chengdu, China, 25 September 2021. [Google Scholar]
  40. Zhang, Q.; Song, Q.L. Promoting the modernization of party-led grassroots community resilience governance capacity. China Emerg. Manag. Sci. 2021, 6, 4–12. [Google Scholar]
  41. Zhou, X.H.; Lu, M.H. Optimization of the path of community media participation in community governance in the context of epidemic prevention and control: Evolutionary resilience and technological embedding. Adm. Law 2021, 38, 28–43. [Google Scholar]
  42. Li, T.; Hu, C.N. Construction of community resilient epidemic prevention system based on the perspective of smart city. Urban Hous. 2020, 27, 85–88. [Google Scholar]
  43. Wang, J.; Lei, X.K. How to achieve resilience capacity: Structural adaptation and functional compounding of community risk governance. J. Northwestern Univ. Philos. Soc. Sci. Ed. 2021, 51, 106–116. [Google Scholar]
  44. Huang, X.T.; Yu, H.H.; Zheng, C.C.; Yang, J.Z.; Wang, W.H. A preliminary study of secondary school students’ coping styles. Psychol. Sci. 2000, 37, 124. [Google Scholar]
  45. Zhang, G.L.; Yu, W.G. Coping with risks in modern society: Thinking about social policy based on risk distribution. Soc. Sci. Res. 2008, 30, 120–123. [Google Scholar]
  46. Tong, X. Responding to systemic risks with network-based governance. Eng. Res. Eng. Interdiscip. Perspect. 2015, 7, 188–197. [Google Scholar]
  47. Zheng, W.G. What to do in the community before a strong risk disaster. Community 2009, 9, 40–41. [Google Scholar]
  48. Gao, Q.L.; You, Y.L. Analysis of comparative advantages and role mechanism of urban and rural communities in public emergency management. Theory Mon. 2010, 32, 143–145. [Google Scholar]
  49. Liu, Y.; Zhang, J.R. Action choice and response of the public in risk society facing environmental risks. Soc. Sci. Front. 2015, 38, 184–192. [Google Scholar]
  50. Shi, K.; Fan, H.X.; Jia, J.M.; Li, W.D.; Song, Z.L.; Gao, J.; Chen, X.F.; Lu, J.F.; Hu, W.P. Risk perception and psychological behavior of SARS information among Chinese people. J. Psychol. 2003, 69, 546–554. [Google Scholar]
  51. Zhu, H.G. On community resilience in a risk society. J. Nanjing Univ. Philos. Humanit. Soc. Sci. Ed. 2012, 49, 47–53. [Google Scholar]
  52. Helslootn, I.; Ruitenbergnn, A. Citizen Response to Disasters: A Survey of Literature and Some Practical Implications. J. Contingencies Crisis Manag. 2004, 12, 98–111. [Google Scholar] [CrossRef]
  53. Lazarus, R.S.; Folkman, S. Stress, Appraisal and the Coping Process, 1st ed.; Springer: New York, NY, USA, 1984; p. 654. [Google Scholar]
  54. Ayers, T.S.; Sandler, I.N.; Twohey, J.L. Conceptualization and Measurement of Coping in Children and Adolescents. Adv. Clin. Child Psychol. 1998, 1, 243–301. [Google Scholar]
  55. Connorsmith, J.K.; Compas, B.E.; Wadsworth, M.E.; Thomsen, A.H.; Saltzman, H. Responses to stress in adolescence: Measurement of coping and involuntary stress responses. J. Consult. Clin. Psychol. 2000, 68, 976–992. [Google Scholar] [CrossRef]
  56. Jiang, Q.J.; Huang, L.; Lu, R.S.; Lou, Z.S.; Yang, A.R.; Chen, H.; Mao, Z.X. Psychological stress: Classification of coping and psychosomatic health. J. Chin. Ment. Health 1993, 7, 145–147+190. [Google Scholar]
  57. Tierney, K.J.; Lindell, M.K.; Perry, R.W. Facing the Unexpected: Disaster Preparedness and Response in the United States, Natural Hazards and Disasters; Joseph Henry Press: Washington, DC, USA, 2001; pp. 33–36. [Google Scholar]
  58. Perry, R.W.; Lindell, M.K. Understanding Citizen Response to Disasters with Implications for Terrorism. J. Contingencies Crisis Manag. 2003, 11, 48–59. [Google Scholar] [CrossRef]
  59. Tobin, G.A. Sustainability and community resilience: The holy grail of hazards planning. Environ. Hazards 1999, 1, 13–25. [Google Scholar]
  60. Wu, X.L.; Xie, Y.Y. Research on resilient communities based on urban public safety. Tianjin Soc. Sci. 2018, 38, 87–92. [Google Scholar]
  61. Wei, Q.G.; Liu, W. Disaster shocks, community resilience and development confidence of urban and rural residents—An empirical analysis based on a survey in ethnic areas of Yunnan. China Rural Obs. 2020, 41, 70–89. [Google Scholar]
  62. Eisenman, D.P.; Glik, D.; Gonzalez, L.; Maranon, R.; Zhou, Q.; Tseng, C.H.; Asch, S.M. Improving Latino disaster preparedness using social networks. J. Am. Prev. Med. 2009, 49, 512–517. [Google Scholar] [CrossRef]
  63. Woolcock, M. Social Capital and Economic Development: Toward a Theoretical Synthesis and Policy Framework. Theory Soc. 1998, 27, 151–208. [Google Scholar] [CrossRef]
  64. Wang, S.T.; Gu, Y.J. Analysis of the interaction between public crisis management and social capital. Sci. Technol. Manag. 2005, 26, 125–128. [Google Scholar]
  65. Peng, Z.C.; Cao, F.; Li, H.L.; Shao, D.K. A new theoretical framework and index system for social stability risk assessment in China from the perspective of social-ecological system governance. Public Manag. Rev. 2013, 17, 43–60. [Google Scholar]
  66. Zhang, H.B. System downward extension and individual capacity: Exploration of emergency correlation mechanism—An empirical study based on 1252 rural residents in Jiangsu Province. China Adm. 2013, 29, 99–105. [Google Scholar]
  67. Caurentelli, E.L.; Sheng, X.W. The management of disaster crisis. Disaster Sci. 1992, 7, 88–92. [Google Scholar]
  68. Ma, Q.G.; Wang, S.Y. Analysis and mathematical description of the factors influencing the state of parties in unconventional emergencies. J. Manag. Eng. 2009, 22, 126–130. [Google Scholar]
  69. Yang, X.D. Review of the theory of risk society. J. Natl. Sch. Adm. 2005, 7, 87–90. [Google Scholar]
  70. Zhao, Y.D. Interpreting the theory of “risk society”. J. Nat. Dialect. Res. 2007, 23, 80–83+91. [Google Scholar]
  71. Chen, P. The realistic dilemma and stage characteristics of social governance under the perspective of risk society. J. Fujian Adm. Coll. 2016, 31, 114–120. [Google Scholar]
  72. Ge, T.R.; Xue, L. Social risk and grassroots community governance: Problems, concepts and countermeasures. Soc. Gov. 2015, 1, 37–43. [Google Scholar]
  73. Wang, X.Z.; Feng, T. Risk, individuation and social governance. J. Guizhou Univ. Natl. Philos. Soc. Sci. Ed. 2014, 51, 27–32. [Google Scholar]
  74. Nelson, D.R.; Adger, W.N.; Brown, K. Adaptation to Environmental Change: Contributions of a Resilience Framework. J. Annu. Rev. Environ. Resour. 2007, 32, 395–419. [Google Scholar] [CrossRef]
  75. Alam, E.; Al Abdouli, K.; Khamis, A.H.; Bhuiyan, H.U.; Rahman, K.A. Public Trust in COVID-19 Prevention and Responses Between January and May 2020 in Bangladesh. Risk Manag. Healthc. Policy 2021, 14, 4425–4437. [Google Scholar] [CrossRef]
  76. Tobin, G.A. Disasters and Resettlement: Social Networks as Global Indicators. In Proceedings of the Annual Meeting of the Society for Applied Anthropology, Baltimore, MD, USA, 3 May 2012. [Google Scholar]
  77. Tang, J.; Li, Y.Q.; Xiong, Z.W.; Song, X.D.; Hu, B.; Zhang, Y.H.; Liu, X.L.; Liu, J.X.; Liu, M.Y. A study on the modernization of major public health emergencies and governance. SAR Pract. Theory 2020, 32, 5–17. [Google Scholar]
  78. Qin, R.Y.; Yan, X.P. Exploring urban community change in the process of urbanization—Shenzhen as an example. Mod. Urban Res. 2013, 28, 72–93. [Google Scholar]
  79. Xiao, R.K. Family background, cultural capital and educational acquisition. Educ. Acad. Mon. 2016, 33, 12–41. [Google Scholar]
  80. Sun, M.; Wang, C. A study on the impact of family capital on children’s educational attainment. J. Popul. 2021, 43, 99–112. [Google Scholar]
Figure 1. Theoretical framework diagram.
Sustainability 14 10159 g001
Figure 2. Comparison chart of the three major communities.
Sustainability 14 10159 g002
Figure 3. Action-logic diagram.
Sustainability 14 10159 g003
Table 1. Objective Indicator Measures of Community Resilience.
Scale NameDefinitionLiterature
Location-based community resilience modelGeographical location, economic development, ecological environment, infrastructure developmentCutter et al., 2008 [15]
Baseline Resilience Indicators for CommunitiesSocial resilience: education, aging, health insurance ownership
Economic resilience: employment rate, per capita income, homeownership rate
Institutional resilience: disaster-mitigation planning, municipal spending
Infrastructure resilience: housing type, hospital beds, housing construction time
Community capital: resident linkages
Cutter et al., 2010 [20]
Community Disaster-Resilience IndexEconomic capital: per capita income, employment rate, health insurance ownership rate
Social capital: non-profit organizations, business associations
Physical capital: public services, housing, hospital beds
Human capital evaluation: education of residents
Peacock et al., 2010 [21]
Capacities for Community Resilience IndexEconomic development: economic level, economic stock, economic diversity
Social capital: social support
Information exchange: Internet and intelligence level
Community competitiveness: community participation, community relations
Sherrieb et al., 2010 [18]
Community Resilience IndexSocial resilience: education, age, health insurance, social capital
Economic resilience: housing, employment rates, income levels
Institutional resilience: disaster-mitigation planning, municipal investment, disaster-preparedness education
Physical resilience: number of shelters, timing and location of housing construction
Ainud-din et al., 2012 [22]
Action-oriented Resilience AssessmentPhysical resilience: infrastructure
Economic resilience: employment, financial capital
Social resilience: disaster preparedness, health-care levels
Institutional resilience: governance mechanisms, stakeholder cooperation, environmental policies
Natural resilience: ecosystem services
Joerin et al., 2012 [23]
Index of Adaptive CapacitySocioeconomic: poverty, industrial characteristics
Sociopolitical: social capital
Socioecological: resource dependency, infrastructure
Maldonado et al., 2014 [24]
Table 2. Subjective Indicator Measures of Community Resilience.
Scale NameDefinitionLiterature
Community Resilience ScaleEconomic leakage effects, network relationships and trust among community members, institutional flexibility, local leadership control and power sharing, local infrastructure conditionsHolladay et al., 2013 [26]
Resilience Scale of Tourism EnterprisesCommunity’s ability to adapt to change, confidence in the future, options to engage in tourism, future livelihoods, ability to withstand future changesBiggs et al., 2012 [27]
Conjoint Community Resiliency Assessment MeasureLeadership, collective effectiveness, disaster preparedness, local attachment, and social trustCohen et al., 2013 [28] and Leykin et al., 2013 [29]
Social Resilience ScaleRisk perception; ability to plan, learn and reorganize; ability to handle change and level of interest in changeMarshall et al., 2007 [30]
Capacity for Change Programme ScaleIndividual social resilience, individual economic resilience, community social resilience, and community economic resilienceSteiner et al., 2014 [31]
Household Resilience ScaleFarmers’ confidence in coping with natural disasters, farmers’ confidence in surviving after disasters, farmers’ interest in new production methodsNguyen et al., 2013 [32]
Index of Perceived Community ResiliencyLeadership and empowerment, community engagement, negative geographic-feature perceptionKulig et al., 2013 [33]
Table 3. Classification of community types in Shenzhen.
TypeDefinitionCharacteristics
Mixed communityMainly refers to the old urban areas of Luohu District and Futian District, which were built before the 1990s as residential areas for unit workers and old town residentsClose social structure, complex social ties between residents, strong interpersonal interaction between neighbors
Urban communityMainly refers to the commercialized residential areas developed and built after the 1990sCommunity management is good, the residents are mainly foreign with high comprehensive quality and general population mobility
Transition communityTransitional communities, also known as “village to residence” communities, are communities that have been transformed from rural to urban communitiesThe residents are highly mobile and heterogeneous, and there is a lack of various facilities. The community has more potential problems than other urban communities
Table 4. Descriptive analysis of demographic variables.
Individual CharacteristicsNumber of PeoplePercentage
GenderMale106647.25%
Female119052.75%
AgeUnder 18 years old1165.14%
18–25 years old37616.67%
26–35 years old59226.24%
36–45 years old72031.91%
46–59 years old31013.74%
60 years old and above1426.29%
Education levelPrimary school and below1928.51%
Middle school35215.60%
High school/junior high school24410.82%
College/high School61627.30%
Bachelor’s degree and above85237.77%
Political AppearanceMembers of the CPC (including reserve members)92240.87%
Members of democratic parties160.71%
Members of the Communist Youth League23410.37%
The masses108448.05%
Occupational categoryState-owned and public institutions61227.13%
Private enterprises78034.57%
Individuals/freelancers43219.15%
Students1466.47%
Unemployed and others28612.68%
Table 5. Rotating Component Matrix of Community Resilience.
IndicatorsDimension 1Dimension 2
Strictly closed community management 0.889
Community environmental disinfection 0.928
Community-based services 0.929
Intelligent level of community epidemic prevention 0.912
Community immunization funding/technology/materials/service levels 0.917
Communication of information 0.911
Community preparedness for epidemics 0.917
Community resilience 0.904
Confidence in community work0.920
Equity in community services0.927
Community participation0.917
Community staff capacity0.934
Sense of community belonging0.920
Consular relations0.924
In an emergency, residents can be called for help0.934
Confidence in community development0.918
Cumulative contribution of factors (%)45.50990.158
Table 6. Rotating Component Matrix of Resident Coping Style.
IndicatorsDimension 1Dimension 2
Performing personal protection0.836
Conscientious compliance with the epidemic prevention policy0.875
Actively cooperating with the prevention and control of the epidemic situation0.873
Being proactive about prevention and control dynamics, knowledge0.881
Proactive reporting0.905
Caring for the vulnerable0.908
Sacrificing personal interests0.901
Waiting and seeing what happens 0.849
Praying to the heavens and doing nothing for COVID-19 protection 0.877
Diverting attention 0.872
No proactive measures 0.808
Moving out of the current community 0.772
Cumulative contribution of factors (%)51.36388.993
Table 7. Pearson correlation coefficient table.
Governance PerformanceCommunity CohesionCommunity ResilienceProactive Response to RiskEvasive Response to Risk
Governance performance1
Community cohesion0.486 ***1
Community resilience0.847 ***0.876 ***1
Proactive response to risk0.804 ***0.720 ***0.882 ***1
Evasive response to risk−0.661 ***−0.572 ***−0.712 ***−0.724 ***1
Note: *** represents signifificance at the 1% level.
Table 10. Comparison results of the analysis of variance for clustering categories.
Transition
Community
(n = 340)
Mixed
Community
(n = 1056)
Urban
Community
(n = 860)
Fp
Governance performance1.48 ± 0.493.30 ± 0.854.23 ± 0.59908.3780.000 ***
Community cohesion1.04 ± 0.214.23 ± 0.783.71 ± 0.611523.2830.000 ***
Community resilience1.26 ± 0.263.77 ± 0.483.97 ± 0.512253.1040.000 ***
Proactive response to risk1.59 ± 0.744.10 ± 0.714.34 ± 0.471240.0220.000 ***
Evasive response to risk4.94 ± 0.332.46 ± 0.811.96 ± 0.84938.6970.000 ***
Note: *** represents signifificance at the 1% level.
Publisher’s Note: MDPI stays neutral with regard to jurisdictional claims in published maps and institutional affiliations.

