Article

High Seroprevalence of SARS-CoV-2 in Mwanza, Northwestern Tanzania: A Population-Based Survey

1
Department of Microbiology and Immunology, Weill Bugando School of Medicine, Catholic University of Health and Allied Sciences, Mwanza P.O. Box 1464, Tanzania
2
National Public Health Laboratory, Dar es Salaam P.O. Box 9083, Tanzania
3
East Central and Southern Africa Health Community, Arusha P.O. Box 1009, Tanzania
4
Infection Control and Antimicrobial Sterwardship Unit, University Hospital Wuerzburg, 97080 Wüerzburg, Germany
5
Department of Epidemiology and Biostatistics, School of Public Health, Catholoic University of Health and Allied Sciences, Mwanza P.O. Box 1464, Tanzania
*
Author to whom correspondence should be addressed.
Int. J. Environ. Res. Public Health 2022, 19(18), 11664; https://doi.org/10.3390/ijerph191811664
Submission received: 6 July 2022 / Revised: 3 September 2022 / Accepted: 7 September 2022 / Published: 16 September 2022

Abstract

:
The transmission of the SARS-CoV-2 virus, which causes COVID-19, has been documented worldwide. However, the evidence of the extent to which transmission has occurred in different countries is still to be established. Understanding the magnitude and distribution of SARS-CoV-2 through seroprevalence studies is important in designing control and preventive strategies in communities. This study investigated the seropositivity of the SARS-CoV-2 virus antibodies in the communities of three different districts in the Mwanza region, Tanzania. A household cross-sectional survey was conducted in September 2021 using the modified African Centre for Disease and Prevention (ACDC) survey protocol. A blood sample was obtained from one member of each of the selected households who consented to take part in the survey. Immunochromatographic rapid test kits were used to detect IgM and IgG SARS-CoV-2 antibodies, followed by descriptive data analysis. Overall, 805 participants were enrolled in the study with a median age of 35 (interquartile range (IQR):27–47) years. The overall SARS-CoV-2 seropositivity was 50.4% (95%CI: 46.9–53.8%). The IgG and IgM seropositivity of the SARS-CoV-2 antibodies was 49.3% and 7.2%, respectively, with 6.1% being both IgG and IgM seropositive. A history of runny nose (aOR: 1.84, 95%CI: 1.03–3.5, p = 0.036), loss of taste (aOR: 1.84, 95%CI: 1.12–4.48, p = 0.023), and living in Ukerewe (aOR: 3.55, 95%CI: 1.68–7.47, p = 0.001) and Magu (aOR: 2.89, 95%CI: 1.34–6.25, p= 0.007) were all independently associated with SARS-CoV-2 IgM seropositivity. Out of the studied factors, living in the Ukerewe district was independently associated with IgG seropositivity (aOR 1.29, CI 1.08–1.54, p = 0.004). Twenty months after the first case of COVID-19 in Tanzania, about half of the studied population in Mwanza was seropositive for SARS-CoV-2.

1. Introduction

The coronavirus disease of 2019 (COVID-19), caused by the severe acute respiratory syndrome coronavirus-2 (SARS-CoV-2), still poses a major threat in healthcare facilities and is regarded as the most important public health problem worldwide. Cases of COVID-19 have been reported by 55 African member states and the local transmission has been well documented in most places [1,2]. Africa accounts for 17% of the global population; however, by late May 2021, it accounted for only 2.82% of the global COVID-19 cases and 3.7% of the global COVID-19 deaths reported [3]. This disparity has been attributed to a limited capacity for diagnosis, timely implementation of stringent containment measures, a younger population structure, and a predominance of asymptomatic and mild infections [4]. Since the index case of COVID-19 in Tanzania on 16 March 2020 [5], there have been no seroprevalence studies in the region of Mwanza to estimate the magnitude of the SARS-CoV-2 infections.
In low- and middle-income countries (LMICs), such as Tanzania, important public health measures, including social distancing or a lockdown, are difficult to implement owing to socioeconomic constraints. The testing capacity has increased substantially over a short period in different countries, but taking into considerations that most cases are asymptomatic or with mild symptoms, the actual spread of infections has not been able to be established [6].
Understanding the extent of the SARS-CoV-2 spread is particularly important for guiding COVID-19 mitigation efforts in light of the situation in Tanzania, whereby the handling of the COVID-19 pandemic took different turns [7]. The seroprevalence of SARS-CoV-2 worldwide differs from one country to another and among different populations in the same country [8]. However, the seroprevalence of SARS-CoV-2 in Africa has been found to range from 19.7% to 26% [9,10] in sub-Saharan Africa.
Different factors, such as limited access to healthcare and COVID-19 testing, limited surveillance, and lack of knowledge about SARS-CoV-2 infections amongst the population, have been reported to mediate the spread of SARS-CoV-2 [7]. However, these are not isolated challenges for Africa and may have a major role in the way SARS-CoV-2 spreads and behaves [11]. SARS-CoV-2 serosurvey data are critical for planning effective mitigation strategies and understanding the actual spread of the virus causing COVID-19 [12].
This study is aimed at looking at the serological prevalence of SARS-CoV-2 using the Africa Center for Disease Control and Prevention generic study protocol, which was meant to assist the African Union Member States in conducting standardized serological prevalence surveys. The information gained from these surveys will provide critical insight into the transmission and impact of the virus in Africa.

2. Materials and Methods

2.1. Study Design and Target Population

This was a cross-sectional, population-based serosurvey involving household members aged 5 years or above, regardless of their previous or current infection with COVID-19, who resided in the Magu, Misungwi, and Ukerewe districts in the Mwanza region during the period of transmission of SARS-CoV-2.
The estimated total population of Mwanza is about 3,122,992 (National Bureau of Statistics, 2016).

2.2. Study Area

The study was performed in Mwanza, Tanzania. The Mwanza region comprises of 8 district councils, whereby 7 of them are on the mainland. The study was performed in 3 out of the 8 district councils of the Mwanza region, Tanzania. The selection of the districts was based on the geography of the region and the administrative level of the specific districts. The aim was to include both Mwanza, mainland and island, thus, we selected two districts that are within mainland Mwanza, specifically Misungwi and Magu, and the Ukerewe Island. The Misungwi district was selected because it could be reached not only through the roads but also the railway (Central Railway Line), while Magu can only be reached via the roads. Ukerewe can only be reached via the waterway. Misungwi being a semi-urban district while Magu being a rural was another reason for the selection in order to have a presentation for both semi-urban and rural populations in the region.

2.3. Sample Size Estimation and Sampling Technique

The Kish Leslie formula was used to estimate the sample size using a prevalence of 22.3% from a previous study performed in Juba, Southern Sudan [12]. The estimated minimum sample size was 267. However, a total of 805 participants were enrolled. Using a randomized multi-stage cluster sampling technique, 3 districts were conveniently selected. The 3 ward administrative units were randomly selected from each of the selected districts. In each of the selected administrative wards, 3 villages were selected, thus, making 9 villages in total. Within each selected village, 10 communities were randomly selected using simple random sampling. In each community, 10 households underwent a random selection from the number of households provided. A member from the selected household of the age of 5 years and above was randomly selected to take part in a survey, which was expected to enroll 900 participants; however, 805 consented to participate in the study. A group of people (2 or more) living in the same compound was [13] regarded as a household.

2.4. Eligibility Criteria

2.4.1. Inclusion Criteria

All household members aged 5 years and above were recruited for the investigation without taking into consideration their prior, recent, or current SARS-CoV-2 infection or current illness. The enrollments involved only the household members who have been residing in the study area during the period between March 2020 (the first case of SARS-CoV-2 was reported in March 2020 in Tanzania) and the date of enrollment and were able to give informed consent for those above the age of 18 and above. For children under the age of 18 years, their legal guardians were requested to give consent in the presence of a third party (witnesses).

2.4.2. Exclusion Criteria

Household members who received any of the COVID-19 vaccines were excluded from the study.

2.5. Sample Collection

About 5 milliliters of blood were drawn by venipuncture from each of the selected members in each household once they consented to take part in the study. The blood was drawn by a trained phlebotomist, and it was collected in plain vacutainer tubes. The collected whole blood in the vacutainer tube was centrifuged at 2000 revolutions per minute for 15 min to obtain the sera. The sera were stored at −80 °C until they were processed.

2.6. Serological Testing

The tested sera were screened for both IgM and IgG SARS-CoV-2 specific antibodies using a RADI COVID-19 IgG/IgM rapid test kit (KH Medics, Limited, Gyeonggi-do, Republic of Korea) with a sensitivity and specificity of 90% and 100%, respectively. All tests were performed following the guidelines written by the manufacturer; the quality control (QC) directives were followed accordingly. The test results were interpreted according to the manufacturer’s instructions. The SOPs during the pre-analytical, analytical, and post-analytical were observed throughout the study period. Known standard panels were part of the test assessments (Supplementary File S1).

2.7. Survey Data Collection

Social demographic data and data regarding previous history of signs and symptoms suggestive of SARS-CoV-2 infections or COVID-19 were collected using a standardized data collection tool.

2.8. Data Analysis

A descriptive statistical analysis was conducted using STATA, version 12 (StataCorp LLC 4905 Lakeway Drive, College Station, TX, USA)
USA. Proportions were calculated for the categorical variables, and the median with an interquartile range was analyzed for the continuous data. A chi-square was used to test for the association between the categorical variables and the outcomes. Univariate and multivariate regression analyses were performed to assess the factors associated with the IgG and IgM seropositivity. The analysis of the factors associated with the IgG and IgM seropositivity was performed using bivariate analysis; factors with a p value of less than 0.5 were further analyzed in multivariate analysis, and variables with a p value of less than 0.05 were considered statistically significant.

2.9. Infection Prevention Measures against SARS-CoV-2 Infection Taken during Data Collection

All members of the research team involved had training in infection prevention and control measures. All research assistants were required to observe the hand hygiene between participants, the wearing of surgical masks, and observe the social distancing during the data collection.

3. Results

A total of 805 participants took part in the survey. The median age of the participants was 35 (IQR: 26–47) years. More than half of the participants, 56.9% (458), were males (see Table 1).

3.1. Previous History of Signs and Symptoms of COVID-19

Of the clinical signs and symptoms assessed, more than two thirds of the participants, 68.7% (553), reported no history of fever. The majority, 88.4% (712), reported no history of sore throat (see Table 2).

3.2. History of Chronic Illness

The majority of the participants had no history of chronic diseases or conditions, such as diabetes mellitus, 96.3% (775), sickle cell anemia, 99.4% (800), and hypertension, 95.5% (769). Almost all of the participants had no history of renal diseases, 99% (798), and cancer, 99% (797) (see Table 3).

3.3. Seroprevalence of SARS-CoV-2 Antibodies

The overall SARS-CoV-2 seropositivity was 50.4% (95%CI: 46.9–53.8) (406/805). The IgG and IgM seropositivity of the SARS-CoV-2 antibodies was 397 (49.3%) and 58 (7.2%), respectively, with 49 (6.1%) being both IgG and IgM seropositive, as shown in Figure 1.

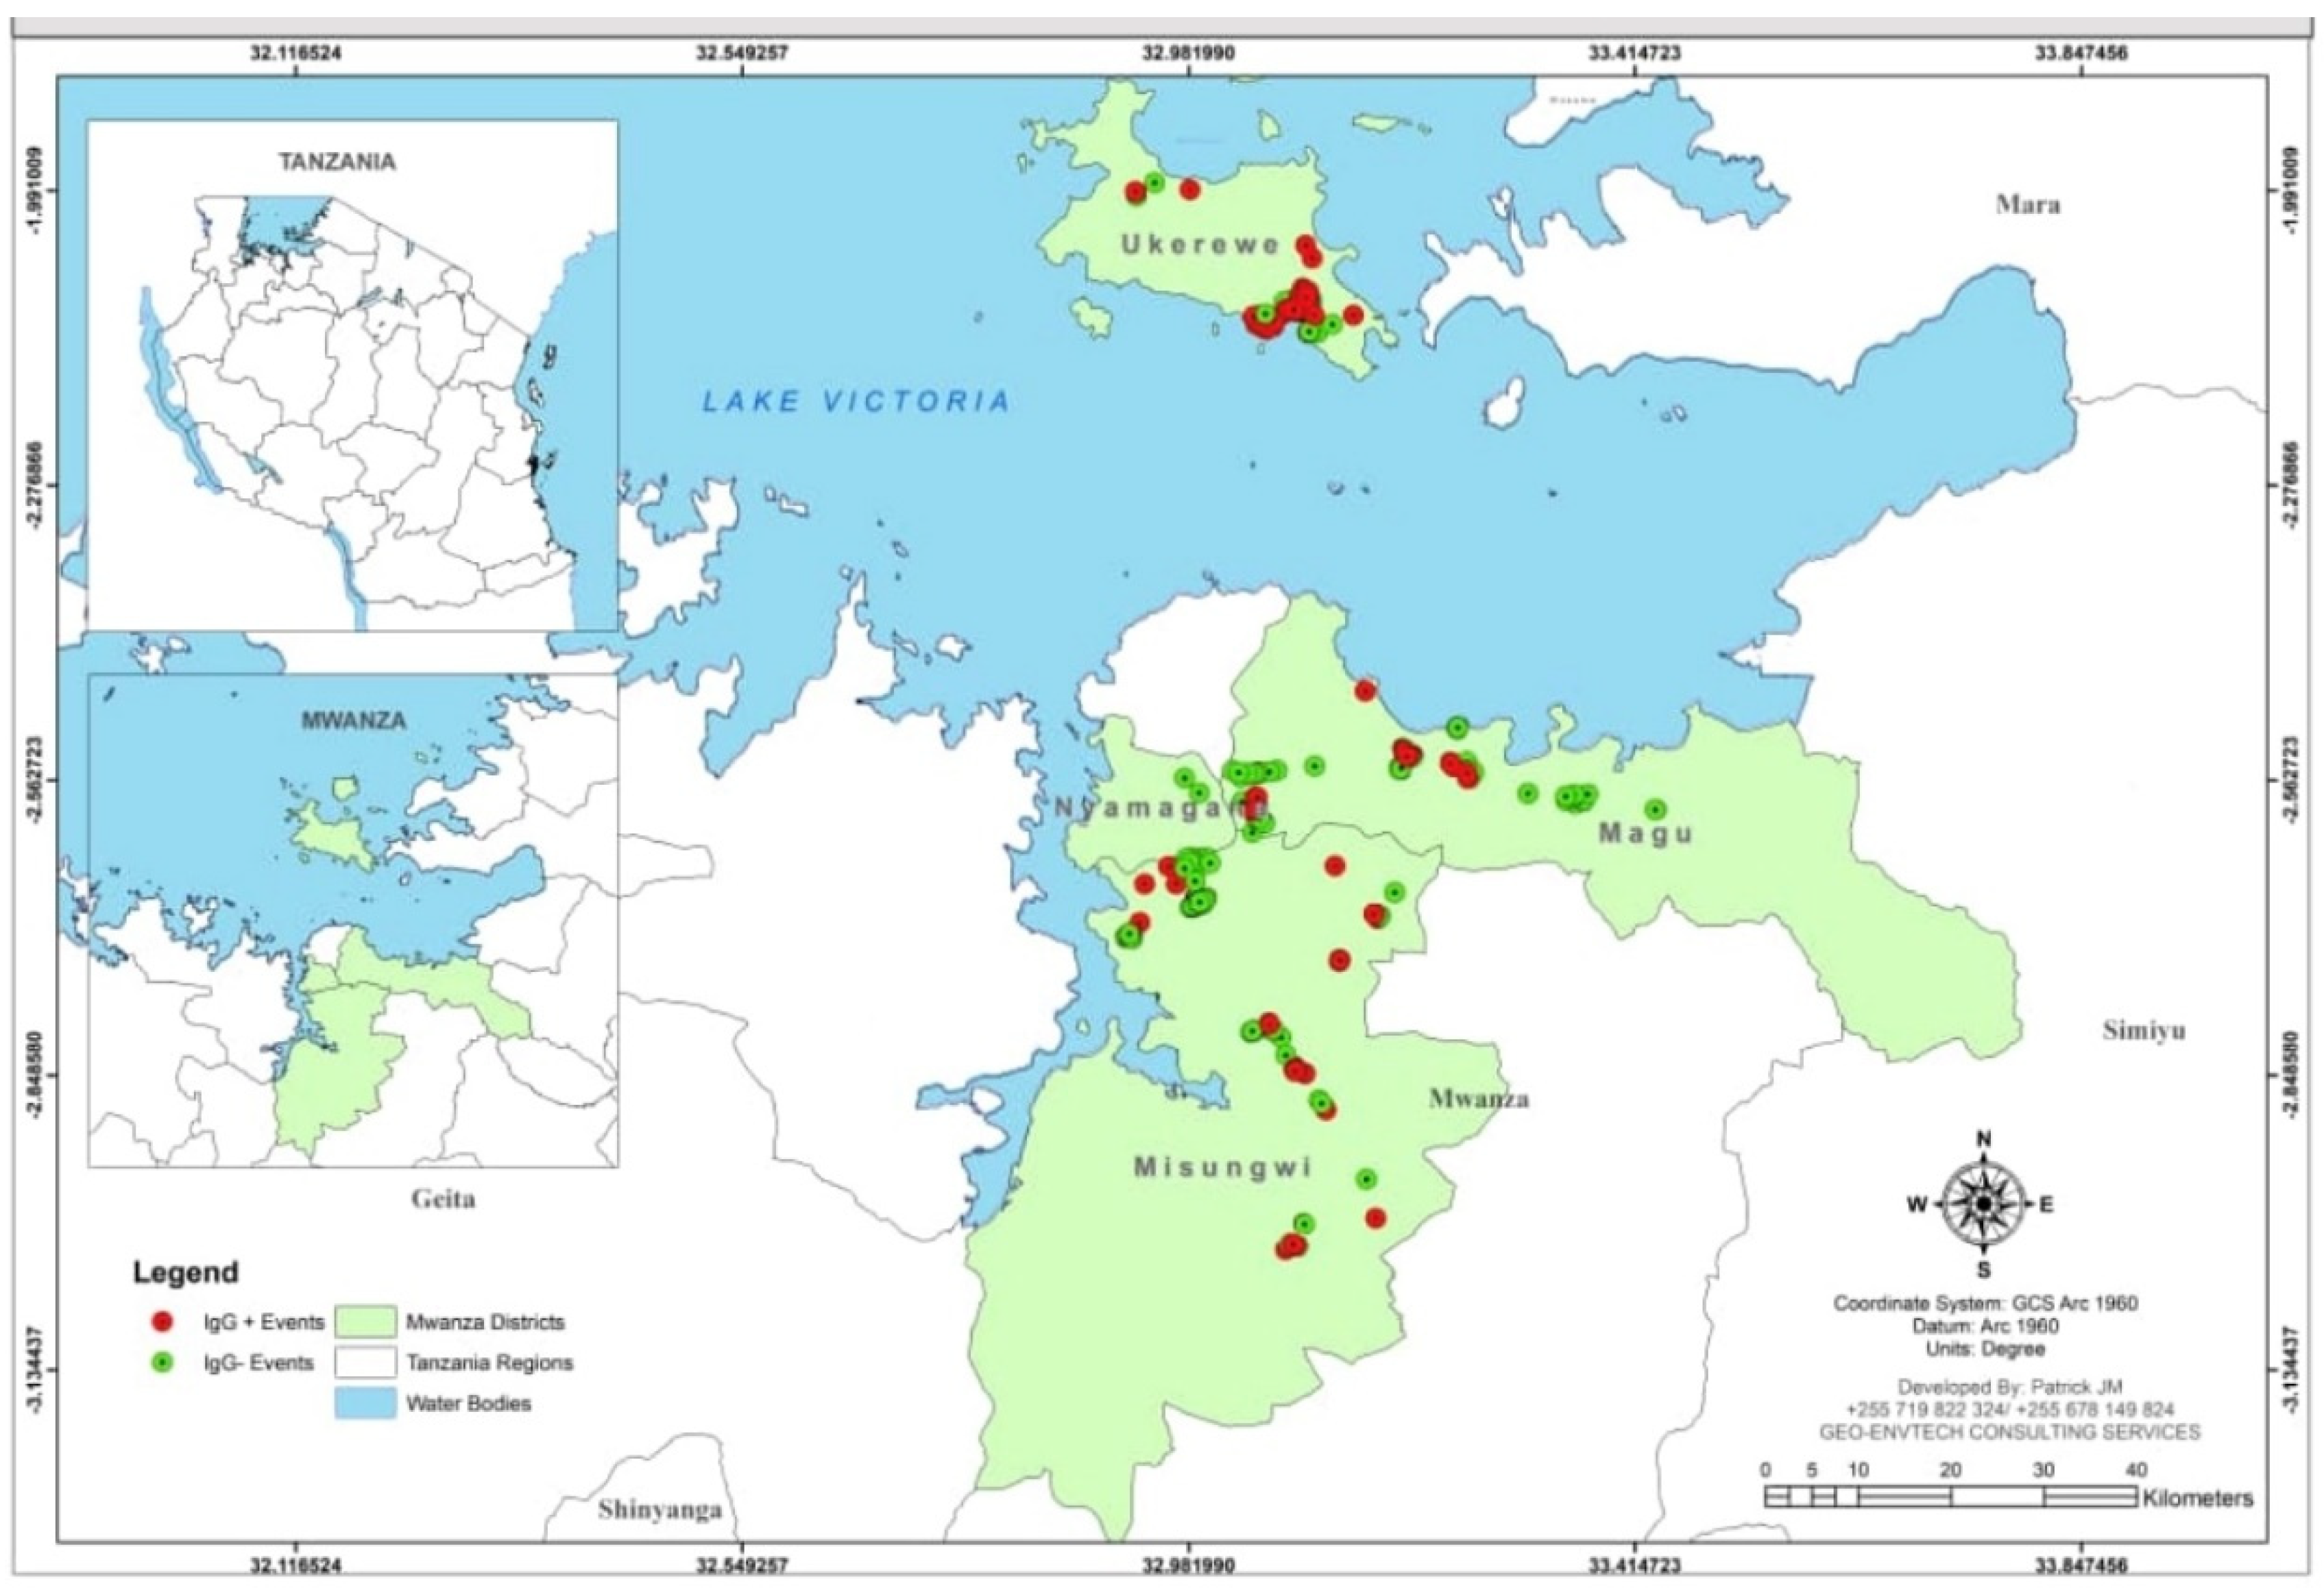
3.4. Geographical Distribution of the Participants Who Tested for IgG against SARS-CoV-2

The clustering of the IgG positivity was observed in the two mainland districts of Magu and Misungwi, with similar observations in the island district of Ukerewe (Figure 2).

3.5. Factors Associated with IgG Seropositivity among the Participants

According to the bivariate analysis, only living in the Ukerewe district was associated with IgG seropositivity among the participants. According to the multivariate analysis, living in Ukerewe was independently associated with IgG seropositivity (adjusted odds ratio (aOR) 1.29, 95% confidence interval (CI) I 1.08–1.54, p value 0.004) (see Table 4).

3.6. Factors Associated with SARS-CoV-2 IgM Seropositivity among the Participants

According to the bivariate analysis, sex, district, history of runny nose, and history of loss of taste were significantly associated with IgM seropositivity. All remained significant in the multivariate logistic regression analysis as follows: history of runny nose (aOR 1.84, 95%CI 1.03–3.5 and p-value 0.036), history of loss of taste (aOR 1.84, 95%CI 1.12–4.48 and p-value 0.023), Magu district (aOR 2.89, 95%CI 1.34–6.25, p-value 0.007), and Ukerewe district (aOR 3.55, 95%CI 1.68–7.47, p-value 0.001) were independently associated with SARS-CoV-2 IgM seropositivity among the participants who took part in the study (see Table 5).

4. Discussion

The seroprevalence survey is an important method for estimating the actual burden of a disease. The specific IgM and IgG markers in the blood are key in establishing the extent of an infectious disease. The markers can indicate recent and past infections, showing the real magnitude of a disease in a given population. In this population-based sero-surveillance study, it was observed that in Mwanza, Tanzania about half of the population studied was SARS-CoV-2 seropositive. This seroprevalence was observed 20 months after the first case of COVID-19 was announced in Tanzania.
None of the study participants had received a COVID-19 vaccine, indicating that the presence of anti-spike protein antibodies was due to a previous infection. The findings in the current study, for which the seropositivity was 50.4% with an IgG seroprevalence of 49.3%, are consistent with the study performed in Gauteng, South Africa, which reported an IgG seroprevalence of 56.2% [14], and the recent results from Zanzibar, Tanzania, which reported a seroprevalence of 58.9% before the omicron wave [15]. However, studies that were performed among the East African countries of Kenya, the Democratic Republic of Congo, and South Sudan reported a low seroprevalence, ranging from 18.6–26.7% [12,16,17]. This could be due to the fact that these studies were performed during the first and second COVID-19 waves, while the current study was performed in the third wave. Furthermore, compared to other East African countries, Tanzania did not take stringent measures to control the spread of SARS-CoV-2, such as a complete lockdown.
The IgM seropositivity was found to be relatively low, at 7.2%, indicating that less than 10% of the participants had recent infections. Similar studies in other African countries reported almost a similar level of IgM seropositivity, which was between 6.3% and 11.6% Slight deviations have been observed depending on the variations in the SARS-CoV-2 waves at which the studies were performed [17,18].
This study observed that a recent history of runny nose, a history of loss of taste, and living in the Misungwi and Ukerewe districts were independently associated with SARS-CoV-2 IgM seropositivity among the participants. A number of studies around the world reported loss of taste and smell to be the most common presentation of COVID-19 [19,20]. It is more likely that these participants were recovering from SARS-CoV-2 infections [21,22]. A history of runny nose also independently predicted the IgM seropositivity among the participants who took part in the survey [23].
This study also showed that living in the Ukerewe district was associated with IgG seropositivity. This could be explained by geographical variations since the Ukerewe district is an island, which is usually accessed through the lake, with limited air access. Being an island could lead to high interactions with limited movements within the island with many fishing activities. Furthermore, Nansio, the port town in Ukerewe, serves as the single social and financial hub of the district, with very high interactions among the people in this hub. Thus, people from all over the island come to Nansio to carter to their social and financial needs. Additionally, being a port town makes it more likely to encounter the spread of infections from the mainland districts through the visitors coming to Ukerewe. On the contrary, Magu and Misungwi are mainland districts with easy accessibility to social and economic activities available in the city of Mwanza. In addition, the results are supported by the observed high seroprevalence of 58.9% in the Zanzibar Island, Tanzania before the omicron wave [15]. The IgG results are further supported by the IgM results, showing that the odds of being IgM positive were significantly higher for Ukerewe than for Magu and Misungwi.

Limitation

A limitation of the study is the possibility of cross reactivity of the antibodies of SARS-CoV-2 with other viruses with cross-antigenic similarities. However, based on the manufacturer’s details, the test was found to have 100% specificity, therefore, cross reactivity was unlikely. Due to the fact that the study was conducted in three districts that were conveniently selected, the study might not reflect the levels of IgG and IgM in the population in the Mwanza region.

5. Conclusions

Twenty months after the first case of COVID-19 in Tanzania, about half of the studied population in Mwanza was seropositive for SARS-CoV-2. The IgM seropositivity was associated with a recent history of a runny nose and loss of taste. There is a need for continuing seroprevalence studies to estimate the magnitude and trends of SARS-CoV-2 infections in different populations in Tanzania.

Supplementary Materials

The following supporting information can be downloaded at: https://www.mdpi.com/article/10.3390/ijerph191811664/s1, Supplementary File S1.

Author Contributions

H.A.N., M.M.M., N.M., M.M. and S.E.M. participated in the designing of the study. H.A.N., J.N. and V.S. participated in the data and sample collection. M.M.M., S.E.M., H.A.N. and M.K. participated in the laboratory analysis of samples. H.A.N., E.T.K., M.K. and S.E.M. analyzed and interpreted the data. H.A.N. wrote the first draft of the manuscript. S.E.M., M.M., M.K. and N.M. performed the critical review of the manuscript. All authors have read and agreed to the published version of the manuscript.

Funding

The study received no formal funding. The kits used in this study were donated by the KH Medical Company. The APC was funded by Catholic University of Health and Allied Sciences, Mwanza, Tanzania which was provided to Mshana S.E.

Institutional Review Board Statement

The study was conducted according to the guidelines of the Declaration of Helsinki and approved by the joint Catholic University of Health and Allied Sciences/Bugando Medical Centre (CUHAS/BMC) research ethics and review committee (CREC) with ethical clearance number CREC/492/2021. Permission to conduct the study was sought from the regional admirative secretary, as well as the district executive secretaries in the respective districts. Before being enrolled in the study, the participants were given explanations about the study and its objectives and, those who opted to participate were asked to give written informed consent. Confidentiality was maintained throughout the study.

Informed Consent Statement

Informed consent was obtained from all subjects involved in the study.

Data Availability Statement

All data generated/analyzed during this study are included in this manuscript. Raw data can be obtained upon request from the director of Research and Innovation of the Catholic University of Health and Allied Sciences.

Acknowledgments

The authors acknowledge the assistance provided by administrative officers and workers at the Ukerewe, Misungwi, and Magu districts. Sincere thanks to the third year medical students at CUHAS who participated in some parts of the data collection, as well as the members of the department of Microbiology and Immunology of the Catholic University of Health and Allied Sciences. Lastly, the authors thank Allen Zawadi Shayo for his assistance in producing Figure 2.

Conflicts of Interest

The authors declare no conflict of interest.

References

  1. Musa, H.H.; Musa, T.H.; Musa, I.H.; Musa, I.H.; Ranciaro, A. Since January 2020 Elsevier Has Created a COVID-19 Resource Centre with Free Information in English and Mandarin on the Novel Coronavirus COVID-19. The COVID-19 Resource Centre Is Hosted on Elsevier Connect, The Company’s Public News and Information; Elsevier: Amsterdam, The Netherlands, 2020. [Google Scholar]
  2. Gaye, B.; Khoury, S.; Cene, C.W.; Kingue, S.; N’Guetta, R.; Lassale, C.; Baldé, D.; Diop, I.B.; Dowd, J.B.; Mills, M.C.; et al. Socio-demographic and epidemiological consideration of Africa’s COVID-19 response: What is the possible pandemic course? Nat. Med. 2020, 26, 996–999. [Google Scholar] [CrossRef] [PubMed]
  3. Bell, D.; Hansen, K.S.; Kiragga, A.N.; Kambugu, A.; Kissa, J.; Mbonye, A.K. Predicting the impact of COVID-19 and the potential impact of the public health response on disease burden in Uganda. Am. J. Trop. Med. Hyg. 2020, 103, 1191–1197. [Google Scholar] [CrossRef] [PubMed]
  4. Usuf, E.; Roca, A. Seroprevalence surveys in sub-Saharan Africa: What do they tell us? Lancet Glob. Health 2021, 9, e724–e725. [Google Scholar] [CrossRef]
  5. Tarimo, C.S.; Wu, J. The first confirmed case of COVID-19 in Tanzania: Recommendations based on lesson learned from China. Trop. Med. Health 2020, 48, 25. [Google Scholar] [CrossRef] [PubMed]
  6. Majiya, H.; Aliyu-Paiko, M.; Balogu, V.T.; Musa, D.A.; Salihu, I.M.; Kawu, A.A.; Bashir, Y.I.; Sani, R.A.; Baba, J.; Muhammad, A.T.; et al. Seroprevalence of COVID-19 in Niger State. medRxiv 2020. Available online: https://www.medrxiv.org/content/10.1101/2020.08.04.20168112v1.abstract (accessed on 1 April 2022).
  7. World Bank Group. Tanzania Economic Update: Addressing the Impact of COVID-19 with a special section on the role of ICT. Afr. Reg. Macroecon. Trade Investig. Glob. Pract. 2020, 14, 82. [Google Scholar]
  8. Alkurt, G.; Murt, A.; Aydin, Z.; Tatli, O.; Agaoglu, N.B.; Irvem, A.; Aydin, M.; Karaali, R.; Gunes, M.; Yesilyurt, B.; et al. Seroprevalence of coronavirus disease 2019 (COVID-19) among health care workers from three pandemic hospitals of Turkey. PLoS ONE 2021, 16, e0247865. [Google Scholar] [CrossRef] [PubMed]
  9. Majiya, H.; Aliyu-Paiko, M.; Balogu, V.T. Seroprevalence of SARS-CoV-2 in Niger State: A Pilot Cross Sectional Study. medRxiv 2021. [Google Scholar] [CrossRef]
  10. Mulenga, L.B.; Hines, J.Z.; Fwoloshi, S.; Chirwa, L.; Siwingwa, M.; Yingst, S.; Wolkon, A.; Barradas, D.T.; Favaloro, J.; Zulu, J.E.; et al. Prevalence of SARS-CoV-2 in six districts in Zambia in July, 2020: A cross-sectional cluster sample survey. Lancet Glob. Health 2021, 9, e773–e781. [Google Scholar] [CrossRef]
  11. Chitungo, I.; Dzobo, M.; Hlongwa, M.; Dzinamarira, T. COVID-19: Unpacking the low number of cases in Africa. Public Health Pract. 2020, 1, 100038. [Google Scholar] [CrossRef] [PubMed]
  12. Wiens, K.E.; Mawien, P.N.; Rumunu, J.; Slater, D.; Jones, F.K.; Moheed, S.; Caflish, A.; Bior, B.K.; Jacob, I.A.; Lako, R.L.L.; et al. Seroprevalence of anti-SARS-CoV-2 IgG antibodies in Juba, South Sudan: A population-based study. medRxiv Prepr. Serv. Health Sci. 2021, 1–28. [Google Scholar] [CrossRef]
  13. Africa CDC. Generic Protocol for a Population-Based, Age and Gender-Stratified Sero-Survey Studyf SARS-CoV-2; Africa CDC: Addis Ababa, Ethiopia, 2020. [Google Scholar]
  14. Madhi, S.A.; Kwatra, G.; Myers, J.E.; Jassat, W.; Dhar, N.; Mukendi, C.K.; Nana, A.J.; Blumberg, L.; Welch, R.; Ngorima-Mabhena, N.; et al. Population Immunity and COVID-19 Severity with Omicron Variant in South Africa. N. Engl. J. Med. 2022, 386, 1314–1326. [Google Scholar] [CrossRef] [PubMed]
  15. Salum, S.S.; Sheikh, M.A.; Hebestreit, A.; Kelm, S. Anti SARS-CoV2 seroprevalence in Zanzibar in 2021 before the Omicron wave. medRxiv 2022. [Google Scholar] [CrossRef]
  16. Lobaloba Ingoba, L.; Djontu, J.C.; Mfoutou Mapanguy, C.C.; Mouzinga, F.; Diafouka Kietela, S.; Vouvoungui, C.; Kuisma, E.; Nguimbi, E.; Ntoumi, F. Seroprevalence of anti-SARS-CoV-2 antibodies in a population living in Bomassa village, Republic of Congo. IJID Reg. 2022, 2, 130–136. [Google Scholar] [CrossRef] [PubMed]
  17. Adetifa, I.M.O.; Uyoga, S.; Gitonga, J.N.; Mugo, D.; Otiende, M.; Nyagwange, J.; Karanja, H.K.; Tuju, J.; Wanjiku, P.; Aman, R.; et al. Temporal trends of SARS-CoV-2 seroprevalence during the first wave of the COVID-19 epidemic in Kenya. Nat. Commun. 2021, 12, 3966. [Google Scholar] [CrossRef] [PubMed]
  18. Mahase, E. COVID-19: GPs urge government to clear up confusion over symptoms. BMJ 2021, 373, n1654. [Google Scholar] [CrossRef] [PubMed]
  19. Russell, B.; Moss, C.; Rigg, A.; Hopkins, C.; Papa, S.; Van Hemelrijck, M. Anosmia and ageusia are emerging as symptoms in patients with COVID-19: What does the current evidence say? Ecancermedicalscience 2020, 14, 9–10. [Google Scholar] [CrossRef] [PubMed]
  20. Iskandar, K.; Molinier, L.; Hallit, S.; Sartelli, M.; Hardcastle, T.C.; Haque, M.; Lugova, H.; Dhingra, S.; Sharma, P.; Islam, S.; et al. Surveillance of antimicrobial resistance in low- and middle-income countries: A scattered picture. Antimicrob. Resist. Infect. Control 2021, 10, 63. [Google Scholar] [CrossRef] [PubMed]
  21. Haldrup, M.; Johansen, M.I.; Fjaeldstad, A.W. Anosmia and ageusia as primary symptoms of COVID-19. Ugeskr. Laeger 2020, 182, V04200205. [Google Scholar] [PubMed]
  22. Mermelstein, S. Acute anosmia from COVID-19 infection. Pract. Neurol. 2020, 20, 345–346. [Google Scholar] [CrossRef] [PubMed]
  23. Biadsee, A.; Biadsee, A.; Kassem, F.; Dagan, O.; Masarwa, S.; Ormianer, Z. Olfactory and Oral Manifestations of COVID-19: Sex-Related Symptoms—A Potential Pathway to Early Diagnosis. Otolaryngol. Head Neck Surg. 2020, 163, 722–728. [Google Scholar] [CrossRef] [PubMed]
Figure 1. Venn diagram showing the distribution of serological markers among the participants.
Ijerph 19 11664 g001
Figure 2. Geographical distribution of the participants with SARS-CoV-2 IgG positive in the districts of Misungwi, Magu, and Ukerewe in Mwanza, Tanzania.
Ijerph 19 11664 g002
Table 1. Basic demographic data of the participants.
VariableFrequencies (n)Percentages (%)/Median/IQR
Age(years)80535 (IQR: 26–47)
Sex
Male45856.9
Female34743.1
District of residence
Magu24930.9
Misungwi29736.9
Ukerewe25932.2
Occupation
Business14518.0
Employed5607.0
Farmers44855.7
* Others15619.3
* Housewives and children under the age of 18 years.
Table 2. Previous history of signs and symptoms of SARS-CoV-2 infections.
VariablesFrequenciesPercentages (%)
History of fever
Yes25231.3
No55368.7
History of fatigue
Yes26532.9
No54067.1
History of sore throat
Yes9311.6
No71288.4
History of cough
Yes58527.3
No22072.7
History of runny nose
Yes27534.2
No53065.8
History of shortness of breath(SOB)
Yes526.5
No75393.5
History of wheezing
Yes496.1
No75693.9
History of chest pain
Yes324.0
No77396.0
History of other respiratory symptoms
Yes111.4
No79498.6
History of headache
Yes25932.2
No54667.78
History of smell loss
Yes647.9
No74192.1
History of taste loss
Yes8210.2
No72388.8
History of diarrhea
Yes718.8
No73491.2
Table 3. History of chronic illnesses or conditions among the participants.
VariableFrequency (n)Percentage (%)
History of diabetes
Yes303.7
No77596.3
History of lung diseases
Yes192.4
No78697.6
History of blood pressure
Yes364.5
No76995.5
History of renal diseases
Yes71
No79899
History HIV/AIDs
Yes202.5
No78597.5
On ART
Yes1680
No420
Sickle cell disease
Yes50.6
No80099.4
Cancer
Yes81.0
No79799.0
Table 4. Factors associated with IgG seropositivity.
VariableTotalIgG Seropositivity (n, %)BivariateMultivariate
cOR95%CIp-ValueaOR95%CIp-Value
Age (years)805* 34 (IQR: 26–47)0.9940.985–1.000.260
Sex
Male458(223, 48.69)1
Female347(174, 50.14)1.080.63–1.850.782
District
Magu249(112, 44.98)1
Misungwi297(135, 45.45)1.010.73–1.420.912
Ukerewe259(150, 57.92)1.681.19–2.390.0041.291.08–1.540.004
Occupation
Business145(82, 56.55)1.050.72–1.510.603
Employed56(27, 48.21)1.060.57–1.950.4880.990.54–1.850.993
Farmer448(215, 47.99)1.480.94–2.330.972
Others156(73, 46.79) 1
History of fever
Yes252(127, 50.39)1.160.79–1.430.679
No553(270, 48.82)1
History of fatigue
Yes265(133, 50.18)1.050.56–1.120.193
No540(264, 48.89)1
History of sore throat
Yes93(45, 48.39)0.960.62–1.480.849
No712(352, 49.4)1
History of cough
Yes220(97, 44.09)0.750.55–1.020.069
No585(300, 51.28)1
History of runny nose
Yes275(139, 50.54)1.080.81–1.440.616
No530(258, 48.68)1
History of SOB
Yes52(24, 46.15)0.870.49–1.530.637
No753(373, 49.52)1
History of chest pain
Yes32(15, 46.88) 0.900.44–1.830.778
No773(382, 49.42)1
History of smell loss
Yes64(35, 54.69)1.260.76–2.110.3711.150.67–1.980.601
No741(362, 48.85)1
History of taste loss
Yes82(45, 54.87)1.280.81–2.030.2891.270.78–2.060.331
No723(352, 48.69)1
* Median age of the IgG seropositive participants.
Table 5. Factors associated with IgM positivity.
VariableTotalIgM Seropositivity (n, %)Bivariate AnalysisMultivariate Analysis
cOR95%CIp-ValueaOR95%CIp-Value
Age(years)805* 32.5 (IQR: 25–45)0.9940.976–1.010.594
Sex
Male347(26,7.52)1.080.63–1.850.7831.190.68–2.060.528
Female458(32,6.90)1
District
Misungwi297(11, 3.70)1
Magu249(21, 8.43)2.391.13–5.060.0222.891.34–6.250.007
Ukerewe259(26, 10.03)2.91.40–5.990.0043.551.68–7.470.001
Occupation
Business145(11, 7.58)0.830.41–1.670.603
Employed56(6, 10.71)1.440.51–4.030.48
Farmer448(29, 6.47)0.990.42–2.310.97
Others156(12,7.69)1
History of fever
Yes252(20, 7.94)1.60.67–2.050.588
No553(38, 6.87)1
History of fatigue
Yes265(24, 9.05)1.480.86–2.550.157
No540(34, 6.29)1
History of sore throat
Yes93(6, 6.45)0.880.37–2.090.765
No712(52, 7.30)1
History of cough
Yes220(15, 6.81)0.920.50–1.690.795
No585(43, 7.35)1
History of runny nose
Yes275(28,10.18)1.891.11–3.230.1231.841.03–3.510.036
No530(30,5.67)1
History of SOB
Yes52(6, 11.54)1.760.72–4.310.217
No753(52, 6.90)1
History of chest pain
Yes32(1, 3.12)0.410.05–3.020.378
No773(57, 7.37)1
History of smell loss
Yes64(6, 9.38)1.370.56–3.330.486
No741(52, 7.02)1
History of taste loss
Yes82(12,14.63)2.521.28–4.990.0081.841.12–4.480.023
No723(46, 6.36)
* Median age of the IgM seropositive participants.
Publisher’s Note: MDPI stays neutral with regard to jurisdictional claims in published maps and institutional affiliations.

