The Undisrupted Growth of the Airbnb Phenomenon between 2014–2020. The Touristification of European Cities before the COVID-19 Outbreak


Faculty of Architecture, Gdańsk University of Technology, 80-233 Gdańsk, Poland
Sustainability 2020, 12(23), 9841; https://doi.org/10.3390/su12239841
Submission received: 25 September 2020
/
Revised: 10 November 2020
/
Accepted: 21 November 2020
/
Published: 25 November 2020
(This article belongs to the Section Tourism, Culture, and Heritage)
Abstract
:As a result of the Airbnb eruption, not only has the character of the short-term rental market been completely transformed, but the decades long growth in tourism has also been further accelerated. Therefore, due to the new demands of the tourism economy, the major shift in the usage of historic city centers occurred–the process of ‘touristification’, that results in the emergence of its new, unsustainable form. Despite the significance of those circumstances, there is a lack of any broader quantitative research that would present the dynamic of the Airbnb phenomenon. Therefore, thanks to the recognition of AirDNA data, such statistical analysis has become possible. The goal of this paper is to investigate the Airbnb’s growth trajectories—data that bind together a market dimension of the growth in tourism and the community aspect of an urban change caused by its impact—from the perspective of its spatial distribution across Europe between 2014 and 2020. As a result, it was possible to follow the Airbnb phenomenon during its undisrupted period of growth—from its sudden eruption, further spread, and potential future after the COVID-19 outbreak—all together with its logarithmic character, concentration form, and momentum of already reached economic equilibrium.
1. Introduction
With every decade, the growth in tourism used to stride forward irresistibly, becoming one of the most striking examples “among the many growth curves pointing steeply upwards […] which have turned the twenty-first-century world into a glowing hot planet” [1]. From the 1950s, this graph line climbs steadily upward with an overall annual increase of over 6% [2]. According to the United Nations World Tourism Organization (UNWTO), in 2018, more than 1.8 billion people were traveling internationally in a single year. Until the recent COVID-19 outbreak, that number was expected to grow to 2 billion by 2030 [3]. Although nowadays this forecast is probably going to be significantly corrected, the tourism phenomenon will likely remain one of the largest sectors of the world economy [4,5]. Consequently—unsustainable in its character—the incomparable scale of the growth in tourism manifested by an increase in the number of temporary visitors is going to further affect all other socio-economic aspects on the destination side of the phenomenon.
Especially cities, along with their historic cores, were and are significantly exposed to such an impact [6,7], leading to diverse transformations of public spaces usage, housing market economics, services availability, labor market, cultural heritage management, and everyday life of the ordinary residents. Those processes may be identified as symptoms of a so-called touristification—a kind of gentrification caused by the needs of the uncontrollable growth of the tourism economy [8]. Consequently, together with the latest eruption of the short-term rental market, commonly identified with the foundation of peer-to-peer Airbnb platform [9], the ongoing touristification seems even to accelerate and tend to a state of oversaturation known as overtourism [10,11,12]. Such a specific mechanism typical for urban tourism turned out to be the most perceptible in Europe, where according to UNWTO about half of the worldwide tourism arrivals are concentrated. Indeed, it is the dense network of European historic cities that should be recognized as the most vulnerable subject of ongoing touristification.
The goal of this paper is to follow the change over time of the Airbnb eruption and its further spread across Europe. Due to the recognition of the AirDNA data—a private venture that specializes in providing very complex data about the short-term rental market to property managers—the comparative evaluation of the socio-economic impact of ongoing touristification processes become possible. Indeed, the growth of the Airbnb active listings binds together a market dimension of the growth in tourism and the community aspect of an urban change caused by its impact. Therefore, the study rooted in the statistical analysis of change over time dynamic has been conducted covering the 6-year period (Q2 2014–Q2 2020) of the undisrupted growth of Airbnb. The study tracks the Airbnb eruption—the supply-side of the phenomenon—that occurred in the mid-decade followed by its further spread that lasted until the COVID-19 outbreak at the beginning of 2020 when finally, this novel phenomenon strictly guided by unrestrained law of supply and demand, has been deeply disrupted. Furthermore, the potential future of a short-term rental market is going to be discussed.
Consequently, the main objectives of the study are (1) to oppose the dogmatic character of current knowledge mainly based on presentiments about the Airbnb eruption; (2) to move away from general extrapolation rooted in just a few extraordinary cases and present more relevant characteristics related to the very core of the phenomenon; (3) to propose a basic and repeatable method of the Airbnb’s growth analysis; (4) to define the detailed character of the very phenomenon evolution based on a strict spatio-temporal dataset; (5) to consider possible conclusion for the post-COVID-19 future of the short-term rental market. Therefore, this research should be useful not only from the perspective of real estate market studies, but also in the case of tourism studies, and wider understood urban studies, including sociology, urban conservation, and heritage studies.
2. Context
2.1. The Urban Tourism in Europe
Thomas Hylland Eriksen argued that the growth in tourism, which has become one of the largest sectors of the world’s economy [4,5], should be rather considered as a consequence of a more general mobility phenomenon. In turn, the growth of mobility, together with the growth of other phenomena of energy, cities, waste, and information, should be taken into account as a component of even more comprehensive concept of overheating—“overlapping, interlocking global problems that are inextricably tied to modernity” [1]. Moreover, without any doubt, the already mentioned processes of touristification are deeply rooted not in one, but various such components of globalization complexity. Therefore, the impact of the growth in tourism, which is strictly related to the urban tourism phenomenon, became the most perceptible in a limited number of cities whose brand as a tourist destination has been widely popularized [13]. Further, the majority of such cities are concentrated in Europe, which according to UNWTO accounts for about half of the worldwide international arrivals [3,14] (Figure 1) that provokes the tension at the very center of this study.
The possible negative consequences of the undisrupted growth in tourism have been already foreseen decades ago. In that context, it is at least necessary to recall some summative papers of the theoretical approach of that time like in example those written by Aylin Orbaşli [15] and Noha Nasser [16] in the very beginning of 21st century. Both of them have already identified the growth of the tourism phenomenon as a threat to European historic cities. However, as the best illustration of the academical discourse of that time, it is possible to recall also commonly known concepts describing the socio-economical context of the tourism growth like ‘Disneyfication’, ‘thematization’, and ‘mass tourism’ shaped and popularized during the 1980s and 1990s. At the same time, this theoretical framework created on the intersection of the tourism phenomenon and urban conservation studies may be already considered as rather outdated. Indeed, if we assign as an example those summative papers from the early 2000s to the number of international tourism arrivals of that time (Figure 1) it would be obvious that the pressure of tourism economy has doubled during just the two latest decades completely changing the context of the generally understand tourism research.
Moreover, it is not possible to omit the fundamental differences in attractiveness between hundreds of urban tourism destinations. As it turned out, already mentioned negative consequences were mostly perceptible in Southern Europe where the tourism phenomenon already reached a stage of overtourism leads to the rise of so-called ‘tourismphobia’ [17]. Apart from more general regional conditions, it is strictly related to the value of its urban heritage. That is why there is a need to underline the crucial role of urban heritage deeply rooted in a conviction that heritage is a resource [18] and that vastly accumulated in our historic city centers is mainly used to fuel the growth of the tourism economy [19]. In fact, modern understanding of urban heritage management is not so far from being an equivalent of monetizing it. Therefore, the current academical discourse could be rather identified with some more recently forged terms like ‘overtourism’, ‘tourismphobia’, or ‘touristification’. In consequence, it is positioned rather on the intersection of the tourism phenomenon and economy than urban conservation studies.
However, although the general factors—like the constant economic growth, the occurrence of budget airlines, or the digital revolution—affect the tourism phenomenon on a worldwide scale, from a European perspective, it is also important to underline the significance of its still ongoing integration process. Indeed, there is the fundamental importance of consecutive events that followed the collapse of the Soviet Union initiated in 1989 and fulfilled in 1991, with the crucial role of the establishment of vast European Single Market in 1993, the opening of borders inside Schengen Area in 1995, the establishment of the single monetary system in 1999 (the Euro currency) and finally the major enlargements of European Union in 2004 and 2007 [20]. Although the role of the largest market in the world created in consequence of those events should not be underestimated, the most significant factor for current European growth in tourism is instead rooted in the parallel process that could be recognized as this market’s shift from production to a service economy [21].
Indeed, the origin of the current global boom of tourism is strictly related to the World Bank policy adopted in the 1990s, which actively encouraged attracting tourists as an alternative way of development [22]. Although this policy has been tailored strictly for rising economies outside Europe, in the consequences of the financial crisis in the United States (2007–2008), which heavily influenced European countries resulting in the European debt crisis (2009–2014) [23], everything has changed. The economic shift initiated by the bear market period opens the perspective for the rapid growth of the tourism economy in Europe. As a consequence, the tourism economy was perceived as a powerful stimulant for many regions touched by the economic crisis and even sometimes as an only possible alternative way of development for post-industrial Western countries [24,25]. At the same time, the growth in tourism has been additionally boosted by a constant development of the middle class in Asia resulting in a rising overall number of temporary visitors and the Arab Spring (initiated in 2011) that destabilized a whole region and limited the number of a formerly favored tourist destination [26,27].
Presented above information may seem to be irrelevant according to their general character, however they create a crucial background for the study object: the spatial distribution across Europe between 2014 and 2020. With access to the wide Eurostat database [28], it is possible to identify the European Union with its direct surroundings as a perfect area to conduct a more general urban tourism research. Needless to say, that besides the existence of the common market, as well as some unity on cultural, ideological, and political dimensions, it is obvious that there are still some fundamental differences inside the European Union. Interestingly, they are not strictly related to the diversity of its multinational mosaic, but rather to more general divisions between North and South, rich and poor, or Old and New (Western and Eastern) Union [29]. However, together with the surprising scale of development in the tourism economy, European historic cities have been deeply affected by ongoing touristification almost uniformly across the Continent [30]. At the same time, its pressure is still felt the most in those areas with the highest level of urbanization [31].
Although, the spatiotemporal patterns of the tourism phenomenon in Europe clearly highlights its seasonal character—which in principle relates to resorts in Alpes and seacoasts that are intentionally developed by tourism demand—the most popular tourist destinations are, in fact, the most significant cities that “tend to be hotspots of tourism throughout the [whole] year” [31]. Therefore, according to the ongoing growth in tourism, the dense network of European historic cities seems to be one of the most vulnerable areas to its impact. Indeed, this network, together with its high accessibility and well-developed infrastructure, have been subjected to unique urban conservation policy [32] that transformed its urban heritage accumulated during many centuries into a resource [16,18]. And, in those cities, where the touristification proceeds most severely, the shift from a former multifunctional usage to a new (tourism-oriented) monofunctional form occurs. In consequence, European historic cities, as well as whole Europe, become very susceptible to the upcoming eruption and further spread of the Airbnb phenomenon.
2.2. The Airbnb Eruption
Founded in mid-2008, Airbnb has emerged as a novel innovation unfettered by almost any regulations, and in just a few years, erupted on a worldwide scale [9]. In the beginning, Airbnb was identified as a part of a broader sharing economy phenomenon rooted in the ongoing digital revolution [33]. However, in consequence of the aforementioned financial crisis in the United States (2007–2008) and subsequent European debt crisis (2009–2014), it has transformed into an essential branch of the neoliberal economy, whose buy-to-let investments model is fueled by international funds managing global investment capital [34]. Moreover, precisely that evolution of the short-term rental market—from sharing economy to buy-to-let investments—is crucial to understand the specific dynamic of any Airbnb dataset. Therefore, Airbnb has to be recognized as a so-called disruptive innovation—a newly emerged product that is able to successfully transform a market to the point that it may challenge previously dominant companies [35]. Indeed, in just a few years, it not only transformed the whole tourism accommodation market, but also became one of the most popular options for any short-term booking [36].
In parallel to the growth in tourism, Airbnb became a phenomenon that transformed the rental market on a global scale. Soon after its initial boot, in February 2011, Airbnb announced that it reached its first million nights booked. Almost a year later, in January 2012, this number grew to 5 million, and after only a few months, in June 2012, the barrier of 10 million night booked has been crossed [37]. Currently, at the beginning of 2020, there were over 500 million nights booked through Airbnb [38], which is the best illustration of the enormous significance of the ongoing evolution of the short-term rental market. However, it is fundamental to underline that the first symptoms of the short-term rental market transformation were not noticeable until the mid-decade when the numbers behind the Airbnb eruption reached a really significant scale. What in the beginning was the eruption of the phenomenon, after just several years, became its further spread which constant development seemed to be ensured due to its relation to the global investment capital and neoliberal market.
Additionally, the mechanism of the Airbnb phenomenon on the city scale should be also briefly described. Namely, it is a commonly known fact that most tourists seek their accommodation within walking distance of major tourist attractions, which cause a spatial concentration of hotels in city centers [39]. Although a similar dynamic is related to the short-term rental market, it is not subjected to the same regulation as hotels. Consequently, it may easily emerge inside resident areas and as such has a direct impact on the everyday life of their residents. With each flat transferred to the short-term rental market, fewer and fewer resources remain for long-term accommodation. Consequently, due to its very flexible mechanism, the spatial concentration typical for the Airbnb phenomenon is slowly shifting a whole former multifunctional city center to a homogeneous tourism-oriented area [9]. According to the typical space limitation of the housing market, development of the short-term rental market leads to a change of property value as well as costs and quality of living that finally forces displacement of former residents [40]. Therefore, the ongoing touristification eventually results in the destruction of the local community.
Finally, it should be emphasized that the described dynamic of ongoing touristification affects a very center of urban environment vitality by accelerating the process of its homogenization. The occurrence of such processes is strictly related to the characteristic spatial concentration of tourism distribution, which refers only to a limited city center area of the most popular tourist destinations. However, touristification is not unambiguously perceived as a negative phenomenon. Together with its positive (mainly economic) aspects, the impact of growth in tourism is rather a part of constant urban change that is neutral or even welcomed by most policymakers. At the same time, only a fraction of residents is ready to oppose it actively. However, such rather unique cases are excessively widespread in mass media—like in the case of Barcelona. However, any already adopted policy becomes very hard to change in consequence of the so-called path dependence rule that explains why it is so unlikely to make any radical policy shift concerning the decisions already taken in the past even if actual circumstances are significantly different [41].
Only recently, in March 2020, the alliance of 22 European cities (Amsterdam, Athens, Barcelona, Berlin, Bologna, Bordeaux, Brussels, Cologne, Florence, Frankfurt, Helsinki, Krakow, London, Milan, Munich, Paris, Porto, Prague, Utrecht, Valencia, Vienna, and Warsaw) pledged to European Commission for help with regulating short-term rental market [42]. This group—supported later by the Eurocities alliance representing a wider group of 190 European cities—claim especially for access to Airbnb data that would help them manage the current housing crisis on a local level [43,44]. However, the general context remains omitted.
2.3. The Airbnb Data
The Airbnb phenomenon belongs to specific part of the short-term rental market—primarily identified as a peer-to-peer (P2P) trading economy but recently more rather evolving to business to consumer (B2C) model—that is deeply rooted in the digital revolution [6]. As such, it produces daily an enormous and diverse dataset. Unfortunately, at the same time, the Airbnb company does not publish or share any data related to its primary activity. Therefore, a short-term rental market data collection is both an auspicious opportunity and a fundamental obstacle for any research based on its results. The dataset preparation for a more extensive long-term study requires systematic and regular data collection that should be initiated well in advance. In consequence, most of the current research on the short-term rental market refuses to take such a challenge and narrow itself to a form of the snapshot—presenting data relevant just for an exact moment. An alternative solution for such limitation is the usage of data already gathered and shared through several databases constructed by some individuals who previously identified this problem. Although those bottom-up ventures have an open-access policy—not only sharing data but also algorithms that have been used to collect it—they are also created in a very limited spectrum.
Therefore, the final solution for that problem is data collected by AirDNA—a private venture established in 2015 that specializes in providing very complex data about the short-term rental market to property managers [45]. AirDNA collects data that enable research focused on many diverse issues like spatial concentration, average costs, occupancy, revenue, rental type and size, number of stays, customer opinion, and rating. However, such complexity is rather relevant to a singular case study than to more overall research. Indeed, according to the systematic reviews conducted by Daniel Guttentag [46] and Sara Dolnicar [47], there are numerous studies concentrated on the Airbnb phenomenon, which in the overwhelming majority are focused on the individual case studies. At the same time, according to the fundamental Ashworth and Page [48] review of the contemporary—to them—state of urban tourism research, one of its major weaknesses has been identified due to “many forms of tourism research that remain case-study driven and implicitly descriptive in manner.” Consequently that “tourism impact upon cities in general is […] extrapolated from a few well-known and often overpublicized cases.”
Therefore, at the very moment, there is still a very limited number of studies on a more general perspective of the Airbnb phenomenon spatial distribution. Although a few existing attempts are exclusively snapshots—bereft of any change over time potential—it is still crucial to recall those examples, as the most relevant context of this study. To list the best-known: the study of active listings spatial concentration made between the cross-sections of three Italian cities of Rome, Milan, and Florence [49]; the overview of the active listings in context of fourteen large European cities based on some descriptive statistics study [50]; the overall study of the active listings spatial distribution in Spain looking for some patterns and determinants [51]; and the big data study conduct in the global scale between 10 out of 217 countries that have the highest number of active listings [52]. Although every single one of them is developed on the comparative potential of Airbnb data—some even use the AirDNA data—none of them entirely takes advantage of the eruption and further spread this phenomenon creates.
There is also one more study—the most similar to this one—that entirely focuses on the comparative potential of the Airbnb data. It has been prepared by Czesław Adamiak [30], who briefly presents an overview of the whole short-term rental market supply on the European scale. Although presented data—scraped from the AirDNA website—are exclusively portraying the scale of Airbnb supply in a very moment (snapshot from early December 2017), it gives an objective impression about the distribution of popular tourist destinations across Europe (the area relevant to the UNWTO regionalization, excluding Siberia and Central Asian states). Indeed, according to Adamiak’s study, there were almost 750,000 active listings only in the European cities with more than 100 thousand residents. However, the study was conducted using the data for just 432 cities out of all 768 cities of this scale in Europe—unfortunately, data for a further 336 cities was unavailable at that time [30]. Although it creates an important context to understand the scale of the Airbnb phenomenon, bereft of its change in time dynamics, it is also the perfect example of its insufficiency.
Finally, coming back to the AirDNA data, for comparative evaluation purposes there is rather a need to use a basic indicator that would enable easy juxtaposition of a wider spectrum of research objects in a longer period than a very detailed dataset. Although access to the detailed part of the AirDNA database requires payment, there also is available a limited overview in open access. And, this overview includes the quarterly growth of the Airbnb active listings (together with HomeAway data added to the overall counting around mid-2017, which in case of Europe constituting only a few percent of the whole sum), which seems to be a perfect data source for such needs. First of all, this data is easy to collect for almost every possible destination worldwide, although for some destinations it is not available because of its very small importance of recorded value. Secondly, data gathered by AirDNA cover not only the current state of the short-term rental market (like a snapshot), but also its full history since mid-2014, which exactly coincides with the very moment of the Airbnb eruption. Consequently, there are almost unlimited possibilities of research on ongoing touristification as well as the creation of a universal indicator for its comparative evaluation.
Although the AirDNA data is already in common usage its full potential has not been recognized yet. Furthermore, the economic origin of the Airbnb data positions it on an intersection of tourism and urban studies, binding together a market dimension of the growth in tourism and community aspect of an urban change caused by its impact. Therefore, to conduct a proper elaboration of such data—only seemingly reduced to its economic character—there is a need for the introduction of a basic method rooted in its comparative potential that would present a change over time of ongoing touristification. Consequently, there are required tools whose character should not go beyond some simplicity that enables a basic comparison between countless destinations.
3. Materials and Methods
The depiction of the Airbnb eruption and its further spread across Europe would not be possible without the recognition of the AirDNA database potential. However, given the full spectrum of the collected data, this study is based on its very limited part: the Airbnb active listings (further: active listings) that has proven the most efficient indicator for comparative evaluation of ongoing touristification. Although the active listings used in the form of absolute numbers are not a very useful solution for the juxtaposition of a number of more diverse examples—different in scale and characteristics—they are a key area to portray the change over time of more general features of the Airbnb phenomenon. Therefore, to study the dynamic of the Airbnb eruption and its further spread across Europe it is optimal to focus on the growth of the number of active listings for a selected dataset. However, it should be also mentioned that, besides its unquestionable potential, any usage of relative numbers—especially the Airbnb intensity ratio which is used to relate the short-term rental market to permille of the selected city population—is going to be omitted here.
First of all, it is crucial to define the requirements that characterized the used sample (Figure 2). Only on such assumptions it is possible to present a logarithmic character of the Airbnb data distribution due to the typical form of active listings usage. Therefore, a sample has been presented as a stacked bar chart sorted in decreasing order of active listings (Figure 3) that enable to follow the annual growth of such presented dataset. However, to keep it readable, it has been limited to the most significant fraction of a sample, just to present cities where the touristification is the most perceptible. Furthermore, it is crucial to represent the whole dataset through its mapping, which would depict a concentration form of the short-term rental market spatial distribution as well as close ties to the urban tourism roots of this very phenomenon. The juxtaposition of several maps based on annual summer peak values (Figure 4, Figure 5, Figure 6 and Figure 7) creates a clear image of the ongoing growth in a full spectrum of research objects without unnecessary overplotting. However, such a way of depiction favors extraordinary examples and omit the overall perspective of the very phenomenon. Therefore, it is crucial to use a more traditional statistic tool to present the data distribution: a box-and-whisker plot (Figure 8) that would help to understand the general characteristics of the sample.
Eventually, it is a linear graph (Figure 9) that depicts an actual change over time dynamic of the whole dataset most effectively. Although in that case, it would be impossible to present every single case separately, so it would be more efficient to focus on the main trajectories of the Airbnb growth clustered according to at least 1000 active listings recorded in annual summer peak values of proceeding years. Therefore, such a linear graph is going to be strictly related to previously presented maps (Figure 4, Figure 5, Figure 6 and Figure 7). Indeed, due to the depiction of the quarterly growth, linear visualization of the data enables to follow the seasonality of the Airbnb phenomenon, as well as its trends, tendencies and breaking points, resulting in the comparative potential of the presented research. Furthermore, every one of the clustered trajectories of the Airbnb growth—presented in the form of rough data—has been supplemented by centered moving averages: 2 × 4-MA (Figure 9). Due to the record of different curves of those lines, it is possible to determine the current state of clustered cities touristification. Although such information cannot enable any firm prediction about the future of the Airbnb phenomenon after the COVID-19 outbreak, it establishes a clear foundation for such forecasting in the future.
4. Results
The study focuses on a dense network of European historic cities that rather covers an area of European Union with its direct surroundings than the area proper to the standardized regionalization provide by UNWTO, which includes Siberia and Central Asian states. Therefore, the area of study has been delimited to the European peninsula without Russia and Turkey. And consequently, in its overwhelming majority, it benefits from the data gathered by Eurostat about the population of selected cities. Only in the case of Balkan, Belarusian, and Ukrainian cities, the data source had to be extended with the data of national statistical offices. The final dataset contains cities with more than 100 thousand residents that according to the AirDNA data at least once during the six-year period (Q2 2014–Q2 2020) exceeded the number of 1000 active listings (Figure 2). Moreover, there are 189 cities in Europe that meet such basic requirements, which result in a sample of research objects affected by the urban tourism phenomenon with the omission of the diverse seasonal character of usually smaller resort cities. Therefore, the presented study is focused only on those cities that are clearly affected by the ongoing touristification.
The general character of the dataset could be described as typical of the neoliberal economy distribution inequality—well-known as the Pareto principle or the Matthew effect—with a few privileged and excluded majority. Such logarithmic distribution could be clearly depicted by the stacked bar chart sorted in decreasing order of active listings of the top 42 cities that at least once exceeded the 5000 active listings (Figure 3). Although it represents between a quarter and a fifth of the whole sample, its sum exceeds 50% of the total number of active listings in the whole sample, with nearly 500 thousand active listings in Q3 2019. Simultaneously, the rest of the sample tends to 1000 active listings totaling to about 450 thousand active listings. Furthermore, the annual change over time in each 3rd quarter between 2014 and 2019 could be easily followed. However, the dynamic of presented growth is not universal for the whole sample and sometimes the subsequent value is beneath the value recorded a year before. Therefore, to emphasize the fact that the whole sample has been sorted according to the latest record value (Q3 2019), the additional line has been added on the top of the diagram, which is sometimes way beneath the highest value of the selected city growth peak.
The main features of the collected dataset are even more readable on the several consequent maps that depict the spatial distribution of the Airbnb phenomenon—values in the 3rd quarters—of the entire six-year period (Figure 4, Figure 5, Figure 6 and Figure 7). Although, there is a need to skip the very first record of the Airbnb phenomenon development in Europe covering the 2nd quarter of 2014 that contains only seven cities meeting the basic requirements (respectively by the value of active listings: Paris, Barcelona, Rome, London, Berlin, Madrid, and Venice). Together with the second record covering the 3rd quarter of 2014 (Figure 4), the Airbnb phenomenon has been clearly initiated altogether with 19 cities included in the sample (additional Copenhagen, Milan, Lisbon, Prague, Budapest, Vienna, Brussels, Lyon, Edinburgh, Kiev, Marseille, and Porto). All of those cities are widely recognized examples of tourist destinations with a strong brand, which has been attracting tourists for decades. Furthermore, after a year, in the 3rd quarter of 2015 (Figure 5), there are 60 enlisted cities and the Airbnb eruption is already clearly visible. Also, several records have already reached extreme numbers of active listings, respectively Paris (46 thousand), London (33 thousand), Barcelona (19 thousand), Rome (19 thousand), and Berlin (17 thousand).
Finally, in the 3rd quarter of 2016 (Figure 6), the initial eruption of the Airbnb phenomenon seems to reach its breaking point. The former rapid growth of those—just mentioned—leading cases has clearly reached its apogee. Although the very character of this transition would be the most visible on the linear graph that depicts the active listings growth curves (Figure 9), the following maps were also able to depict some of its very important features. Indeed, the further spread of the Airbnb phenomenon is still well-visible together with more and more cities that are meeting the basic requirements. Therefore, it would be more efficient to juxtapose the following change over time just between two records of 2016 and 2019 (Figure 6 and Figure 7). Thanks to skipping records of 2017 and 2018, the dynamic of change is much more readable. Indeed, after three years in the 3rd quarter of 2019 (Figure 7), it becomes self-evident that the evolution of the short-term rental market is going to affect the majority of European cities. During this time the number of cities that exceed 1000 active listings has almost doubled from 95 (Q3 2016) to 185 (Q3 2019), although during this time there was in sum 189 cities that at least once broke this barrier (Table 1).
Consequently, it is possible to follow how the general character of the Airbnb phenomenon spatial distribution is clearly related to the dense network of European historic cities, that has transformed according to the demands of the ongoing growth in tourism. In fact, it is important to be noticed that it seem to duplicates already known spatiotemporal patterns of tourism in Europe based on high-resolution data [31]. Still, the most visible are those examples that accelerate during the initial eruption of the Airbnb phenomenon, in their majority capital cities supplemented by very well-known tourist destinations like Barcelona, Marseille, Milan, Florence, Venice, Porto, etc. Those cities are supplemented by whole clusters of medium-sized cities especially located in Western Europe (Figure 7). However, at the same time, the rapid growth of those leading cities is not only begun to decelerate but even to decline. Indeed, the majority of the growth that occurred between 2014 and 2016, has been followed by the consequent stagnation between 2017 and 2019. Therefore, this process could be easily divided into two clearly diverse phases: the Airbnb eruption and its further spread.
The stacked bar chart (Figure 3) altogether with the consequent maps (Figure 4, Figure 5, Figure 6 and Figure 7) are well-presenting the general character of the Airbnb dataset—both its logarithmic and spatial distribution. At the same time, they are favoring a limited number of examples where the impact of ongoing touristification is the most perceptible. Indeed, the touristification of the mentioned above examples remains in the very center of urban tourism research interests. However, such a limitation of interests has been a typical feature of current urban studies for decades—as it was indicated above “tourism impact upon cities in general is […] extrapolated from a few well-known and often overpublicized cases” [48]. Therefore, there is a lack of any relevant study on those—more ordinary—examples which constituted the notoriously neglected majority of the sample. Although the presented above elaboration already has a significant value from a comparative evaluation perspective, it is relevant, that case-study oriented tourism studies—focused on the Airbnb phenomenon vanguard—ignores the very core of the phenomenon that concerns a much larger number of cities and their inhabitants. Consequently, to obtain a different perspective, it is important to elaborate the whole sample once again in a more statistic manner.
The most typical statistic tool to present the data distribution is the box-and-whisker plot (Figure 8). However, it is important to remind that according to basic requirements the sample has been significantly truncated on the bottom—only cities that at least once break line of 1000 active listings have been enlisted—and in consequence, it is selectively concerning only those cities with relatively high-level of touristification. Furthermore, the data distribution of the sample turned out to be highly skewed with a long tail on the top due to comprise outstanding examples of cities like London and Paris, which also have an exceptional population size across Europe. Therefore, the data have been plotted on a square root scale to show a somewhat clearer pattern, with a more fairly symmetric distribution and no extreme outliers. Moreover, even with such predominant circumstances, from a statistical study perspective, it is crucial to focus on the examples from the inter-quartile range—represented by boxes in Figure 8—that consist of the typical examples of the Airbnb phenomenon in European cities with more than 100 thousand residents. Such an area of interest is totally opposite to the overwhelming majority of known case studies rather dealing with all of those outliers—represent by top dots and whiskers on Figure 8 between 10,000 and 100,000 active listings.
Moreover, the best way to distinguish the Airbnb eruption from its further spread recorded on the consequent maps (Figure 4, Figure 5, Figure 6 and Figure 7) is to examine the active listings growth curves on the linear graph (Figure 9). However, to avoid unnecessary overplotting as well as the domination of some outstanding examples, the sample of 189 cities has been clustered according to the value of the active listings measured in proceeding summer peaks—only cities that exceeded the barrier marked at value 1000 have been enlisted. Furthermore, the growth curves of cities that emerged in 2017, 2018, and 2019 have been omitted due to insignificant values they have reached. Consequently, there are 3 main trajectories related to exactly the same list of new cities (Table 1) that appear on maps for the 3rd quarters of 2014 (Figure 4), 2015 (Figure 5), and 2016 (Figure 6). To create those trajectories (Figure 9) there has been used a mean value that is very susceptible to any outlying values-especially London and Paris have fairly influenced the steepness of the first line. However, even if its trajectory is a bit outstretched, omitting those outliers would not be really significant to a final outcome of this study. The real importance is rather related to the selected clusters’ dynamic of growth than to their actual mean value.
Therefore, it is important to notice, that all of the trajectories are quite similar in shape—sharing the features of logistic function—but just relatively steeper or flatter in its character (Figure 9). As has been already mentioned, after the initial Airbnb eruption some balance has been reached between demand and supply—the economic equilibrium—when the very phenomenon starts to spread across Europe affecting a wider range of cities. Such stabilization is the best visible due to centered moving averages (more precisely five-point weighted MA or just 2 × 4-MA) that depicting the actual tendency of the phenomenon (Figure 9). In fact, those curve lines are similar to those illustrating in economics the law of diminishing returns, that—in this case—could be recognized as the level of the short-term rental market saturation. Therefore, in most cases, after reaching the economic equilibrium the trajectory acquires the seasonal amplitude and tends to reach a diminishing period. At the same time, it is worth noting how the same process has been depicted on the box-and-whisker plot (Figure 8), where boxes consequently detach from the zero axis. Further, where the stable growth of the whole sample could be combined with the rapid escape of just several outstanding examples.
However, there are also cities that break a very important barrier where the tourism economy becomes a homogeneous feature of their economy. Indeed, as a new phenomenon—already identified as disruptive innovation—in its initial period it has to catch up with the current state of city’s touristification. At the same time, the growth of such a new feature of the tourism industry further accelerates the very process of touristification. In the end, cities like Venice, Florence, and Rome—unable to reach their economic equilibrium—fueled by new possibilities of the peer to peer accommodation market that evolved into business to consumer model have been in constant rapid growth until the turn of 2019 and 2020. However, still, those examples are just unique cases across the rest of Europe, which require a separate study. Therefore, it is important to summarize that, in general, the growth of the Airbnb phenomenon was initiated just before Q3 2014. Then, after a rapid increase of active listings recorded as a very steep growth line, it eventually has been subjected to flattening—it decelerates and even starts to diminish—and finally reaches its saturation point. Consequently, it transformed into a more stable form that is often characterized by much more readable sensitivity to the seasonable character of the tourism phenomenon (Figure 9).
5. Discussion
At the beginning of 2020, together with the COVID-19 outbreak, the period of undisrupted growth of Airbnb has suddenly ended. Although it was not the first crisis that hit the tourism economy [53], it has been the most severe disruption that affected it on a global scale. Though the COVID-19 outbreak was primarily reported in China in November 2019, it did not appear in Europe before late-February 2020 (begun in Northern Italy), consequently leading to general lockdown—social distancing, isolation, and closed borders inside European Union—that continued to the turn of May and June. Together with the collapse of the mobility phenomenon, the tourism economy has been identified as the “one of the hardest-hit” sectors by the latest crisis [54]. And indeed, as a consequence of the sudden and unexpected drop in demand, the economic equilibrium of the short-term rental market has been disrupted. According to the AirDNA website, during the lockdown period bookings on Airbnb dropped even by up to 96% in Beijing—in Europe up to 41% in Rome [55]. And it is not obvious what would be a final reaction on the supply side of phenomenon concerning hosts intentions (stay or exit the platforms [56]) as well as common habits related to them (like in example concept of “second homes” [57]).
Besides that, it seems to be indisputable that Italy has been the most damaged during the first wave of the pandemic in Europe. Indeed, the current crisis is the most perceptible in those cases where the tourism economy overwhelmed other sectors of the economy [58]. According to ENIT—the Italian national tourism agency—to the end of July, the international arrivals has dropped there by 90%. As its president—Giorgio Palmucci—pointed out “the projected 2020 loss from overseas visitors to Italy is €24.6 billion and even domestic traveler spending is down €43.6 billion”. And consequently, “all Italian cities are expected to be significantly impacted, particularly those more dependent on international visitors like Venice, Florence and Rome” [59]. Indeed, according to the report prepared by Confesercenti Nazionale agency, only in the case of the five most iconic Italian tourist destinations—Rome, Venice, Florence, Turin, and Milan—were the loss estimates of €7.6 billion due to the drop in the number of foreign visitors [60]. However, this problem is visible all over Europe, as well as on a global scale.
It is likely that tourism economy would remain more or less destabilized until the pandemic crisis would be under control. Although, as Sara Dolnicar and Samira Zare [61] already noted, though demand for Airbnb-listed properties will increase again rapidly, it would not reach the same level as before the pandemic period. Indeed, presenting a forecast model on the demand side of the phenomenon, they argued that “coronavirus disrupted the disruptor” and in consequence, it would have a long-term impact on Airbnb growth [61]. However, according to its roots in real estate economics, the supply side of the phenomenon is much less susceptible to any shock. The change here would be delayed and its character is hard to be predicted because of the relation between the tourism economy and the international funds managing global investment capital (already mentioned buy-to-let investments model). Probably, the transfer from the short to the long-term rental market is possible but not easy to be carried out—especially in the context of required investment made to prepare those properties for short-term rental market demands. At the very moment, the market is waiting for bounce-back (or estimating their potential risk and return). Therefore, it is very difficult to conduct any forecast on the short-term rental market future, as well as assess whether the Airbnb phenomenon has been temporarily injured or totally collapsed.
However, according to the current dataset, the unambiguous reaction on the supply side occurs together with Q2 2020 altogether with the extraordinary drop in the vanguard cities (Figure 9). Especially, it is worth to notice, the enormous drop that has occurred in the case of London—represented by the dot on the top of Figure 8—where the decrease reaches about 27,000 listings quarter to quarter (the 33% of the total). At the same time, in case of the box (Figure 8), the drop is much gentler—although visible—but still very significant, with the assumption that, at this moment, the growth has been expected. Therefore, in general perspective, the Airbnb growth in all the rest cities forming peloton turns out to be much more sustainable and in consequence much less susceptible to any disruption. It may bring the conclusion that, the process of touristification of those cities is not that advanced. However, also the curves of those cities’ moving average start to decrease (Figure 9). Therefore, it is undoubted that a certain period of the Airbnb phenomenon prosperity has already be ended. Moreover, from such a perspective, the presented above dataset seems to be not only an important record of past events but also an essential context for any forecasts for the future.
Consequently, it is crucial to deeply analyze and properly interpret the Airbnb eruption and its further spread across Europe according to new circumstances. However, it would not be possible in relation to the hitherto dogmatic character of knowledge about the Airbnb eruption. Indeed, that knowledge has been mainly based on presentiments and general extrapolation rooted in just limited extraordinary cases—identified in this research as very important but vanguard cities. And those cases covered up the more relevant characteristics related to the very core of the phenomenon referring to dozens of European cities. Furthermore, the firm relation between the European debt crisis (2009–2014) and the initial boost of the Airbnb has been demonstrated as well as the momentum of equilibrium that has been reached just before the COVID-19 outbreak. At the same time, when the vanguard cities growth has broken, the general growth line of the Airbnb phenomenon did not stop. It may be assumed that along with the slowly progressing saturation of the market, new areas for its development were to open up—in this case, European cities with a not so well-known brand as a tourist destination.
Therefore, to obtain such research perspective it has been so important to propose a basic and repeatable method of the Airbnb’s growth analysis that would prove in future so useful. Indeed, according to the presented in detail characteristics of the very phenomenon based on its strict spatio-temporal dataset, it is possible to ask the previously unavailable questions. Consequently, it is also possible to draw some basic frames for the future potential of the Airbnb growth based on already performed studies of its previous period. If—as has been stated—the apogee of the Airbnb growth has already been achieved before the COVID-19 outbreak, then it is possible to predict some future limitations of the tourism economy growth. Indeed, the maximum of previous economic equilibrium is not likely to be reached during several upcoming years. This is especially the case without the recovery of the demand side of the Airbnb phenomenon—the part of the tourism phenomenon deeply rooted in the mobility phenomenon. However, the pessimistic scenarios for the short-term rental market—with a sequence of shocks that would permanently lower the demand-side of the Airbnb phenomenon [61]— is not inevitable. The history of economic growth teaches us that if after the current crisis the period of stable growth is long enough, it is likely that the previous apogee would be significantly exceeded in the future (Figure 1)
6. Conclusions
For the first time, due to the recognition of the AirDNA data, it has been possible to conduct quantitative research on the overall perspective of the Airbnb phenomenon based on the six-year period of undisrupted growth. Therefore, the consequent growth and spatial distribution of the Airbnb phenomenon across Europe have been presented altogether with its logarithmic character (Figure 3) and concentration form (Figure 4, Figure 5, Figure 6 and Figure 7). From the European perspective, it is not relevant to refer to the origin period of Airbnb development (2008–2013) as the actual beginning of the phenomenon. In fact, there are two main phases of the phenomenon: its sudden eruption (2014–2016) and its further spread (2017–2019) when the economic equilibrium has been reached. The division of both phases is clearly visible on the linear graph (Figure 9) where it is marked by the series of breaking points related to the growth curves of the most significant clusters of cities. Therefore, the statistical potential recognized in the AirDNA data (Figure 8), not only enables further studies on different levels of focus—general studies as well as any case studies supplementation—but also encourage elaboration of a novel methodological approach for its more efficient usage. Indeed, such an approach can prove very useful especially when the European Commission—urged by the Eurocities alliance—oblige peer to peer platforms to share relevant data with local administrations.
Furthermore, thanks to achieving the objectives indicated in the introduction, I hope that such a new perspective of research—rooted in some basic comparative evaluation tools—seems to be an essential form for any further development of urban tourism studies. And as such, it could turn out to be a crucial point of reference to wider understood urban studies—including economics, sociology, urban conservation, and heritage studies. This seems to be even more clearly visible now after the COVID-19 outbreak, then during the undisrupted growth period of the Airbnb phenomenon, when unsustainable development of the tourism economy has remained unquestionable solution for economic crisis. Although we cannot be sure what would be a future direction of the presented dataset development (diminish or decrease), without any doubts, only the proper evaluation of its past growth would help us to conduct appropriate forecasts for its future after the commonly anticipated bounce-back. However, only after receiving new data will it be possible to elaborate a more detailed view of the future of the short-term rental market after the COVID-19 outbreak.
Funding
The research project has been realized at Istituto per i Beni Artistici, Culturali e Naturali della Regione Emilia-Romagna in Bologna (Italy) between 2017–2020 as a part of Innovative Training Network entitled “CHEurope—critical heritage studies and future of Europe” which received funding from the European Union’s Horizon 2020 Research and Innovation programme under the Marie Skłodowska-Curie Grant Agreement Nr–722416.
Conflicts of Interest
The author declares no conflict of interest.
References
- Eriksen, T.H. Overheating. An Anthropology of Accelerated Change; Pluto Press: London, UK, 2016; ISBN 978-0-7453-3634-3. [Google Scholar]
- Becker, E. Overbooked. The Exploding Business of Travel and Tourism; Simon and Schuster: New York, NY, USA, 2013; ISBN 1439161003. [Google Scholar]
- UNWTO. Tourism Barometer; UNWTO: Madrid, Spain, 2019. [Google Scholar]
- Lew, A.A. Tourism’s role in the global economy. Tour. Geogr. 2011, 13, 148–151. [Google Scholar] [CrossRef]
- Du, D.; Lew, A.A.; Ng, P.T. Tourism and Economic Growth. J. Travel Res. 2014, 55, 454–464. [Google Scholar] [CrossRef]
- Bock, K. The changing nature of city tourism and its possible implications for the future of cities. Eur. J. Futur. Res. 2015, 3, 1–8. [Google Scholar] [CrossRef] [Green Version]
- del Romero Renau, L. Touristification, Sharing Economies and the New Geography of Urban Conflicts. Urban Sci. 2018, 2, 104. [Google Scholar] [CrossRef] [Green Version]
- Cocola-Gant, A. Tourism gentrification. In Handbook of Gentrification Studies; Lees, L., Phillips, M., Eds.; Edward Elgar Publishing: Cheltenham, UK, 2018; p. 281. [Google Scholar]
- Gutiérrez, J.; García-Palomares, J.C.; Romanillos, G.; Salas-Olmedo, M.H. The eruption of Airbnb in tourist cities: Comparing spatial patterns of hotels and peer-to-peer accommodation in Barcelona. Tour. Manag. 2017, 62, 278–291. [Google Scholar] [CrossRef] [Green Version]
- Koens, K.; Postma, A.; Papp, B. Is overtourism overused? Understanding the impact of tourism in a city context. Sustainability 2018, 10, 4384. [Google Scholar] [CrossRef] [Green Version]
- Adie, B.A.; Falk, M.; Savioli, M. Overtourism as a perceived threat to cultural heritage in Europe. Curr. Issues Tour. 2020, 23, 1737–1741. [Google Scholar] [CrossRef]
- Milano, C.; Novelli, M.; Cheer, J.M. Overtourism and degrowth: A social movements perspective. J. Sustain. Tour. 2019, 27, 1857–1875. [Google Scholar] [CrossRef]
- Gold, J.R.; Ward, S.V. (Eds.) Place Promotion: The Use of Publicity and Marketing to Sell Towns and Regions; John Wiley: Hoboken, NJ, USA, 1994; ISBN 978-0471948346. [Google Scholar]
- UNWTO. European Union Tourism Trends; UNWTO: Madrid, Spain, 2018; ISBN 9789284419470. [Google Scholar]
- Orbaşli, A. Tourists in Historic Towns: Urban Conservation and Heritage Management; Taylor & Francis: Abingdon, UK, 2002; Volume 35, ISBN 0203479009. [Google Scholar]
- Nasser, N. Planning for urban heritage places: Reconciling conservation, tourism, and sustainable development. J. Plan. Lit. 2003, 17, 467–479. [Google Scholar] [CrossRef]
- Milano, C.; Novelli, M.; Cheer, J.M. Overtourism and Tourismphobia: A Journey Through Four Decades of Tourism Development, Planning and Local Concerns. Tour. Plan. Dev. 2019, 16, 353–357. [Google Scholar] [CrossRef]
- Smith, L. Uses of Heritage; Springer: Berlin/Heidelberg, Germany, 2006; ISBN 0203602269. [Google Scholar]
- Rubino, I.; Coscia, C.; Curto, R. Identifying spatial relationships between built heritage resources and short-term rentals before the Covid-19 pandemic: Exploratory perspectives on sustainability issues. Sustainability 2020, 12, 4533. [Google Scholar] [CrossRef]
- Dedman, M. The Origins & Development of the European Union 1945–2008, 2nd ed.; Routledge: Abingdon, UK, 2009; ISBN 9780415435611. [Google Scholar]
- Buera, F.J.; Kaboski, J.P. The rise of the service economy. Am. Econ. Rev. 2012, 102, 2540–2569. [Google Scholar] [CrossRef]
- Hawkins, D.E.; Mann, S. The World Bank’s role in tourism development. Ann. Tour. Res. 2007, 34, 348–363. [Google Scholar] [CrossRef] [Green Version]
- Reusens, P.; Croux, C. Sovereign credit rating determinants: A comparison before and after the European debt crisis. J. Bank. Financ. 2017, 77, 108–121. [Google Scholar] [CrossRef]
- Antonakakis, N.; Dragouni, M.; Filis, G. How strong is the linkage between tourism and economic growth in Europe? Econ. Model. 2015, 44, 142–155. [Google Scholar] [CrossRef] [Green Version]
- Lestegás, I. Lisbon After the Crisis: From Credit-fuelled Suburbanization to Tourist-driven Gentrification. Int. J. Urban Reg. Res. 2019, 43, 705–723. [Google Scholar] [CrossRef]
- Avraham, E. Destination image repair during crisis: Attracting tourism during the Arab Spring uprisings. Tour. Manag. 2015, 47, 224–232. [Google Scholar] [CrossRef]
- Mansfeld, Y.; Winckler, O. Can this be spring? Assessing the impact of the “Arab Spring” on the Arab tourism industry. Tourism 2015, 63, 205–223. [Google Scholar]
- Eurostat Database. Available online: https://ec.europa.eu/eurostat/ (accessed on 18 December 2019).
- Landesmann, M.A. The new north-south divide in Europe: Can the European convergence model be resuscitated? In The Triple Challenge for Europe: Economic Development, Climate Change, and Governance; Fagerberg, J., Laestadius, S., Martin, B.R., Eds.; Oxford University Press: Oxford, UK, 2015; pp. 60–89. ISBN 9780198747413. [Google Scholar]
- Adamiak, C. Mapping Airbnb supply in European cities. Ann. Tour. Res. 2018, 71, 67–71. [Google Scholar] [CrossRef]
- e Silva, F.B.; Marín Herrera, M.A.; Rosina, K.; Ribeiro Barranco, R.; Freire, S.; Schiavina, M. Analysing spatiotemporal patterns of tourism in Europe at high-resolution with conventional and big data sources. Tour. Manag. 2018, 68, 101–115. [Google Scholar] [CrossRef]
- Lamprakos, M. The Idea of the Historic City. Chang. Over Time 2014, 4, 8–38. [Google Scholar] [CrossRef]
- Crommelin, L.; Troy, L.; Martin, C.; Pettit, C.; Crommelin, L.; Troy, L.; Martin, C.; Pettit, C.; Airbnb, I.; Crommelin, L.; et al. Is Airbnb a Sharing Economy Superstar? Evidence from Five Global Cities Is Airbnb a Sharing Economy Superstar? Evidence from Five Global Cities. Urban Policy Res. 2018, 1146, 1–16. [Google Scholar] [CrossRef]
- Cocola-Gant, A.; Gago, A. Airbnb, buy-to-let investment and tourism-driven displacement. A case study in Lisbon. EPA Econ. Space 2019, 1–18. [Google Scholar] [CrossRef] [Green Version]
- Christensen, C.M.; Raynor, M.; McDonald, R. What is disruptive innovation? Harv. Bus. Rev. 2015, 93, 44–53. [Google Scholar]
- Guttentag, D. Airbnb: Disruptive innovation and the rise of an informal tourism accommodation sector. Curr. Issues Tour. 2015, 18, 1192–1217. [Google Scholar] [CrossRef]
- Airbnb Blog Post. Available online: https://blog.atairbnb.com/5-things-you-didnt-know-about-airbnbs-growth/ (accessed on 30 December 2019).
- Airbnb Fast Facts. Available online: https://news.airbnb.com/fast-facts/ (accessed on 23 January 2020).
- Arbel, A.; Pizam, A. Some Determinants of Urban Hotel Location: The Tourists’ Inclinations. J. Travel Res. 1977, 15, 18–22. [Google Scholar] [CrossRef]
- Cocola-Gant, A. Gentrification and displacement: Urban inequality in cities of late capitalism. In Handbook of Urban Geography; Edward Elgar Publishing: Cheltenham, UK, 2019; pp. 295–310. [Google Scholar]
- David, P.A. Path dependence, its critics and the quest for “historical economics”. In The Evolution of Economic Institutions: A Critical Reader; Hodgson, G., Ed.; Edward Elgar Publishing: Cheltenham, UK, 2000; pp. 120–142. ISBN 9781847200839. [Google Scholar]
- European Cities Call for Action on Short-Term Holiday Rentals. Position Paper on Better EU-Legislation of Platforms Offering Short-Term Holiday Rental. Available online: https://eurocities.eu/wp-content/uploads/2020/08/EUROPEAN_CITIES_ALLIANCE_ON_SHORT_TERM_RENTALS_final.pdf (accessed on 20 September 2020).
- The Digital Services Act: Making Digital Opportunities Work for People and the Public Good. Available online: https://eurocities.eu/wp-content/uploads/2020/09/Eurocities-Policy-Paper-on-the-Digital-Services-Act.pdf (accessed on 20 September 2020).
- Eurocities Opportunities and challenges in a digital era—Cities meeting with Margrethe Vestager. Available online: https://eurocities.eu/latest/opportunities-and-challenges-in-a-digital-era-cities-meeting-with-margrethe-vestager/ (accessed on 20 September 2020).
- AirDNA The AI that Fuels AirDNA. Available online: https://www.airdna.co/blog/short-term-rental-data-methodology/ (accessed on 23 January 2020).
- Guttentag, D. Progress on Airbnb: A literature review. J. Hosp. Tour. Technol. 2019, 10, 233–263. [Google Scholar] [CrossRef]
- Dolnicar, S. Annals of Tourism Research A review of research into paid online peer-to-peer accommodation: Launching the Annals of Tourism Research Curated Collection on peer-to-peer accommodation. Ann. Tour. Res. 2019, 75, 248–264. [Google Scholar] [CrossRef]
- Ashworth, G.; Page, S.J. Urban tourism research: Recent progress and current paradoxes. Tour. Manag. 2011, 32, 1–15. [Google Scholar] [CrossRef]
- Picascia, S.; Romano, A.; Teobaldi, M. The airification of cities: Making sense of the impact of peer to peer short term letting on urban functions and economy. In Proceedings of the Annual Congress of the Association of European Schools of Planning, Lisbon, Portugal, 11–14 July 2017. [Google Scholar]
- Coyle, D.; Yeung, T.Y.-C. Understanding AirBnB in Fourteen European Cities. Jean-Jacques Laffont Digit. Chair Work. Pap. 2016, 7088, 1–33. [Google Scholar]
- Adamiak, C.; Szyda, B.; Dubownik, A.; García-Álvarez, D. Airbnb offer in Spain-Spatial analysis of the pattern and determinants of its distribution. ISPRS Int. J. Geo-Inf. 2019, 8, 155. [Google Scholar] [CrossRef] [Green Version]
- Abdar, M.; Yen, N.Y. Understanding regional characteristics through crowd preference and confidence mining in P2P accommodation rental service. Libr. Hi Tech 2017. [Google Scholar] [CrossRef]
- Ritchie, B.W.; Jiang, Y. Annals of Tourism Research A review of research on tourism risk, crisis and disaster management: Launching the annals of tourism research curated collection on tourism risk, crisis and disaster management. Ann. Tour. Res. 2019, 79, 102812. [Google Scholar] [CrossRef]
- UNWTO Impact Assessment of the COVID-19 Outbreak on International Tourism. Available online: https://www.unwto.org/impact-assessment-of-the-covid-19-outbreak-on-international-tourism (accessed on 20 July 2020).
- AirDNA Impact of the Coronavirus on Global Short-Term Rental Markets. Available online: https://www.airdna.co/blog/coronavirus-impact-on-global-short-term-rental-markets (accessed on 18 July 2020).
- Farmaki, A.; Miguel, C.; Drotarova, M.H.; Aleksić, A.; Časni, A.Č.; Efthymiadou, F. Impacts of Covid-19 on peer-to-peer accommodation platforms: Host perceptions and responses. Int. J. Hosp. Manag. 2020, 91, 102663. [Google Scholar] [CrossRef] [PubMed]
- Zoğal, V.; Domènech, A.; Emekli, G. Stay at (which) home: Second homes during and after the COVID-19 pandemic. J. Tour. Futures 2020. [Google Scholar] [CrossRef]
- Celata, F.; Romano, A. Overtourism and online short-term rental platforms in Italian cities. J. Sustain. Tour. 2020, 1–20. [Google Scholar] [CrossRef]
- Pasquale, M. The Tourists Are Leaving Italy. Now Catastrophe Looms. Available online: https://edition.cnn.com/travel/article/italy-tourism-economy-catastrophe-covid/index.html (accessed on 22 September 2020).
- Italy’s Most Iconic Destinations, from Venice to Rome, Will Lose Billions as Result of Coronavirus Downturn. There Will Be 34 Million Fewer Tourist Stays in Rome, Venice, Florence, Milan and Turin this Year. Available online: https://www.telegraph.co.uk/news/2020/08/03/italys-iconic-destinations-venice-rome-will-lose-billions-result/ (accessed on 20 September 2020).
- Dolnicar, S.; Zare, S. COVID19 and Airbnb—Disrupting the Disruptor. Ann. Tour. Res. 2020, 83, 102961. [Google Scholar] [CrossRef]
Figure 1.
The rapid growth of international arrivals worldwide. This optimistic forecast has been made in a year preceding the COVID-19 outbreak. The figure based on data presented by the UNWTO Tourism Barometer [3].
Figure 1.
The rapid growth of international arrivals worldwide. This optimistic forecast has been made in a year preceding the COVID-19 outbreak. The figure based on data presented by the UNWTO Tourism Barometer [3].

Figure 2.
The sample contains 189 cities that meet basic requirements: research area delimitation to the European peninsula without Russia and Turkey; the 6-year period between Q2 2014 and Q2 2020; cities with more than 100 thousand residents; cities that according to the AirDNA data at least once during exceeded the number of 1000 active listings.

Figure 3.
The stacked bar chart presenting the logarithmic distribution of the Airbnb active listings in Europe. The series have been truncated at 42—presenting the cities that at least once exceeded the 5000 active listings—for reasons of space with remaining cities tend to 1000 active listings. Order by value for Q3 2019 marked by line on the top of diagram.

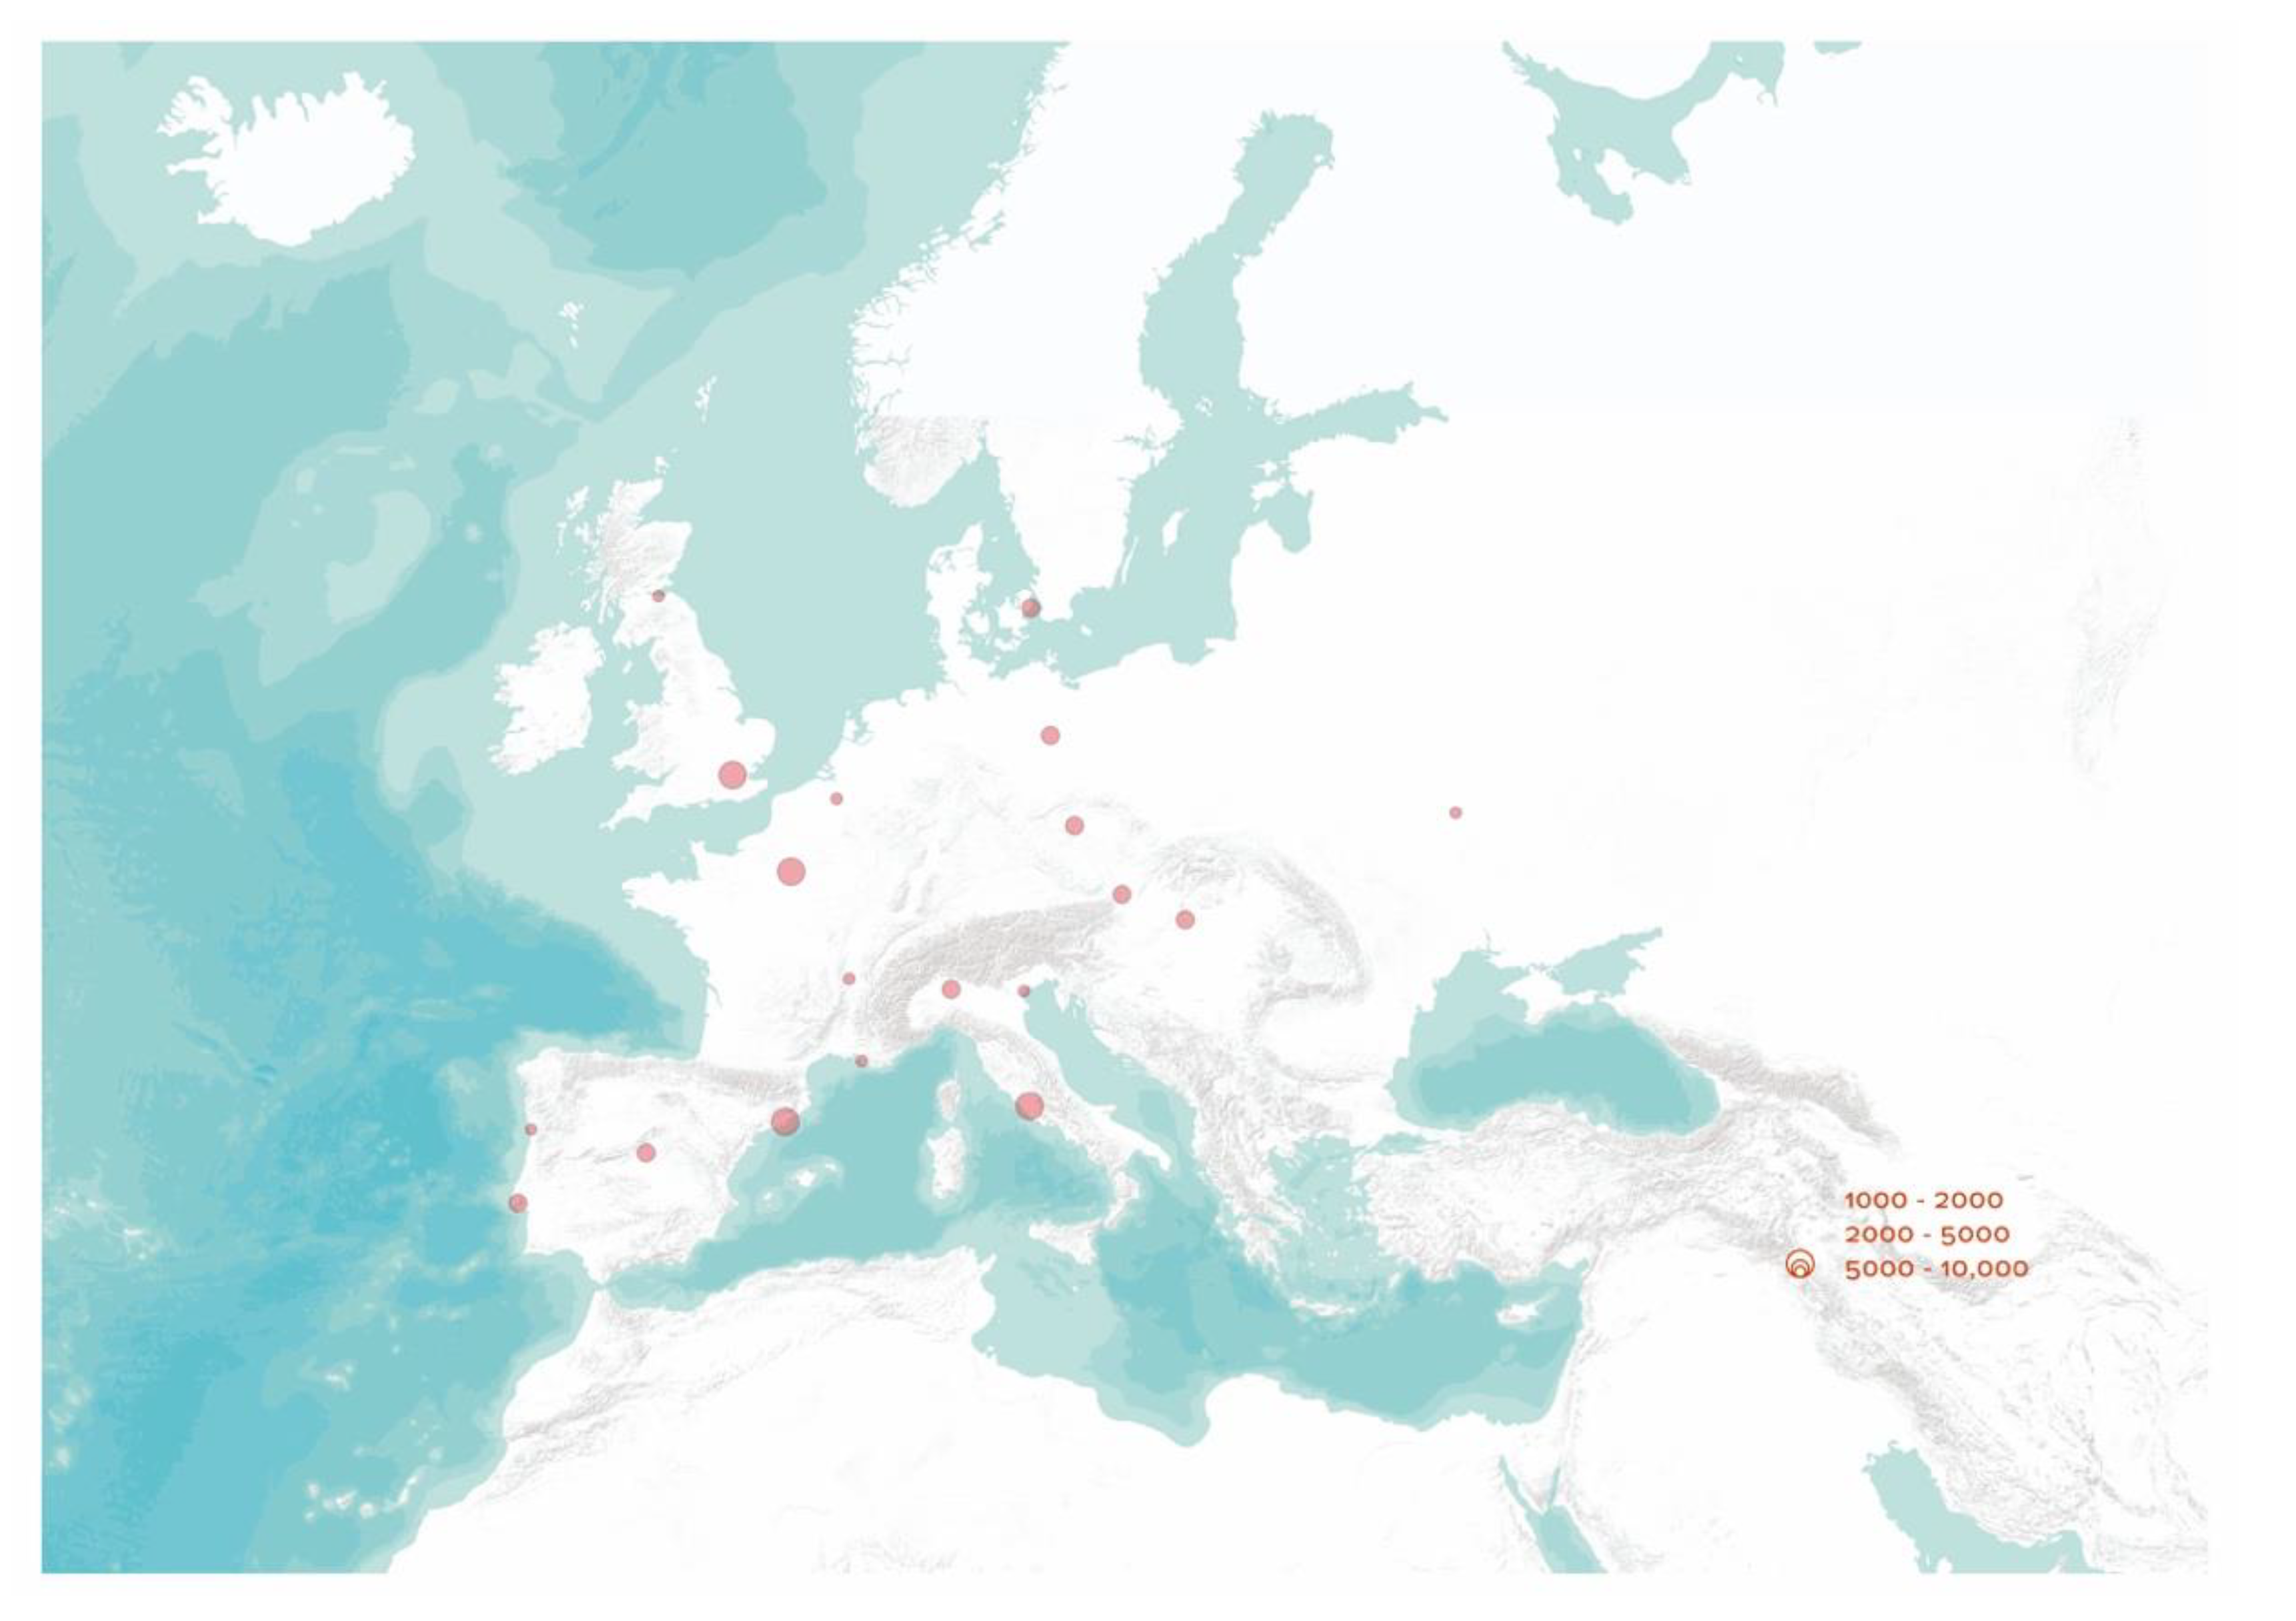
Figure 4.
The very beginning of the Airbnb phenomenon in Europe. Only 19 cities exceed 1000 active listings. The number of the Airbnb active listings in the 3rd quarter of 2014.
Figure 4.
The very beginning of the Airbnb phenomenon in Europe. Only 19 cities exceed 1000 active listings. The number of the Airbnb active listings in the 3rd quarter of 2014.

Figure 5.
With 60 enlisted cities—that exceed 1000 active listings—the eruption of the Airbnb phenomenon is clearly visible. The number of the Airbnb active listings in the 3rd quarter of 2015.
Figure 5.
With 60 enlisted cities—that exceed 1000 active listings—the eruption of the Airbnb phenomenon is clearly visible. The number of the Airbnb active listings in the 3rd quarter of 2015.

Figure 6.
The initial eruption of the Airbnb phenomenon seems to reach its breaking point—with 95 cities that exceed 1000 active listings. The number of the Airbnb active listings in the 3rd quarter of 2016.
Figure 6.
The initial eruption of the Airbnb phenomenon seems to reach its breaking point—with 95 cities that exceed 1000 active listings. The number of the Airbnb active listings in the 3rd quarter of 2016.

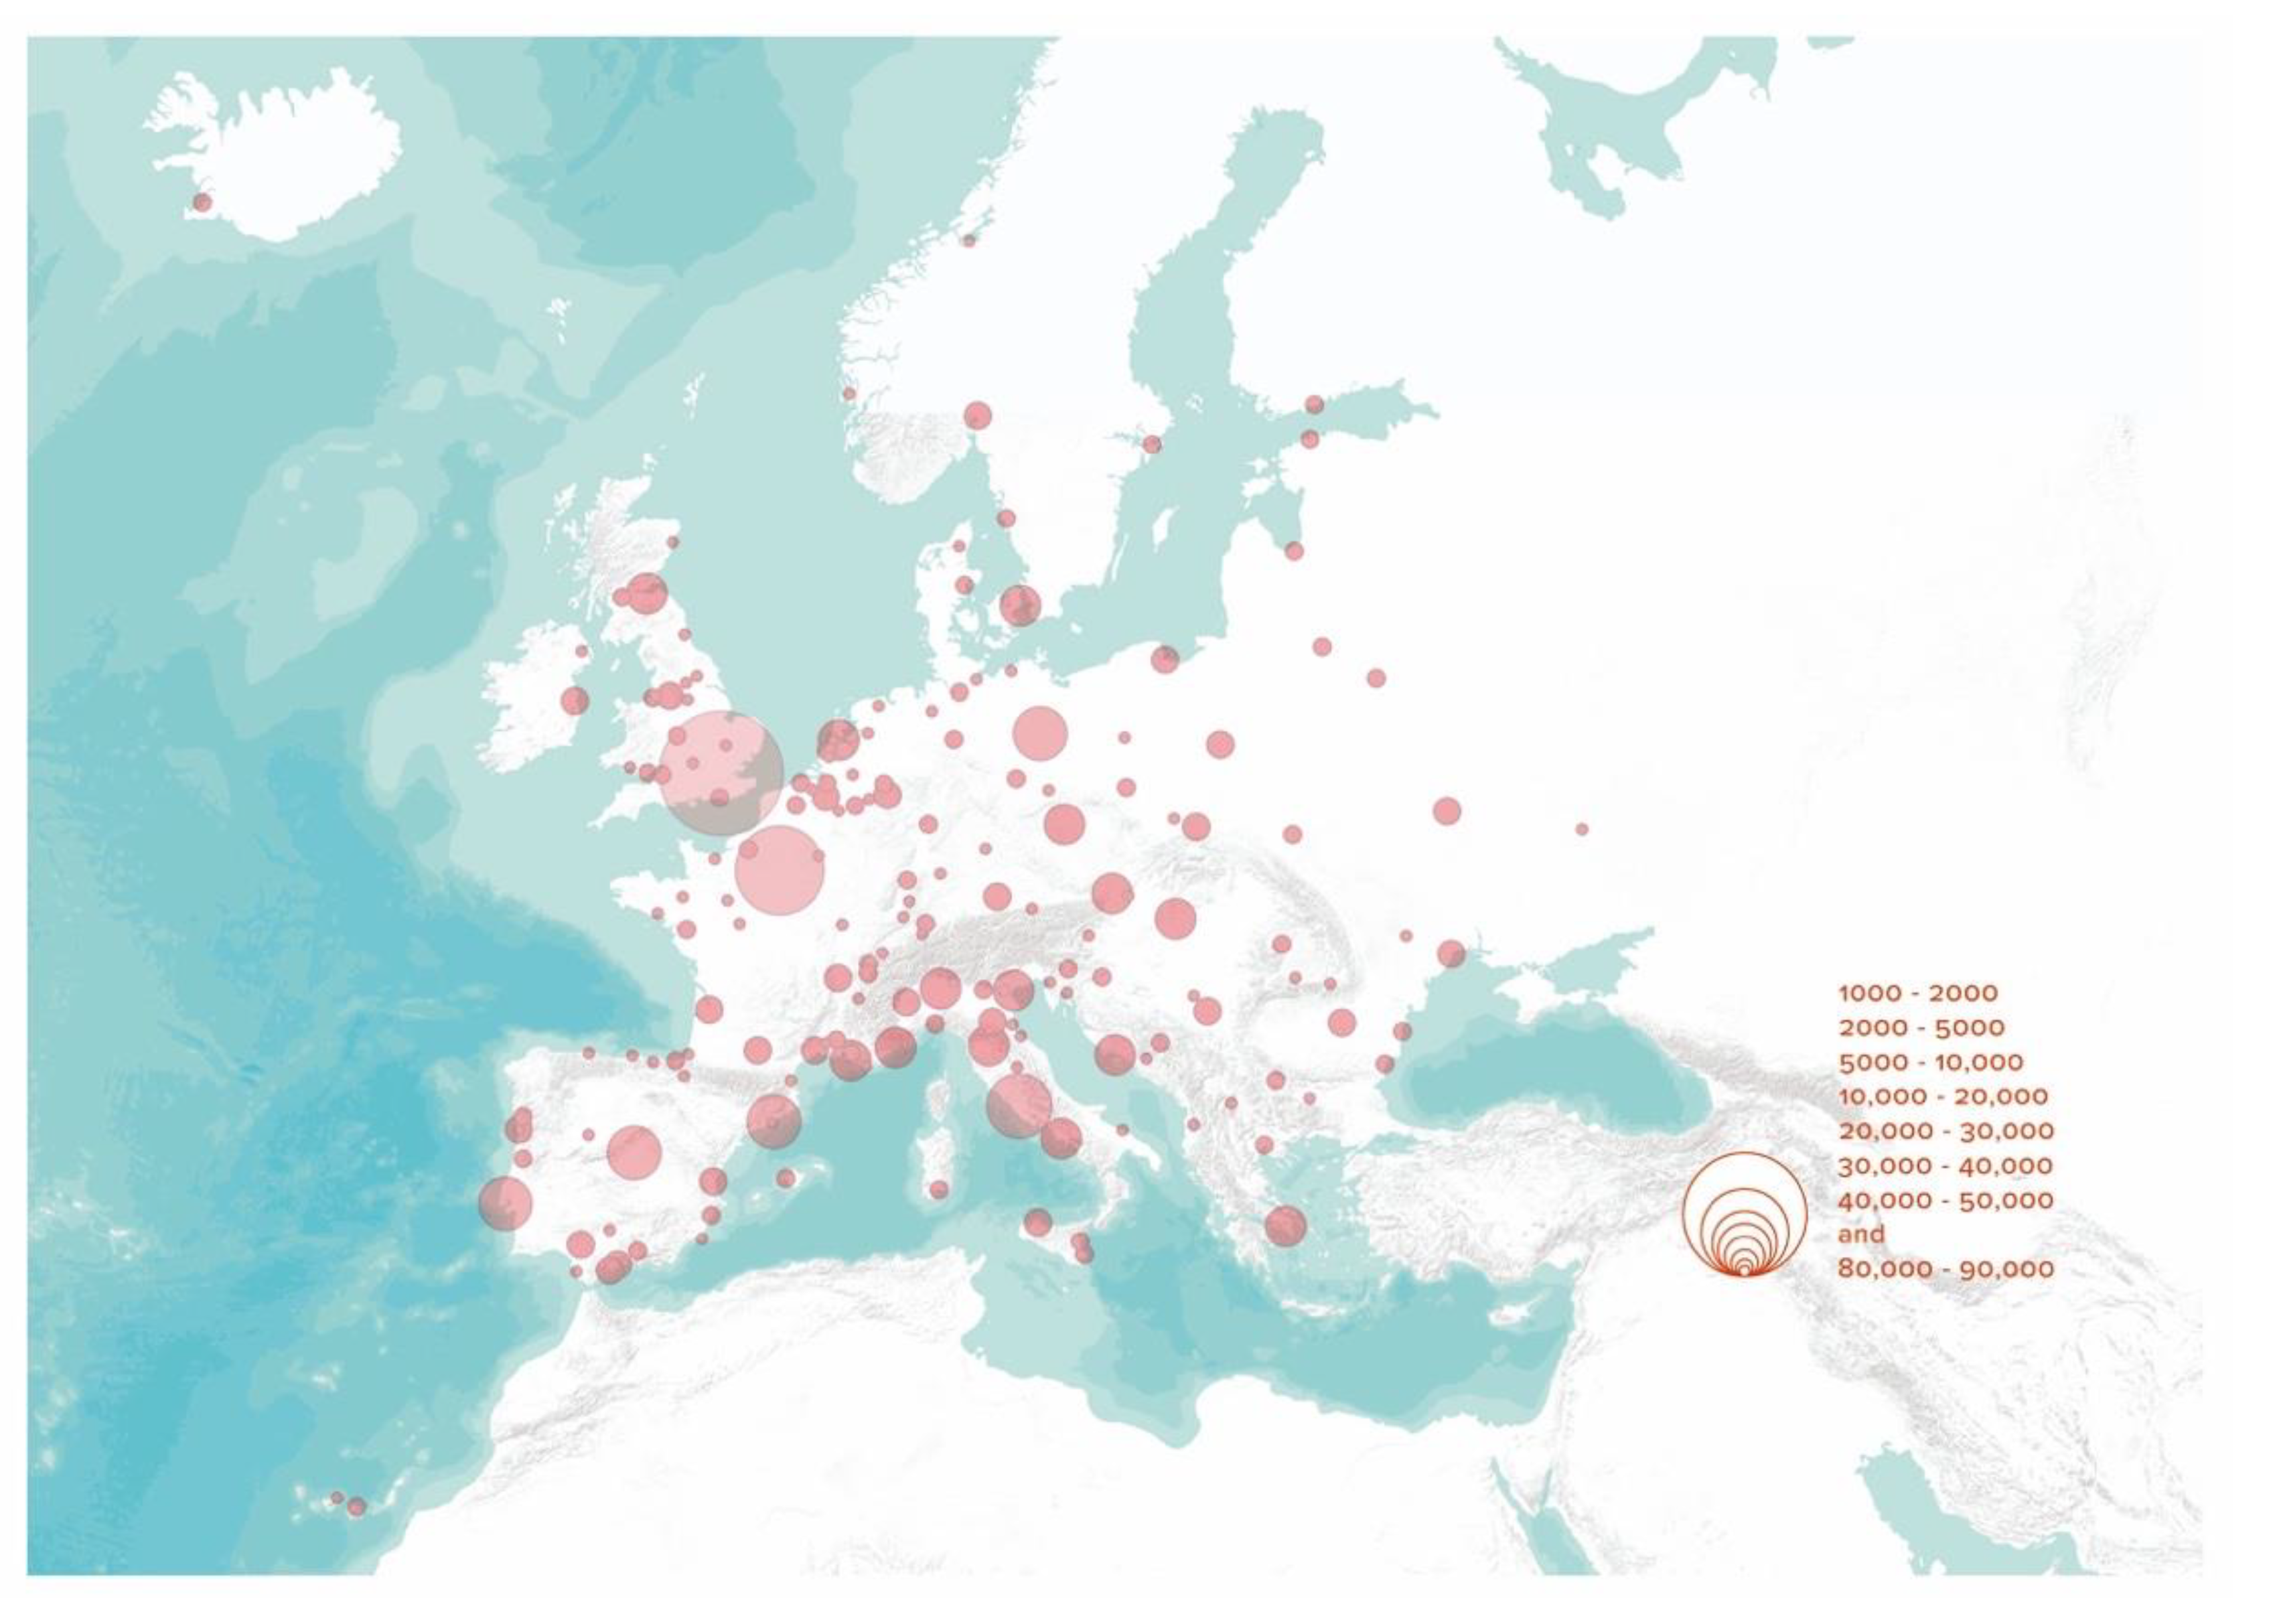
Figure 7.
After 3 years—with 185 cities that exceed 1000 active listings—the further spread of the Airbnb phenomenon is clearly visible. The number of the Airbnb active listings in the 3rd quarter of 2019.
Figure 7.
After 3 years—with 185 cities that exceed 1000 active listings—the further spread of the Airbnb phenomenon is clearly visible. The number of the Airbnb active listings in the 3rd quarter of 2019.

Figure 8.
The box-and-whisker plot presenting the distribution of whole dataset representing the growth of the Airbnb active listings in Europe between Q2 2014–Q2 2020. Due to comprise outstanding examples the data has been plotted on a square root scale.
Figure 8.
The box-and-whisker plot presenting the distribution of whole dataset representing the growth of the Airbnb active listings in Europe between Q2 2014–Q2 2020. Due to comprise outstanding examples the data has been plotted on a square root scale.

Figure 9.
The 3 main trajectories of the Airbnb growth clustered according to at least 1000 active listing recorded in 3rd quarter of 2014, 2015, and 2016 (overlapping with already presented maps). Every curve has been presented in form of rough data as well as centered moving averages (2 × 4-MA) that depicting the actual tendency of the phenomenon.


Table 1.
189 European cities that exceed 1000 active listings during summer peak between 2014 and 2019. Cities enlisted here have been mapped out on Figure 4, Figure 5, Figure 6 and Figure 7.
| Q3 2014 | Paris; Barcelona; London; Rome; Copenhagen; Milan; Berlin; Madrid; Lisbon; Prague; Budapest; Vienna; Venice; Brussels; Lyon; Edinburgh; Kiev; Marseille; Porto (19) |
| Q3 2015 | Amsterdam; Munich; Florence; Nice; Split; Hamburg; Dublin; Cologne; Stockholm; Valencia; Seville; Oslo; Montpellier; Palermo; Málaga; Athens; Turin; Toulouse; Napoli; Warsaw; Reykjavik; Zurich; Kraków; Aix-en-Provence; Bologna; Odessa; Zagreb; Geneva; Strasbourg; Frankfurt; Helsinki; Utrecht; Düsseldorf; Minsk; Bucharest; Donostia/San Sebastián; Nantes; Glasgow; Gothenburg; Vilnius; The Hague (41) |
| Q3 2016 | Bordeaux; Palma; Lille; Brighton and Hove; Hannover; Avignon; Siracusa; Granada; Manchester; Aarhus; Verona; Gdańsk; Catania; Leipzig; Alicante; Tallinn; Bergen; Rotterdam; Cagliari; Rīga; Genoa; Sarajevo; Antwerp; Bristol; Sofia; Liège; Oxford; Annecy; Las Palmas de Gran Canaria; Braga; Ghent; Cardiff; Bruges; Malmö; Dresden (35) |
| Q3 2017 | Marbella; Belgrade; Lviv; Cork; Ljubljana; Wrocław; Skopje; Basel; Kassel; Coimbra; Thessaloniki; Constanta; Córdoba; Nîmes; Nürnberg; Rennes; Liverpool; Stuttgart; Cluj-Napoca; Cádiz; Toulon; Perugia; Varna; Novi Sad; Birmingham; Santander; Grenoble; Bilbao; Dijon; Tours; Groningen; Vila Nova de Gaia; Bayonne; Cambridge; Cartagena; Belfast; Bratislava; Luzern; Pamplona/Iruña; Perpignan; Haarlem; Rimini (47) |
| Q3 2018 | Le Mans; Namur; Rijeka; Bari; Zwolle; Aalborg; Brasov; Gdynia; Leeds; L’Hospitalet; Poznań; Freiburg im Breisgau; Tirana; Chișinău; Salzburg; Vannes; Padova; Mostar; Lübeck; Kharkiv; Santa Cruz de Tenerife; Aachen; Eindhoven; Rouen; Graz (25) |
| Q3 2019 | Swansea; Sibiu; Plovdiv; Reims; Rostock; Salamanca; Sheffield; Caen; Ravenna; Katowice; Newcastle upon Tyne; Bergamo; Trondheim; Gijón/Xixón; Bremen; Murcia; Ede; Aberdeen City (18) |
| Other * | Cheltenham; Košice; Bonn; Saint-Étienne (4) |
* cities that exceed 1000 active listings between Q2 2014 and Q2 2020 but not during a summer peak.
Publisher’s Note: MDPI stays neutral with regard to jurisdictional claims in published maps and institutional affiliations. |
© 2020 by the author. Licensee MDPI, Basel, Switzerland. This article is an open access article distributed under the terms and conditions of the Creative Commons Attribution (CC BY) license (http://creativecommons.org/licenses/by/4.0/).
Share and Cite
MDPI and ACS Style
Bugalski, Ł. The Undisrupted Growth of the Airbnb Phenomenon between 2014–2020. The Touristification of European Cities before the COVID-19 Outbreak. Sustainability 2020, 12, 9841. https://doi.org/10.3390/su12239841
AMA Style
Bugalski Ł. The Undisrupted Growth of the Airbnb Phenomenon between 2014–2020. The Touristification of European Cities before the COVID-19 Outbreak. Sustainability. 2020; 12(23):9841. https://doi.org/10.3390/su12239841
Chicago/Turabian StyleBugalski, Łukasz. 2020. "The Undisrupted Growth of the Airbnb Phenomenon between 2014–2020. The Touristification of European Cities before the COVID-19 Outbreak" Sustainability 12, no. 23: 9841. https://doi.org/10.3390/su12239841
Note that from the first issue of 2016, this journal uses article numbers instead of page numbers. See further details here.