
The Usefulness of the COVID-GRAM Score in Predicting the Outcomes of Study Population with COVID-19

 , , , , , , , , , , ,
  , , add
Show full author list
, , add
Show full author list
Abstract
:1. Introduction
2. Materials and Methods
2.1. Analyzed Population
2.2. Clinical Follow-Up and Outcomes
2.3. Study Groups
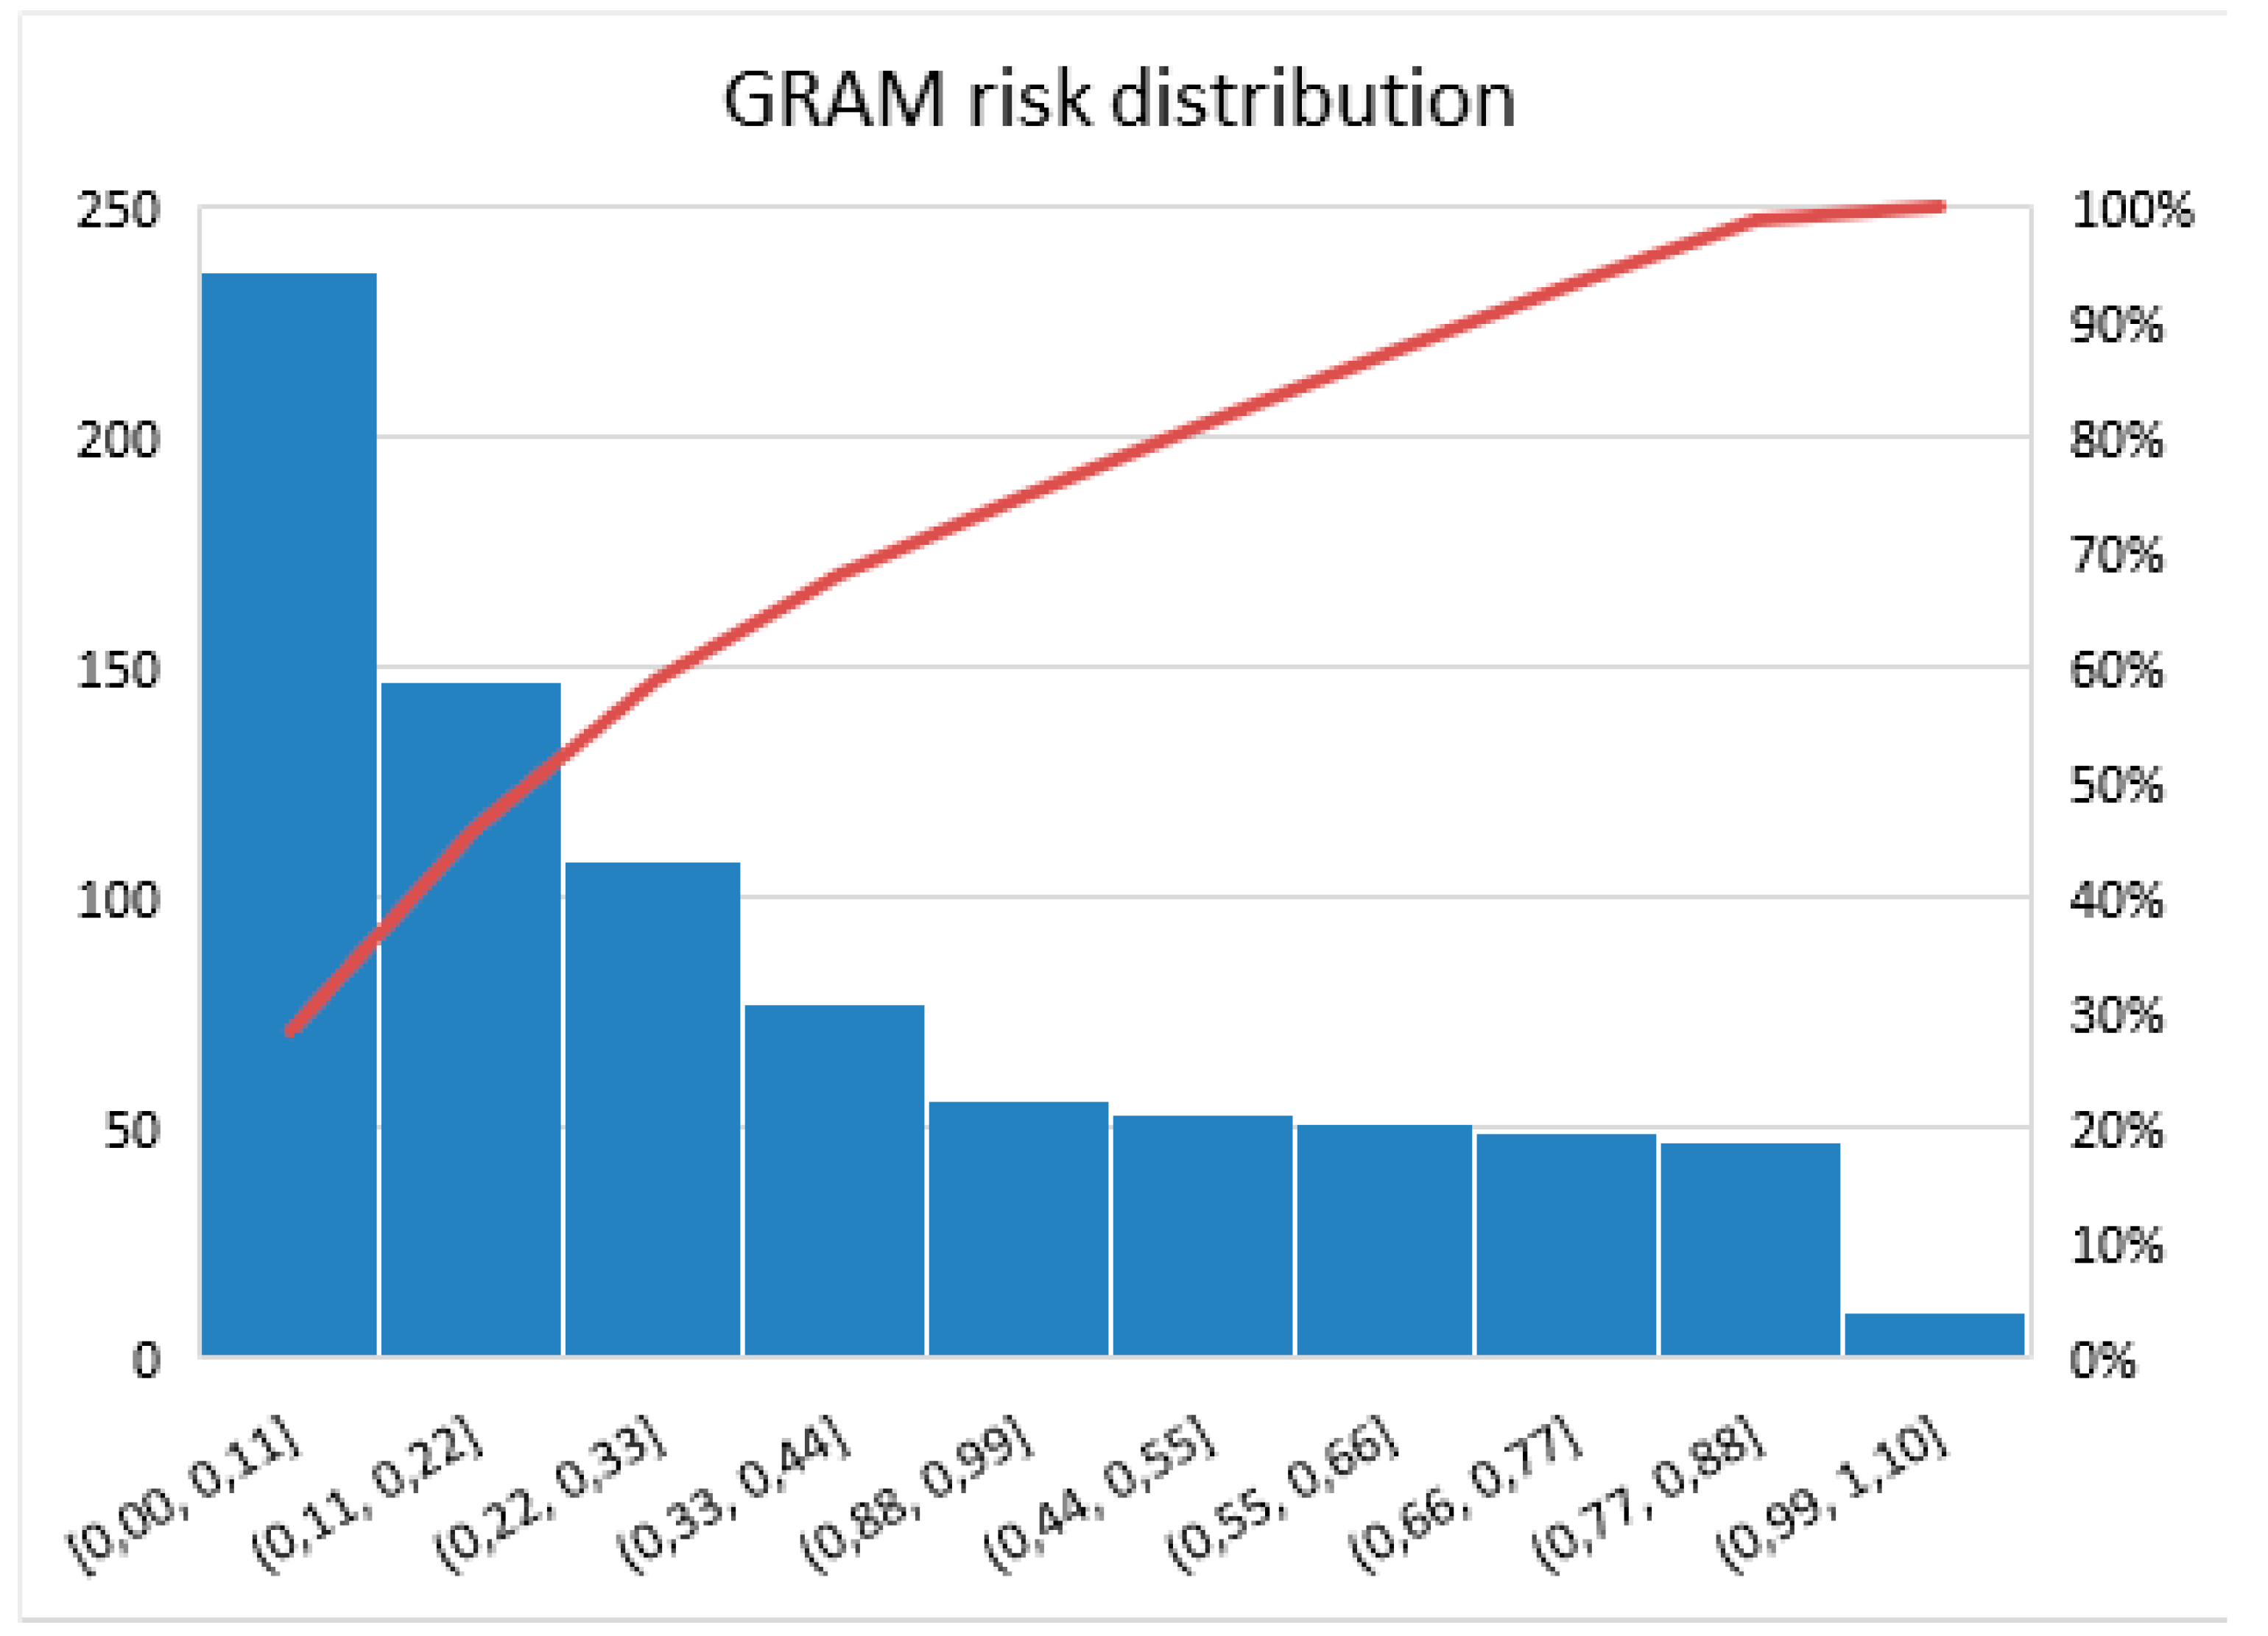
- Low risk: 0–0.41;
- Medium risk: 0.41–0.78;
- High risk: 0.78–1.00.
2.4. Statistical Analysis
3. Results
3.1. Patients Baseline Characteristics
3.2. Laboratory Test Results
3.3. Therapy Used during Hospitalization
3.4. Clinical Outcome
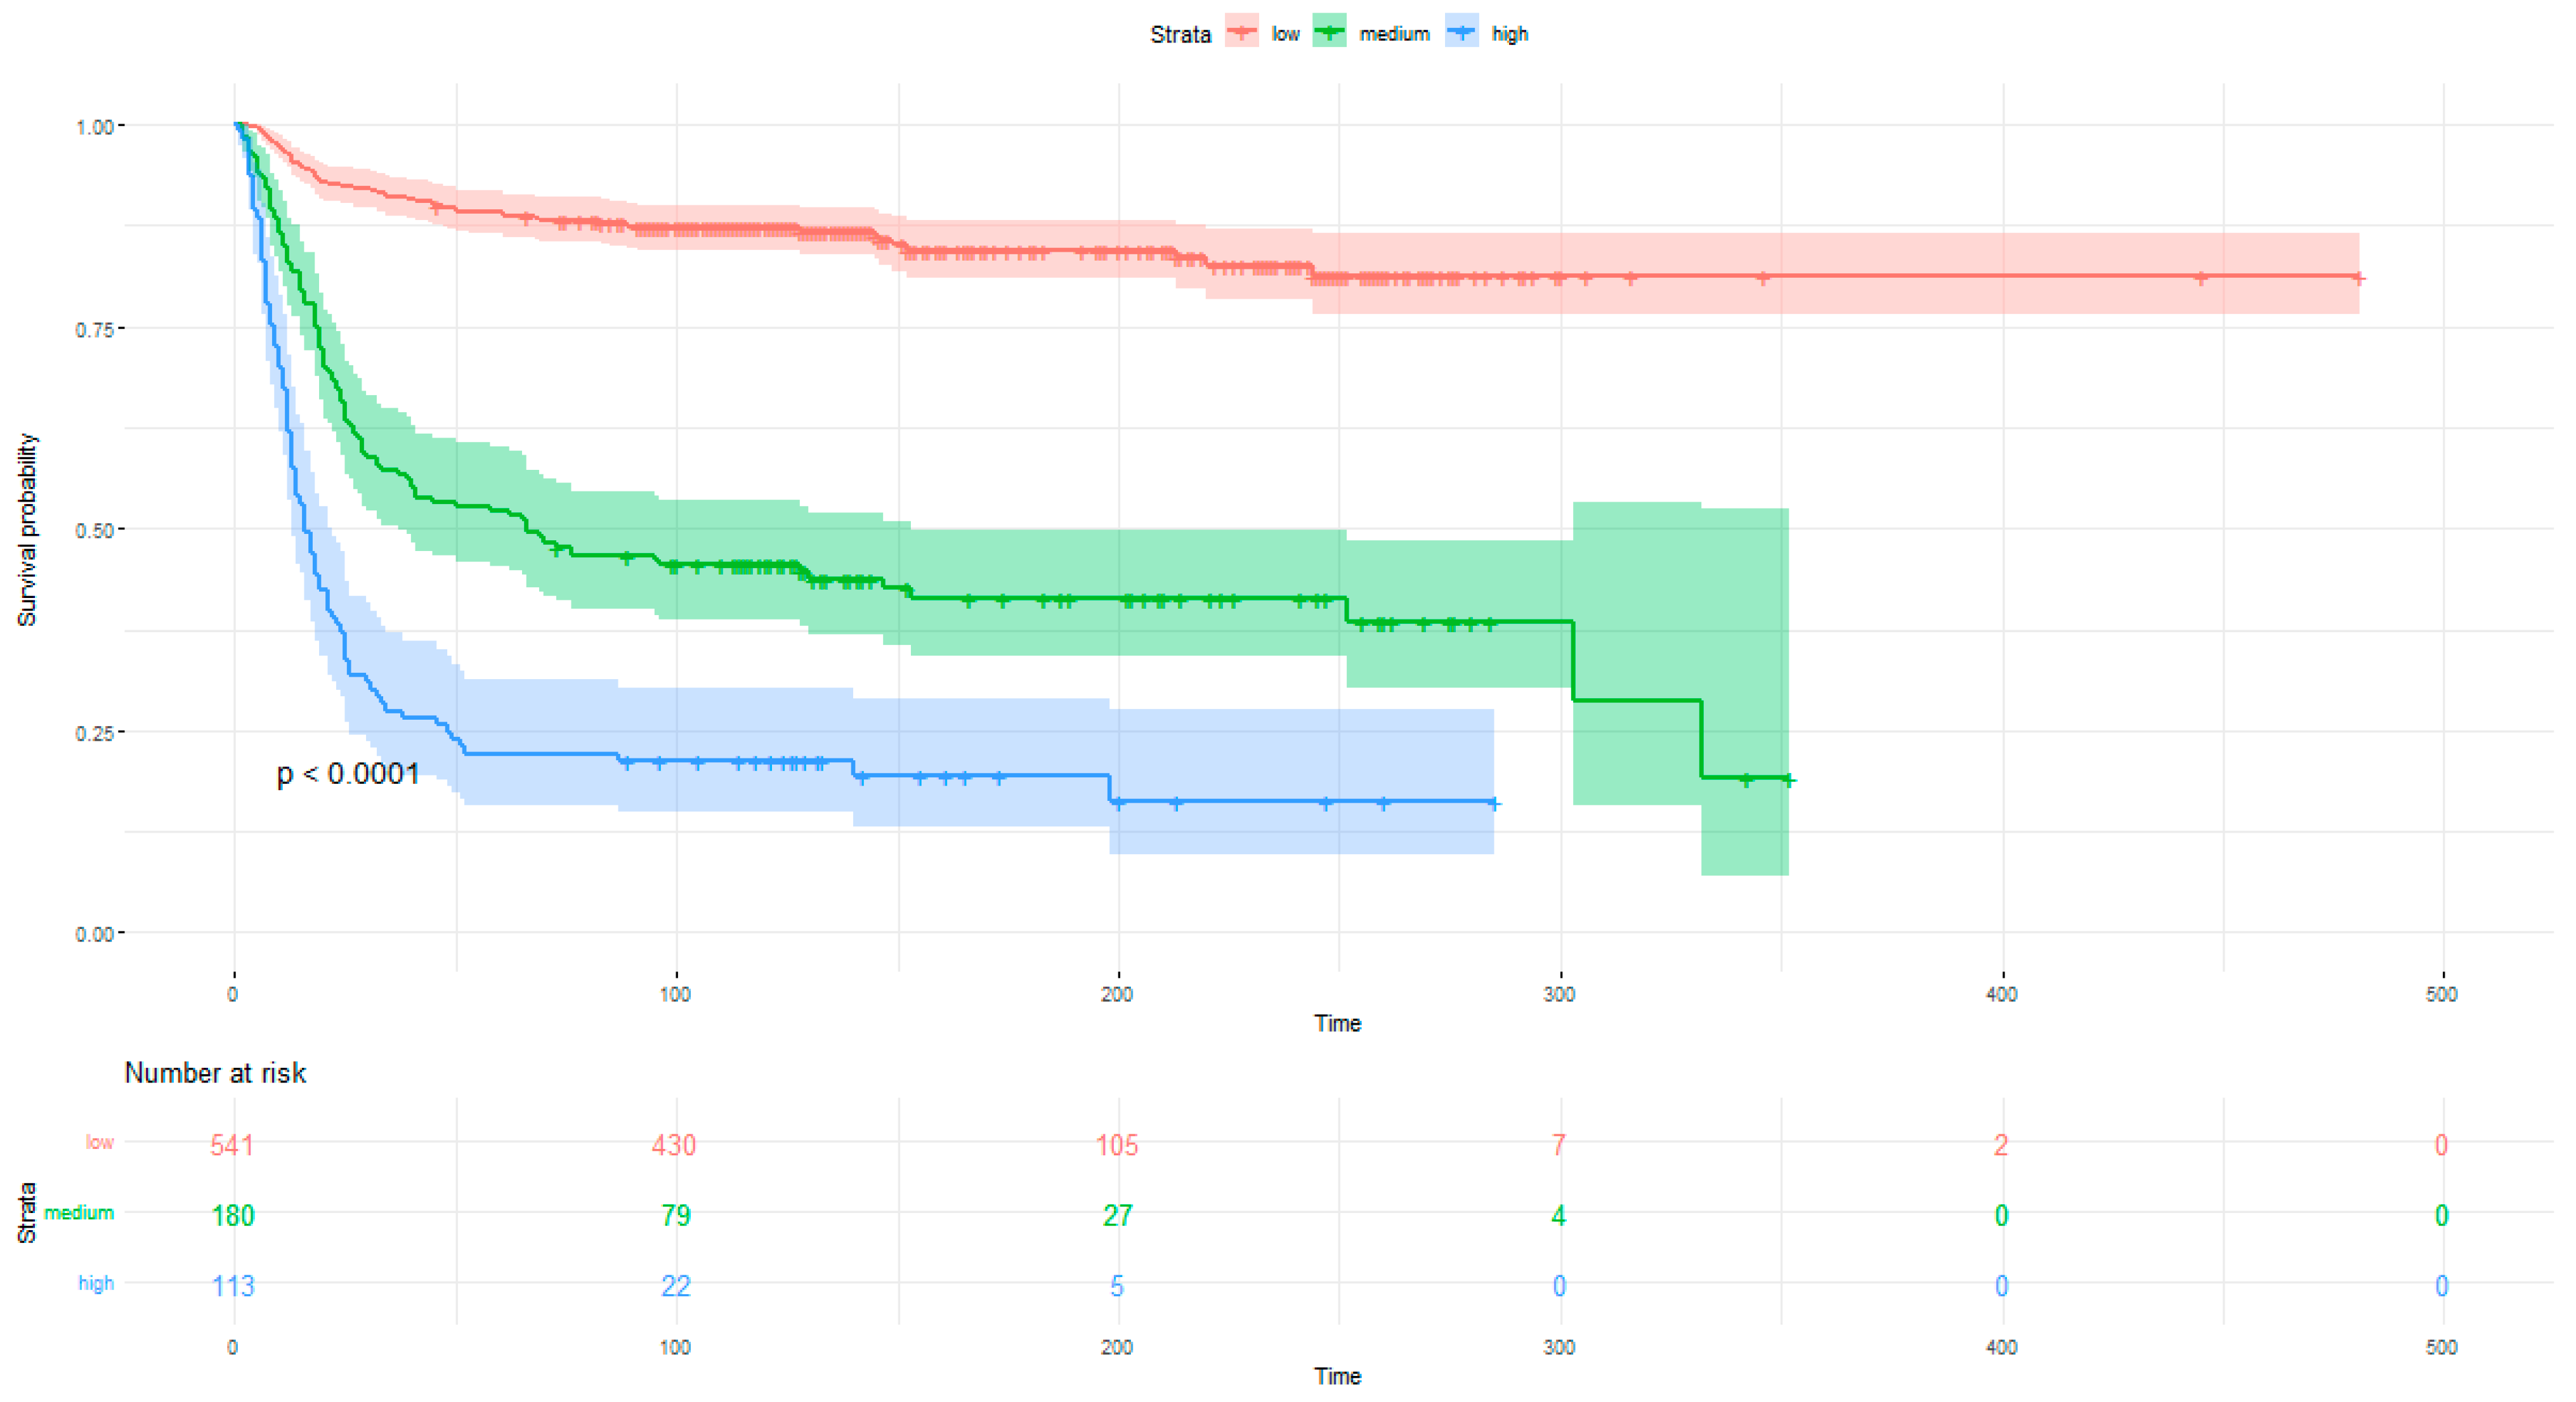
3.4.1. Correlation between COVID-GRAM Score and Mortality
3.4.2. Correlation between COVID-GRAM Score and the Secondary Endpoints
4. Discussion
5. Conclusions
Author Contributions
Funding
Institutional Review Board Statement
Informed Consent Statement
Data Availability Statement
Acknowledgments
Conflicts of Interest
References
- Available online: https://www.who.int/publications/m/item/weekly-epidemiological-update-on-covid-19 (accessed on 14 September 2022).
- Gupta, S.; Hayek, S.S.; Wang, W.; Chan, L.; Mathews, K.S.; Melamed, M.L.; Brenner, S.K.; Leonberg-Yoo, A.; Schenck, E.J.; Radbel, J.; et al. Factors Associated With Death in Critically Ill Patients With Coronavirus Disease 2019 in the US. JAMA Intern. Med. 2020, 180, 1436–1447. [Google Scholar] [CrossRef] [PubMed]
- Tan, E.; Song, J.; Deane, A.M.; Plummer, M.P. Global impact of coronavirus disease 2019 infection requiring admission to the ICU: A systematic review and meta-analysis. Chest 2021, 159, 524–536. [Google Scholar] [CrossRef] [PubMed]
- Ginestra, J.C.; Mitchell, O.J.; Anesi, G.L.; Christie, J.D. COVID-19 Critical Illness: A Data-Driven Review. Annu. Rev. Med. 2022, 73, 95–111. [Google Scholar] [CrossRef] [PubMed]
- Ishigami, J. Risk Factors for Severe COVID-19 in a Large Medical Records Linkage System in the United States. Mayo Clin. Proc. 2021, 96, 2508–2510. [Google Scholar] [CrossRef]
- Liang, W.; Guan, W.; Chen, R.; Wang, W.; Li, J.; Xu, K.; Li, C.; Ai, Q.; Lu, W.; Liang, H.; et al. Cancer patients in SARS-CoV-2 infection: A nationwide analysis in China. Lancet Oncol. 2020, 21, 335–337. [Google Scholar] [CrossRef]
- Zhou, F.; Yu, T.; Du, R.; Fan, G.; Liu, Y.; Liu, Z.; Xiang, J.; Wang, Y.; Song, B.; Gu, X.; et al. Clinical course and risk factors for mortality of adult inpatients with COVID-19 in Wuhan, China: A retrospective cohort study. Lancet 2020, 395, 1054–1062. [Google Scholar] [CrossRef]
- Liang, W.; Liang, H.; Ou, L.; Chen, B.; Chen, A.; Li, C.; Li, Y.; Guan, W.; Sang, L.; Lu, J.; et al. Development and Validation of a Clinical Risk Score to Predict the Occurrence of Critical Illness in Hospitalized Patients With COVID-19. JAMA Intern. Med. 2020, 180, 1081–1089. [Google Scholar] [CrossRef]
- Robin, X.; Turck, N.; Hainard, A.; Tiberti, N.; Lisacek, F.; Sanchez, J.-C.; Müller, M. pROC: An open-source package for R and S+ to analyze and compare ROC curves. BMC Bioinform. 2011, 12, 77. [Google Scholar] [CrossRef]
- Therneau, T.A. Package for Survival Analysis in R. R Package Version 3.2-7. Available online: https://cran.r-project.org (accessed on 16 December 2021).
- Doğanay, F.; Ak, R. Performance of the CURB-65, ISARIC-4C and COVID-GRAM scores in terms of severity for COVID-19 patients. Int. J. Clin. Pract. 2021, 75, e14759. [Google Scholar] [CrossRef]
- Martínez-Lacalzada, M.; Viteri-Noël, A.; Manzano, L.; Fabregate, M.; Rubio-Rivas, M.; García, S.L.; Arnalich-Fernández, F.; Beato-Pérez, J.L.; Vargas-Núñez, J.A.; Calvo-Manuel, E.; et al. Predicting critical illness on initial diagnosis of COVID-19: Development and validation of the PRIORITY model for outpatient applicability. Clin. Microbiol. Infect. 2021, 27, 1838–1844. [Google Scholar] [CrossRef]
- Covino, M.; De Matteis, G.; Burzo, M.L.; Russo, A.; Forte, E.; Carnicelli, A.; Piccioni, A.; Simeoni, B.; Gasbarrini, A.; Franceschi, F.; et al. Predicting In-Hospital Mortality in COVID-19 Older Patients with Specifically Developed Scores. J. Am. Geriatr. Soc. 2021, 69, 37–43. [Google Scholar] [CrossRef]
- Armiñanzas, C.; Revillas, F.A.D.L.; Cuadra, M.G.; Arnaiz, A.; Sampedro, M.F.; González-Rico, C.; Ferrer, D.; Mora, V.; Suberviola, B.; Latorre, M.; et al. Usefulness of the COVID-GRAM and CURB-65 scores for predicting severity in patients with COVID-19. Int. J. Infect. Dis. 2021, 108, 282–288. [Google Scholar] [CrossRef]
- Jibril, H.; Arshad, A.; Martins, R.S.; Jamil, B. Predicting Development of Critical Illness in Patients with COVID-19 Presenting to a Tertiary Care Hospital in a Developing Country. J. Ayub Med. Coll. Abbottabad JAMC 2022, 34, 256–262. [Google Scholar] [CrossRef]
- O’Caoimh, R.; O’Donovan, M.; McGrath, K.; Moloney, E. Comparison of Risk-Prediction Instruments in Frail Older Patients Diagnosed with COVID-19. J. Frailty Aging 2022, 11, 121–122. [Google Scholar] [CrossRef]
- Adab, P.; Haroon, S.; E O’Hara, M.; E Jordan, R. Comorbidities and COVID-19. BMJ 2022, 377, o1431. [Google Scholar] [CrossRef]
- Lansbury, L.; Lim, B.; Baskaran, V.; Lim, W.S. Co-infections in people with COVID-19: A systematic review and meta-analysis. J. Infect. 2020, 81, 266–275. [Google Scholar] [CrossRef]
- Liu, L.; Ni, S.-Y.; Yan, W.; Lu, Q.-D.; Zhao, Y.-M.; Xu, Y.-Y.; Mei, H.; Shi, L.; Yuan, K.; Han, Y.; et al. Mental and neurological disorders and risk of COVID-19 susceptibility, illness severity and mortality: A systematic review, meta-analysis and call for action. eClinicalMedicine 2021, 40, 101111. [Google Scholar] [CrossRef]
- Bigdelou, B.; Sepand, M.R.; Najafikhoshnoo, S.; Negrete, J.A.T.; Sharaf, M.; Ho, J.Q.; Sullivan, I.; Chauhan, P.; Etter, M.; Shekarian, T.; et al. COVID-19 and Preexisting Comorbidities: Risks, Synergies, and Clinical Outcomes. Front. Immunol. 2022, 13, 890517. [Google Scholar] [CrossRef]
- Clark, A.; Jit, M.; Warren-Gash, C.; Guthrie, B.; Wang, H.H.X.; Mercer, S.W.; Sanderson, C.; McKee, M.; Troeger, C.; Ong, K.L.; et al. Global, regional, and national estimates of the population at increased risk of severe COVID-19 due to underlying health conditions in 2020: A modelling study. Lancet Glob. Health 2020, 8, e1003–e1017. [Google Scholar] [CrossRef]
- Olivas-Martínez, A.; Cárdenas-Fragoso, J.L.; Jiménez, J.V.; Lozano-Cruz, O.A.; Ortiz-Brizuela, E.; Tovar-Méndez, V.H.; Medrano-Borromeo, C.; Martínez-Valenzuela, A.; Román-Montes, C.M.; Martínez-Guerra, B.; et al. In-hospital mortality from severe COVID-19 in a tertiary care center in Mexico City; causes of death, risk factors and the impact of hospital saturation. PLoS ONE 2021, 16, e0245772. [Google Scholar] [CrossRef]
- Song, J.; Zeng, M.; Wang, H.; Qin, C.; Hou, H.; Sun, Z.; Xu, S.; Wang, G.; Guo, C.; Deng, Y.; et al. Distinct effects of asthma and COPD comorbidity on disease expression and outcome in patients with COVID-19. Allergy 2021, 76, 483–496. [Google Scholar] [CrossRef] [PubMed]
- Liu, F.; Li, L.; Xu, M.; Wu, J.; Luo, D.; Zhu, Y.; Li, B.; Song, X.; Zhou, X. Prognostic value of interleukin-6, C-reactive protein, and procalcitonin in patients with COVID-19. J. Clin. Virol. 2020, 127, 104370. [Google Scholar] [CrossRef] [PubMed]
- Li, X.; Liu, C.; Mao, Z.; Xiao, M.; Wang, L.; Qi, S.; Zhou, F. Predictive values of neutrophil-to-lymphocyte ratio on disease severity and mortality in COVID-19 patients: A systematic review and meta-analysis. Crit. Care 2020, 24, 647. [Google Scholar] [CrossRef] [PubMed]
- Ali, N. Elevated level of C-reactive protein may be an early marker to predict risk for severity of COVID-19. J. Med. Virol. 2020, 92, 2409–2411. [Google Scholar] [CrossRef]
- Luo, X.; Zhou, W.; Yan, X.; Guo, T.; Wang, B.; Xia, H.; Ye, L.; Xiong, J.; Jiang, Z.; Liu, Y.; et al. Prognostic Value of C-Reactive Protein in Patients With Coronavirus 2019. Clin. Infect. Dis. 2020, 71, 2174–2179. [Google Scholar] [CrossRef]
- Bivona, G.; Agnello, L.; Ciaccio, A.M. Biomarkers for Prognosis and Treatment Response in COVID-19 Patients. Ann. Lab. Med. 2021, 41, 540–548. [Google Scholar] [CrossRef]
- Wu, C.; Chen, X.; Cai, Y.; Xia, J.; Zhou, X.; Xu, S.; Huang, H.; Zhang, L.; Zhou, X.; Du, C.; et al. Risk Factors Associated With Acute Respiratory Distress Syndrome and Death in Patients With Coronavirus Disease 2019 Pneumonia in Wuhan, China. JAMA Intern. Med. 2020, 180, 934–1031, Erratum in JAMA Intern. Med. 2020, 180, 1031. [Google Scholar] [CrossRef] [Green Version]
- Han, H.; Yang, L.; Liu, R.; Liu, F.; Wu, K.-L.; Li, J.; Liu, X.-H.; Zhu, C.-L. Prominent changes in blood coagulation of patients with SARS-CoV-2 infection. Clin. Chem. Lab. Med. (CCLM) 2020, 58, 1116–1120. [Google Scholar] [CrossRef] [Green Version]
- Cheng, Y.; Luo, R.; Wang, K.; Zhang, M.; Wang, Z.; Dong, L.; Li, J.; Yao, Y.; Ge, S.; Xu, G. Kidney disease is associated with in-hospital death of patients with COVID-19. Kidney Int. 2020, 97, 829–838. [Google Scholar] [CrossRef]
- Du, R.-H.; Liang, L.-R.; Yang, C.-Q.; Wang, W.; Cao, T.-Z.; Li, M.; Guo, G.-Y.; Du, J.; Zheng, C.-L.; Zhu, Q.; et al. Predictors of mortality for patients with COVID-19 pneumonia caused by SARS-CoV-2: A prospective cohort study. Eur. Respir. J. 2020, 55, 2000524. [Google Scholar] [CrossRef] [Green Version]
- Qu, J.; Truhan, J.J.; Dai, S.; Luo, H.; Blau, P.J. Ionic liquids with ammonium cations as lubricants or additives. Tribol. Lett. 2006, 22, 207–214. [Google Scholar] [CrossRef]
- Lombardi, Y.; Azoyan, L.; Szychowiak, P.; Bellamine, A.; Lemaitre, G.; Bernaux, M.; Daniel, C.; Leblanc, J.; Riller, Q.; Steichen, O.; et al. External validation of prognostic scores for COVID-19: A multicenter cohort study of patients hospitalized in Greater Paris University Hospitals. Intensiv. Care Med. 2021, 47, 1426–1439. [Google Scholar] [CrossRef]
- Rajpal, A.; Rahimi, L.; Ismail-Beigi, F. Factors leading to high morbidity and mortality of COVID -19 in patients with type 2 diabetes. J. Diabetes 2020, 12, 895–908. [Google Scholar] [CrossRef]
- Grant, W.B.; Lahore, H.; McDonnell, S.L.; Baggerly, C.A.; French, C.B.; Aliano, J.L.; Bhattoa, H.P. Evidence that Vitamin D Supplementation Could Reduce Risk of Influenza and COVID-19 Infections and Deaths. Nutrients 2020, 12, 988. [Google Scholar] [CrossRef] [Green Version]
- Mohan, M.; Cherian, J.J.; Sharma, A. Exploring links between vitamin D deficiency and COVID-19. PLoS Pathog. 2020, 16, e1008874. [Google Scholar] [CrossRef]
- Leung, J.M.; Niikura, M.; Yang, C.W.T.; Sin, D.D. COVID-19 and COPD. Eur. Respir. J. 2020, 56, 2002108. [Google Scholar] [CrossRef]
- Council, E.-E.; Ortiz, A.; Cozzolino, M.; Fliser, D.; Fouque, D.; Goumenos, D.; A Massy, Z.; Rosenkranz, A.R.; Rychlık, I.; Soler, M.J.; et al. Chronic kidney disease is a key risk factor for severe COVID-19: A call to action by the ERA-EDTA. Nephrol. Dial. Transplant. 2021, 36, 87–94. [Google Scholar] [CrossRef]
- Ronda, V.E.; Alcaraz, S.R.; Torregrosa, P.R.; Suau, M.G.; Pérez, E.N.; Ramírez, J.M.L.; Andrés, M.; Moreno-Pérez, Ó.; Blanes, A.C.; Gil Carbonell, J.; et al. Application of validated severity scores for pneumonia caused by SARS-CoV-2. Med. Clin. 2021, 157, 99–105. [Google Scholar] [CrossRef]


| Variables, Units (N) | Low Risk | Medium Risk | High Risk | OMNIBUS p-Value | p-Value for Post-Hoc Analysis |
|---|---|---|---|---|---|
| Mean ± SD Min-Max (N) or n/N (% of Risk Category) | Mean ± SD Min-Max (N) or n/N (% of Risk Category) | Mean ± SD Min-Max (N) or n/N (% of Risk Category) | |||
| Demographics | |||||
| Age, years (834) | 62.47 ± 15.2 20–97 (541) | 72.86 ± 11.8 27–98 (180) | 73.14 ± 12.47 23–93 (113) | <0.0001 | <0.0001 a,b 0.979 c |
| Age ≥ 65 years (834) | 290/541 (53.6%) | 146/180 (81.11%) | 94/113 (83.19%) | <0.0001 | <0.0001 a,b 1.0 c |
| Male gender (834) | 305/541 (56.38%) | 96/180 (53.33%) | 66/113 (58.41%) | 0.6648 | N/A |
| BMI, kg/m2 (270) | 28.6 ± 5.45 19.1–47.75 (159) | 29.00 ± 5.36 17.28–45.82 (69) | 29.74 ± 5.55 20.02–48.21 (42) | 0.4852 | N/A |
| Obesity (BMI ≥ 30 kg/m2) (270) | 58/159 (36.48%) | 31/69 (44.93%) | 21/42 (50.0%) | 0.2846 | N/A |
| Cigarette smoking never/previous/current (834) | 470/541 (87.2%) 44/541 (8.16%) 25/541 (4.64%) | 159/180 (88.83%) 11/180 (6.15%) 9/180 (5.03%) | 103/113 (91.15%) 7/113 (6.19%) 3/113 (2.65%) | 0.701 | N/A |
| Comorbidities | |||||
| Hypertension (834) | 294/541 (54.34%) | 135/180 (75.0%) | 96/113 (84.96%) | <0.0001 | <0.0001 a,b 0.1787 c |
| DM (834) | 113/541 (20.89%) | 63/180 (35.0%) | 53/113 (46.9%) | <0.0001 | 0.0061 a <0.0001 b 0.0559 c |
| Dyslipidemia (490) | 192/283 (67.84%) | 95/119 (79.83%) | 72/88 (81.82%) | 0.0062 | 0.0632 a 0.0502 b 1.0 c |
| AF/AFL (834) | 63/541 (11.65%) | 39/180 (21.67%) | 41/113 (36.28%) | <0.0001 | 0.0039 a <0.0001 b 0.0281 c |
| Previous coronary revascularization (834) | 30/541 (5.55%) | 26/180 (14.44%) | 28/113 (24.78%) | <0.0001 | 0.0006 a <0.0001 b 0.1165 c |
| Previous MI (834) | 37/541 (6.84%) | 30/180 (16.67%) | 37/113 (32.74%) | <0.0001 | 0.0005 a <0.0001 b 0.007 c |
| HF (834) | 41/541 (7.58%) | 49/180 (27.22%) | 45/113 (39.82%) | <0.0001 | <0.0001 a,b 0.1019 c |
| Moderate or severe valvular heart disease or previous valve heart surgery (834) | 20/541 (3.7%) | 18/180 (10.0%) | 16/113 (14.16%) | <0.0001 | 0.0061 a <0.0001 b 1.0 c |
| PAD (834) | 25/541 (4.62%) | 8/180 (4.44%) | 14/113 (12.39%) | 0.0037 | 1.0 a 0.0094 b 0.0671 c |
| Previous stroke/TIA (834) | 39/541 (7.21%) | 22/180 (12.22%) | 21/113 (18.58%) | 0.0005 | 0.1575 a 0.0008 b 0.5522 c |
| CKD (834) | 43/541 (7.95%) | 40/180 (22.22%) | 32/113 (28.32%) | <0.0001 | <0.0001 a, b 0.8944 c |
| Hemodialysis (834) | 12/541 (2.22%) | 14/180 (7.78%) | 5/113 (4.42%) | 0.0033 | 0.0052 a 0.5754 b 0.9986 c |
| Asthma (834) | 28/541 (5.18%) | 6/180 (3.33%) | 4/113 (3.54%) | 0.5054 | N/A |
| COPD (834) | 15/541 (2.77%) | 14/180 (7.78%) | 9/113 (7.96%) | 0.0036 | 0.0183 a 0.0499 b 1.0 c |
| Thyroid disease, none/hypothyroidism/ hyperthyroidism, (834) | 482/541 (89.09%) 52/541 (9.61%) 7/541 (1.29%) | 154/180 (85.56%) 22/180 (12.22%) 4/180 (2.22%) | 105/113 (92.92%) 8/113 (7.08%) 0/113 (0%) | 0.3153 | N/A |
| Variables. Units (N) | Low Risk | Medium Risk | High Risk | OMNIBUS p-Value | p-Value for Post-Hoc Analysis |
|---|---|---|---|---|---|
| n/N (% of Risk Category) | n/N (% of Risk Category) | n/N (% of Risk Category) | |||
| Treatment applied before hospitalization | |||||
| ACEI (834) | 113/541 (20.89%) | 62/180 (34.44%) | 38/113 (33.63%) | 0.0002 | 0.0011 a 0.0153 b 1.0 c |
| ARBs (834) | 65/541 (12.01%) | 10/180 (5.56%) | 10/113 (8.85%) | 0.0405 | 0.0614 a 1.0 b,c |
| MRAs (834) | 35/541 (6.47%) | 19/180 (10.56%) | 12/113 (10.62%) | 0.1104 | N/A |
| Sacubitril/valsartan (834) | 1/541 (0.18%) | 1/180 (0.56%) | 1/113 (0.88%) | 0.2833 | N/A |
| β-blocker (834) | 171/541 (31.61%) | 81/180 (45.0%) | 55/113 (48.67%) | 0.0001 | 0.0045 a 0.0023 b 1.0 c |
| Digitalis glycoside (834) | 6/541 (1.11%) | 1/180 (0.56%) | 1/113 (0.88%) | 0.877 | N/A |
| Calcium channel blocker (non-dihydropiridines) (834) | 14/541 (2.59%) | 6/180 (3.33%) | 1/113 (0.88%) | 0.4811 | N/A |
| Calcium channel blocker (dihydropiridines) (834) | 100/541 (18.48%) | 35/180 (19.44%) | 20/113 (17.7%) | 0.9277 | N/A |
| α-adrenergic blocker (834) | 37/541 (6.84%) | 16/180 (8.89%) | 12/113 (10.62%) | 0.326 | N/A |
| Thiazide or thiazide-like diuretic (834) | 52/541 (9.61%) | 19/180 (10.56%) | 11/113 (9.73%) | 0.9338 | N/A |
| Loop diuretic (834) | 52/541 (9.61%) | 32/180 (17.78%) | 24/113 (21.24%) | 0.0003 | 0.0142 a 0.0025 b 1.0 c |
| Statin (834) | 11/541 (20.52%) | 60/180 (33.33%) | 39/113 (34.51%) | 0.0001 | 0.002 a 0.0059 b 1.0 c |
| Acetylsalicylic acid (834) | 82/541 (15.16%) | 35/180 (19.44%) | 28/113 (24.78%) | 0.0351 | 0.6508 a 0.0565 b 1.0 c |
| The second antiplatelet drug—P2Y12 inhibitor (834) | 7/541 (1.29%) | 5/180 (2.78%) | 5/113 (4.42%) | 0.0626 | N/A |
| LMWH (834) | 47/541 (8.69%) | 15/180 (8.33%) | 16/113 (14.16%) | 0.1668 | N/A |
| VKA (834) | 13/541 (2.4%) | 7/180 (3.89%) | 3/113 (2.65%) | 0.5427 | N/A |
| NOAC (834) | 31/541 (5.73%) | 11/180 (6.11%) | 15/113 (13.27%) | 0.014 | 1.0 a 0.0241 b 0.1772 c |
| Insulin (834) | 31/541 (5.73%) | 14/180 (7.78%) | 17/113 (15.04%) | 0.0027 | 1.0 a 0.0034 b 0.2286 c |
| Metformin (834) | 72/541 (13.31%) | 35/180 (19.44%) | 21/113 (18.58%) | 0.0834 | N/A |
| SGLT2 inhibitor (834) | 9/541 (1.66%) | 2/180 (1.11%) | 3/113 (2.65%) | 0.558 | N/A |
| Oral antidiabetics other than SGLT2 inhibitor and metformin (834) | 26/541 (4.81%) | 12/180 (6.67%) | 12/113 (10.62%) | 0.0553 | N/A |
| Proton pump inhibitor (834) | 70/541 (12.94%) | 45/180 (25.0%) | 21/113 (18.58%) | 0.0005 | 0.0006 a 0.4603 b 0.7679 c |
| Oral corticosteroid (834) | 33/541 (6.1%) | 6/180 (3.33%) | 11/113 (9.73%) | 0.079 | N/A |
| Immunosuppression other than oral corticosteroid (834) | 24/541 (4.44%) | 9/180 (5.0%) | 6/113 (5.31%) | 0.8985 | N/A |
| Variables, Units (N) | Low Risk | Medium Risk | High Risk | OMNIBUS p-Value | p-Value for Post-Hoc Analysis |
|---|---|---|---|---|---|
| Mean ± SD Min-Max (N) or n/N (% of Risk Category) | Mean ± SD Min-Max (N) or n/N (% of Risk Category) | Mean ± SD Min-Max (N) or n/N (% of Risk Category) | |||
| Patient-reported symptoms | |||||
| Cough (834) | 211/541 (39.0%) | 61/180 (33.89%) | 35/113 (30.97%) | 0.1797 | N/A |
| Dyspnea (834) | 250/541 (46.21%) | 96/180 (53.33%) | 65/113 (57.52%) | 0.043 | 0.3487 a 0.1112 b 1.0 c |
| Chest pain (834) | 44/541 (8.13%) | 6/180 (3.33%) | 10/113 (8.85%) | 0.0744 | N/A |
| Hemoptysis (834) | 2/541 (0.37%) | 2/180 (1.11%) | 3/113 (2.65%) | 0.0297 | 0.7825 a 0.1156 b 1.0 c |
| Smell dysfunction (834) | 26/541 (4.81%) | 4/180 (2.22%) | 2/113 (1.77%) | 0.1837 | N/A |
| Taste dysfunction (834) | 23/541 (4.25%) | 3/180 (1.67%) | 3/113 (2.65%) | 0.29 | N/A |
| Abdominal pain (834) | 33/541 (6.1%) | 12/180 (6.67%) | 4/113 (3.54%) | 0.5047 | N/A |
| Diarrhea (834) | 48/541 (8.87%) | 11/180 (6.11%) | 6/113 (5.31%) | 0.2787 | N/A |
| Nausea and/or vomiting (834) | 19/541 (3.51%) | 10/180 (5.56%) | 4/113 (3.54%) | 0.4676 | N/A |
| Measured vital signs | |||||
| Body temperature °C (546) | 37.0 ± 0.9 35.3–40.0 (365) | 36.84 ± 0.83 34.4–40.0 (114) | 37.16 ± 1.0 35.9–40.5 (67) | 0.0611 | N/A |
| Heart rate beats/minute (762) | 85.27 ± 14.37 48–139 (493) | 83.72 ± 16.98 54–150 (167) | 85.35 ± 16.09 50–140 (102) | 0.5588 | N/A |
| Respiratory rate breaths/minute (105) | 18.22 ± 4.59 12–30 (46) | 20.31 ± 7.23 12–50 (32) | 19.26 ± 6.13 12–45 (27) | 0.3298 | N/A |
| SBP mmHg (772) | 135.62 ± 20.7 80–210 (499) | 131.07 ± 22.87 60–200 (170) | 133.06 ± 31.82 60–270 (103) | 0.0669 | N/A |
| DBP mmHg (767) | 79.82 + 12.11 40–143 (498) | 75.02 ± 13.34 40–110 (168) | 74.37 ± 19.55 40–150 (101) | <0.0001 | 0.0001 a 0.022 b 0.953 c |
| SpO2 on room air, % (FiO2 = 21%) (500) | 92.01 ± 6.35 48–99 (349) | 88.32 ± 10.42 55–99 (100) | 88.37 ± 8.37 60–100 (51) | 0.0002 | 0.003 a 0.011 b 0.999 c |
| Abnormalities detected during physical examination | |||||
| Crackles (834) | 96/541 (17.74%) | 59/180 (32.78%) | 29/113 (25.66%) | <0.0001 | 0.0001 a 0.2083 b 0.7356 c |
| Wheezing (834) | 59/541 (10.91%) | 30/180 (16.67%) | 24/113 (21.24%) | 0.0054 | 0.1705 a 0.0133 b 1.0 c |
| Pulmonary congestion (834) | 121/541 (22.37%) | 66/180 (36.67%) | 35/113 (30.97%) | 0.0005 | 0.0007 a 0.2012 b 1.0 c |
| Peripheral edema (834) | 49/541 (9.06%) | 33/180 (18.33%) | 25/113 (22.12%) | <0.0001 | 0.0033 a 0.0004 b 1.0 c |
| Parameter (N) | Time of Assessment | Units | Low Risk | Medium | High Risk | OMNIBUS p-Value | p-Value for Post-Hoc Analysis |
|---|---|---|---|---|---|---|---|
| Mean ± SD Min-Max (N) or n/N (% of Risk Category) (N) | Mean ± SD Min-Max (N) or n/N (% of Risk Category) (N) | Mean ± SD Min-Max (N) or n/N (% of Risk Category) (N) | |||||
| Complete Blood Count (CBC) | |||||||
| Leucocytes (834) | On admission | 103/µL | 7.38 ± 3.78 1.24–35.06 (541) | 9.19 ± 5.77 1.16–40.79 (180) | 14.69 ± 23.91 0.56–188.7 (113) | <0.0001 | 0.0003 a 0.004 b 0.046 c |
| On discharge | 8.39 ± 4.77 0.44–53.06 (541) | 11.35 ± 7.34 1.19–42.34 (180) | 15.27 ± 11.22 1.75–62.67 (113) | <0.0001 | <0.0001 a,b 0.003 c | ||
| Lymphocytes (818) | On admission | 103/µL | 1.13 ± 0.61 0.09–5.51 (526) | 1.0 ± 0.98 0.1–10.95 (180) | 1.9 ± 7.71 0.14–78.58 (112) | 0.1232 | N/A |
| On discharge | 1.67 ± 0.88 0.1–9.03 (526) | 1.32 ± 2.08 0.14–26.71 (180) | 1.69 ± 6.39 0.05–66.97 (112) | 0.0969 | N/A | ||
| Hemoglobin (834) | On admission | g/dL | 13.14 ± 2.25 4.3–18.8 (541) | 12.35 ± 2.22 3.9–16.8 (180) | 12.27 ± 2.17 7.2–17.9 (113) | <0.0001 | 0.0002 a, 0.0005 b 0.943 c |
| On discharge | 12.61 ± 2.17 7.3–17.9 (541) | 11.32 ± 2.23 6.5–17.4 (180) | 10.85 ± 2.11 6.0–16.6 (113) | <0.0001 | <0.0001 a, b 0.17 c | ||
| Platelets (834) | On admission | 103/µL | 233.54 ± 108.64 10–705 (541) | 224.16 ± 119.74 5–838 (180) | 204.68 ± 96.65 0–537 (113) | 0.0188 | 0.621 a 0.015 b 0.279 c |
| On discharge | 300.27 ± 133.53 13–929 (541) | 231.9 ± 116.97 4–592 (180) | 193.87 ± 124.99 6–675 (113) | <0.0001 | <0.001 a,b 0.027 c | ||
| Acid-base balance in the arterial blood gas | |||||||
| pH (191) | On admission | 7.44 ± 0.05 7.26–7.54 (95) | 7.4 ± 0.1 7.04–7.54 (60) | 7.4 ± 0.09 7.09–7.58 (36) | 0.0033 | 0.037 a 0.023 b 0.927 c | |
| PaO2 (191) | On admission | <60 mmHg respiratory insufficiency | 23/95 (24.21%) | 25/60 (41.67%) | 18/36 (50.0%) | 0.0081 | 0.1043 a 0.0256 b 1.0 c |
| 77.9 ± 34.53 27.5–100 (95) | 72.83 ± 39.51 33.4–100 (60) | 72.07 ± 44.92 23.7–100 (36) | 0.6296 | N/A | |||
| PaCO2 (191) | On admission | ≥45 mmHg hypercapnia | 9/95 (9.47%) | 15/60 (25.0%) | 5/36 (13.89%) | 0.0311 | 0.0527 a 1.0 b 0.8975 c |
| 35.98 ± 6.36 25.2–56.7 (95) | 39.23 ± 13.28 19.7–88.4 (60) | 38.21 ± 10.06 25.7–74.9 (36) | 0.1338 | N/A | |||
| HCO3 standard (187) | On admission | mmol/L | 24.82 ± 2.68 15.1–32.8 (36) | 23.87 ± 4.35 12.1–32.4 (59) | 23.16 ± 4.33 15.6–32.9 (92) | 0.0573 | N/A |
| BE (65) | On admission | mmol/L | 1.6 ± 3.36 (-)7.7–10.5 (35) | 1.38 ± 4.22 (-)7.8–9.7 (18) | 0.56 ± 3.17 (-)3.3–6.3 (12) | 0.6367 | N/A |
| Lactates (171) | On admission | mmol/L | 2.16 ± 1.01 0.6–6.0 (81) | 2.41 ± 1.66 0.5–12.8 (56) | 3.11 ± 2.45 0.8–12.0 (34) | 0.0792 | N/A |
| Electrolytes, inflammatory and kidney and liver biomarkers | |||||||
| Na (834) | On admission | mmol/L | 137.67 ± 4.66 108–152 (541) | 138.64 ± 5.91 113–158 (180) | 139.28 ± 8.08 119–175 (113) | 0.0265 | 0.114 a 0.106 b 0.743 c |
| K (834) | On admission | mmol/L | 4.11 ± 0.63 2.6–7.5 (541) | 4.32 ± 0.74 2.9–6.9 (180) | 4.39 ± 0.77 2.6–6.9 (113) | <0.0001 | 0.002 a 0.001 b 0.723 c |
| CRP (834) | On admission | mg/L | 74.86 ± 76.55 0.29–428.88 (541) | 98.13 ± 84.56 0.42–431.65 (180) | 118.22 ± 93.45 0.4–487.38 (113) | <0.0001 | 0.003 a <0.0001 b 0.154 c |
| Procalcitonin (811) | On admission | ng/mL | 0.53 ± 2.74 0.08–42.19 (522) | 3.01 ± 16.59 0.01–196.04 (176) | 2.96 ± 10.71 0.02–72.61 (113) | 0.0098 | 0.122 a 0.048 b 0.999 c |
| IL-6 (496) | On admission | pg/mL | 43.69 ± 94.85 2–1000 (339) | 57.93 ± 116.06 2–1000 (103) | 251.42 ± 1231.24 2.94–9099 (54) | 0.2548 | N/A |
| D-dimer (775) | On admission | µg/L | 3.11 ± 10.47 0.18–123.93 (500) | 6.46 ± 16.63 0.22–128 (166) | 10.48 ± 25.09 0.2–132.82 (109) | 0.0011 | 0.04 a 0.009 b 0.307 c |
| Protrombin rate (801) | On admission | % | 82.91 ± 18.13 7–142 (517) | 75.04 ± 22.22 5–130 (173) | 75.83 ± 21.51 3–128 (111) | <0.0001 | 0.0001 a 0.004 b 0.953 c |
| INR (801) | On admission | >1.5 | 23/517 (4.45%) | 23/173 (13.29%) | 16/111 (14.41%) | <0.0001 | 0.0003 a 0.0004 b 1.0 c |
| aPTT (772) | On admission | >60 s | 9/493 (1.83%) | 9/169 (5.34%) | 4/110 (3.64%) | 0.0419 | 0.0756 a 0.8087 b 1.0 c |
| Fibrinogen (246) | On admission | g/dL | 4.51 ± 1.64 1.23–9.26 (110) | 5.02 ± 1.82 0.35–9.2 (73) | 4.89 ± 2.05 0.44–9.94 (63) | 0.1306 | N/A |
| Glucose (773) | On admission | mg/dL | 133.28 ± 77.19 53.0–933.0 (494) | 154.13 ± 99.94 49.0–1064.0 (171) | 185.68 ± 11.28 76.0–733 (108) | <0.0001 | 0.036 a <0.0001 b 0.046 c |
| Glycated hemoglobin (HbA1c) (151)) | On admission | % | 7.61 ± 2.2 4.9–16.6 (102) | 7.34 ± 1.5 5.4–12.1 (30) | 7.31 ± 1.56 5.1–11.7 (19) | 0.6536 | N/A |
| Urea (823) | On admission | mg/dL | 46.84 ± 39.58 8.0–336.0 (531) | 70.23 ± 50.48 15–298 (179) | 80.96 ± 44.13 16.0256.0 (113) | <0.0001 | <0.0001 a,b 0.137 c |
| Creatinine (834) | On admission | mg/dL | 1.23 ± 1.36 0.38–12.66 (541) | 1.63 ± 1.5 0.44–9.49 (180) | 1.67 ± 1.07 0.48–7.81 (113) | <0.0001 | 0.006 a 0.0006 b 0.946 c |
| On discharge | 1.11 ± 1.05 0.44–12.35 (541) | 1.43 ± 1.47 0.43–8.48 (180) | 1.7 ± 1.34 0.43–9.06 (113) | <0.0001 | 0.016 a <0.0001 b 0.25 c | ||
| eGFR (834) | On admission | mL/min/ 1.73 m2 | 78.45 ± 30.48 3.0–250.0 (541) | 62.34 ± 33.85 6.0–183.0 (180) | 53.92 ± 32.71 5.0–196.0 (113) | <0.0001 | <0.0001 a,b 0.074 c |
| On discharge | 84.0 ± 30.31 4.0–212.0 (541) | 74.44 ± 40.47 6.0–226.0 (180) | 63.55 ± 42.06 4.0–209.0 (113) | <0.0001 | 0.011 a <0.0001 b 0.075 c | ||
| Total protein (371) | On admission | g/L | 6.1 ± 0.87 3.6–9.5 (225) | 5.7 ± 0.85 3.4–7.9 (90) | 5.54 ± 0.69 4.2–7.2 (56) | <0.0001 | 0.0009 a <0.0001 b 0.396 c |
| Albumin (419) | On admission | g/L | 3.24 ± 0.57 1.5–4.9 (220) | 2.91 ± 0.53 1.1–4.1 (118) | 2.94 ± 0.51 0.7–4.4 (81) | <0.0001 | <0.0001 a,b 0.972 c |
| AST (825) | On admission | IU/L | 54.31 ± 78.31 6.0–1261 (533) | 53.57 ± 47.8 11–378 (180) | 133.04 ± 351.16 10.0–2518.0 (112) | 0.0611 | N/A |
| ALT (828) | On admission | IU/L | 49.29 ± 85.56 4–1278 (536) | 41.12 ± 49.12 5–455.0 (180) | 78.67 ± 204.2 5.0–1411.0 (112) | 0.0687 | N/A |
| Bilirubin (834) | On admission | U/L | 0.73 ± 0.61 0.1–7.9 (541) | 0.77 ± 0.64 0.2–6.6 (180) | 0.95 ± 1.19 0.1–10.0 (113) | 0.1258 | N/A |
| LDH (834) | On admission | U/L | 361.77 ± 168.55 44–1175 (541) | 441.84 ± 233.6 71–1609 (180) | 807.64 ± 1153.37 151.0–9505.0 (113) | <0.0001 | <0.0001 a 0.0003 b 0.003 c |
| Cardiac biomarkers | |||||||
| BNP (267) | On admission | pg/mL | 354.62 ± 1015.43 1.7–7954.2 (132) | 739.65 ± 2104.97 8.0–13368.4 (73) | 685.2 ± 899.28 10.5–4993.0 (62) | 0.0472 | 0.31 a 0.061 b 0.978 c |
| On discharge | 340.72 ± 994.11 1.7–7954.2 (132) | 674.08 ± 1986.29 8.0–13368.4 (73) | 642.12 ± 765.72 10.5–2779.5 (62) | 0.0526 | N/A | ||
| NT-proBNP (200) | On admission | ng/mL | 3484.78 ± 10448.54 18.2–70000 (100) | 9452.86 ± 16351.53 29.7–70000 (60) | 12746.17 ± 18013.17 63.1–70000 (40) | 0.0019 | 0.035 a 0.01 b 0.624 c |
| On discharge | 4019.58 ± 11325.74 18.2–70000 (100) | 8277.73 ± 14383.38 29.7–70000 (60) | 12628.59 ± 16894.12 149.1–70000 (40) | 0.0067 | 0.128 a 0.012 b 0.379 c | ||
| Troponin T normal value: F < 15.6 pg/mL M < 34.2 pg/mL (516) | On admission | pg/mL | 181.91 ± 1351.26 1.0–21022.9 (294) | 376.86 ± 1548.68 0.2–14128.8 (130) | 1349.49 ± 5550.69 3.2–48854.9 (92) | 0.0769 | N/A |
| >5-fold upper range K 46.8 M 102.6 | 37/294 (12.59%) | 34/130 (26.15%) | 44/92 (47.83%) | <0.0001 | 0.0028 a <0.0001 b 0.0043 c | ||
| >3-fold upper range K 46.8 M 102.6 | 48/294 (16.33%) | 53/130 (40.77%) | 54/92 (58.7%) | <0.0001 | <0.0001 a,b 0.0376 c | ||
| On discharge | pg/mL | 703.62 ± 10197.17 0.8–174652.6 (294) | 237.54 ± 1365.37 0.2–15223.1 (130) | 1057.89 ± 3013.31 3.2–17408.1 (92) | 0.0449 | 0.723 a 0.858 b 0.042 c | |
| LDL-cholesterol (260) | On admission | mg/dL | 87.54 ± 44.29 6–248 (184) | 85.02 ± 39.75 23–187 (47) | 92.45 ± 51.38 25–215 (29) | 0.8011 | N/A |
| HDL-cholesterol (260) | On admission | mg/dL | 37.84 ± 15.28 2–110 (184) | 37.09 ± 12.18 8–65.0 (47) | 35.76 ± 14.62 16–79 (29) | 0.7621 | N/A |
| TG (388) | On admission | mg/dL | 143.44 ± 75.04 44–575 (222) | 175.67 ± 123.75 50–637 (93) | 185.77 ± 130.27 50–760 (73) | 0.0049 | 0.054 a 0.027 b 0.868 c |
| Hormones | |||||||
| 25-hydroxy-vitamin D (345) | On admission | ng/mL | 23.92 ± 15.95 3.5–126.4 (227) | 22.54 ± 15.53 3.5–73.2 (70) | 18.82 ± 13.49 3.5–75.6 (48) | 0.0755 | N/A |
| TSH (432) | On admission | mIU/L | 1.6 ± 2.64 0–28.81 (276) | 1.31 ± 1.33 0–8.28 (100) | 1.54 ± 2.01 0.03–11.16 (56) | 0.3654 | N/A |
| Variables. Units (N) | Low Risk | Medium Risk | High Risk | OMNIBUS p-Value | p-Value for Post-Hoc Analysis |
|---|---|---|---|---|---|
| n/N (% of Risk Category) | n/N (% of Risk Category) | n/N (% of Risk Category) | |||
| Applied treatment and procedures | |||||
| Systemic corticosteroid (834)) | 385/541 (71.16%) | 146/180 (81.11%) | 82/113 (72.57%) | 0.0314 | 0.0346 a 1.0 b 0.3499 c |
| Convalescent plasma (834) | 109/541 (20.15%) | 38/180 (21.11%) | 22/113 (19.47%) | 0.9377 | N/A |
| Tocilizumab (834) | 8/541 (1.48%) | 5/180 (2.78%) | 1/113 (0.88%) | 0.4734 | N/A |
| Remdesivir (834) | 164/541 (30.31%) | 56/180 (31.11%) | 25/113 (22.12%) | 0.1868 | N/A |
| Antibiotic (834) | 380/541 (70.24%) | 166/180 (92.22%) | 105/113 (92.92%) | <0.0001 | <0.0001 a,b 1.0 c |
| Survival | No | Yes | OR (Univariable) | OR (Multivariable) | |
|---|---|---|---|---|---|
| Group | low | 77 (14.2) | 464 (85.8) | - | - |
| medium | 105 (58.3) | 75 (41.7) | 0.12 (0.08–0.17, p < 0.001) | 0.12 (0.08–0.17, p < 0.001) | |
| high | 91 (80.5) | 22 (19.5) | 0.04 (0.02–0.07, p < 0.001) | 0.04 (0.02–0.07, p < 0.001) |
| Dependent: Survival | No N (%) | Yes N (%) | OR (Univariable) | OR (Multivariable) | |
|---|---|---|---|---|---|
| Xray abnormalities | No | 73 (28.4) | 184 (71.6) | - | - |
| Yes | 200 (34.7) | 377 (65.3) | 0.75 (0.54–1.03, p = 0.076) | 0.93 (0.62–1.38, p = 0.722) | |
| Hemoptysis | No | 259 (32.1) | 547 (67.9) | - | - |
| Yes | 14 (50.0) | 14 (50.0) | 0.47 (0.22–1.02, p = 0.052) | 0.55 (0.22–1.41, p = 0.209) | |
| Age | [65–75) | 88 (30.3) | 202 (69.7) | - | - |
| <65 | 58 (19.1) | 246 (80.9) | 1.85 (1.27–2.71, p = 0.002) | 1.08 (0.69–1.68, p = 0.745) | |
| ≥75 | 127 (52.9) | 113 (47.1) | 0.39 (0.27–0.55, p < 0.001) | 0.44 (0.29–0.68, p < 0.001) | |
| Dyspnea | No | 145 (34.3) | 278 (65.7) | - | - |
| Yes | 128 (31.1) | 283 (68.9) | 1.15 (0.86–1.54, p = 0.335) | 1.00 (0.69–1.44, p = 0.991) | |
| Unconsciousness | No | 165 (24.5) | 509 (75.5) | - | - |
| Yes | 108 (67.5) | 52 (32.5) | 0.16 (0.11–0.23, p < 0.001) | 0.18 (0.11–0.27, p < 0.001) | |
| No of comorbidities | ≥5 | 23 (65.7) | 12 (34.3) | - | - |
| 0 | 26 (12.9) | 175 (87.1) | 12.90 (5.85–29.88, p < 0.001) | 11.27 (4.54–29.05, p < 0.001) | |
| 1 | 64 (27.6) | 168 (72.4) | 5.03 (2.41–11.02, p < 0.001) | 5.23 (2.25–12.57, p < 0.001) | |
| 2 | 64 (34.0) | 124 (66.0) | 3.71 (1.77–8.17, p = 0.001) | 4.67 (2.00–11.29, p < 0.001) | |
| 3 | 59 (50.4) | 58 (49.6) | 1.88 (0.87–4.25, p = 0.114) | 2.35 (0.97–5.85, p = 0.061) | |
| 4 | 37 (60.7) | 24 (39.3) | 1.24 (0.53–3.01, p = 0.622) | 1.72 (0.65–4.64, p = 0.277) | |
| NLR | <3.13 | 98 (21.0) | 369 (79.0) | - | - |
| ≥3.13 | 175 (47.7) | 192 (52.3) | 0.29 (0.21–0.39, p < 0.001) | 0.31 (0.22–0.44, p < 0.001) | |
| LDH max | High | 255 (34.0) | 494 (66.0) | - | - |
| Low | 1 (20.0) | 4 (80.0) | 2.06 (0.30–40.50, p = 0.518) | 1.12 (0.14–23.54, p = 0.924) | |
| Normal | 17 (21.2) | 63 (78.8) | 1.91 (1.12–3.44, p = 0.022) | 2.25 (1.17–4.52, p = 0.018) | |
| Bilirubin | High | 32 (51.6) | 30 (48.4) | - | - |
| Low | 1 (33.3) | 2 (66.7) | 2.13 (0.19–47.31, p = 0.545) | 4.67 (0.28–150.95, p = 0.317) | |
| Normal | 240 (31.2) | 529 (68.8) | 2.35 (1.40–3.97, p = 0.001) | 2.42 (1.27–4.62, p = 0.007) |
| Dependent: Survive Hospital | No N (%) | Yes N (%) | OR (Univariable) | OR (Multivariable) | |
|---|---|---|---|---|---|
| Group | Low | 39 (7.2) | 502 (92.8) | - | - |
| medium | 76 (42.2) | 104 (57.8) | 0.11 (0.07–0.16, p < 0.001) | 0.11 (0.07–0.16, p < 0.001) | |
| High | 81 (71.7) | 32 (28.3) | 0.03 (0.02–0.05, p < 0.001) | 0.03 (0.02–0.05, p < 0.001) |
| Low Risk (0–0.41) | Medium Risk (a) (0.41–0.78) | High Risk (b) (0.78–1.00) | |||
|---|---|---|---|---|---|
| Variables, Units (N) | n (% of Risk Category) | n (% of Risk Category) | n (% of Risk Category) | p-Value (for Post Hoc Analysis) | |
| All cause shock | Yes | 31 (5.7) | 50 (27.8) | 46 (40.7) | <0.001 (a,b) |
| Bleeding | Yes | 19 (3.5) | 17 (9.4) | 21 (18.6) | 0.002 (a) <0.001 (b) |
| Heart failure | |||||
| decomposition | Yes | 5 (0.9) | 19 (10.6) | 22 (19.5) | <0.001 (a,b) |
| Myocardial infarction | Yes | 2 (0.4) | 3 (1.7) | 7 (6.2) | 0.098 (a) <0.001 (b) |
| Neurological deficits | Yes | 17 (3.1) | 13 (7.2) | 10 (8.8) | >0.001 (a,b) |
| Thrombosis | Yes | 13 (2.4) | 8 (4.4) | 7 (6.2) | >0.001 (a,b) |
| Deterioration | Yes | 34 (6.3) | 8 (4.4) | 6 (5.3) | >0.001 (a,b) |
Publisher’s Note: MDPI stays neutral with regard to jurisdictional claims in published maps and institutional affiliations. |
© 2022 by the authors. Licensee MDPI, Basel, Switzerland. This article is an open access article distributed under the terms and conditions of the Creative Commons Attribution (CC BY) license (https://creativecommons.org/licenses/by/4.0/).
Share and Cite
Sebastian, A.; Madziarski, M.; Madej, M.; Proc, K.; Szymala-Pędzik, M.; Żórawska, J.; Gronek, M.; Morgiel, E.; Kujawa, K.; Skarupski, M.; et al. The Usefulness of the COVID-GRAM Score in Predicting the Outcomes of Study Population with COVID-19. Int. J. Environ. Res. Public Health 2022, 19, 12537. https://doi.org/10.3390/ijerph191912537
Sebastian A, Madziarski M, Madej M, Proc K, Szymala-Pędzik M, Żórawska J, Gronek M, Morgiel E, Kujawa K, Skarupski M, et al. The Usefulness of the COVID-GRAM Score in Predicting the Outcomes of Study Population with COVID-19. International Journal of Environmental Research and Public Health. 2022; 19(19):12537. https://doi.org/10.3390/ijerph191912537
Chicago/Turabian StyleSebastian, Agata, Marcin Madziarski, Marta Madej, Krzysztof Proc, Małgorzata Szymala-Pędzik, Joanna Żórawska, Michał Gronek, Ewa Morgiel, Krzysztof Kujawa, Marek Skarupski, and et al. 2022. "The Usefulness of the COVID-GRAM Score in Predicting the Outcomes of Study Population with COVID-19" International Journal of Environmental Research and Public Health 19, no. 19: 12537. https://doi.org/10.3390/ijerph191912537