
Hepatotropic Properties of SARS-CoV-2—Preliminary Results of Cross-Sectional Observational Study from the First Wave COVID-19 Pandemic

 , , and
Abstract
:1. Introduction
2. Experimental Section
2.1. Materials and Methods
2.2. Statistical Analyses
3. Results
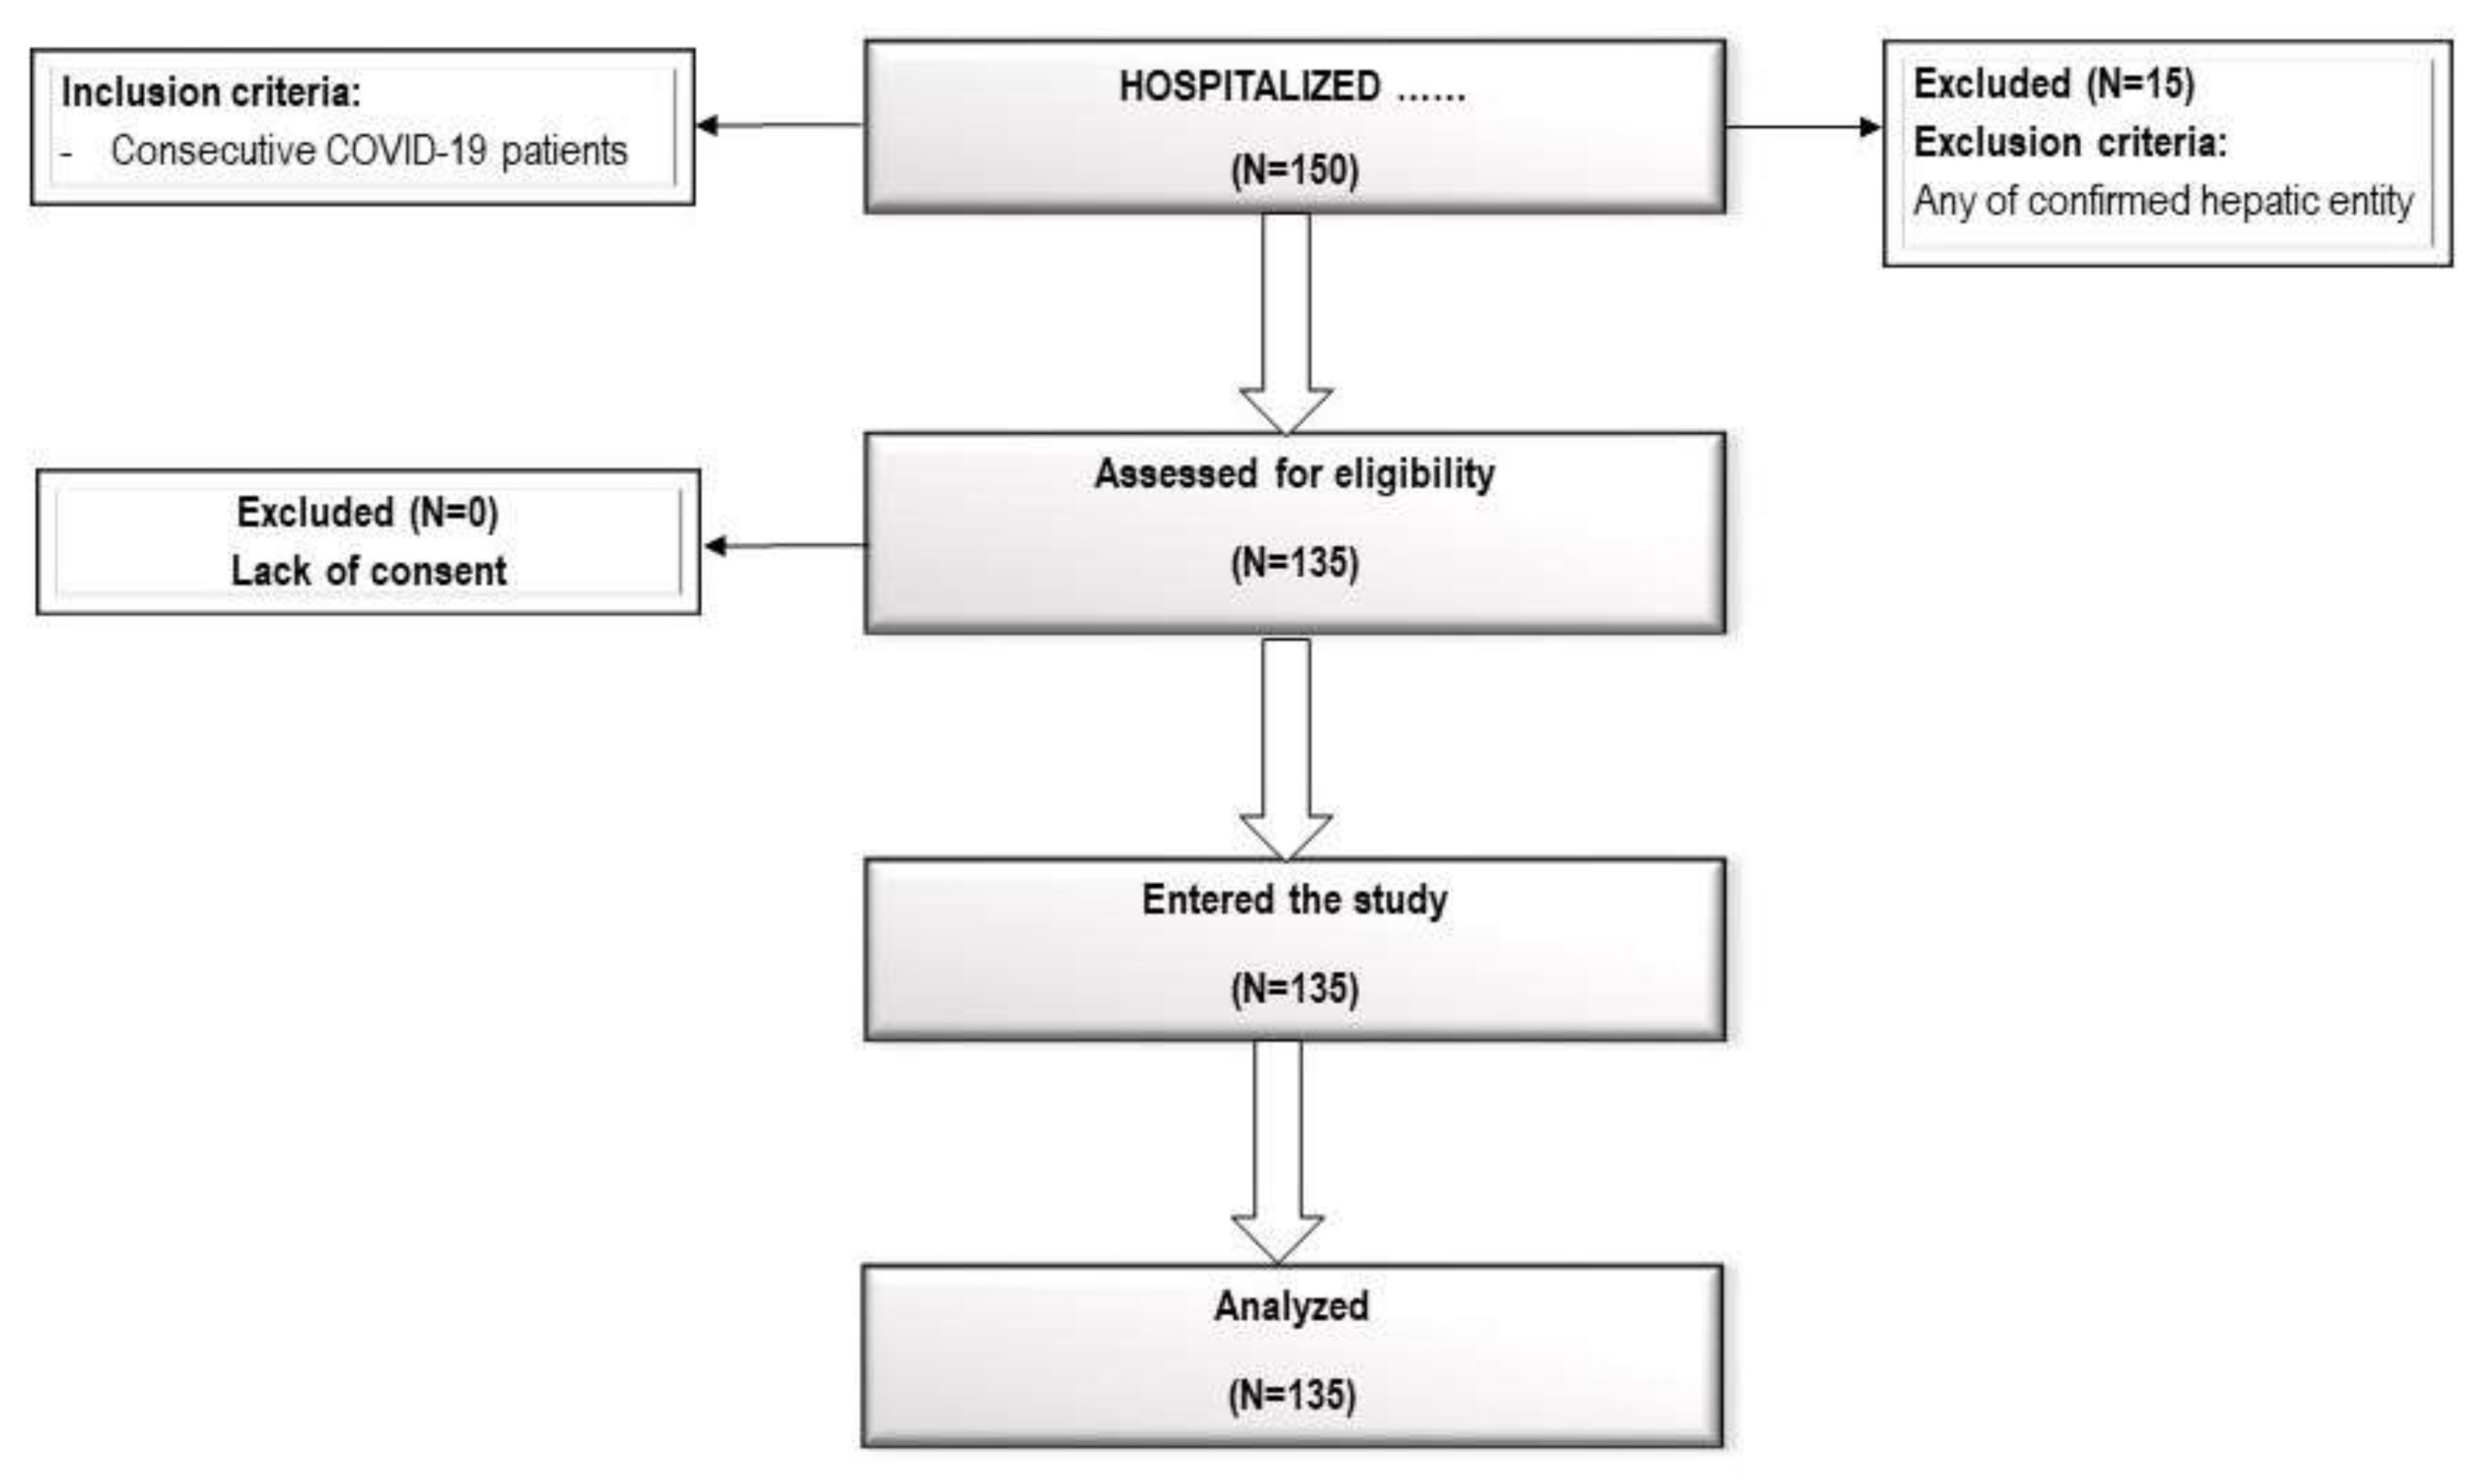
3.1. Study Subjects
3.2. Pharmacological Treatment by Oxygen Use
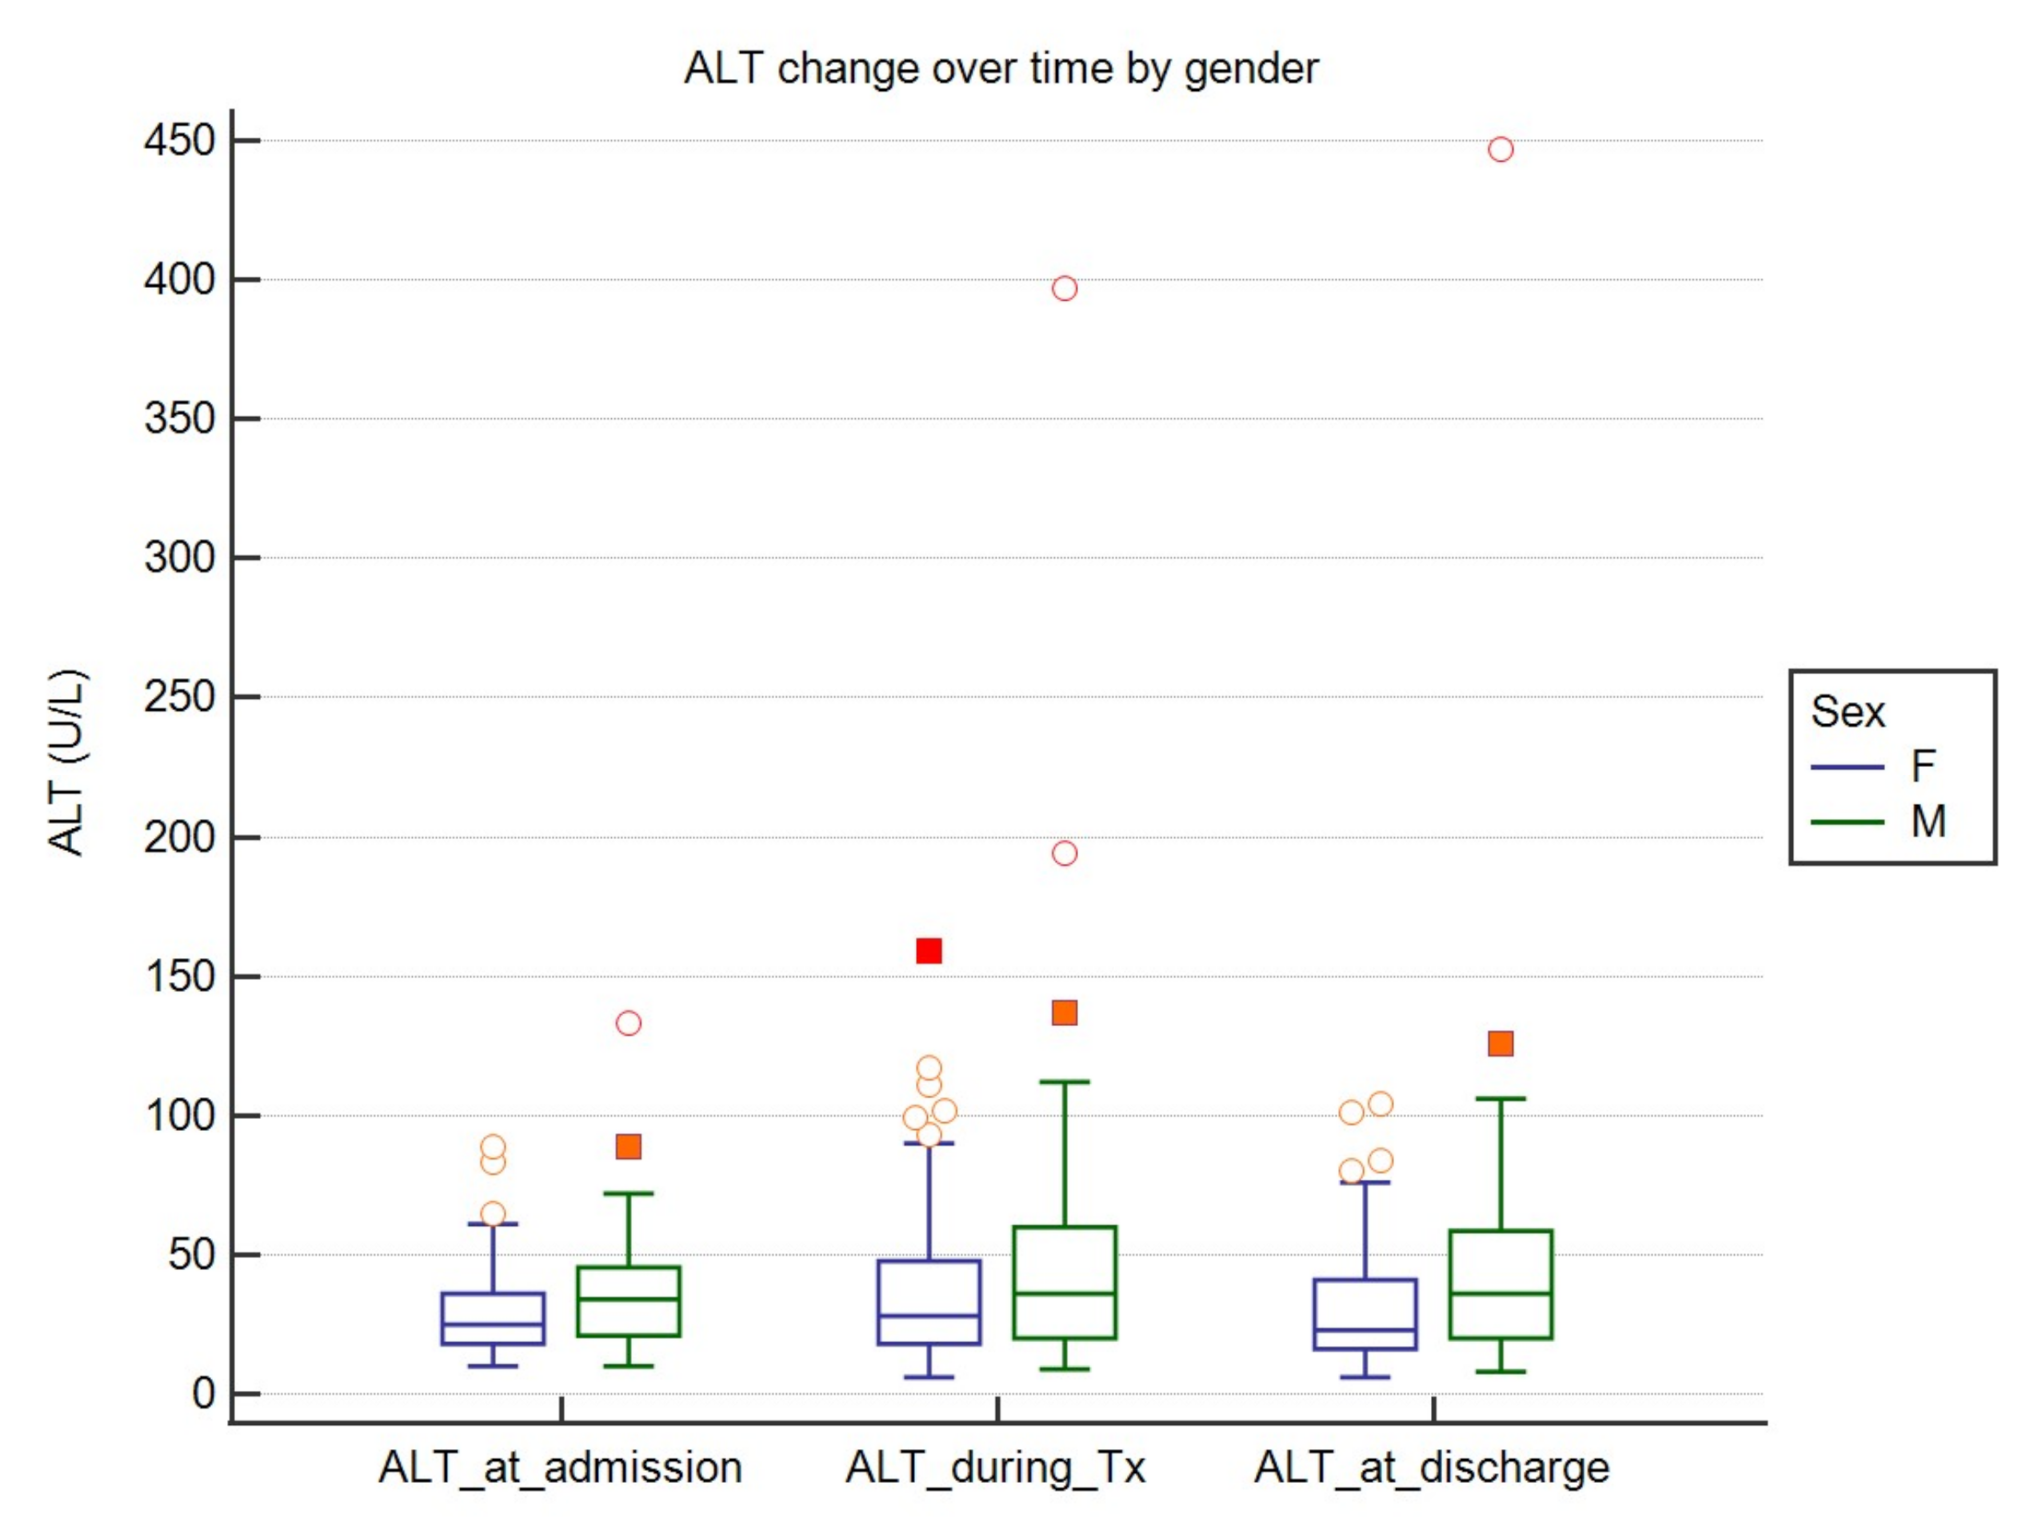
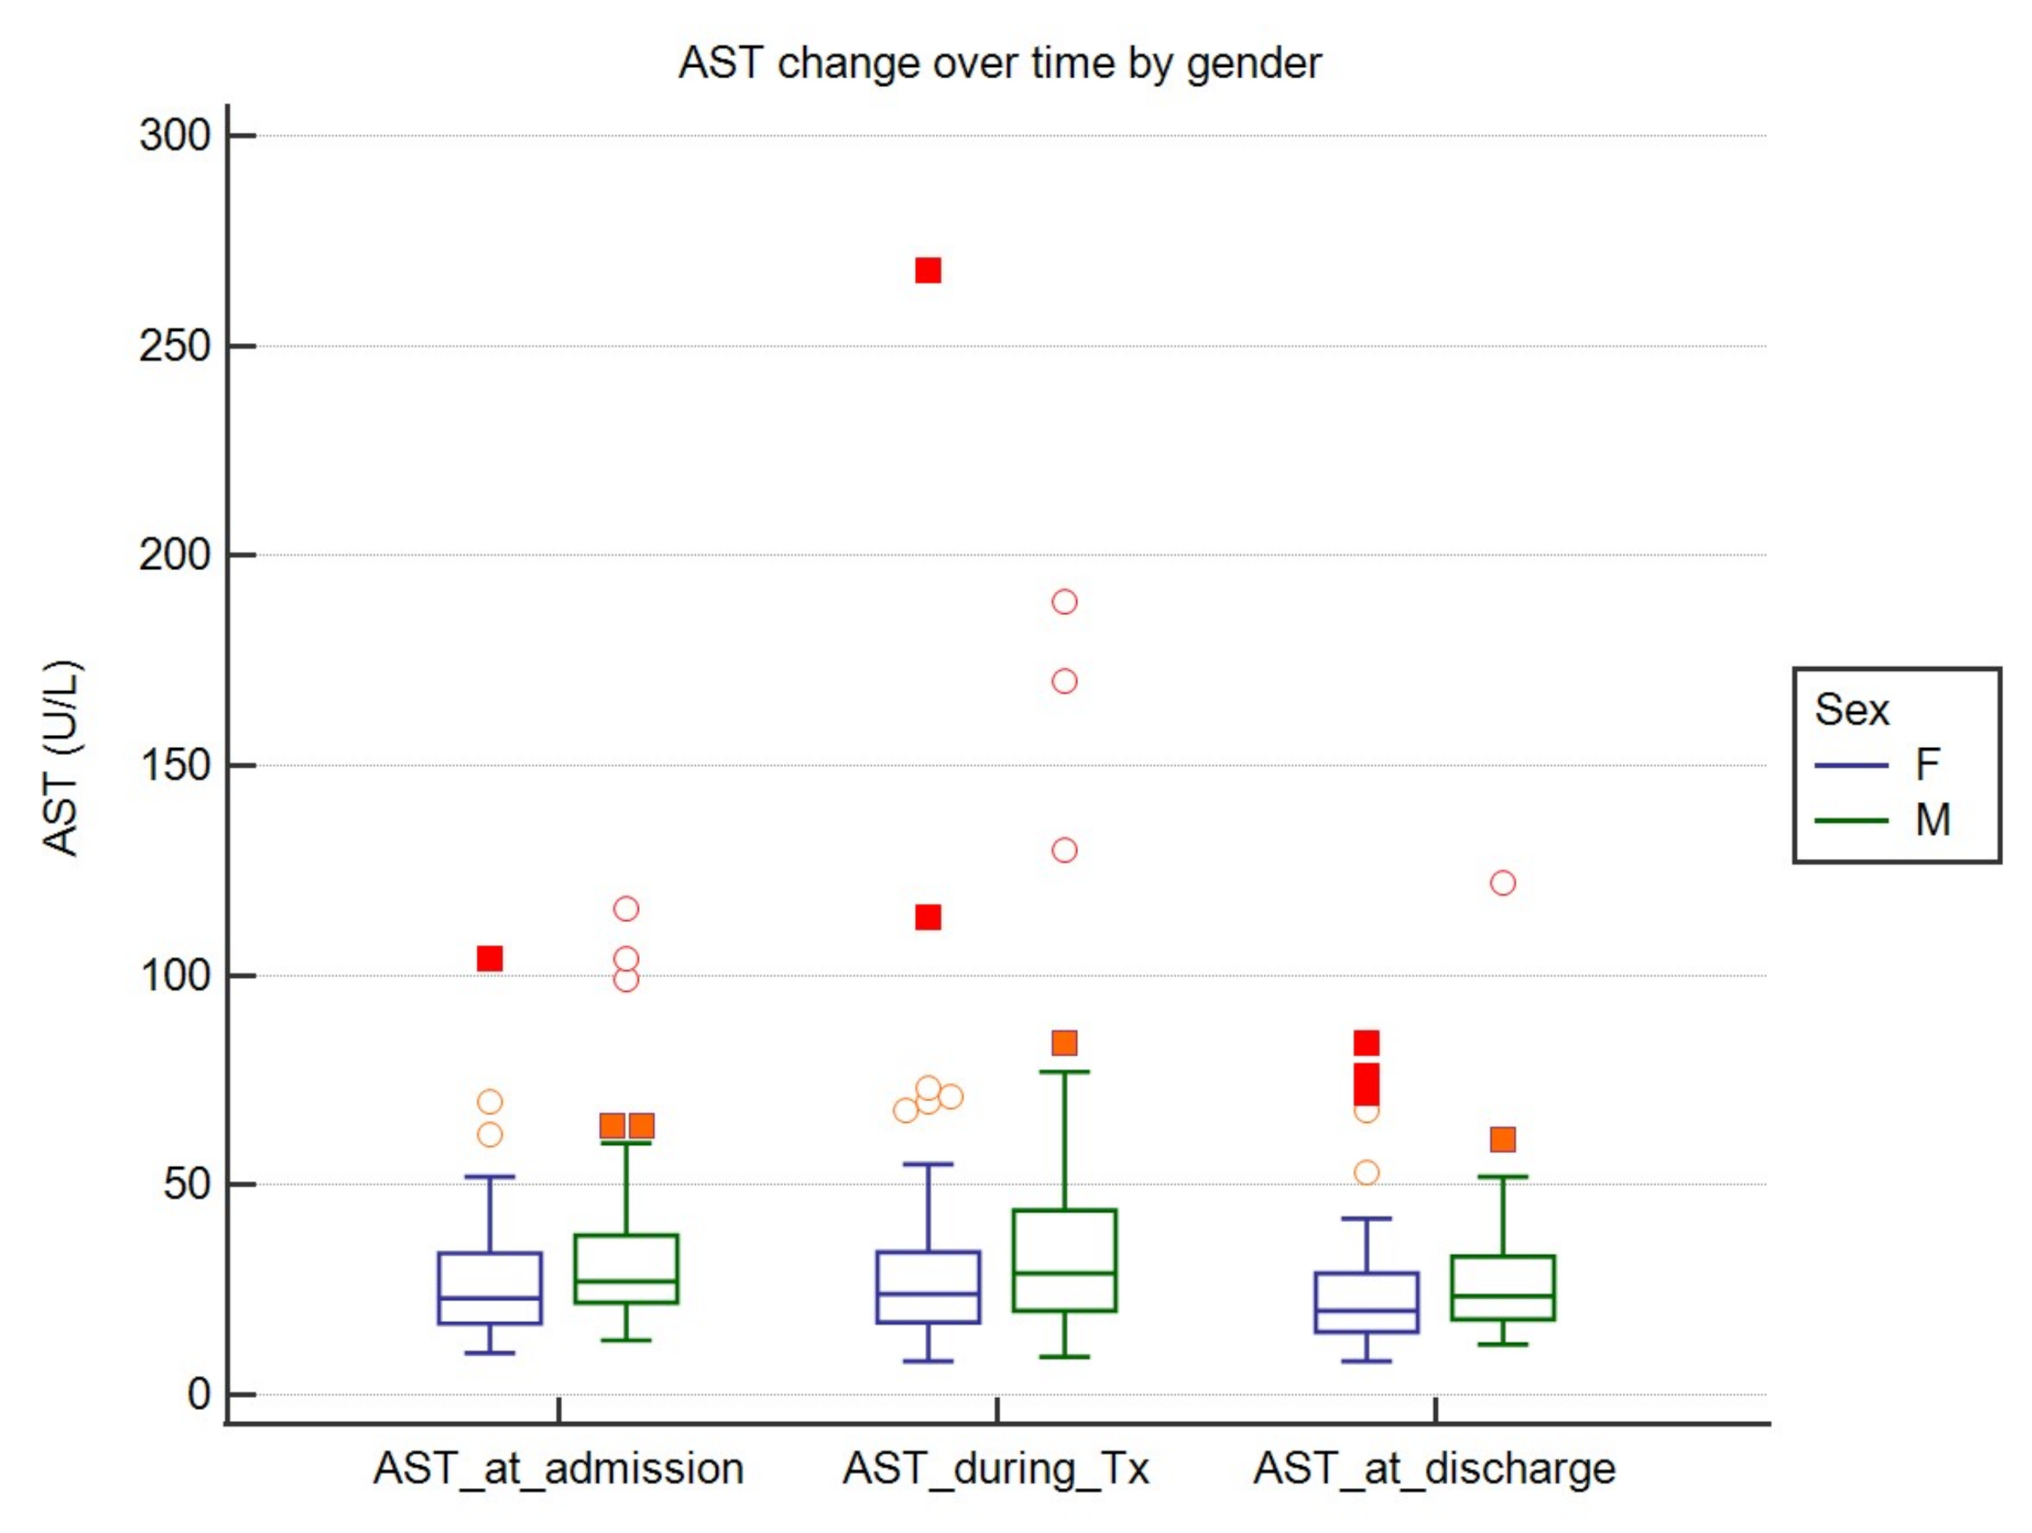
3.3. The Dynamics of AST and ALT Activity
3.4. The Dynamics of AST and ALT Activity
3.5. Correlation between AST and ALT at Baseline, during the Treatment, and at Hospitalization Endpoint with Biochemical Parameters
3.6. Correlation between ALT/AST Activity and Pharmacological Treatment
4. Discussion
5. Conclusions
Supplementary Materials
Author Contributions
Funding
Institutional Review Board Statement
Informed Consent Statement
Data Availability Statement
Conflicts of Interest
References
- Guan, W.J.; Ni, Z.Y.; Hu, Y.; Liang, W.H.; Ou, C.Q.; He, J.X.; Liu, L.; Shan, H.; Lei, C.L.; Hui, D.S.C.; et al. Clinical Characteristics of Coronavirus Disease 2019 in China. N. Engl. J. Med. 2020, 382, 1708–1720. [Google Scholar] [CrossRef] [PubMed]
- Zhu, N.; Zhang, D.; Wang, W.; Li, X.; Yang, B.; Song, J.; Zhao, X.; Huang, B.; Shi, W.; Lu, R.; et al. A Novel Coronavirus from Patients with Pneumonia in China, 2019. N. Engl. J. Med. 2020, 382, 727–733. [Google Scholar] [CrossRef] [PubMed]
- Flisiak, R.; Horban, A.; Jaroszewicz, J.; Kozielewicz, D.; Pawłowska, M.; Parczewski, M.; Piekarska, A.; Simon, K.; Tomasiewicz, K.; Zarębska-Michaluk, D. Management of SARS-CoV-2 infection: Recommendations of the Polish Association of Epidemiologists and Infectologists as of March 31, 2020. Pol. Arch. Intern. Med. 2020, 130, 352–357. [Google Scholar]
- Guo, Y.R.; Cao, D.; Hong, Z.S.; Tan, Y.-Y.; Chen, S.-D.; Jin, H.-J.; Tan, K.; Wang, D.-Y.; Yan, Y. The origin, transmission and clinical therapies on coronavirus disease 2019 (COVID-19) outbreak—An update on the status. Mil. Med. Res. 2020, 7, 11. [Google Scholar] [CrossRef] [Green Version]
- Chen, J.; Qi, T.; Liu, L.; Ling, Y.; Qian, Z.; Li, T.; Li, F.; Xu, Q.; Zhang, Y.; Xu, S.; et al. Clinical progression of patients with COVID-19 in Shanghai. China. J. Infect. 2020, 80, e1–e6. [Google Scholar] [CrossRef] [PubMed]
- Weekly Epidemiological Update—3 November 2020. Available online: https://www.who.int/publications/m/item/weekly-epidemiological-update---3-november-2020 (accessed on 8 November 2020).
- Parczewski, M.; Ciechanowicz, A. Molecular epidemiology of SARS CoV-2: A review of current data on genetic variability of the virus. Pol. Arch. Intern. Med. 2020. [Google Scholar] [CrossRef] [PubMed]
- Hamming, V.; Timens, W.; Bulthuis, M.L.C.; Lely, A.T.; Navis, G.J.; Van Goor, H. Tissue distribution of ACE2 protein, the functional receptor for SARS coronavirus. A first step in understanding SARS pathogenesis. J. Pathol. 2004, 203, 631–637. [Google Scholar] [CrossRef] [PubMed]
- Hoffmann, M.; Kleine-Weber, H.; Schroeder, S.; Kruger, N.; Herrler, T.; Erichsen, S.; Schiergens, T.S.; Herrler, G.; Wu, N.-H.; Nitsche, A.; et al. SARS-CoV-2 Cell Entry Depends on ACE2 and TMPRSS2 and IS Blocked by a Clinically Proven Protease Inhibitor. Cell 2020, 181, 271–280.e8. [Google Scholar] [CrossRef]
- Gheblawi, M.; Wang, K.; Viveiros, A.; Nguyen, Q.; Zhong, J.-C.; Turner, A.J.; Raizada, M.K.; Grant, M.B.; Oudit, G.Y. Angiotensin-Converting Enzyme 2: SARS-CoV-2 Receptor and Regulator of the Renin-Angiotensin System. Circ. Res. 2020, 126, 1456–1474. [Google Scholar] [CrossRef]
- Zhao, B.; Ni, C.; Gao, R.; Wang, Y.; Yang, L.; Wei, J.; Lv, T.; Liang, J.; Zhang, Q.; Xu, W.; et al. Recapitulation of SARS-CoV-2 infection and cholangiocyte damage with human liver ductal organoids. Protein Cell 2020, 11, 771–775. [Google Scholar] [CrossRef] [Green Version]
- Lamers, M.M.; Beumer, J.; van der Vaart, J.; Knoops, K.; Puschhof, J.; Breugem, T.I.; Ravelli, R.B.G.; van Schayck, J.P.; Mykytyn, A.Z.; Duimel, H.Q.; et al. SARS-CoV-2 productively infects human gut enterocytes. Science 2020. [Google Scholar] [CrossRef]
- Portincasa, P.; Krawczyk, M.; Machill, A.; Lammert, F.; Di Ciaula, A. Hepatic consequences of COVID-19 infetion. Lapping or biting? Eur. J. Intern. Med. 2020, 77, 18–24. [Google Scholar] [CrossRef]
- Sun, J.; Aghemo, A.; Forner, A.; Valenti, L. COVID-19 and liver disease. Liver Int. 2020, 40, 1278–1281. [Google Scholar] [CrossRef] [Green Version]
- Feng, G.; Zheng, K.I.; Yan, Q.-Q.; Rios, R.S.; Targher, G.; Byrne, C.D.; Poucke, S.V.; Liu, W.-Y.; Zheng, M.-H. COVID-19 and Liver Dysfunction: Current Insights and Emergent Therapeutic Strategies. J. Clin. Transl. Hepatol. 2020, 28, 18–24. [Google Scholar] [CrossRef] [PubMed] [Green Version]
- Bangash, M.N.; Patel, J.; Parekh, D. COVID-19 and the liver: Little cause for concern. Lancet Gastroenterol. Hepatol. 2020. [Google Scholar] [CrossRef] [Green Version]
- Li, J.; Fan, J.G. Characteristics and Mechanism of Liver Injury in 2019 Coronavirus Disease. J. Clin. Transl. Hepatol. 2020, 8, 13–17. [Google Scholar] [CrossRef] [Green Version]
- Rismanbaf, A.; Zarei, S. Liver and Kidney Injuries in COVID-19 and Their Effects on Drug Therapy; a Letter to Editor. Arch. Acad. Emerg. Med. 2020, 8, e17. [Google Scholar] [PubMed]
- National Institutes of Health. Clinical Guidelines on the Identification, Evaluation, and Treatment of Overweight and Obesity in Adults—The Evidence Report. National Institutes of Health. Obes Res. 1998, 6 (Suppl. 2), 51S–209S. [Google Scholar]
- The Comprehensive R Archive Network. Available online: https://cran.r-project.org (accessed on 8 November 2020).
- Faul, F.; Erdfelder, E.; Lang, A.G.; Buchner, A. G*Power 3: A flexible statistical power analysis program for the social, behavioral, and biomedical sciences. Behav. Res. Methods 2007, 39, 175–191. [Google Scholar] [CrossRef] [PubMed]
- Faul, F.; Erdfelder, E.; Buchner, A.; Lang, A.G. Statistical power analyses using G*Power 3.1: Tests for correlation and regression analyses. Behav. Res. Methods 2009, 41, 1149–1160. [Google Scholar] [CrossRef] [PubMed] [Green Version]
- Liu, W.; Tao, Z.W.; Lei, W.; Yuan, M.-L.; Liu, K.; Zhou, L.; Wei, S.; Deng, Y.; Liu, J.; Liu, H.-G.; et al. Analysis of factors associated with disease outcomes in hospitalized patients with 2019 novel coronavirus disease. Chin. Med. J. 2020, 133, 1032–1038. [Google Scholar] [CrossRef] [PubMed]
- Fix, O.K.; Hameed, B.; Fontana, R.J.; Kwok, R.M.; Mulligan, D.C.; Pratt, D.S.; Russo, M.W.; Schilsky, M.L.; Verna, E.C.; Loomba, R.; et al. Clinical best practice advice for hepatology and liver transplant providers during the COVID-19 pandemic AASLD expert panel consensus statement. Hepatology 2020, 72, 287–304. [Google Scholar] [CrossRef]
- Wong, S.H.; Lui, R.N.; Sung, J.J. COVID-19 and the digestive system. J. Gastroenterol. Hepatol. 2020, 35, 744–748. [Google Scholar] [CrossRef]
- Fan, Z.; Chen, L.; Li, J.; Yang, J.; Tian, C.; Zhang, Y. Clinical features of COVID-19-related liver functional abnormality. Clin. Gastroenterol. Hepatol. 2020, 18, 1561–1566. [Google Scholar] [CrossRef] [PubMed]
- Bangash, M.N.; Patel, J.M.; Parekh, D.; Murphy, N.; Brown, R.M.; Elsharkawy, A.M.; Mehta, G.; Armstrong, M.J.; Neil, D. Is the liver merely a bystander to severe disease? J. Hepatol. 2020, 73, P993–P995. [Google Scholar] [CrossRef]
- Xu, Z.; Shi, L.; Wang, Y.; Zhang, J.; Huang, L.; Zhang, C.; Liu, S.; Zhao, P.; Liu, H.; Zhu, L.; et al. Pathological findings of COVID-19 associated with acute respiratory distress syndrome. Lancet Respir. Med. 2020, 8, 420–422. [Google Scholar] [CrossRef]


| Drug | Patients without Oxygen Supply n = 102 | Simple Oxygen Supplementation n = 29 | Invasive Ventilation n = 4 | P *(FDR) |
|---|---|---|---|---|
| Azithromycin (Y/N) | 98/4 (96.08%/3.92%) | 29/0 (100%/0%) | 4/0 (100%/0%) | 0.51 |
| Chloroquine (Y/N) | 89/13 (87.25%/12.75%) | 29/0 (100%/0%) | 4/0 (100%/0%) | 0.15 |
| Lopinavir/Ritonavir (Y/N) | 5/97 (4.9%/95.1%) | 12/17 (41.38%/58.62%) | 2/2 (50%/50%) | 0.00003 |
| Tocilizumab (Y/N) | 0/102 (0%/100%) | 0/29 (0%/100%) | 1/3 (25%/75%) | n.a. |
| Variable | O2 Therapy Patient Group Requiring Oxygen Supply (n = 33) | No O2 Therapy Required Oxygen-Free Patient Group (n = 102) | P (FDR) | ||||
|---|---|---|---|---|---|---|---|
| Median | IQR | 95%CI for median | Median | IQR | 95%CI for median | ||
| ALT at admission (U/L) | 25 | 20–38 | 21.411–35.589 | 26.5 | 20–40 | 22.0–35.0 | 0.9449 |
| ALT during Tx (U/L) | 38 | 20–66 | 24.0–58.356 | 30 | 19–50 | 26.0–37.0 | 0.3438 |
| ALT at discharge (U/L) | 28 | 23–49 | 24.0–39.589 | 25 | 16–47 | 23.0–31.123 | 0.3438 |
| AST at admission (U/L) | 25 | 22–36 | 22.0–28.0 | 25 | 18–35 | 18.411–30.0 | 0.3438 |
| AST during Tx (U/L) | 30 | 22–49 | 21.0–27.374 | 23 | 18–34 | 24.411–39.178 | 0.135 |
| AST at discharge (U/L) | 23 | 18–38 | 19.0–24.0 | 22 | 16–29 | 18.411–30.0 | 0.3438 |
| Variable | All Patients (n = 135) | Women (n = 75) | Men (n = 60) | P (FDR) | ||||||
|---|---|---|---|---|---|---|---|---|---|---|
| Median | IQR | Maximum | Median | IQR | 95% CI for Median | Median | IQR | 95% CI for Median | ||
| ALT at admission (U/L) | 26 | 20–39.75 | 133 | 25.0 | 18.0–36.0 | 21.540–27.0 | 34.0 | 21.0–45.5 | 23.0–39.0 | 0.0306 |
| ALT during treatment (U/L) | 33 | 19–56 | 397 | 28.0 | 18.0–47.750 | 23.080–37.0 | 36.0 | 20.0–60.0 | 30.0–49.0 | 0.0954 |
| ALT at discharge (U/L) | 25 | 17.25–47 | 447 | 23.0 | 16.250–41.0 | 20.0–26.0 | 36.0 | 20.0–58.5 | 25.0–42.243 | 0.0306 |
| AST at admission (U/L) | 25 | 19–35 | 116 | 23.0 | 17.0–33.750 | 19.540–27.460 | 27.0 | 22.0–38.0 | 24.0–31.061 | 0.05 |
| AST during treatment (U/L) | 25 | 19–38.75 | 268 | 24.0 | 17.250–34.0 | 20.0–27.0 | 29.0 | 20.0–44.0 | 23.0–32.061 | 0.05 |
| AST at discharge (U/L) | 22 | 16–30 | 122 | 20.0 | 15.0–29.0 | 17.540–22.0 | 23.5 | 18.0–33.0 | 20.939–27.0 | 0.0596 |
| Variable | Abnormal AST at Admission | Normal AST at Admission | P | Power (d) | Abnormal AST during Tx | Normal AST during Tx | P (FDR) | Power (d) | ||||||||||||
|---|---|---|---|---|---|---|---|---|---|---|---|---|---|---|---|---|---|---|---|---|
| N | Median | IQR | 95% CI for Median | n | Median | IQR | 95% CI for Median | N | Median | IQR | 95% CI for Median | n | Median | IQR | 95% CI for Median | |||||
| Liver function related parameters | ||||||||||||||||||||
| Albumin (g/L) | 12 | 3.35 | 2.800–3.650 | 2.473–3.683 | 22 | 4.05 | 3.700–4.200 | 3.891–4.200 | 0.014 | 0.9 (1.1) | 16 | 3.45 | 3.250–3.700 | 3.264–3.700 | 18 | 4.15 | 3.900–4.200 | 3.940–4.200 | 0.00325 | 0.9 (1.1) |
| GGTP (U/L) | 33 | 64 | 42.750–93.250 | 47.233–77.123 | 88 | 24 | 16.0–43.0 | 22.0–30.668 | <0.01 | 0.93 (0.66) | 37 | 64 | 32.250–93.250 | 46.387–79.459 | 84 | 24 | 16.500–43.0 | 22.0–31.456 | 0.03 | 0.94 (0.65) |
| CRP (mg/L) | 36 | 19.845 | 7.295–91.650 | 9.256–67.890 | 99 | 8.2 | 2.855–18.512 | 4.284–10.632 | 0.002 | 0.85 (0.54) | 39 | 20.4 | 9.060–92.055 | 11.456–81.380 | 96 | 6.605 | 2.600–16.795 | 3.948–9.576 | 0 | 0.97 (0.71) |
| D-dimers (FEU ug/L) | 29 | 558 | 372.0–1091.500 | 433.042–901.086 | 76 | 391 | 320.500–638.500 | 360.867–461.033 | 0.025 | 0.53 (0.38) | 32 | 580 | 408.500–1146.500 | 454.993–921.125 | 73 | 386 | 322.750–629.250 | 352.654–460.383 | 0.01244 | 0.55 (0.38) |
| Ferritin (ng/mL) | 24 | 453 | 150.0–1066.0 | 232.140–665.100 | 54 | 162 | 87.100–330.0 | 107.991–241.706 | 0.002 | 0.56 (0.45) | 24 | 490.5 | 246.0–1263.500 | 336.166–991.982 | 54 | 150 | 87.100–309.0 | 107.991–229.367 | 0.03 | 0.6 (0.48) |
| IL6 (pg/mL) | 28 | 17.45 | 6.600–39.250 | 7.651–34.625 | 56 | 8.3 | 3.450–17.0 | 5.820–11.002 | 0.001 | 0.36 (0.29) | 31 | 19.7 | 7.425–51.550 | 13.903–38.865 | 53 | 6.8 | 3.375–13.125 | 5.318–8.820 | 0.08 | 0.39 (0.32) |
| LDH (U/L) | 36 | 235 | 201.0–352.500 | 209.318–298.070 | 97 | 185 | 161.500–221.250 | 175.372–198.628 | 0.025 | 0.99 (0.94) | 39 | 222 | 198.500–353.250 | 207.917–305.323 | 94 | 185 | 160.0–222.0 | 175.023–198.977 | 0.03 | 0.99 (0.9) |
| WBC (G/L) | 36 | 6.47 | 5.505–7.720 | 5.900–7.493 | 97 | 5.23 | 4.137–7.050 | 4.740–5.951 | 0.025 | 0.58 (0.37) | 39 | 5.96 | 4.117–7.677 | 5.256–7.114 | 94 | 5.615 | 4.270–7.140 | 5.061–6.350 | 0.6748 | 0.12 (0.09) |
| Variable | Abnormal ALT at Admission (U/L) | Normal ALT at Admission (U/L) | P (FDR) | Power (d) | Abnormal ALT during Tx (U/L) | Normal ALT during Tx (U/L) | P (FDR) | Power (d) | ||||||||||||
|---|---|---|---|---|---|---|---|---|---|---|---|---|---|---|---|---|---|---|---|---|
| n | Median | IQR | 95% CI for Median | n | Median | IQR | 95% CI for Median | N | Median | IQR | 95% CI for Median | n | Median | IQR | 95% CI for Median | |||||
| Liver Function Related Parameters | ||||||||||||||||||||
| GGTP (U/L) | 39 | 61 | 36.500–82.50 | 45.752–72.083 | 82 | 22.5 | 15.0–43.0 | 20.652–28.0 | <0.01 | 0.82 (0.52) | 56 | 51 | 28.500–80.0 | 36.185–65.0 | 65 | 23 | 15.0–40.250 | 21.0–28.872 | 0.06 | |
| Parameters of Inflammation and Nonspecific Damage from Hypoxia | ||||||||||||||||||||
| CRP (mg/L) | 44 | 12.07 | 4.725–67.645 | 8.206–20.362 | 91 | 8.87 | 2.957–25.567 | 4.752–12.914 | 0.157 | 0.41 (0.27) | 39 | 20.4 | 4.302–76.370 | 8.896–20.494 | 96 | 6.605 | 2.430–18.720 | 4.256–9.722 | 0.06 | 0.85 (0.48) |
| Ferritin (ng/mL) | 26 | 398 | 150.0–560.0 | 248.785–535.866 | 52 | 162 | 87.400–303.0 | 108.397–239.948 | 0.022 | 0.12 (0.12) | 36 | 382.5 | 127.0–551.500 | 161.202–508.705 | 42 | 153.5 | 92.700–279.0 | 107.555–243.596 | 0.0276 | 0.65 (0.15) |
| IL6 (pg/mL) | 28 | 13.8 | 5.450–24.400 | 6.430–22.162 | 56 | 8.35 | 3.700–20.0 | 6.099–12.804 | 0.446 | 0.27 (0.24) | 45 | 14.4 | 6.375–26.700 | 8.192–19.562 | 39 | 6.8 | 2.775–15.0 | 4.075–11.233 | 0.0884 | 0.24 (0.22) |
| LDH (U/L) | 44 | 211 | 176.0–285.500 | 198.069–224.965 | 89 | 192 | 161.500–230.0 | 176.780–206.220 | 0.056 | 0.86 (0.52) | 61 | 212 | 182.250–292.0 | 198.752–225.0 | 72 | 184.5 | 156.0–222.0 | 174.212–199.788 | 0.0017 | 0.98 (0.67) |
| Variable | ALT at Discharge (U/L) | ALT during Tx (U/L) | ALT at Admission (U/L) | AST at Discharge (U/L) | AST during Tx (U/L) | AST at Admission (U/L) | |
|---|---|---|---|---|---|---|---|
| Liver Function Related Parameters | |||||||
| Total Bilirubin (mg/dl) (n = 108) | Correlation coefficient | −0.138 | −0.085 | 0.011 | 0.004 | 0.002 | 0.07 |
| Significance Level P | 0.1556 | 0.3793 | 0.9137 | 0.9692 | 0.9849 | 0.4689 | |
| P (FDR) | 0.933 | 0.9378 | 0.9849 | 0.9849 | 0.9849 | 0.9378 | |
| GGTP (U/L) (n = 121) | Correlation coefficient | 0.496 | 0.513 | 0.61 | 0.509 | 0.569 | 0.643 |
| Significance Level P | <0.0001 | <0.0001 | <0.0001 | <0.0001 | <0.0001 | <0.0001 | |
| P (FDR) | 0.00001 | 0.00001 | 0.00001 | 0.00001 | 0.00001 | 0.00001 | |
| Parameters of Inflammation and Nonspecific Damage from Hypoxia | |||||||
| CRP (mg/L) (n = 135) | Correlation coefficient | 0.282 | 0.318 | 0.192 | 0.286 | 0.44 | 0.381 |
| Significance Level P | 0.0009 | 0.0002 | 0.0257 | 0.0008 | <0.0001 | <0.0001 | |
| P (FDR) | 0.0010 | 0.00004 | 0.0257 | 0.0011 | 0.00003 | 0.00003 | |
| D-dimers(FEU ug/L) (n = 105) | Correlation coefficient | 0.109 | 0.194 | 0.036 | 0.198 | 0.377 | 0.316 |
| Significance Level P | 0.2694 | 0.0471 | 0.712 | 0.043 | 0.0001 | 0.001 | |
| P (FDR) | 0.3232 | 0.0706 | 0.712 | .0706 | 0.00006 | 0.003 | |
| Ferritin (ng/mL) (n = 78) | Correlation coefficient | 0.38 | 0.456 | 0.465 | 0.454 | 0.574 | 0.586 |
| Significance Level P | 0.0006 | <0.0001 | <0.0001 | <0.0001 | <0.0001 | <0.0001 | |
| P (FDR) | 0.00006 | 0.0001 | 0.0001 | 0.0001 | 0.0001 | 0.0001 | |
| IL6 (pg/mL) (n = 84) | Correlation coefficient | 0.282 | 0.278 | 0.2 | 0.398 | 0.419 | 0.414 |
| Significance Level P | 0.0093 | 0.0105 | 0.0687 | 0.0002 | 0.0001 | 0.0001 | |
| P (FDR) | 0.0126 | 0.0126 | 0.0687 | 0.00004 | 0.00003 | 0.00003 | |
| LDH (U/L) (n = 133) | Correlation coefficient | 0.358 | 0.446 | 0.371 | 0.382 | 0.556 | 0.548 |
| Significance Level P | <0.0001 | <0.0001 | <0.0001 | <0.0001 | <0.0001 | <0.0001 | |
| P (FDR) | 0.00001 | 0.00001 | 0.00001 | 0.00001 | 0.00001 | 0.00001 | |
| Lymphocytes (G/L) (n = 135) | Correlation coefficient | −0.047 | −0.08 | 0.107 | −0.109 | −0.146 | −0.069 |
| Significance Level P | 0.5887 | 0.3555 | 0.2159 | 0.2061 | 0.0904 | 0.4238 | |
| P (FDR) | 0.5887 | 0.5085 | 0.4318 | 0.4318 | 0.4318 | 0.5085 | |
| WBC (G/L) (n = 133) | Correlation coefficient | 0.089 | 0.163 | 0.236 | 0.011 | 0.084 | 0.166 |
| Significance Level P | 0.3062 | 0.0602 | 0.0063 | 0.8975 | 0.3344 | 0.056 | |
| P (FDR) | 0.4013 | 0.1204 | 0.0378 | 0.8975 | 0.4013 | 0.1204 | |
| Variable | Chloroquine YES | Chloroquine NO | P (FDR) | ||||
| N | Median | IQR | N | Median | IQR | ||
| ALT_at_discharge | 122 | 26.0000 | 19.000–49.000 | 13 | 17.0000 | 11.000–41.000 | 0.179 |
| ALT_during_Tx | 34.5000 | 20.000–60.000 | 19.0000 | 13.750–46.250 | 0.1372 | ||
| AST_at_discharge | 22.0000 | 16.000–34.000 | 18.0000 | 15.000–28.250 | 0.284 | ||
| AST_during_Tx | 25.5000 | 19.000–39.000 | 20.0000 | 16.500–29.000 | 0.1372 | ||
| Variable | Azithromycin YES | Azithromycin NO | P (FDR) | ||||
| N | Median | IQR | n | Median | IQR | ||
| ALT_at_discharge | 131 | 26.0000 | 18.250–47.750 | 4 | 14.0000 | 11.500–28.500 | 0.1804 |
| ALT_during_Tx | 34.0000 | 19.250–57.500 | 14.5000 | 13.000–31.000 | 0.1804 | ||
| AST_at_discharge | 22.0000 | 16.000–30.750 | 18.0000 | 15.500–23.500 | 0.1804 | ||
| AST_during_Tx | 25.0000 | 19.000–39.000 | 18.0000 | 14.500–26.000 | 0.1804 | ||
| Variable | Lopinavir/Ritonavir YES | Lopinavir/Ritonavir NO | P (FDR) | ||||
| N | Median | IQR | N | Median | IQR | ||
| ALT_at_discharge | 19 | 40.0000 | 27.750–87.250 | 116 | 24.0000 | 16.500–45.000 | 0.0036 |
| ALT_during_Tx | 63.0000 | 31.500–90.000 | 30.0000 | 19.000–49.000 | 0.0046 | ||
| AST_at_discharge | 30.0000 | 19.000–40.750 | 21.5000 | 16.000–29.000 | 0.0092 | ||
| AST_during_Tx | 38.0000 | 28.500–69.750 | 23.5000 | 18.500–33.500 | 0.0036 | ||
Publisher’s Note: MDPI stays neutral with regard to jurisdictional claims in published maps and institutional affiliations. |
© 2021 by the authors. Licensee MDPI, Basel, Switzerland. This article is an open access article distributed under the terms and conditions of the Creative Commons Attribution (CC BY) license (http://creativecommons.org/licenses/by/4.0/).
Share and Cite
Wiśniewska, H.; Skonieczna-Żydecka, K.; Parczewski, M.; Niścigorska-Olsen, J.; Karpińska, E.; Hornung, M.; Jurczyk, K.; Witak-Jędra, M.; Laurans, Ł.; Maciejewska, K.; et al. Hepatotropic Properties of SARS-CoV-2—Preliminary Results of Cross-Sectional Observational Study from the First Wave COVID-19 Pandemic. J. Clin. Med. 2021, 10, 672. https://doi.org/10.3390/jcm10040672
Wiśniewska H, Skonieczna-Żydecka K, Parczewski M, Niścigorska-Olsen J, Karpińska E, Hornung M, Jurczyk K, Witak-Jędra M, Laurans Ł, Maciejewska K, et al. Hepatotropic Properties of SARS-CoV-2—Preliminary Results of Cross-Sectional Observational Study from the First Wave COVID-19 Pandemic. Journal of Clinical Medicine. 2021; 10(4):672. https://doi.org/10.3390/jcm10040672
Chicago/Turabian StyleWiśniewska, Hanna, Karolina Skonieczna-Żydecka, Miłosz Parczewski, Jolanta Niścigorska-Olsen, Ewa Karpińska, Monika Hornung, Krzysztof Jurczyk, Magdalena Witak-Jędra, Łukasz Laurans, Katarzyna Maciejewska, and et al. 2021. "Hepatotropic Properties of SARS-CoV-2—Preliminary Results of Cross-Sectional Observational Study from the First Wave COVID-19 Pandemic" Journal of Clinical Medicine 10, no. 4: 672. https://doi.org/10.3390/jcm10040672