
Abstract
Purpose
In late 2019, the SARS-CoV-2 virus spread worldwide. The virus has high rates of proliferation and causes severe respiratory symptoms, such as pneumonia. The standard diagnostic method for pneumonia is chest X-ray image. There are many advantages to using COVID-19 diagnostic X-rays: low cost, fast, and widely available.
Methods
We propose an intelligent system to support diagnosis by X-ray images. We tested Haralick and Zernike moments for feature extraction. Experiments with classic classifiers were done.
Results
Support vector machines stood out, reaching an average accuracy of 89.78%, average sensitivity of 0.8979, and average precision and specificity of 0.8985 and 0.9963, respectively.
Conclusion
Using features based on textures and shapes combined with classical classifiers, the developed system was able to differentiate COVID-19 from viral and bacterial pneumonia with low computational cost.
Introduction
A new kind of coronavirus crossed the species barrier in December 2019 in China. This virus is related to severe acute respiratory syndrome coronavirus; for this reason, it received the name SARS-Cov-2 (Lin et al. 2020; Okba et al. 2020). SARS-Cov-2 causes the coronavirus disease 19 (COVID-19) that affects the respiratory system causing several health complications as fever, cough, sore throat, and in the most severe cases, it can lead to shortness of breath and death.
Until the end of April 2020, the SARS-Cov-2 has spread from 213 countries infecting almost 3 million people worldwide and causing more than 200 thousand deaths (WHO 2020). Thus, there is an urgent need of methods to diagnose the disease in a quick and precise way.
Due to the high virus spread rate, tests for diagnosis that are quick and precise are necessary (Beeching et al. 2020). The precise diagnosis in patients with COVID-19 permits they receive medical attention; furthermore, placing these patients in isolation will decrease the disease spread (Beeching et al. 2020). The test standard to the COVID-19 diagnosis is the quantitative polymerase chain reaction (qPCR). However, this exam needs several hours to confirm positivity (Döhla et al. 2020).
Rapid tests based on antibodies, such as IgM/IgG, are nonspecific for COVID-19 and may have very low sensitivity and specificity (Burog et al. 2020; Döhla et al. 2020; Egner et al. 2020; Patel et al. 2020; Tang et al. 2020). IgM/IgG detects the serological evidence of recent infection, not the presence of the virus. Besides, it is not possible to ensure that the positive response is not from antibodies of other coronaviruses and flu viruses (Li et al. 2020b). According to Burog et al. (2020), the use of IgM/IgG rapid test kits as definitive diagnosis of COVID-19 in currently symptomatic patients is not recommended. Liu et al. (2020) concluded that IgM/IgG tests made in samples collected in the first week of illness have only 18.8% of sensitivity and 77.8% of specificity. A low rate of sensitivity of IgM/IgG rapid test was found by Döhla et al. (2020). They compared the results of IgM/IgG with reverse transcription polymerase chain reaction (RT-PCR) in 59 patients and concluded that the rapid test obtained 36.4% of sensitivity and 88.9% of specificity.
In the other hand, IgG/IgM tests only reach high sensitivities and specificities when the viral charge is high. But it happens when the disease is in advanced levels (Guo et al. 2020; Hoffman et al. 2020). In the work of Liu et al. (2020), they also concluded that tests performed during the second week of the disease have 100% of sensitivity and 50% of specificity.
Computed tomography (CT) scans combined with RT-PCR has a great clinical value, considering that in CT images, it is possible to analyze the COVID-19 effects as bilateral pulmonary parenchymal ground-glass and consolidative pulmonary opacities (Li et al. 2020a). However, CT is an expensive exam that requires a dedicated room which can be an area of contamination among patients.
Thus, the development of alternative forms of diagnosis is necessary. Recent works have shown that chest X-ray image can be used to detect the COVID-19 with high accuracy (Apostolopoulos et al. 2020; Apostolopoulos and Mpesiana 2020; Narin et al. 2020; Sethy and Behera 2020). The uses of chest X-ray image in COVID-19 diagnosis is a good option seeing that it is the standard for diagnosing pneumonia. In addition, it is an examination recommended by the Ministry of Health in all suspected cases of pneumonia, according to the “COVID-19 Treatment and Diagnostic Guidelides” (Brazilian Ministry of Health 2020). This type of procedure has benefits such as easy cleaning and the possibility of using portable equipments (Pan American Health Organization 2020), eliminating the movement of patients, as pointed out by the Brazilian College of Radiology and Imaging Diagnoses (Brazilian College of Radiology and Imaging Diagnosis 2020). Considering also the Brazilian public health system composed of 24-h Emergency Care Units (UPAs 24 h), the relevance of using radiographs in the context of the COVID-19 pandemic stands out. The UPAs concentrate care of intermediate complexity and, therefore, have X-ray equipment, electroencephalography, simple laboratory tests, and observation beds. In more severe cases, patients are transferred to a health network hospital for more complex exams (Ministry of Health 2020). In this way, a solution as the one proposed here can be easily inserted in this protocol, allowing the diagnosis of patients in the UPAs and performing a screening. Thus, it will be possible to have greater assertiveness in referring patients to hospitals and mitigate their overcrowding. It is also important to highlight that X-ray is a quick exam and has low price compared with other image exam like computed tomography and nuclear resonance magnetic.
In clinical practice, among the main pneumonia findings, it is common to find whitish or an opacity of one of the lungs when affected by pneumonia. These image artifacts are due to the production of mucus. Different from pneumonias, COVID-19 is a disease that affects the blood, which can lead to thickening of the blood and thrombosis. Consequently, alveoli gas exchanges are impaired. Thus, before patients experienced breathing difficulties, it is common to notice changes in blood saturation. In this case, surfactant is damaged, leading alveoli to collapse and, therefore, compromising respiratory capacities. The tendency is that both lungs can be affected equally. Given the fact that the differential in the diagnosis is opacity, textures assume an important role in image diagnosis.
In this way, extractors of texture and shape feature can assist in the classification of X-ray images, distinguishing between COVID-19 and other pneumonias. Furthermore, this type of approach has several advantages over convolutional networks widely tested in this scenario (Apostolopoulos et al. 2020; Apostolopoulos and Mpesiana 2020; Narin et al. 2020). The first reason is that CNNs are networks which filter the input image using weights. These weights can be determined in different ways, such as by modified backpropagation algorithms for deep networks, transfer learning methods, or randomly. Thus, in each layer of CNN, there is a filtering and pooling process, responsible for the reduction of dimensionality. This method performs an implicit attribute extraction. In our proposed method, however, this extraction of attributes is carried out explicitly. When extracting Haralick and Zernike attributes, we are considering that the diagnosis made by a radiologist is made based on the texture of the image, that is, the area of ground glass. In addition, when there are lung lesions, a different texture from a healthy lung is expected. On the other hand, the functioning of CNNs is of the black box type. This means that there is no explicit correlation between the description of the images and the representation used internally in the classifier. Finally, we highlight the computational cost of deep networks such as CNNs, which restrict their practical applications. In contrast, the proposed method seeks to perform classifications quickly.
Machine learning techniques have been used in several tasks including medical image classification (Azevedo et al. 2015; Barbosa et al. 2020; Cordeiro et al. 2016, 2017; de Lima et al. 2014, 2016; de Santana et al. 2018; de Vasconcelos et al. 2018; Lima et al. 2015; Pereira et al. 2020a, b, c; Rodrigues et al. 2019; Santana et al. 2020; Silva et al. 2020). Thus, these techniques can provide a secure and automatic way to diagnose COVID-19 in chest X-ray images. Thereby, in this study, we propose an automatic system for COVID-19 diagnosis using machine learning techniques and chest X-ray images. In our experiments, we used multilayer perceptron (Haykin 2001; Rosenblatt 1958), support vector machine (Boser et al. 1992; Cortes and Vapnik 1995), random trees, random forest (Breiman 2001; Geurts et al. 2006), Bayesian networks, and Naive Bayes (Cheng and Greiner 2001; Haykin 2001). As feature extractors ,we used Haralick (Haralick et al. 1973) and Zernike (Kan and Srinath 2001) extractors.
This work is organized as follows. “Related works”reviews related works in the diagnosis of COVID-19 using chest X-ray image. “Methods” presents dataset information and reviews the theoretical concepts necessary to understand the work. “Results” shows the experimental results and the resulting desktop application we developed. “Discussion” analyzes the experimental results. “Conclusion” ends the article with the conclusions.
Related works
Some works have proposed the use of artificial intelligence for analysis of X-ray images and diagnosis of COVID-19. Narin et al. (2020) developed a binary classifier to discriminate COVID-19 against healthy patients. They tested three deep convolutional neural networks for classification: ResNet50, InceptionV3, and Inception-ResNetV2. In addition, they applied transfer learning techniques using ImageNet data. The reason for this choice is the small database. The models were made using 100 X-ray images, half of them is COVID-19 positive, and the other half from healthy patients. The images were resized to 224 × 224 pixels. The experiments were performed using the Python language. For each configuration, they tested 30 epochs, with 20% of data used for testing. Furthermore, they applied cross-validation with 5-folds. As performance metrics, the authors used accuracy, sensitivity, specificity, precision, and F1-Score. In this context, ResNet50 presented the best results. This model achieved an average accuracy of 98%, sensitivity of 96%, and precision of 100%.
Likewise, Apostolopoulos and Mpesiana (2020) used transfer learning techniques with convolutional neural networks for the diagnosis of COVID-19. However, Apostolopoulos and Mpesiana (2020) developed multi-class classifiers. First, they used a base of 1427 X-ray images including cases of COVID-19, common bacterial pneumonia, and healthy patients. Then, they included images of viral pneumonia for the development of a second classifier. All images were obtained through public repositories. The images were resized to 200 × 266 pixels. In some cases, to avoid distortion, they added a black background to achieve these dimensions. In this work, the CNNs tested were VGG19, MobileNetV2, Inception, Xception, and Inception ResNet v2. The training was conducted for ten epochs and tenfold cross-validation. Considering the smaller database (without viral pneumonia), the best models found by the authors (VGG19 and MobileNet) have an average accuracy of 93.48% and 92.85%, respectively. For the most complete database, the average accuracy was 94.72%.
Apostolopoulos et al. (2020) analyzed the problem of automatic classification of many lung diseases. The authors considered seven classes: COVID-19, viral pneumonia, bacterial pneumonia, pleural effusion, chronic obstructive pulmonary disease, and pulmonary fibrosis. The images were resized to 200 × 200 pixels and a black background added when necessary. Considering the small number of instances for each class, they applied data augmentation techniques. In this case, the images were randomly rotated or shifted horizontally or vertically. The work covered experiments with CNN Mobile Net v2, testing different learning strategies. Ten-fold cross-validation was used. Using the of-the-self-features learning strategy, the authors found an average accuracy of 51.98% and very low sensitivity and specificity. On the other hand, the best model was obtained with the training-from-scratch strategy. The average accuracy found was 87.66%.
Sethy and Behera (2020) also investigated radiographs as a diagnostic method for COVID-19. They organized two databases: the first, with 25 positive and 25 negative images for COVID-19 (or pneumonia); the second base included MERS, SARS, and ARDS in the COVID-19-positive class, with a total of 266 images. The authors examined the two bases using a deep learning method for extracting attributes (AlexNet, VGG16, VGG19, GoogleNet, ResNet18, ResNet50, ResNet101, InceptionV3, InceptionResNetV2, DenseNet201, and XceptionNet) and SVM as a classifier. As in other works, transfer learning techniques were applied. The experiments were carried out in Matlab, using the deep learning toolbox. In addition, they performed 100 independent simulations for each configuration. The work showed that ResNet50 with SVM presented the best results with an average accuracy of 95.38%.
As for the diagnosis of COVID-19, each of the proposals mentioned above has advantages and disadvantages. They are summarized in Table 1. In the last line, the characteristics of this present work can be observed.
Methods
Proposed method
In this context, this work proposes the development of IKONOS, a desktop application to support and optimize the diagnosis of COVID-19 through chest X-ray images. We also aim to produce a tool for easy maintenance and scalability, using algorithms of low computational complexity. Thus, we seek to provide one more diagnostic method to combat the current pandemic, in order to complement this process and minimize costs.
The basic functioning of this system is this: the medical team of the health institution must request chest X-ray examinations from patients with symptoms characteristic of COVID-19. After receiving the digital images, the radiologist or healthcare professional can then upload the image to the application. The images will then be analyzed by an intelligent system. It will be able to carry out multi-class classification, differentiating multiple respiratory diseases such as COVID-19, viral pneumonia, and bacterial pneumonia. For this, machine learning techniques will be used aiming at good results, even if training the system with a small set of real images. The methods tested in this work will be Haralick and Zernike for feature extraction and multiple classical classifiers will be tested and compared. Finally, the system will provide a diagnosis, which can be viewed on the computer screen. The diagnosis will be available with accuracy, sensitivity, and specificity information, so that the health professional can make the decision of the subsequent clinical conduct. This proposal is summarized in Fig. 1.

Diagram of the proposed method. Chest X-rays of symptomatic patients can be loaded into the IKONOS app. The application consists of an intelligent system capable of extracting features and classifying the image among four cases: healthy patients, viral pneumonia, bacterial pneumonia, and COVID-19. The result can be viewed on any computer with software installed. Accuracy, sensitivity, and specificity information will also be available, helping the professional in decision making
Dataset
For the development of this project, we used X-ray images from different databases. Images of viral pneumonia, bacterial pneumonia, and healthy patients were obtained on the Kaggle website, available in competition format by Mooney (2018). On the other hand, radiographs of patients with COVID-19 were obtained from four different databases:
-
Online repositories: Open source GitHub repository shared by Dr. Joseph Cohen (Cohen et al. 2020). This group built the database with images from publications as they are images that are already available and Radiopaedia database (Radiopaedia 2018). These databases consist of 25 COVID-19 X-ray images of mild, moderate, and severe cases of COVID-19, with AP and PA projections.
-
COVID-19 database, made available online by Societa Italiana di Radiologia Medica e Interventistica (di Radiologia Medica e Intervencionista 2020): This database has 180 X-ray images of mild, moderate, and severe cases of COVID-19, with AP and PA projections.
-
Database from Peshmerga Hospital Erbil: The database has 248 X-ray images of moderate and severe cases of COVID-19, with AP and PA projections.
All the patients classified as COVID-19 positive in our database were diagnosed with gene sequencing and reverse transcription polymerase chain reaction (RT-PCR). The joining of the bases resulted in 6309 images. The number of images for each of the classes is described in the Table 2 below. Figure 2 presents sample images of healthy patients, viral pneumonia, bacterial pneumonia, and COVID-19.
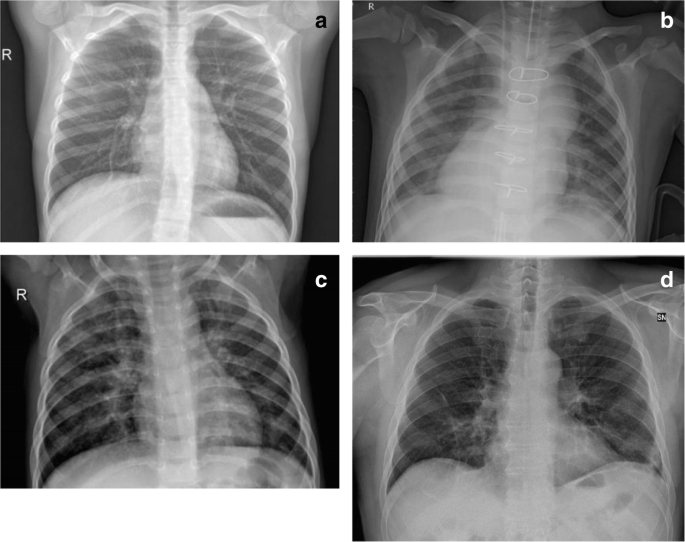
Sample images of the datasets used in this work: healthy lungs (a), bacterial pneumonia (b), viral pneumonia (c), and COVID-19 (d)
In addition, the images of bacterial and viral pneumonia are relatively old, and not from this year of the pandemic (2020). This means that patients diagnosed with pneumonia did not have symptoms characteristic of COVID-19. We also emphasize that we do not have patient demographic information, such as sex, age, and presence of comorbidities.
Feature extraction: Haralick and Zernike
The descriptor of Haralick extracts feature related to the textures of the images. Texture is an intrinsic property of surfaces. It contains important information about their structural composition. From Haralick’s moments, it is possible to differentiate textures that do not follow a certain pattern of repetition throughout the image. This method calculates statistical information associated to the co-occurrence matrices from the gray-scale image. These matrices show the occurrence of certain pixel intensities. Each p(i, j) of the matrix consists on the probability of going from one pixel of intensity i to another pixel of intensity j, according to a certain distance and an angle of the neighborhood (Haralick et al. 1973).
In this way, each matrix considers the relationship between a reference pixel and its neighborhood, thus representing the spatial distribution and dependence of gray levels in regions of the image. In this study, we considered two versions of the image to perform the feature extraction. The first was the gray-scale image and the second was a pre-processed image, using Kohonen maps as filter. This process resulted in 104 features per image.
The Zernike descriptor is another widely used tool for feature extraction. It extracts information related to shape or geometry from an image. Zernike moments are invariant to rotation, not redundant and robust to noise (Kan and Srinath 2001). To calculate these moments, we consider the center of the image as the center of a unit disk. The moments are calculated from the projections of the intensity function of an image on the orthogonal base functions. So, we calculate each of the 64 moments from the Zernike family of polynomials, Vn,m, described by Equations 1 and 2.
The 64 descriptors are equally divided into two groups, according to the polynomial order (n). To calculate the features, n and m from Equations 1 and 2 assume the values in Table 3. So, at the end of the process, we have 32 moments of low order and 32 of high order. Shape-related features of an image are also relevant in the context of identifying pathologies, since these conditions usually result in changes in geometric patterns.
Classification
In this section, we briefly discussed the machine learning methods used to classify X-ray images.
Multilayer perceptron
The psychologist Rosenblatt (Rosenblatt 1958) was one of the pioneers in the concept of artificial neural networks. In 1958, he proposed the perceptron model for supervised learning. Perceptron is the simplest form of neural network used for binary classifications of linearly separable patterns. It consists of a single neuron with adjustable synaptic weights and a bias (Haykin 2001).
Multilayer perceptron (MLP) is a generalization of the single-layer perceptron. It consists of a feed-forward network with an input layer, hidden layers, and one output layer. The addition of hidden layers allows to the network the ability to classify more complex problems than single-layer perceptron such as image classification (Barbosa et al. 2020; Lerner et al. 1994; Phung et al. 2005).
The main algorithm for training MLPs is the error backpropagation algorithm. Based on a gradient, backpropagation proceeds in two phases: propagation and back propagation. In the propagation phase, an output is obtained for a given input pattern. In backpropagation phase, an error is calculated using the desired output and the output obtained in the previous phase. Then, the error is used to update the connection weights. Thus, backpropagation aims to iteratively minimize the error between the network output obtained and the desired output (Haykin 2001).
Support vector machine
Created by Vapnik (Boser et al. 1992; Cortes and Vapnik 1995), the support vector machine (SVM) performs a nonlinear mapping on the dataset in a space of high dimension called feature space. So, a linear decision surface, called hyperplane, is constructed in order to separate distinct classes (Cortes and Vapnik 1995).
Thus, the training process of a support vector machine aims to find the hyperplane equation which maximizes the distance between it and the nearest data point. That hyperplane is called optimal hyperplane (Haykin 2001).
Decision trees
Decision trees are a type of supervised machine learning model. They are widely used to solve both classification and regression problems. In general, trees have nodes, which are structures that store information. In a tree, there are basically four types of nodes: root, leaf, parent, and child. The root node is the starting point and has the highest hierarchical level. One node may connect to another, establishing a parent-child relationship, in which a parent node generates a child node. Leaf nodes, in turn, are terminal nodes, so they have no children, and represent a decision. In this way, using such trees, the algorithm makes a decision after following a path that starts from the root node and reaches a leaf node. There are several types of decision trees. They usually differ from the way the method goes through the tree structure. Among these types, the methods random tree and random forest are two of the main ones.
Random tree algorithm uses a tree built by a stochastic process. This method considers only a few features in each node of the tree, which are randomly selected (Geurts et al. 2006). The random forest algorithm, in turn, consists in a collection of trees. These trees hierarchically divide the data, so that, each tree votes for a class of the problem. At the end, the algorithm chooses the most voted class as the prediction of the classifier (Breiman 2001).
Bayesian network and naive Bayes
Bayes net and naive Bayes are classifiers based on Bayes’ decision theory. Bayesian classifiers, also called the test procedure by the Bayes hypothesis, seek to find a minimum mean risk. By considering a set of correct decisions and a set of incorrect decisions, they use conditional probability to create the data model. The product of the frequency of each decision and the cost involved in making the decision are the weights (Haykin 2001). For a Gaussian distribution, Bayesian networks behave like a linear classifier. Its behavior is comparable with that of a single-layer perceptron.In the standard Bayes network algorithm, it assesses the probability of occurrence of a class from the values given by the others. So, this method assumes dependence between the features. Naive Bayes, on the other hand, considers that all features are independent of each other, being only connected to the class (Cheng and Greiner 2001). This method does not allow dependency between features. Since this assumption represents an unrealistic condition, the algorithm is considered “naive”.
Parameter settings of the classifiers
All experiments were performed using the Weka software. For each configuration described in the table below, 25 simulations were performed, using 10-fold cross-validation. The parameters used in each machine learning method are shown in Table 4.
Metrics
In order to analyze the classification performance, we used five metrics: accuracy, sensitivity, precision, specificity, and kappa index. Accuracy assesses the proportion of images correctly classified on all results. It can be calculated according to Equation 3.
Sensitivity measures the rate of true positives and indicates the system’s ability to correctly detect people who are sick (with COVID-19, for example). They can be calculated according to Equation 4. Precision, on the other hand, is the fraction of the positive predictions that are actually positive. The precision can be calculated according to Equation 5.
Specificity is the metric that evaluates a model’s ability to predict true negatives of each available category or the rate of true negatives. This means that specificity indicates the classifier’s ability to correctly exclude healthy or disease-free people. It can be calculated as the Equation 6. Finally, the kappa index is a very good measure that can handle very well both multi-class and imbalanced class problems, as the one proposed here. It can be calculated according to the Equation 7. These four metrics allow to discriminate between the target condition and health, in addition to quantifying the diagnostic exactitude Borges (2016). These metrics are described as following:
where TP is the true positives, TN is the true negatives, FP is the false positives, and FN the false negatives.
The κ coefficient (kappa) is defined as follows:
where ρo is the observed agreement, or accuracy, and ρe is the expected agreement, defined as following:
Results
After feature extraction, two databases were generated: the first using Haralick; and the second, using Haralick and Zernike. Both bases were trained using multiple classic machine learning methods.
Classifier experiment results
Results using Haralick for feature extraction
Figure 3 shows box plots referring to the four metrics for evaluating the classifiers. Considering the database with Haralick moments, the SVM polynomial with exponent 3 presented the best result in all metrics. In contrast, networks based on Bayes’ theory showed the worst results. Table 5 shows the comparison of these two cases.

Box plots with results for all tested classifiers
Table 6 shows precision, specificity, and sensitivity results for the best model. Notice that COVID-19 is well-discriminated, presenting precision of 0.979, specificity of 0.993, and sensitivity of 0.977. Table 7 presents the confusion matrix. Bacterial and viral pneumonias cause more confusion. A total of 143 images of viral pneumonia were classified as bacterial pneumonia, and 125 images of bacterial pneumonia were classified as viral pneumonia.
Results using Haralick and Zernike for feature extraction
Figure 4, on the other hand, shows box plots with the results obtained with the second database, using moments from Haralick and Zernike. As in the previous case, the support vector machines showed the best results. However, in this case, the best performance was using degree 2. Furthermore, the Bayesian network presented again the worst performance. Table 8 summarizes these results.

Box plots with results for all tested classifiers
Table 9 presents results obtained with Haralick and Zernike extractors: precision, specificity, and sensitivity results for each class, i.e., COVID-19, bacterial pneumonia, viral pneumonia, and healthy. It shows sensitivity of 0.991, precision of 0.988, and specificity of 0.996 for COVID-19. Table 10 presents the confusion matrix for Haralick and Zernike moments, showing that bacterial and viral pneumonias cause more confusion in the classification.
Desktop interface
The prototype of the developed system is fully functional in a desktop version. It works like this: digital X-ray images can be loaded into the software from any computer, as shown in Fig. 5 below. They are analyzed by the intelligent system, capable of performing multiclass classification.

IKONOS App-Main screen. In this screen, a user may load an X-ray image into the system. Then, after clicking on “Classify”, the classification of this image is performed
The result can be visualized by the medical team through the computer, as shown in Fig. 6. Accuracy, precision, and sensitivity information are also available. These allow them to confirm their initial hypotheses, or else to outline others, for the continuation of this investigative process. Considering the demand for a real-time solution, the intelligent model has low associated computational cost, that is, low memory consumption and adequate execution time.

IKONOS App-Results screen. This screen shows the classification result along with the metrics associated to classifier decision. The class appears on the top-left corner of the screen, e.g., COVID-19. Right below the class, there is a box showing the accuracy and kappa statistic metrics. The box placed on the right side of the screen shows the model sensitivity and specificity regarding to the decision of each class
The code for this desktop version is freely available for non-commercial purpose on Github repository: github.com/Biomedical-Computing-UFPE/Ikonos-X-Desktop.
Discussion
When analyzing the box plots and mean and standard deviation values, as can be seen on Fig. 3 and Table 5, we see that the SVM-E3 presented both higher mean and significantly lower standard deviation values. These results point to the possibility of classifying the four selected classes using classical methods and with low computational cost.
Taking into account precision, specificity, and sensitivity results for the best model, as can be seen on Table 6, we can perceive that COVID-19 is well-discriminated, presenting precision of 0.979, specificity of 0.993, and sensitivity of 0.977. These great results for sensitivity and specificity points to the low rate of false negative and false positive associated to the model. In this sense, SVM overall performance indicates that the problem may be generalized, but often in a non-linear way.
The results also show that Bayesian methods resulted in the worst performances. This is because Bayesian methods presuppose statistical independence among features, which is not true because the attributes are correlated, since they extract texture and shape information.
Looking at the confusion matrix on Table 7, it is clear that bacterial and viral pneumonias cause more confusion. A total of 143 images of viral pneumonia were classified as bacterial pneumonia, and 125 images of bacterial pneumonia were classified as viral pneumonia. It highlights the difficulty to discriminate the two major kinds of pneumonia. The COVID-19 classification, on the other hand, reached a higher hit rate. Comparing the second approach, i.e., the combination of Haralick and Zernike moments on the box plots of Fig. 4, we can see the support vector machines showed the best results as well. However, in this case, the best performance was using 2-degree polynomial kernels. Furthermore, the Bayesian network presented again the worst performance, as can be seen on Table 8.
For the combination of Haralick and Zernike moments, we obtained sensitivity of 0.991, precision of 0.988, and specificity of 0.996 foR COVID-19, as can be seen on Table 9. These results highlight the considerable ability of the proposed approach to discriminate COVID-19 between the other classes. The confusion matrix on Table 10 shows that bacterial and viral pneumonias cause more confusion in the classification. A total of 143 images of viral pneumonia were classified as bacterial pneumonia, and 105 images of bacterial pneumonia were classified as viral pneumonia. The COVID-19 classification, on the other hand, reached a considerably high hit rate.
When we compared the results obtained with SVM for Haralick and for moments of Haralick and Zernike, we noticed a small improvement in the metrics in the second case. There is both an increase in averages and a decrease in standard deviations. Despite this, the difference between the two cases is not considerable. This situation indicates that the simplest method, using feature extraction with Haralick and SVM, may be sufficient for a good classification, with high sensitivity and specificity for COVID-19 image diagnosis.
Conclusion
X-rays are one of the steps in the COVID-19 diagnostic process in most of the affected countries, and also the standard exam for assessing pneumonia. In addition, with the support of artificial intelligence, this technique shows results of precision, specificity, and sensitivity much higher than those of rapid tests. Our motivation with this work was to support COVID-19 diagnosis by X-ray automated image analysis using a low-cost computational approach based on explicit image features, specifically texture features from the original image and its gradient version. Since the best expected solutions for COVID-19 image diagnosis support should run on server-side, in order to allow many simultaneous users accessing the computational tool, non-explicit features-based solution like convolutional neural networks tend to become prohibitive due to intensive memory usage and processing.
In this way, using texture and shape descriptors for feature extraction with classic classifiers, we were able to develop an intelligent system with low computational cost. This factor is fundamental when we work with the perspective of a system accessed by several health units simultaneously. Thus, this work achieved relevant results with an evident computational cost much lower than those using deep learning techniques.
These results lead us to believe that clinical diagnosis aligned with image diagnosis could be sufficient for the diagnosis of mild and severe COVID-19 and to proceed to treatment, although samples should be sent for molecular diagnosis in parallel for epidemic purposes. The combination of X-ray image diagnosis and clinical diagnosis can accelerate the beginning of treatment. Consequently, thanks to the wide availability and ease of X-ray equipment, COVID-19 prognosis could be improved.
References
Apostolopoulos ID, Mpesiana TA. Covid-19: automatic detection from x-ray images utilizing transfer learning with convolutional neural networks. Phys Eng Sci Med, page 1, 2020.
Apostolopoulos I, Aznaouridis S, Tzani M. Extracting possibly representative covid19 biomarkers from x-ray images with deep learning approach and image data related to pulmonary diseases. arXiv preprint arXiv:2004.00338, 2020.
Azevedo WW, Lima SML, Fernandes IMM, Rocha ADD, Cordeiro FR, da Silva-Filho AG, dos Santos WP. Morphological extreme learning machines applied to detect and classify masses in mammograms. In 2015 International Joint Conference on Neural Networks (IJCNN), pages 1–8, 2015.
Barbosa VAF, Santana MA, Andrade MKS, Lima RCF, Santos WP. Deepwavelet neural networks for breast cancer early diagnosis using mammary termographies. In: Das H, Pradhan C, Dey N, editors. Deep Learning for Data Analytics: Foundations, Biomedical Applications, and Challenges. 1st ed. London: Academic Press; 2020.
N. J. Beeching, T. E. Fletcher, and M. B. J. Beadsworth. Covid-19: testing times. BMJ, 369, 2020. https://doi.org/10.1136/bmj.m1403. URL https://www.bmj.com/content/369/bmj.m1403.
Borges L. Medidas de acurácia diagnóstica na pesquisa cardiovascular. Int J Cardiovasc Sci. 2016;29(3):218–22.
Boser BE, Guyon IM, Vapnik VN. A training algorithm for optimal margin classifiers. In Proceedings of the fifth annual workshop on Computational learning theory, pages 144–152, 1992.
Brazilian College of Radiology and Imaging Diagnosis. Recommendations for using imaging methods for patients with suspected COVID-19. Brazilian College of Radiology and Imaging Diagnosis, 2020. URL https://cbr.org.br/wp-content/uploads/2020/03/CBR_Recomenda. Last accessed: 2020 July. 29.
Brazilian Ministry of Health. Guidelines for the diagnosis and treatment of COVID-19. Brazilian Society of Clinical Analyzes, 2020. URL www.sbac.org.br/blog/2020/04/09/diretrizes-para-diagnostico-e-tratamento-da-covid-19/. Last accessed: 2020 June. 03.
Breiman L. Random forests. Mach Learn. 2001;45(1):5–32.
Burog AILD, Yacapin CPRC, Maglente RRO, Macalalad-Josue AA, Uy EJB. Should IgM/IgG rapid test kit be used in the diagnosis of COVID-19? Asia Pac Center Evid Based Healthc. 2020;2020(04):1–12.
Cheng J, Greiner R. Learning bayesian belief network classifiers: algorithms and system. Adv Artific Intel. 2001;2056(1):141–51.
Cohen JP, Morrison P, Dao L. Covid-19 image data collection. arXiv 2003.11597, 2020. URL https://github.com/ieee8023/covid-chestxray-dataset.
Cordeiro FR, Santos WP, Silva-Filho AG. A semi-supervised fuzzy growcut algorithm to segment and classify regions of interest of mammographic images. Expert Syst Appl. 2016;65:116–26.
Cordeiro FR, Santos WP, Silva-Filho AG. Analysis of supervised and semisupervised growcut applied to segmentation of masses in mammography images. Computer Methods Biomech Biomed Eng: Imaging Visual. 2017;5(4):297–315.
Cortes C, Vapnik V. Support-vector networks. Mach Learn. 1995;20(3):273–97.
de Lima SM, da Silva-Filho AG, dos Santos WP. A methodology for classification of lesions in mammographies using zernike moments, elm and svm neural networks in a multi-kernel approach. In 2014 IEEE International Conference on Systems, Man, and Cybernetics (SMC), pages 988–991. IEEE, 2014.
de Lima SM, da Silva-Filho AG, dos Santos WP. Detection and classification of masses in mammographic images in a multi-kernel approach. Comput Methods Prog Biomed. 2016;134:11–29.
de Santana MA, Pereira JMS, da Silva FL, Lima NMD, de Sousa FN, de Arruda GMS, et al. Breast cancer diagnosis based on mammary thermography and extreme learning machines. Res Biomed Eng. 2018;34:45–53.
de Vasconcelos J, dos Santos W, de Lima R. Analysis of methods of classification of breast thermographic images to determine their viability in the early breast cancer detection. IEEE Lat Am Trans. 2018;16(6):1631–7.
Döhla M, Boesecke C, Schulte B, Diegmann C, Sib E, Richter E, et al. Rapid point-of-care testing for SARSCoV-2 in a community screening setting shows low sensitivity. Public Health. 2020;182:170–2.
Egner W, Beck DCC, Davis G, Dayan C, El-shanawany T, Griffiths E, Kumararatne D, Sandle L, Sargur R, Savic S, et al. Statement from RCPath’s immunology specialty ad-´ visory committee on COVID-19/SARS CoV2 antibody evaluation. Institute of Clinical Epidemiology, National Institutes of Health-UP Manila and Asia-Pacific Center for Evidence Based Healthcare Inc, 2020.
Geurts P, Ernst D, Wehenkel L. Extremely randomized trees. Mach Learn. 2006;63(1):3–42.
Guo L, Ren L, Yang S, Xiao M, Chang D, Yang F, et al. Profiling early humoral response to diagnose novel coronavirus disease (COVID-19). Clin Infect Dis. 2020;03:2020.
Haralick RM, Shanmugam K, Dinstein I. Textural features for image classification. IEEE Transact Syst Man Cyber. 1973;SMC-3(6):610–21.
Haykin S. Neural networks: principles and practice. Bookman. 2001;11:900.
Hoffman T, Nissen K, Krambrich J, Rönnberg B, Akaberi D, Esmaeilzadeh M, et al. Evaluation of a covid-19 igm and igg rapid test; an efficient tool for assessment of past exposure to sars-cov-2. Infect Ecol Epidemiol. 2020;10(1):1754538.
Kan C, Srinath MD. Combined features of cubic b-spline wavelet moments and zernike moments for invariant character recognition. In Proceedings International Conference on Information Technology: Coding and Computing, pages 511–515, 2001.
B. Lerner, M. Levinstein, B. Rosenberg, H. Guterman, L. Dinstein, and Y. Romem. Feature selection and chromosome classification using a multilayer perceptron neural network. In Proceedings of 1994 IEEE International Conference on Neural Networks (ICNN’94), volume 6, pages 3540–3545. IEEE, 1994.
Li X, Geng M, Peng Y, Meng L, Lu S. Molecular immune pathogenesis and diagnosis of COVID-19. J Pharm Anal. 2020a;10(2).
Li Z, Yi Y, Luo X, Xiong N, Liu Y, Li S, Sun R, Wang Y, Hu B, Chen W, et al. Development and clinical application of a rapid igm-igg combined antibody test for sarscov-2 infection diagnosis. J Med Virol, 2020b.
Lima S, Azevedo W, Cordeiro F, Silva-Filho A, Santos W. Feature extraction employing fuzzy-morphological decomposition for detection and classification of mass on mammograms. In Conference proceedings:... Annual International Conference of the IEEE Engineering in Medicine and Biology Society. IEEE Engineering in Medicine and Biology Society. Annual Conference, volume 2015, pages 801–804, 2015.
Lin D, Liu M, Zhang M, Hu Y, Yang Q, Guo J, Dai Y, Xu Y, Cai Y, Chen X, et al. Evaluations of serological test in the diagnosis of 2019 novel coronavirus (SARS-CoV-2) infections during the COVID-19 outbreak. medRxiv, 2020.
Liu Y, Liu Y, Diao B, Ren F, Wang Y, Ding J, Huang Q. Diagnostic indexes of a rapid igg/igm combined antibody test for sars-cov-2. medRxiv, 2020.
Ministry of Health. Emergency Care Unit (UPA 24h): what it is, when to use it, guidelines and competencies. Ministry of Health, 2020. URL https://www.saude.gov.br/saude-de-a-z/unidade-de-pronto-atendimento-upa-24h. Last accessed: 2020 July. 29.
P. Mooney. Chest X-rays images (Pneumonia), 2018. URL https://www.kaggle.com/paultimothymooney/chest-xray-pneumonia. (Last accessed: 2020 April 21).
Narin A, Kaya C, Pamuk Z. Automatic detection of coronavirus disease (covid19) using x-ray images and deep convolutional neural networks. arXiv preprint arXiv:2003.10849, 2020.
Okba NM, Muller MA, Li W, Wang C, GeurtsvanKessel CH, Corman VM, Lamers MM, Sikkema RS, de Bruin E, Chandler FD, et al. SARS-CoV-2 specific antibody responses in covid-19 patients. medRxiv, 2020.
Pan American Health Organization. COVID-19 - Use of imaging tests of the chest on COVID-19. Pan American Health Organization, 2020. URL https://iris.paho.org/bitstream/handle/10665.2/52316/OPASWBRACOVID-1920079_por.pdf?sequence=5. Last accessed: 2020 July. 29.
Patel R, Babady E, Theel ES, Storch GA, Pinsky BA, George KS, Smith TC, Bertuzzi S. Report from the american society for microbiology covid-19 international summit, 23 march 2020: value of diagnostic testing for sars–cov-2/covid-19, 2020.
Pereira JMS, Santana MA, Lima RCF, Lima SML, Santos WP. Method for classification of breast lesions in thermographic images using elm classifiers. In: dos Santos WP, de Santana MA, da Silva WWA, editors. Understanding a Cancer Diagnosis. 1st ed. New York: Nova Science; 2020a. p. 117–32.
Pereira JMS, Santana MA, Lima RCF, Santos WP. Lesion detection in breast thermography using machine learning algorithms without previous segmentation. In: dos Santos WP, de Santana MA, da Silva WWA, editors. Understanding a Cancer Diagnosis. 1st ed. New York: Nova Science; 2020b. p. 81–94.
Pereira JMS, Santana MA, Silva WWA, Lima RCF, Lima SML, Santos WP. Dialectical optimization method as a feature selection tool for breast cancer diagnosis using thermographic images. In: dos Santos WP, de Santana MA, da Silva WWA, editors. Understanding a Cancer Diagnosis. 1st ed. New York: Nova Science; 2020c. p. 95–118.
Phung SL, Bouzerdoum A, Chai D. Skin segmentation using color pixel classification: analysis and comparison. IEEE Trans Pattern Anal Mach Intell. 2005;27(1):148–54.
Radiopaedia. Covid-19 chest X-rays images, 2018. URL https://radiopaedia.org/cases?lang=us. (Last accessed: 2020 July 29).
Rodrigues AL, de Santana MA, Azevedo WW, Bezerra RS, Barbosa VA, de Lima RC, et al. Identification of mammary lesions in thermographic images: feature selection study using genetic algorithms and particle swarm optimization. Res Biomed Eng. 2019;35(3):213–22.
Rosenblatt F. The perceptron: a probabilistic model for information storage and organization in the brain. Psychol Rev. 1958;65(6):386.
S. I. di Radiologia Medica e Intervencionista. Covid-19 Database, 2020. URL https://www.sirm.org/category/senza-categoria/covid-19/. (accessed April 21, 2020).
Santana MA, Pereira JMS, Lima RCF, Santos WP. Breast lesions classification in frontal thermographic images using intelligent systems and moments of haralick and zernike. In: dos Santos WP, de Santana MA, da Silva WWA, editors. Understanding a Cancer Diagnosis. 1st ed. New York: Nova Science; 2020. p. 65–80.
Sethy PK, Behera SK. Detection of coronavirus disease (Covid-19) based on deep features. Preprints, 2020030300:2020, 2020.
Silva WWA, Santana MA, Silva Filho AG, Lima SML, Santos WP. Morphological extreme learning machines applied to the detection and classification of mammary lesions. In: Gandhi TK, Bhattacharyya S, De S, Konar D, Dey S, editors. Advanced machine vision paradigms for medical image analysis. London: Elsevier; 2020.
Tang Y-W, Schmitz JE, Persing DH, Stratton CW. The laboratory diagnosis of covid-19 infection: current issues and challenges. J Clin Microbiol. 2020;3:2020.
World Health Organization. Coronavirus disease (COVID-19) pandemic. 2020. www.who.int/emergencies/diseases/novel-coronavirus-2019. Accessed 28 Apr 2020.
Acknowledgments
The authors are grateful to the Federal University of Pernambuco and the Brazilian research agencies FACEPE, CAPES, and CNPq, for the partial financial support of this research.
Funding
This study was funded by the Federal University of Pernambuco and the Brazilian research agencies FACEPE, CAPES, and CNPq.
Author information
Authors and Affiliations
Corresponding author
Ethics declarations
Conflict of interest
The authors declare that they have no conflict of interest.
Ethical approval
All procedures performed in studies involving human participants were in accordance with the ethical standards of the institutional and/or national research committee and with the 1964 Helsinki declaration and its later amendments or comparable ethical standards.
Additional information
Publisher’s note
Springer Nature remains neutral with regard to jurisdictional claims in published maps and institutional affiliations.
Rights and permissions
About this article

Cite this article
Gomes, J.C., Barbosa, V.A.d.F., Santana, M.A. et al. IKONOS: an intelligent tool to support diagnosis of COVID-19 by texture analysis of X-ray images. Res. Biomed. Eng. 38, 15–28 (2022). https://doi.org/10.1007/s42600-020-00091-7
Received:
Accepted:
Published:
Issue Date:
DOI: https://doi.org/10.1007/s42600-020-00091-7