
Successive Pandemic Waves with Different Virulent Strains and the Effects of Vaccination for SARS-CoV-2

 ,
,  ,
, 
 ,
,  and
and
Abstract
:1. Introduction
- Social distancing: the obvious way to reduce susceptible-infected interaction and subsequent contagion;
- Mask wearing and hygiene: this was implemented once it became known that transmission is mainly through respiratory droplets of infected patients and contact with surfaces infected by aerosol;
- Vaccines: a correct vaccination program can decrease overall transmission and the intensity of the disease symptoms among those infected and vaccinated, reducing the public health collapse risk and the mortality rates, as susceptible but vaccinated people become asymptomatic. Still, the virus will circulate, and the lack of a proper vaccination will create outbreaks due to contact between an increasing number of “asymptomatic” people with susceptible people. As [5] demonstrated, the existence of transient collective immunity may prolong an epidemic, and a bad vaccine scheme may exacerbate this pattern.
2. Materials and Methods
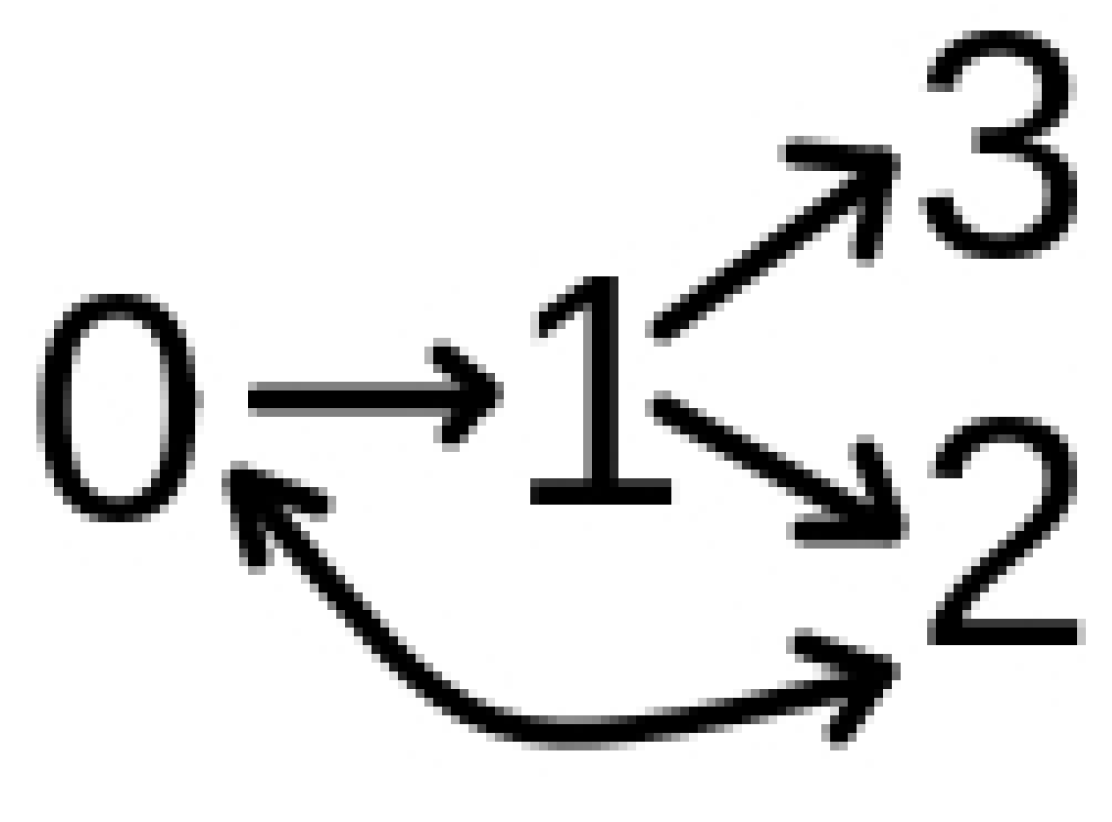
The Model
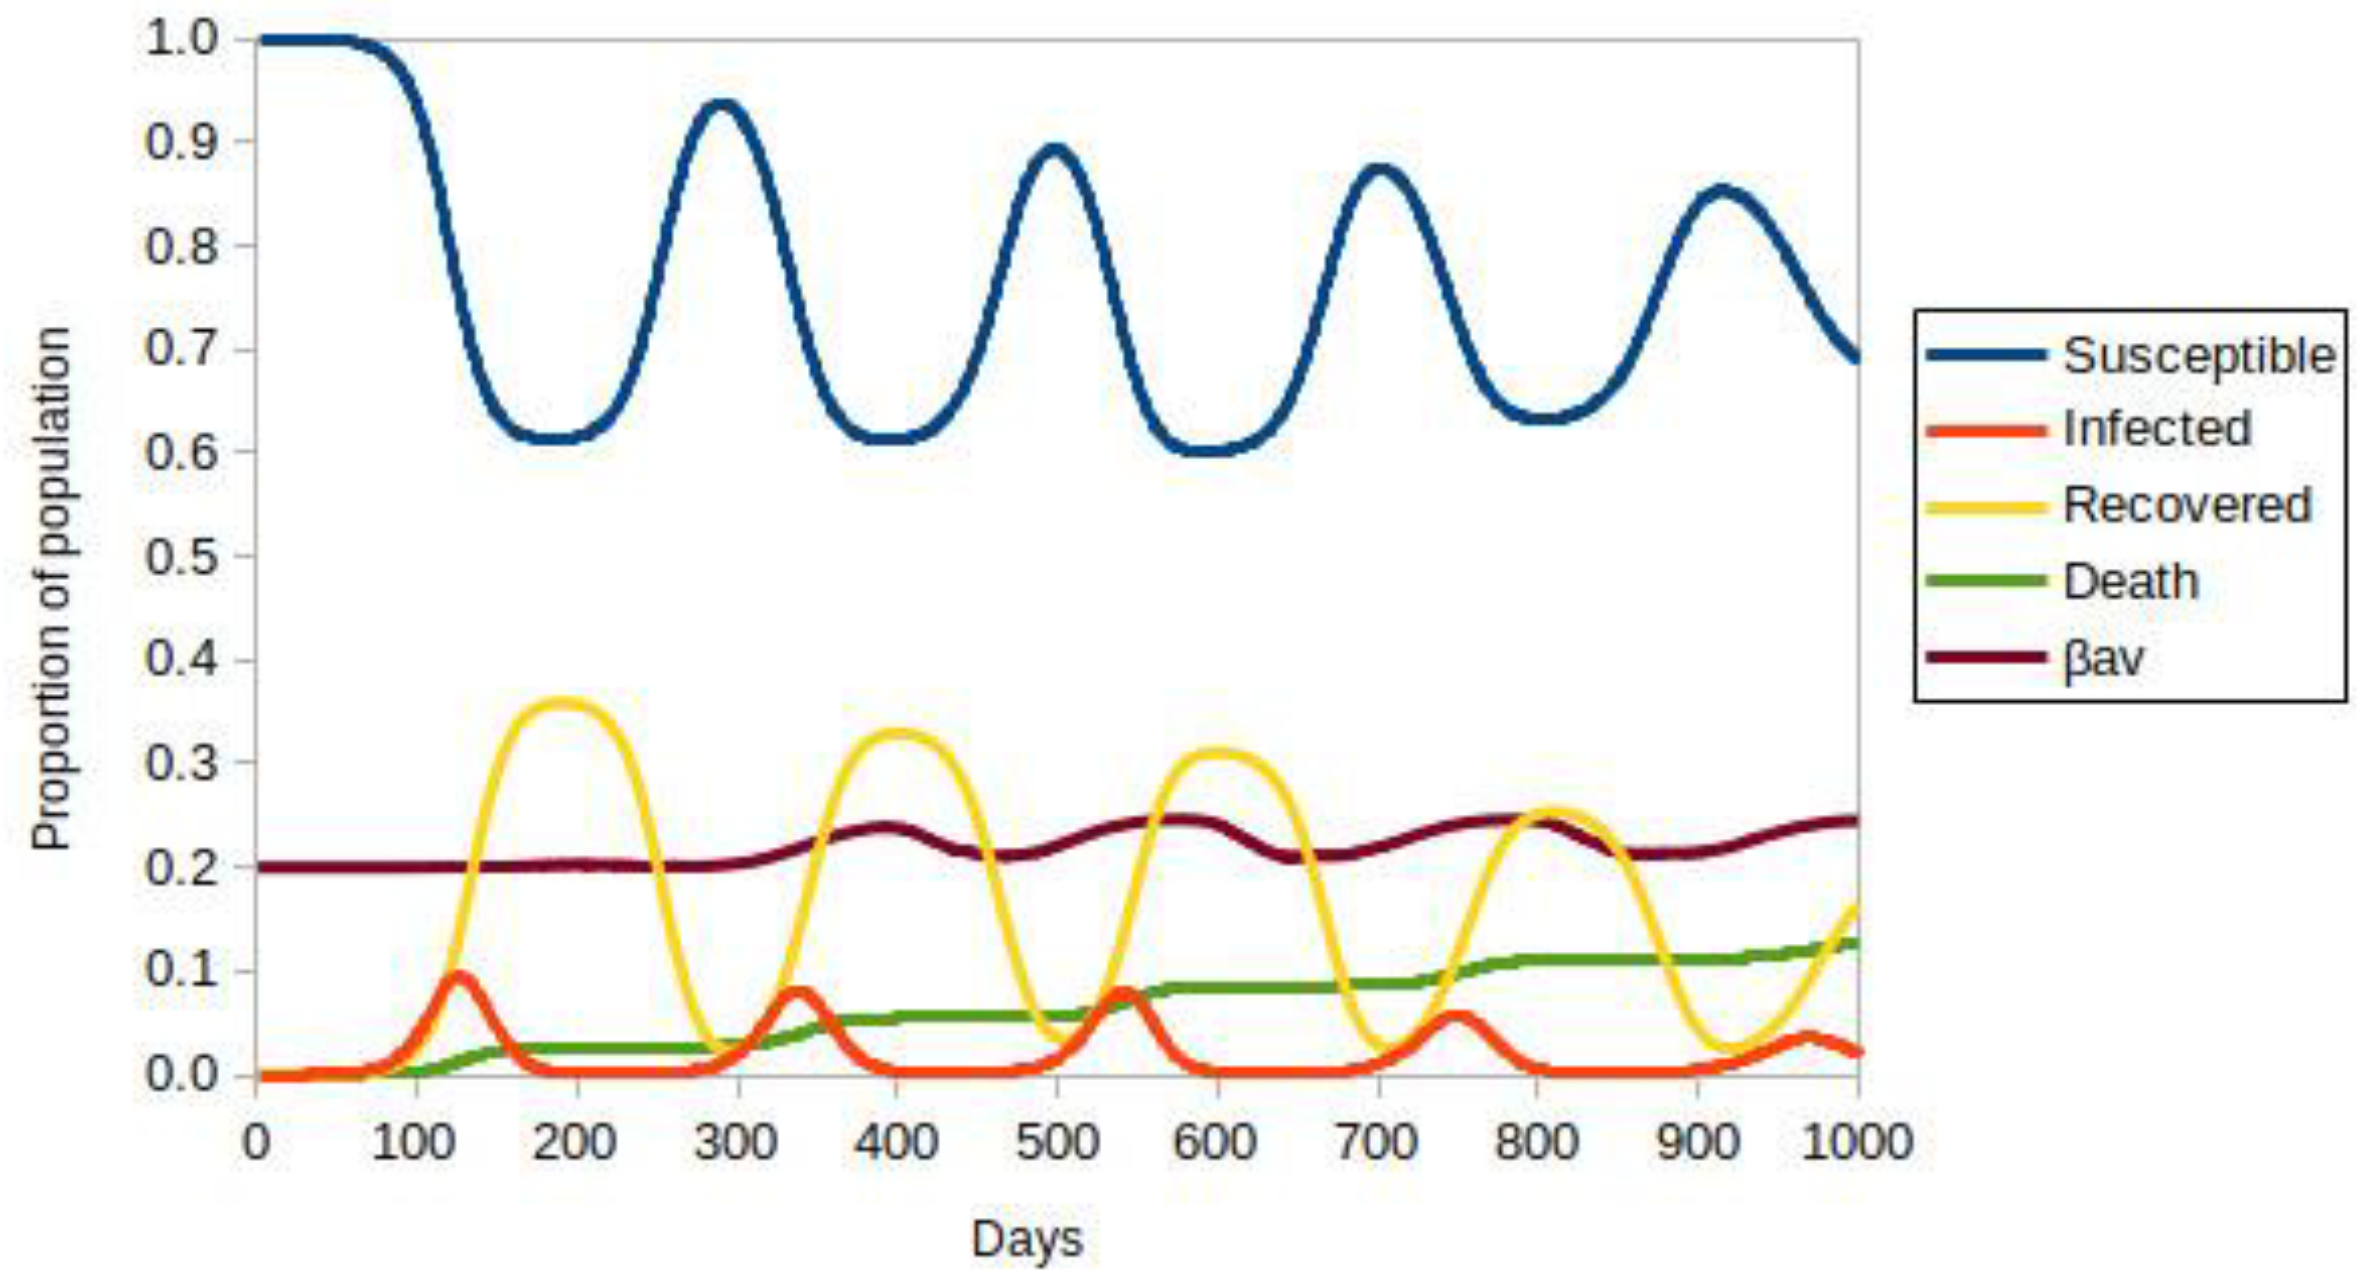
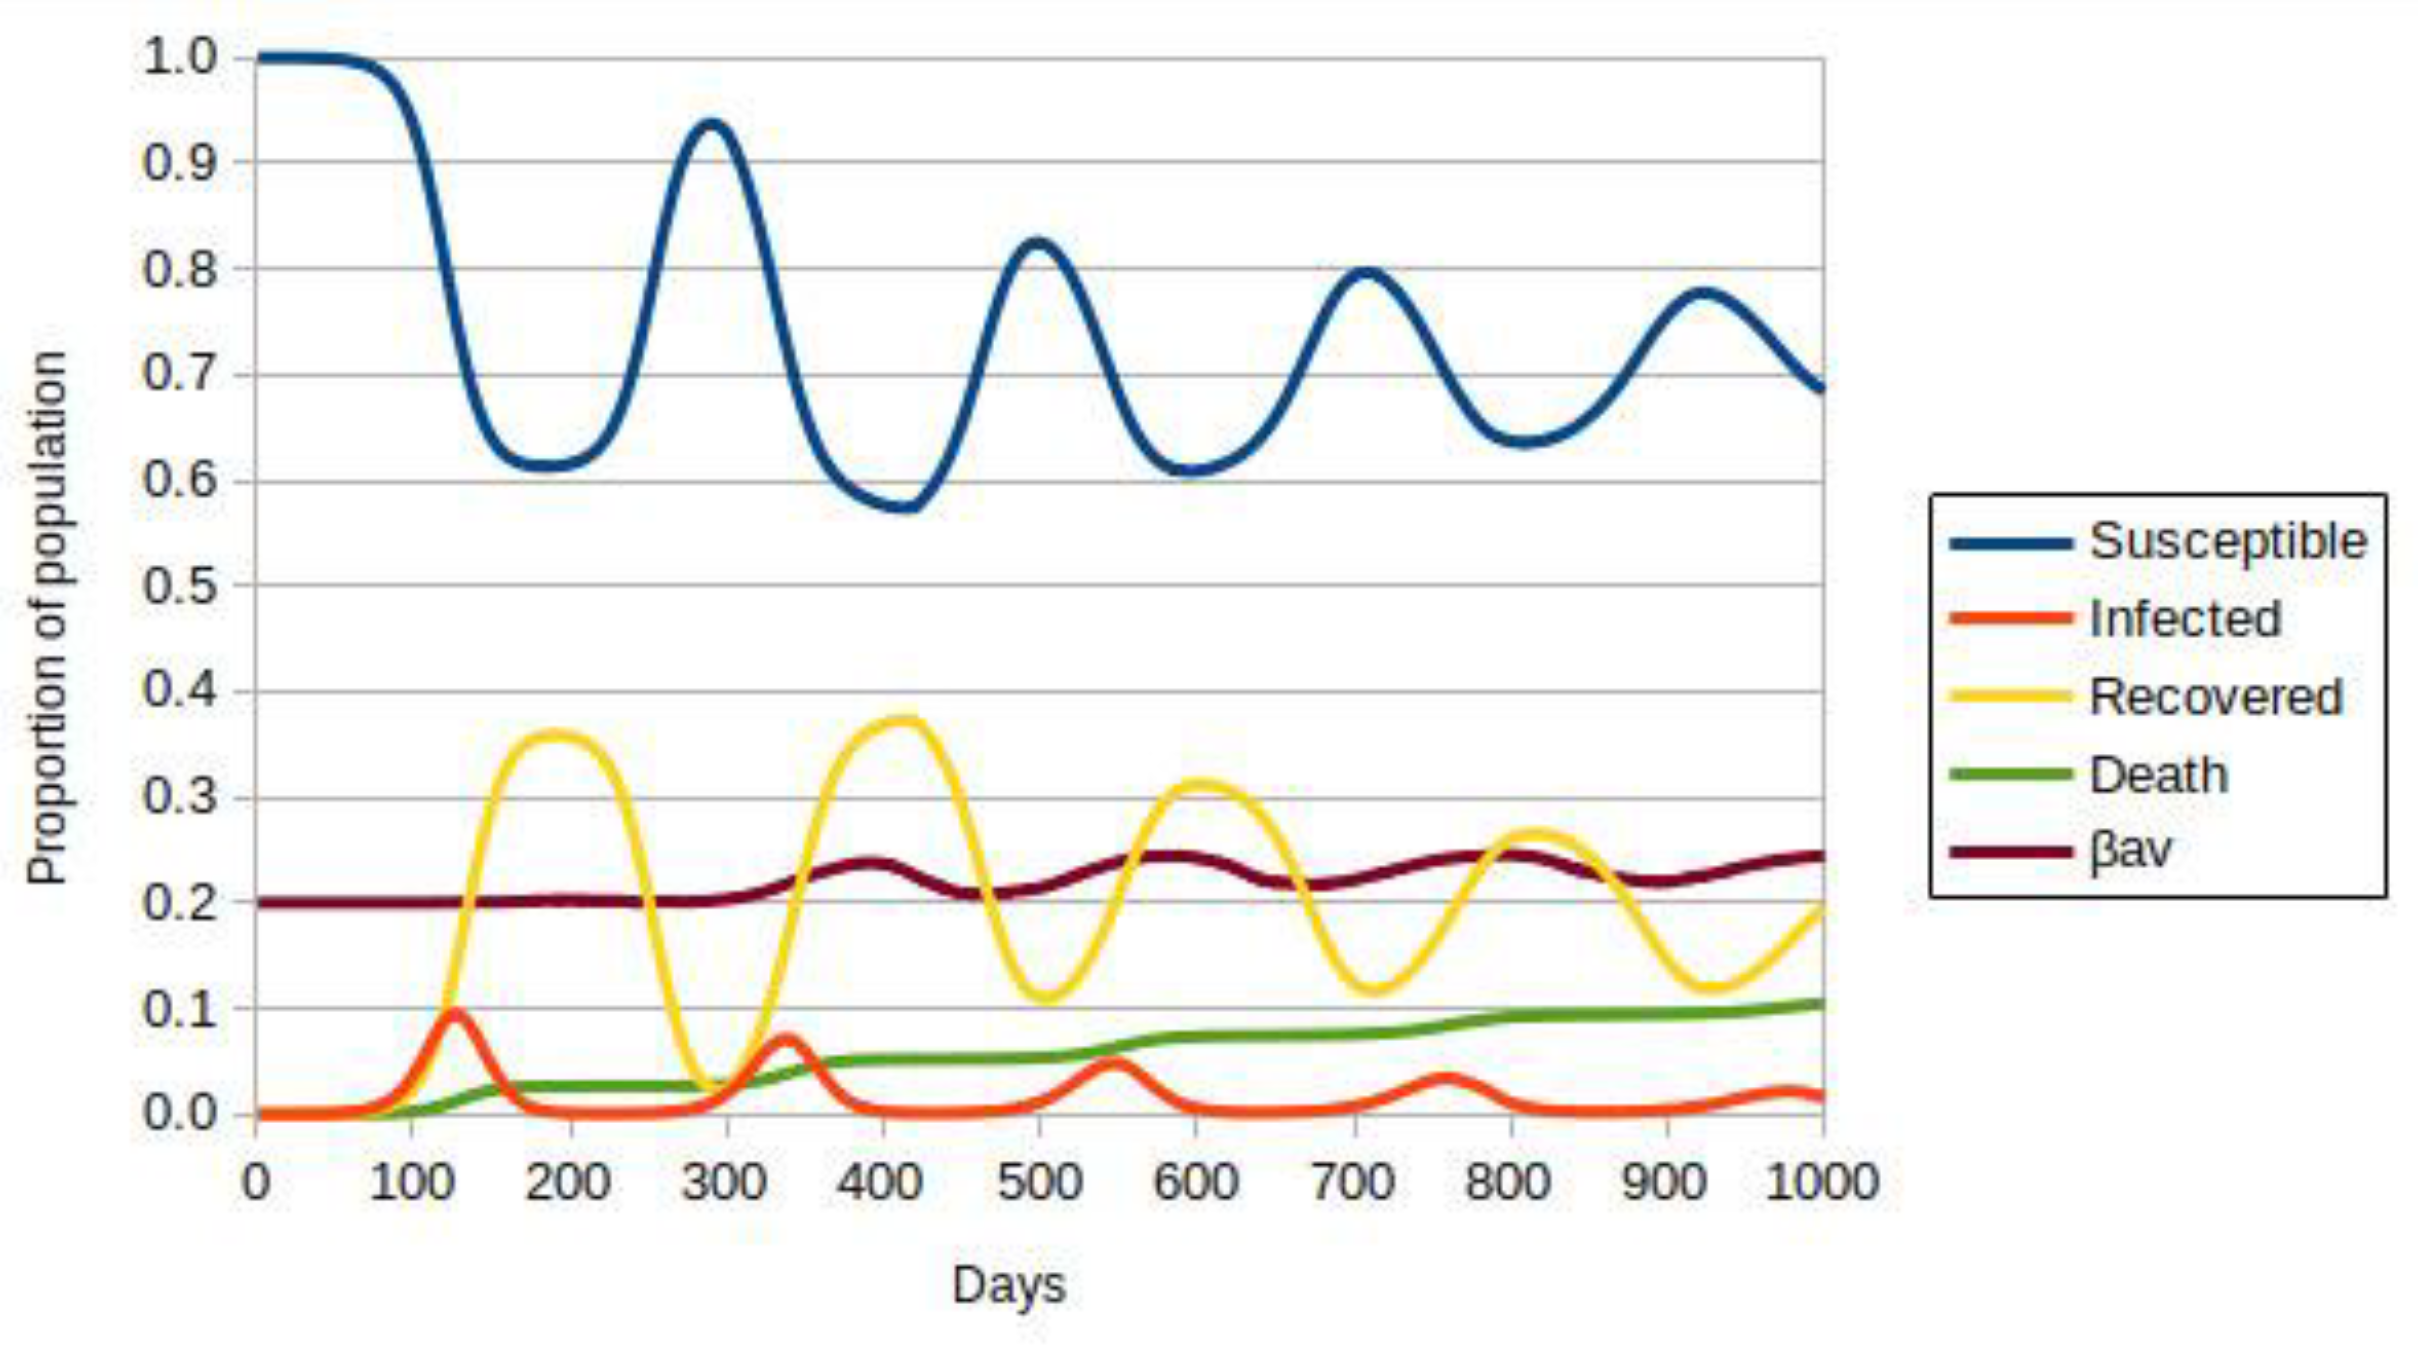
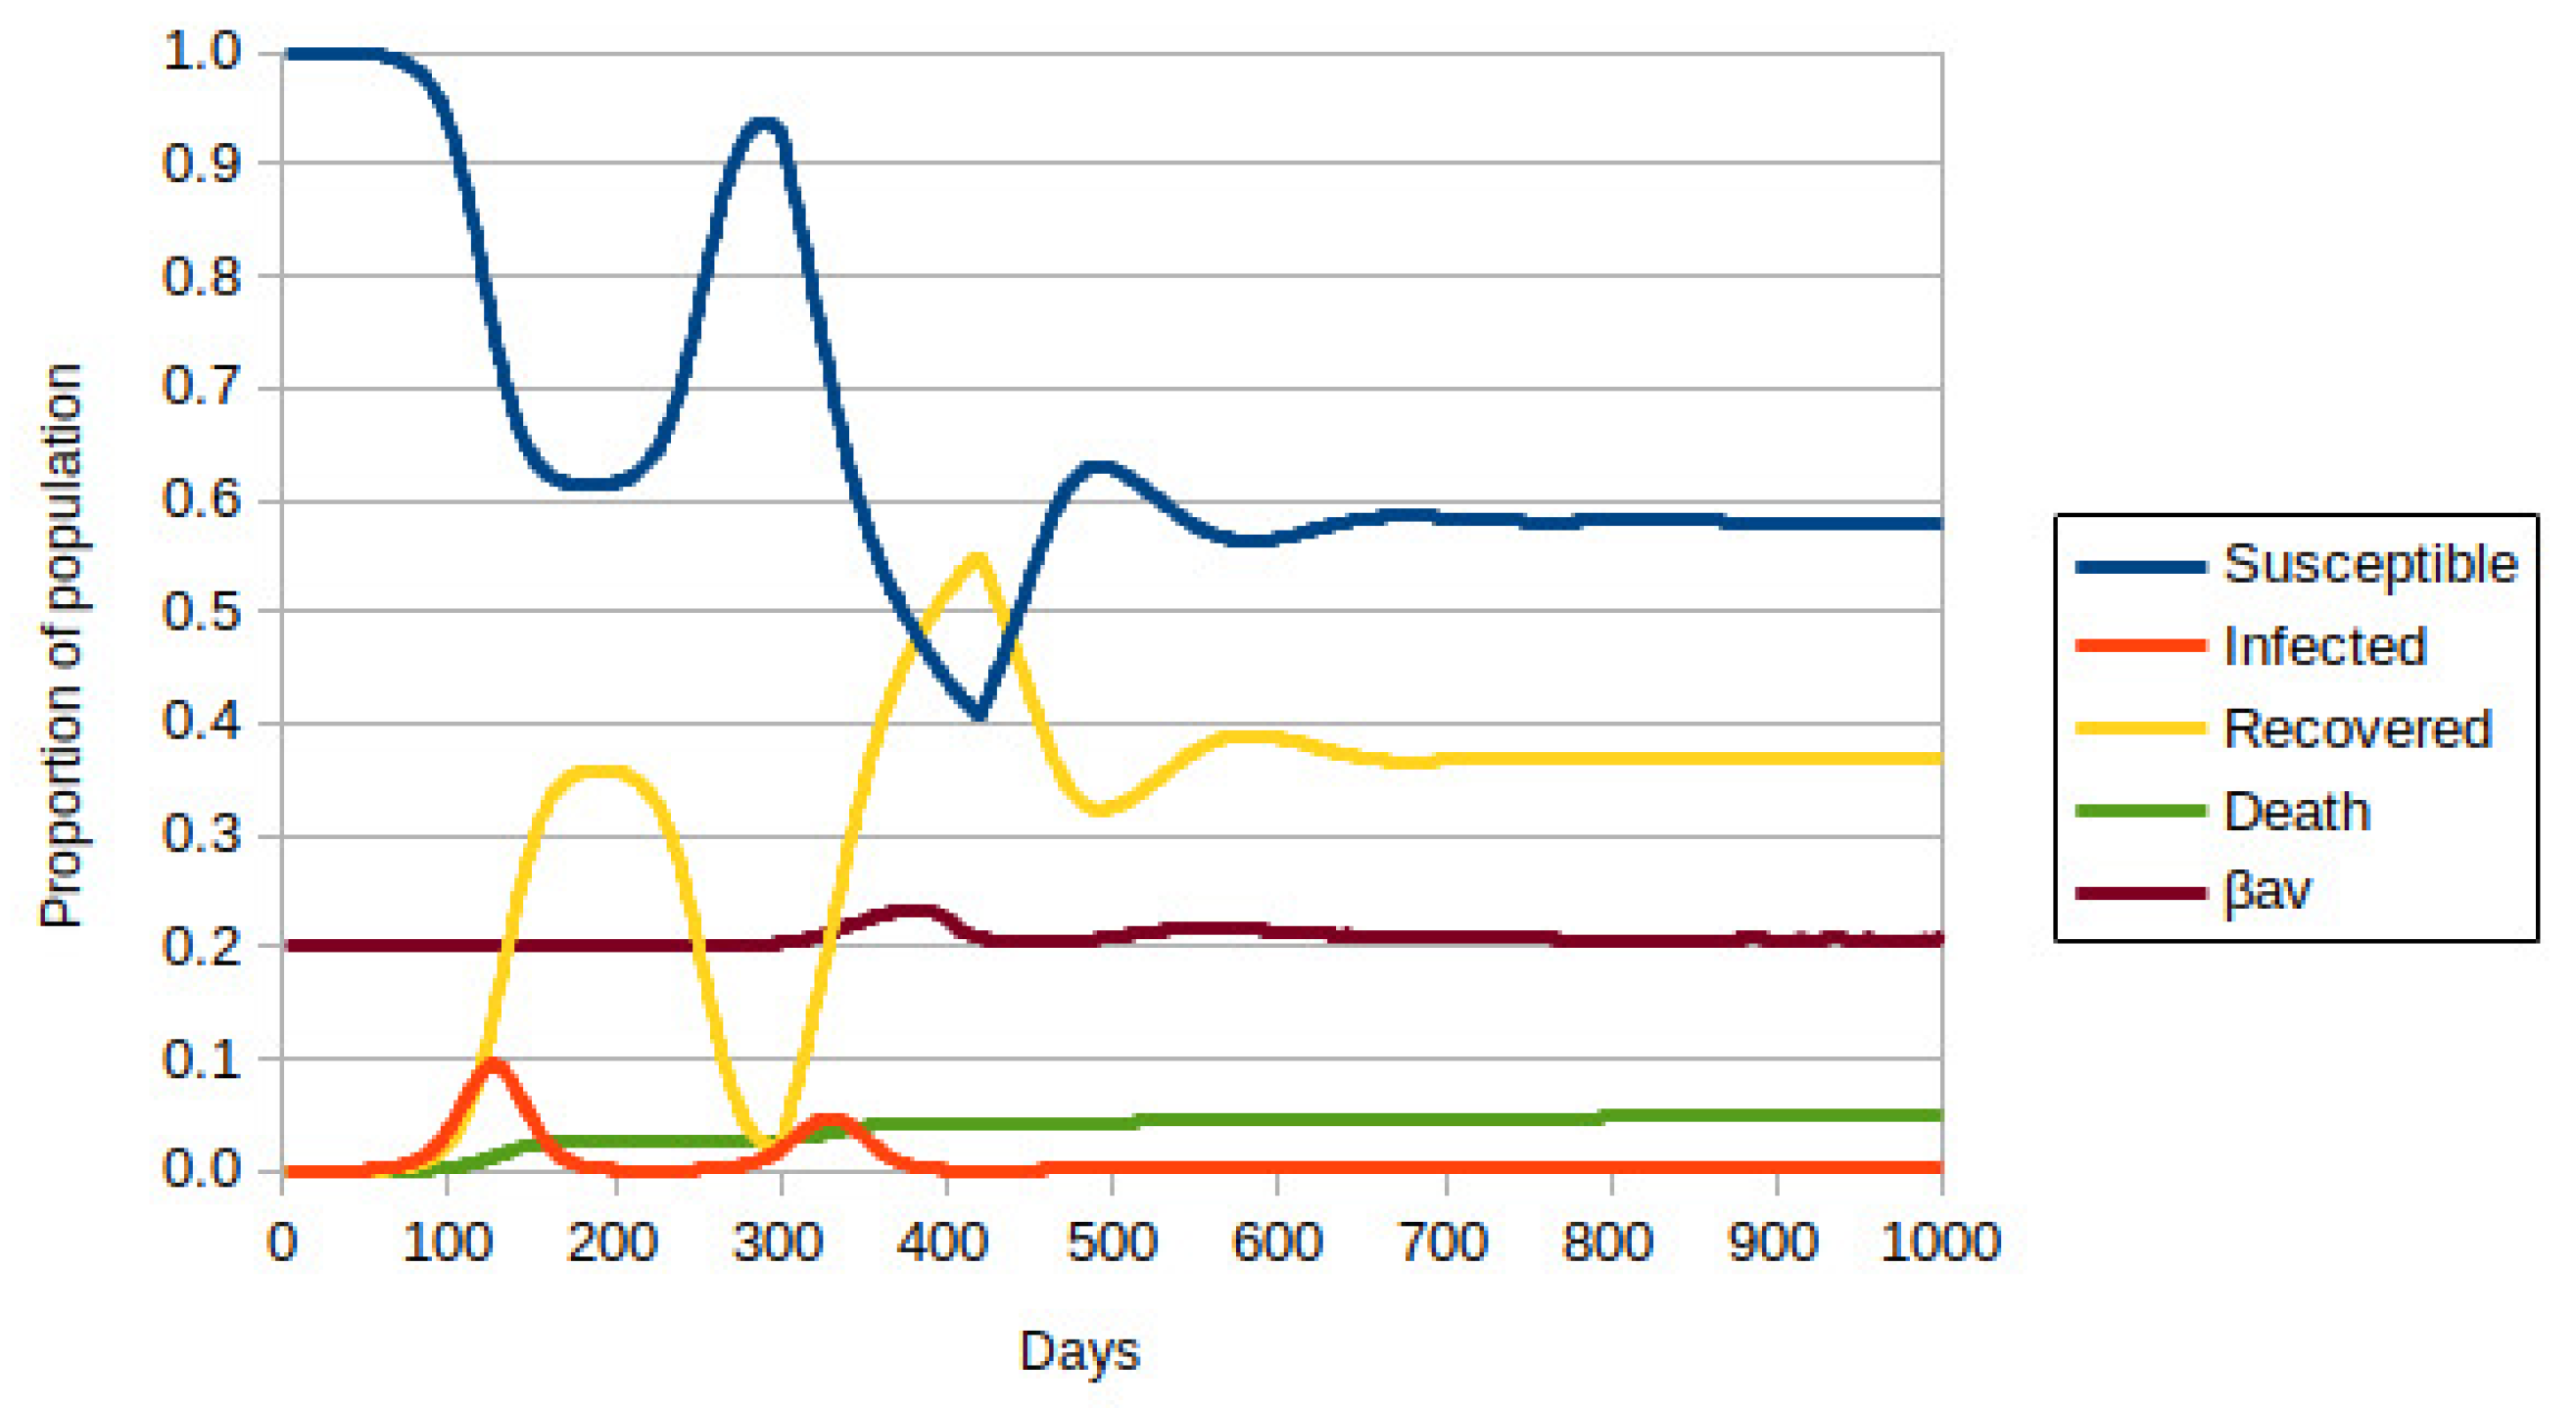
3. Results
3.1. Model with Two Strains
3.2. Model with Many Strains
4. Discussion
5. Conclusions
Supplementary Materials
Author Contributions
Funding
Data Availability Statement
Acknowledgments
Conflicts of Interest
References
- Ribeiro, S.P.; Castro e Silva, A.; Dáttilo, W.; Reis, A.B.; Góes-Neto, A.; Alcantara, L.C.J.; Giovanetti, M.; Coura-Vital, W.; Fernandes, G.W.; Azevedo, V.A.C. Severe airport sanitarian control could slow down the spreading of COVID-19 pandemics in Brazil. PeerJ 2020, 8, e9446. [Google Scholar] [CrossRef] [PubMed]
- Ribeiro, S.P.; Dáttilo, W.; Barbosa, D.S.; Coura-Vital, W.; Das Chagas, I.A.S.; Dias, C.P.; Silva, A.V.C.D.C.E.; Morais, M.H.F.; Góes-Neto, A.; Azevedo, V.A.C.; et al. Worldwide COVID-19 spreading explained: Traveling numbers as a primary driver for the pandemic. An. Acad. Bras. Cienc. 2020, 92, 1–10. [Google Scholar] [CrossRef] [PubMed]
- Coelho, M.T.P.; Rodrigues, J.F.M.; Medina, A.M.; Scalco, P.; Terribile, L.C.; Vilela, B.; Diniz-Filho, J.A.F.; Dobrovolski, R. Global expansion of COVID-19 pandemic is driven by population size and airport connections. PeerJ 2020, 8, e9708. [Google Scholar] [CrossRef]
- COVID-19 Dashboard by the Center for Systems Science and Engineering (CSSE) at Johns Hopkins University (JHU). Available online: https://coronavirus.jhu.edu/map.html (accessed on 20 November 2021).
- Tkachenko, A.V.; Maslov, S.; Elbanna, A.; Wong, G.N.; Weiner, Z.J.; Goldenfeld, N. Time-dependent heterogeneity leads to transient suppression of the COVID-19 epidemic, not herd immunity. Proc. Natl. Acad. Sci. USA 2021, 118, e2015972118. [Google Scholar] [CrossRef] [PubMed]
- Sanjuán, R.; Domingo-Calap, P. Mechanisms of viral mutation. Cell. Mol. Life Sci. 2016, 73, 4433–4448. [Google Scholar] [CrossRef] [Green Version]
- Latinne, A.; Hu, B.; Olival, K.J.; Zhu, G.; Zhang, L.; Li, H.; Chmura, A.A.; Field, H.E.; Zambrana-Torrelio, C.; Epstein, J.H.; et al. Origin and cross-species transmission of bat coronaviruses in China. Nat. Commun. 2020, 11, 4235. [Google Scholar] [CrossRef]
- Pachetti, M.; Marini, B.; Benedetti, F.; Giudici, F.; Mauro, E.; Storici, P.; Masciovecchio, C.; Angeletti, S.; Ciccozzi, M.; Gallo, R.C.; et al. Emerging SARS-CoV-2 mutation hot spots include a novel RNA-dependent-RNA polymerase variant. J. Transl. Med. 2020, 18, 1–9. [Google Scholar] [CrossRef] [Green Version]
- SARS-CoV-2 Variant Classifications and Definitions. Available online: https://www.cdc.gov/coronavirus/2019-ncov/variants/variant-info.html (accessed on 20 November 2021).
- Du Plessis, L.; McCrone, J.T.; Zarebski, A.E.; Hill, V.; Ruis, C.; Gutierrez, B.; Raghwani, J.; Ashworth, J.; Colquhoun, R.; Connor, T.R.; et al. Establishment and lineage dynamics of the SARS-CoV-2 epidemic in the UK. Science 2021, 371, 708–712. [Google Scholar] [CrossRef]
- Mohammadi, M.; Shayestehpour, M.; Mirzaei, H. The impact of spike mutated variants of SARS-CoV2 [Alpha, Beta, Gamma, Delta, and Lambda] on the efficacy of subunit recombinant vaccines. Braz. J. Infect. Dis. 2021, 25, 101606. [Google Scholar] [CrossRef]
- Farinholt, T.; Doddapaneni, H.; Qin, X.; Menon, V.; Meng, Q.; Metcalf, G.; Chao, H.; Gingras, M.C.; Avadhanula, V.; Farinholt, P.; et al. Transmission event of SARS-CoV-2 delta variant reveals multiple vaccine breakthrough infections. BMC Med. 2021, 19, 255. [Google Scholar] [CrossRef]
- Saito, A.; Irie, T.; Suzuki, R.; Maemura, T.; Nasser, H.; Uriu, K.; Kosugi, Y.; Shirakawa, K.; Sadamasu, K.; Kimura, I.; et al. Enhanced fusogenicity and pathogenicity of SARS-CoV-2 Delta P681R mutation. Nature 2021, 9, 1–7. [Google Scholar] [CrossRef] [PubMed]
- Shuai, H.; Chan, J.F.W.; Hu, B.; Chai, Y.; Yuen, T.T.T.; Yin, F.; Huang, X.; Yoon, C.; Hu, J.C.; Liu, H.; et al. Attenuated replication and pathogenicity of SARS-CoV-2 B.1.1.529 Omicron. Nature 2022. [Google Scholar] [CrossRef]
- Halfmann, P.J.; Iida, S.; Iwatsuki-Horimoto, K.; Maemura, T.; Kiso, M.; Scheaffer, S.M.; Darling, T.L.; Joshi, A.; Loeber, S.; Singh, G.; et al. SARS-CoV-2 Omicron virus causes attenuated disease in mice and hamsters. Nature 2022. [Google Scholar] [CrossRef] [PubMed]
- Konings, F.; Perkins, M.D.; Kuhn, J.H.; Pallen, M.J.; Alm, E.J.; Archer, B.N.; Barakat, A.; Bedford, T.; Bhiman, J.N.; Caly, L.; et al. SARS-CoV-2 Variants of Interest and Concern naming scheme conducive for global discourse. Nat. Microbiol. 2021, 6, 821–823. [Google Scholar] [CrossRef] [PubMed]
- Wang, Z.; Muecksch, F.; Schaefer-Babajew, D.; Finkin, S.; Viant, C.; Gaebler, C.; Hoffmann, H.H.; Barnes, C.O.; Cipolla, M.; Ramos, V.; et al. Naturally enhanced neutralizing breadth against SARS-CoV-2 one year after infection. Nature 2021, 595, 426–431. [Google Scholar] [CrossRef] [PubMed]
- Turner, J.S.; Kim, W.; Kalaidina, E.; Goss, C.W.; Rauseo, A.M.; Schmitz, A.J.; Hansen, L.; Haile, A.; Klebert, M.K.; Pusic, I.; et al. SARS-CoV-2 infection induces long-lived bone marrow plasma cells in humans. Nature 2021, 595, 421–425. [Google Scholar] [CrossRef]
- Vitale, J.; Mumoli, N.; Clerici, P.; Paschale, M.; Evangelista, I.; Cei, M.; Mazzone, A. Assessment of SARS-CoV-2 Reinfection 1 Year After Primary Infection in a Population in Lombardy, Italy. JAMA Intern. Med. 2021, 181, 1407–1409. [Google Scholar] [CrossRef] [PubMed]
- Ribeiro, S.P.; Reis, A.B.; Dáttilo, W.; Silva, A.V.C.D.C.E.; Barbosa, E.A.G.; Coura-Vital, W.; Góes-Neto, A.; Azevedo, V.A.C.; Fernandes, G.W. From Spanish Flu to Syndemic COVID-19: Long-standing sanitarian vulnerability of Manaus, warnings from the Brazilian rainforest gateway. An. Acad. Bras. Cienc. 2021, 93, 1–14. [Google Scholar] [CrossRef]
- Sun, K.; Wang, W.; Gao, L.; Wang, Y.; Luo, K.; Ren, L.; Zhan, Z.; Chen, X.; Zhao, S.; Huang, Y.; et al. Transmission heterogeneities, kinetics, and controllability of SARS-CoV-2. Science 2021, 371, eabe2424. [Google Scholar] [CrossRef]
- Chinazzi, M.; Davis, J.T.; Ajelli, M.; Gioannini, C.; Litvinova, M.; Merler, S.; Pastore y Piontti, A.; Mu, K.; Rossi, L.; Sun, K.; et al. The effect of travel restrictions on the spread of the 2019 novel coronavirus (COVID-19) outbreak. Science 2020, 368, 395–400. [Google Scholar] [CrossRef] [Green Version]
- Liu, P.; Jiang, J.-Z.; Wan, X.-F.; Hua, Y.; Li, L.; Zhou, J.; Wang, X.; Hou, F.; Chen, J.; Zou, J.; et al. Are pangolins the intermediate host of the 2019 novel coronavirus (SARS-CoV-2)? PLoS Pathog. 2020, 16, e1008421. [Google Scholar] [CrossRef] [PubMed]
- Interim Clinical Considerations for Use of COVID-19 Vaccines Currently Approved or Authorized in the United States. Available online: https://www.cdc.gov/vaccines/covid-19/clinical-considerations/covid-19-vaccines-us.html (accessed on 20 November 2021).
- Kermack, W.O.; McKendrick, A.G. A contribution to the mathematical theory of epidemics. Proc. R. Soc. Lond. A 1927, 115, 700–721. [Google Scholar] [CrossRef] [Green Version]
- Bonabeau, E. Agent-based modeling: Methods and techniques for simulating human systems. Proc. Natl. Acad. Sci. USA 2002, 99, 7280–7287. [Google Scholar] [CrossRef] [Green Version]
- Chen, Y.-C.; Lu, P.-E.; Chang, C.-S.; Liu, T.-H. A Time-Dependent SIR Model for COVID-19 With Undetectable Infected Persons. IEEE Trans. Netw. Sci. Eng. 2020, 7, 3279–3294. [Google Scholar] [CrossRef]
- Wangping, J.; Ke, H.; Yang, S.; Wenzhe, C.; Shengshu, W.; Shanshan, Y.; Jianwei, W.; Fuyin, K.; Penggang, T.; Jing, L.; et al. Extended SIR Prediction of the Epidemics Trend of COVID-19 in Italy and Compared with Hunan, China. Front. Med. 2020, 7, 1–7. [Google Scholar] [CrossRef]
- Fudolig, M.; Howard, R. The local stability of a modified multi-strain SIR model for emerging viral strains. PLoS ONE 2020, 15, e0243408. [Google Scholar] [CrossRef]
- Rockett, R.J.; Arnott, A.; Lam, C.; Sadsad, R.; Timms, V.; Gray, K.-A.; Eden, J.-S.; Chang, S.; Gall, M.; Draper, J.; et al. Revealing COVID-19 transmission in Australia by SARS-CoV-2 genome sequencing and agent-based modeling. Nat. Med. 2020, 26, 1398–1404. [Google Scholar] [CrossRef]
- Chang, S.L.; Harding, N.; Zachreson, C.; Cliff, O.M.; Prokopenko, M. Modelling transmission and control of the COVID-19 pandemic in Australia. Nat. Commun. 2020, 11, 5710. [Google Scholar] [CrossRef]
- Kerr, C.C.; Stuart, R.M.; Mistry, D.; Abeysuriya, R.G.; Rosenfeld, K.; Hart, G.R.; Núñez, R.C.; Cohen, J.A.; Selvaraj, P.; Hagedorn, B.; et al. Covasim: An agent-based model of COVID-19 dynamics and interventions. PLoS Comput. Biol. 2021, 17, e1009149. [Google Scholar] [CrossRef]
- Bernardes, A.T.; Ribeiro, L.C. Information, opinion and pandemic. Phys. A Stat. Mech. Its Appl. 2021, 565, 125586. [Google Scholar] [CrossRef]
- Sah, P.; Fitzpatrick, M.C.; Zimmer, C.F.; Abdollahi, E.; Juden-Kelly, L.; Moghadas, S.M.; Singer, B.H.; Galvani, A.P. Asymptomatic SARS-CoV-2 infection: A systematic review and meta-analysis. Proc. Natl. Acad. Sci. USA 2021, 118, e2109229118. [Google Scholar] [CrossRef] [PubMed]
- He, J.; Guo, Y.; Mao, R.; Zhang, J. Proportion of asymptomatic coronavirus disease 2019: A systematic review and meta-analysis. J. Med. Virol. 2021, 93, 820–830. [Google Scholar] [CrossRef] [PubMed]
- Ma, Q.; Liu, J.; Liu, Q.; Kang, L.; Liu, R.; Jing, W.; Wu, Y.; Liu, M. Global Percentage of Asymptomatic SARS-CoV-2 Infections Among the Tested Population and Individuals with Confirmed COVID-19 Diagnosis: A Systematic Review and Meta-analysis. JAMA Netw. Open 2021, 4, e2137257. [Google Scholar] [CrossRef]
- Coutinho, R.M.; Marquitti, F.M.D.; Ferreira, L.S.; Borges, M.E.; da Silva, R.L.P.; Canton, O.; Portella, T.P.; Poloni, S.; Franco, C.; Plucinski, M.M.; et al. Model-based estimation of transmissibility and reinfection of SARS-CoV-2 P.1 variant. Commun. Med. 2021, 1, 48. [Google Scholar] [CrossRef]
- Ioannidis, J.P.A. Infection fatality rate of COVID-19 inferred from seroprevalence data. Bull. World Health Organ. 2021, 99, 19F–33F. [Google Scholar] [CrossRef] [PubMed]
- Johansson, M.A.; Quandelacy, T.M.; Kada, S.; Prasad, P.V.; Steele, M.; Brooks, J.T.; Slayton, R.B.; Biggerstaff, M.; Butler, J.C. SARS-CoV-2 Transmission from People Without COVID-19 Symptoms. JAMA Netw. Open 2021, 4, e2035057. [Google Scholar] [CrossRef]
- Shah, A.S.V.; Gribben, C.; Bishop, J.; Hanlon, P.; Caldwell, D.; Wood, R.; Reid, M.; McMenamin, J.; Goldberg, D.; Stockton, D.; et al. Effect of Vaccination on Transmission of SARS-CoV-2. N. Engl. J. Med. 2021, 385, 1718–1720. [Google Scholar] [CrossRef]
- Instituto Brasileiro de Geografia e Estatística. Available online: https://www.ibge.gov.br/ (accessed on 20 November 2021).
- Mathieu, E.; Ritchie, H.; Ortiz-Ospina, E.; Roser, M.; Hasell, J.; Appel, C.; Giattino, C. A global database of COVID-19 vaccinations. Nat. Hum. Behav. 2021, 5, 1–7. [Google Scholar] [CrossRef]
- May, R.M.; Anderson, R.M. Epidemiology and genetics in the coevolution of parasites and hosts. Proc. R. Soc. Lond. Ser. B 1983, 219, 281–313. [Google Scholar] [CrossRef]
- Berngruber, T.W.; Froissart, R.; Choisy, M.; Gandon, S. Evolution of Virulence in Emerging Epidemics. PLoS Pathog. 2013, 9, e1003209. [Google Scholar] [CrossRef] [Green Version]
- Causey, K.; Fullman, N.; Sorensen, R.J.; Galles, N.C.; Zheng, P.; Aravkin, A.; Danovaro-Holliday, M.C.; Martinez-Piedra, R.; Sodha, S.V.; Velandia-González, M.P.; et al. Estimating global and regional disruptions to routine childhood vaccine coverage during the COVID-19 pandemic in 2020: A modelling study. Lancet 2021, 398, 522–534. [Google Scholar] [CrossRef]
- Tang, L.; Zhou, Y.; Wang, L.; Purkayastha, S.; Zhang, L.; He, J.; Wang, F.; Song, P.X.K. A review of multi-compartment infectious disease models. Int. Stat. Rev. 2020, 88, 462–513. [Google Scholar] [CrossRef] [PubMed]
- Moore, S.; Hill, E.M.; Tildesley, M.J.; Dyson, L.; Keeling, M.J. Vaccination and non-pharmaceutical interventions for COVID-19: A mathematical modelling study. Lancet Infect. Dis. 2021, 21, 793–802. [Google Scholar] [CrossRef]
- Foy, B.H.; Wahl, B.; Mehta, K.; Shet, A.; Menon, G.I.; Britto, C. Comparing COVID-19 vaccine allocation strategies in India: A mathematical modelling study. Int. J. Infect. Dis. 2021, 103, 431–438. [Google Scholar] [CrossRef]
- Gharakhanlou, N.M.; Hooshangi, N. Spatio-temporal simulation of the novel coronavirus (COVID-19) outbreak using the agent-based modeling approach (case study: Urmia, Iran). Inform. Med. Unlocked 2020, 20, 100403. [Google Scholar] [CrossRef] [PubMed]
- Ritchie, H.; Mathieu, E.; Rodés-Guirao, L.; Appel, C.; Giattino, C.; Ortiz-Ospina, E.; Hasell, J.; Macdonald, B.; Beltekian, D.; Roser, M. Coronavirus Pandemic (COVID-19). Available online: https://ourworldindata.org/coronavirus (accessed on 10 January 2022).
- Bernardeau-Serra, L.; Nguyen-Huynh, A.; Sponagel, L.; Sernizon Guimarães, N.; Teixeira de Aguiar, R.A.; Soriano Marcolino, M. The COVID-19 Vaccination Strategy in Brazil—A Case Study. Epidemiologia 2021, 2, 338–359. [Google Scholar] [CrossRef]
- Cohn, A.C.; Mahon, B.E.; Walensky, R.P. One Year of COVID-19 Vaccines: A Shot of Hope, a Dose of Reality. JAMA Netw. 2022, 327, 119–120. [Google Scholar] [CrossRef]
- Garett, R.; Young, S.D. Online misinformation and vaccine hesitancy. Transl. Behav. Med. 2021, 11, 2194–2199. [Google Scholar] [CrossRef]
- Shih, S.F.; Wagner, A.L.; Masters, N.B.; Prosser, L.A.; Lu, Y.; Zikmund-Fisher, B.J. Vaccine Hesitancy and Rejection of a Vaccine for the Novel Coronavirus in the United States. Front. Immunol. 2021, 12, 558270. [Google Scholar] [CrossRef]
- Beleche, T.; Ruhter, J.; Kolbe, A.; Marus, J.; Bush, L.; Sommers, B. COVID-19 Vaccine Hesitancy: Demographic Factors, Geographic Patterns, and Changes over Time; Office of the Assistant Secretary for Planning and Evaluation: Washington, DC, USA, 2021. [Google Scholar]
- UN News. Available online: https://news.un.org/en/story/2021/09/1100192 (accessed on 31 January 2022).
- Troiano, G.; Nardi, A. Vaccine hesitancy in the era of COVID-19. Public Health 2021, 194, 245–251. [Google Scholar] [CrossRef]
- Omer, S.B.; Benjamin, R.M.; Brewer, N.T.; Buttenheim, A.M.; Callaghan, T.; Caplan, A.; Carpiano, R.M.; Clinton, C.; DiResta, R.; Elharake, J.A.; et al. Promoting COVID-19 vaccine acceptance: Recommendations from the Lancet Commission on Vaccine Refusal, Acceptance, and Demand in the USA. Lancet 2021, 398, 2186–2192. [Google Scholar] [CrossRef]
- Bar-On, Y.M.; Goldberg, Y.; Mandel, M.; Bodenheimer, O.; Freedman, L.; Kalkstein, N.; Mizrahi, B.; Alroy-Preis, S.; Ash, N.; Milo, R.; et al. Protection of BNT162b2 vaccine booster against Covid-19 in Israel. N. Engl. J. Med. 2021, 385, 1393–1400. [Google Scholar] [CrossRef]
- Da Fonseca, E.M.; Shadlen, K.C.; Bastos, F.I. The politics of COVID-19 vaccination in middle-income countries: Lessons from Brazil. Soc. Sci. Med. 2021, 281, 114093. [Google Scholar] [CrossRef]
- Kupek, E. Low COVID-19 vaccination coverage and high COVID-19 mortality rates in Brazilian elderly. Rev. Bras. Epidemiol. 2021, 24, e210041. [Google Scholar] [CrossRef] [PubMed]
- Chandan, J.S.; Taylor, J.; Bradbury-Jones, C.; Nirantharakumar, K.; Kane, E.; Bandyopadhyay, S. COVID-19: A public health approach to manage domestic violence is needed. Lancet Public Health 2020, 5, e309. [Google Scholar] [CrossRef]
- Dunn, C.G.; Kenney, E.; Fleischhacker, S.E.; Bleich, S.N. Feeding low-income children during the Covid-19 pandemic. N. Engl. J. Med. 2020, 382, e40. [Google Scholar] [CrossRef]
- Brewer, M.; Gardiner, L. The initial impact of COVID-19 and policy responses on household incomes. Oxf. Rev. Econ. Policy 2020, 36, S187–S199. [Google Scholar] [CrossRef]
- Lopez Bernal, J.; Andrews, N.; Gower, C.; Gallagher, E.; Simmons, R.; Thelwall, S.; Stowe, J.; Tessier, E.; Groves, N.; Dabrera, G.; et al. Effectiveness of Covid-19 vaccines against the B.1.617.2 (Delta) variant. N. Engl. J. Med. 2021, 385, 585–594. [Google Scholar] [CrossRef]
- Katz, I.T.; Weintraub, R.; Bekker, L.G.; Brandt, A.M. From Vaccine Nationalism to Vaccine Equity—Finding a Path Forward. N. Engl. J. Med. 2021, 384, 1281–1283. [Google Scholar] [CrossRef]
- Gómez, C.E.; Perdiguero, B.; Esteban, M. Emerging SARS-CoV-2 variants and impact in global vaccination programs against SARS-CoV-2/COVID-19. Vaccines 2021, 9, 243. [Google Scholar] [CrossRef]
- McIntyre, P.B.; Aggarwal, R.; Jani, I.; Jawad, J.; Kochhar, S.; MacDonald, N.; Madhi, S.A.; Mohsni, E.; Mulholland, K.; Neuzil, K.N.; et al. COVID-19 vaccine strategies must focus on severe disease and global equity. Lancet 2022, 399, 406. [Google Scholar] [CrossRef]
- Crimmins, E.M. Age-related vulnerability to coronavirus disease 2019 (COVID-19): Biological, contextual, and policy-related factors. Policy Aging Rep. 2020, 30, 142–146. [Google Scholar] [CrossRef] [PubMed]
- Matrajt, L.; Eaton, J.; Leung, T.; Brown, E.R. Vaccine optimization for COVID-19: Who to vaccinate first? Sci. Adv. 2021, 7, eabf1374. [Google Scholar] [CrossRef]
- Sewell, H.F.; Agius, R.M.; Kendrick, D.; Stewart, M. Covid-19 vaccines: Delivering protective immunity. BMJ 2020, 371, m4838. [Google Scholar] [CrossRef] [PubMed]
- Jarjour, N.N.; Masopust, D.; Jameson, S.C. T cell memory: Understanding COVID-19. Immunity 2021, 54, 14–18. [Google Scholar] [CrossRef] [PubMed]
- Thompson, M.G.; Stenehjem, E.; Grannis, S.; Ball, S.W.; Naleway, A.L.; Ong, T.C.; DeSilva, M.B.; Natarajan, K.; Bozio, C.H.; Lewis, N.; et al. Effectiveness of Covid-19 vaccines in ambulatory and inpatient care settings. N. Engl. J. Med. 2021, 385, 1355–1371. [Google Scholar] [CrossRef]
- Sadarangani, M.; Raya, B.A.; Conway, J.M.; Iyaniwura, S.A.; Falcao, R.C.; Colijn, C.; Coombs, D.; Gantt, S. Importance of COVID-19 vaccine efficacy in older age groups. Vaccine 2021, 39, 2020–2023. [Google Scholar] [CrossRef]
- Loembé, M.M.; Nkengasong, J.N. COVID-19 vaccine access in Africa: Global distribution, vaccine platforms, and challenges ahead. Immunity 2021, 54, 1353–1362. [Google Scholar] [CrossRef]
- Dolgin, E. Omicron thwarts some of the world’s most-used COVID vaccines. Nature 2022, 601, 311. [Google Scholar] [CrossRef]
- Carreño, J.M.; Alshammary, H.; Tcheou, J.; Singh, G.; Raskin, A.; Kawabata, H.; Sominsky, L.; Clark, J.; Adelsberg, D.C.; Bielak, D.; et al. Activity of convalescent and vaccine serum against SARS-CoV-2 Omicron. Nature 2021, 1–8. [Google Scholar] [CrossRef]
- Anderson, R.M.; May, R.M. Population biology of infectious diseases: Part I. Nature 1979, 280, 361–367. [Google Scholar] [CrossRef] [PubMed]
- Ingraham, N.E.; Ingbar, D.H. The omicron variant of SARS-CoV-2: Understanding the known and living with unknowns. Clin. Transl. Med. 2021, 11, e685. [Google Scholar] [CrossRef] [PubMed]


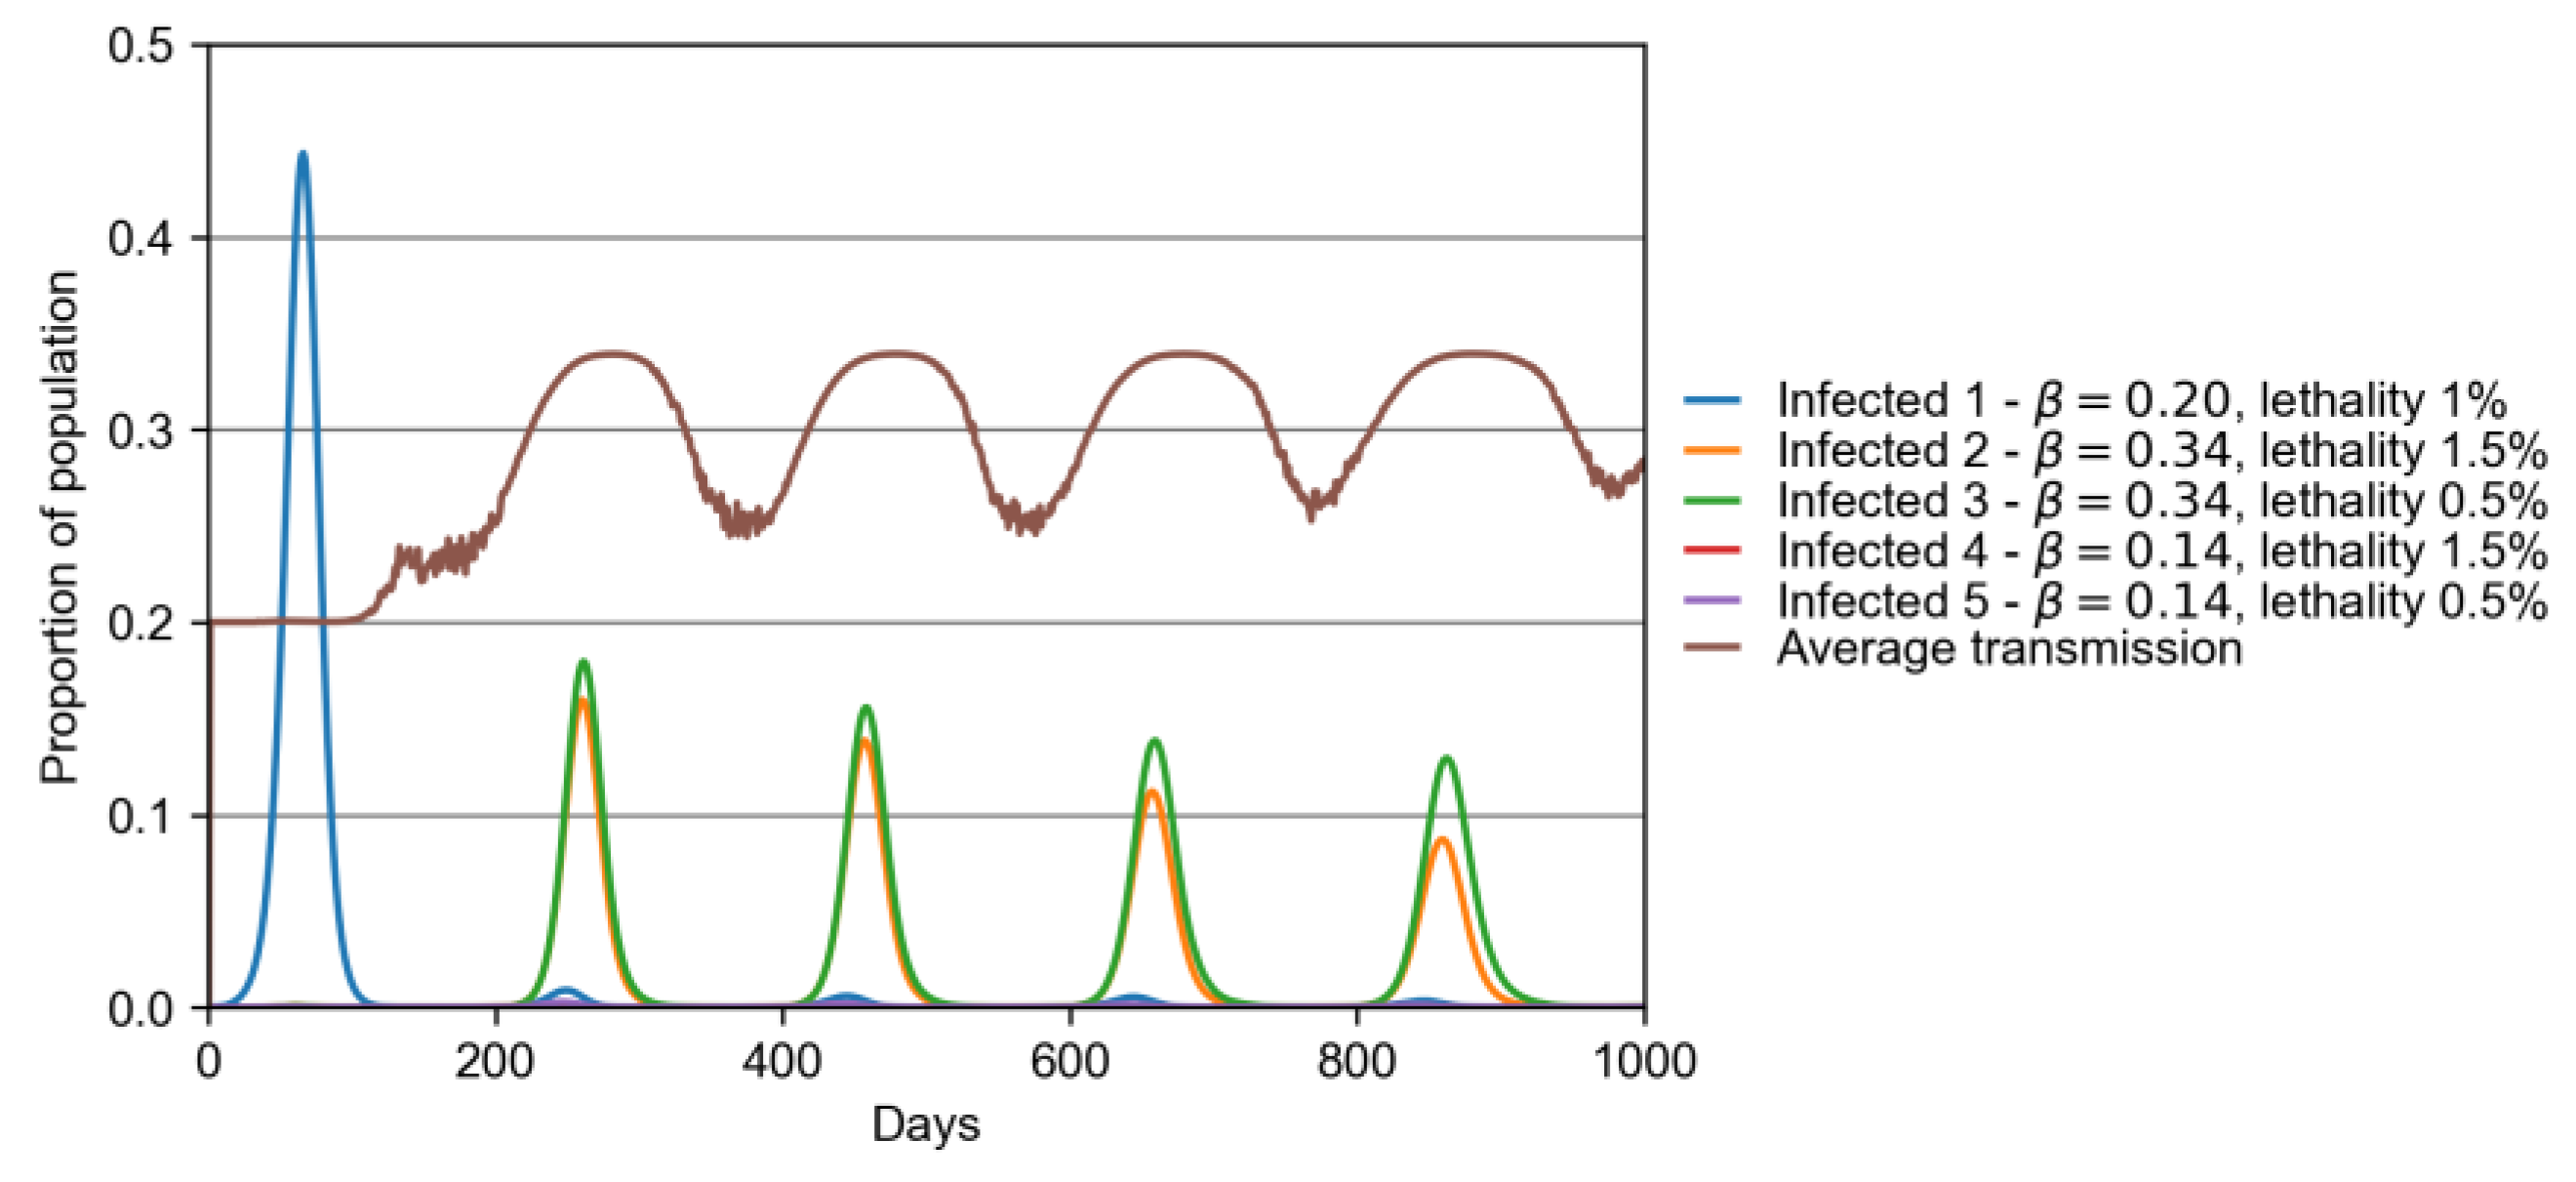
| Variant | β | Lethality (%) |
|---|---|---|
| 1 (original) | 0.2 | 1.0 |
| 2 | 1.7 × 0.2 | 1.5 |
| 3 | 1.7 × 0.2 | 0.5 |
| 4 | 0.7 × 0.2 | 1.5 |
| 5 | 0.7 × 0.2 | 0.5 |
Publisher’s Note: MDPI stays neutral with regard to jurisdictional claims in published maps and institutional affiliations. |
© 2022 by the authors. Licensee MDPI, Basel, Switzerland. This article is an open access article distributed under the terms and conditions of the Creative Commons Attribution (CC BY) license (https://creativecommons.org/licenses/by/4.0/).
Share and Cite
Castro e Silva, A.; Bernardes, A.T.; Barbosa, E.A.G.; Chagas, I.A.S.d.; Dáttilo, W.; Reis, A.B.; Ribeiro, S.P. Successive Pandemic Waves with Different Virulent Strains and the Effects of Vaccination for SARS-CoV-2. Vaccines 2022, 10, 343. https://doi.org/10.3390/vaccines10030343
Castro e Silva A, Bernardes AT, Barbosa EAG, Chagas IASd, Dáttilo W, Reis AB, Ribeiro SP. Successive Pandemic Waves with Different Virulent Strains and the Effects of Vaccination for SARS-CoV-2. Vaccines. 2022; 10(3):343. https://doi.org/10.3390/vaccines10030343
Chicago/Turabian StyleCastro e Silva, Alcides, Américo Tristão Bernardes, Eduardo Augusto Gonçalves Barbosa, Igor Aparecido Santana das Chagas, Wesley Dáttilo, Alexandre Barbosa Reis, and Sérvio Pontes Ribeiro. 2022. "Successive Pandemic Waves with Different Virulent Strains and the Effects of Vaccination for SARS-CoV-2" Vaccines 10, no. 3: 343. https://doi.org/10.3390/vaccines10030343