
A Two-Phase Stochastic Dynamic Model for COVID-19 Mid-Term Policy Recommendations in Greece: A Pathway towards Mass Vaccination


Abstract
:1. Introduction
2. Background Literature
3. The Model
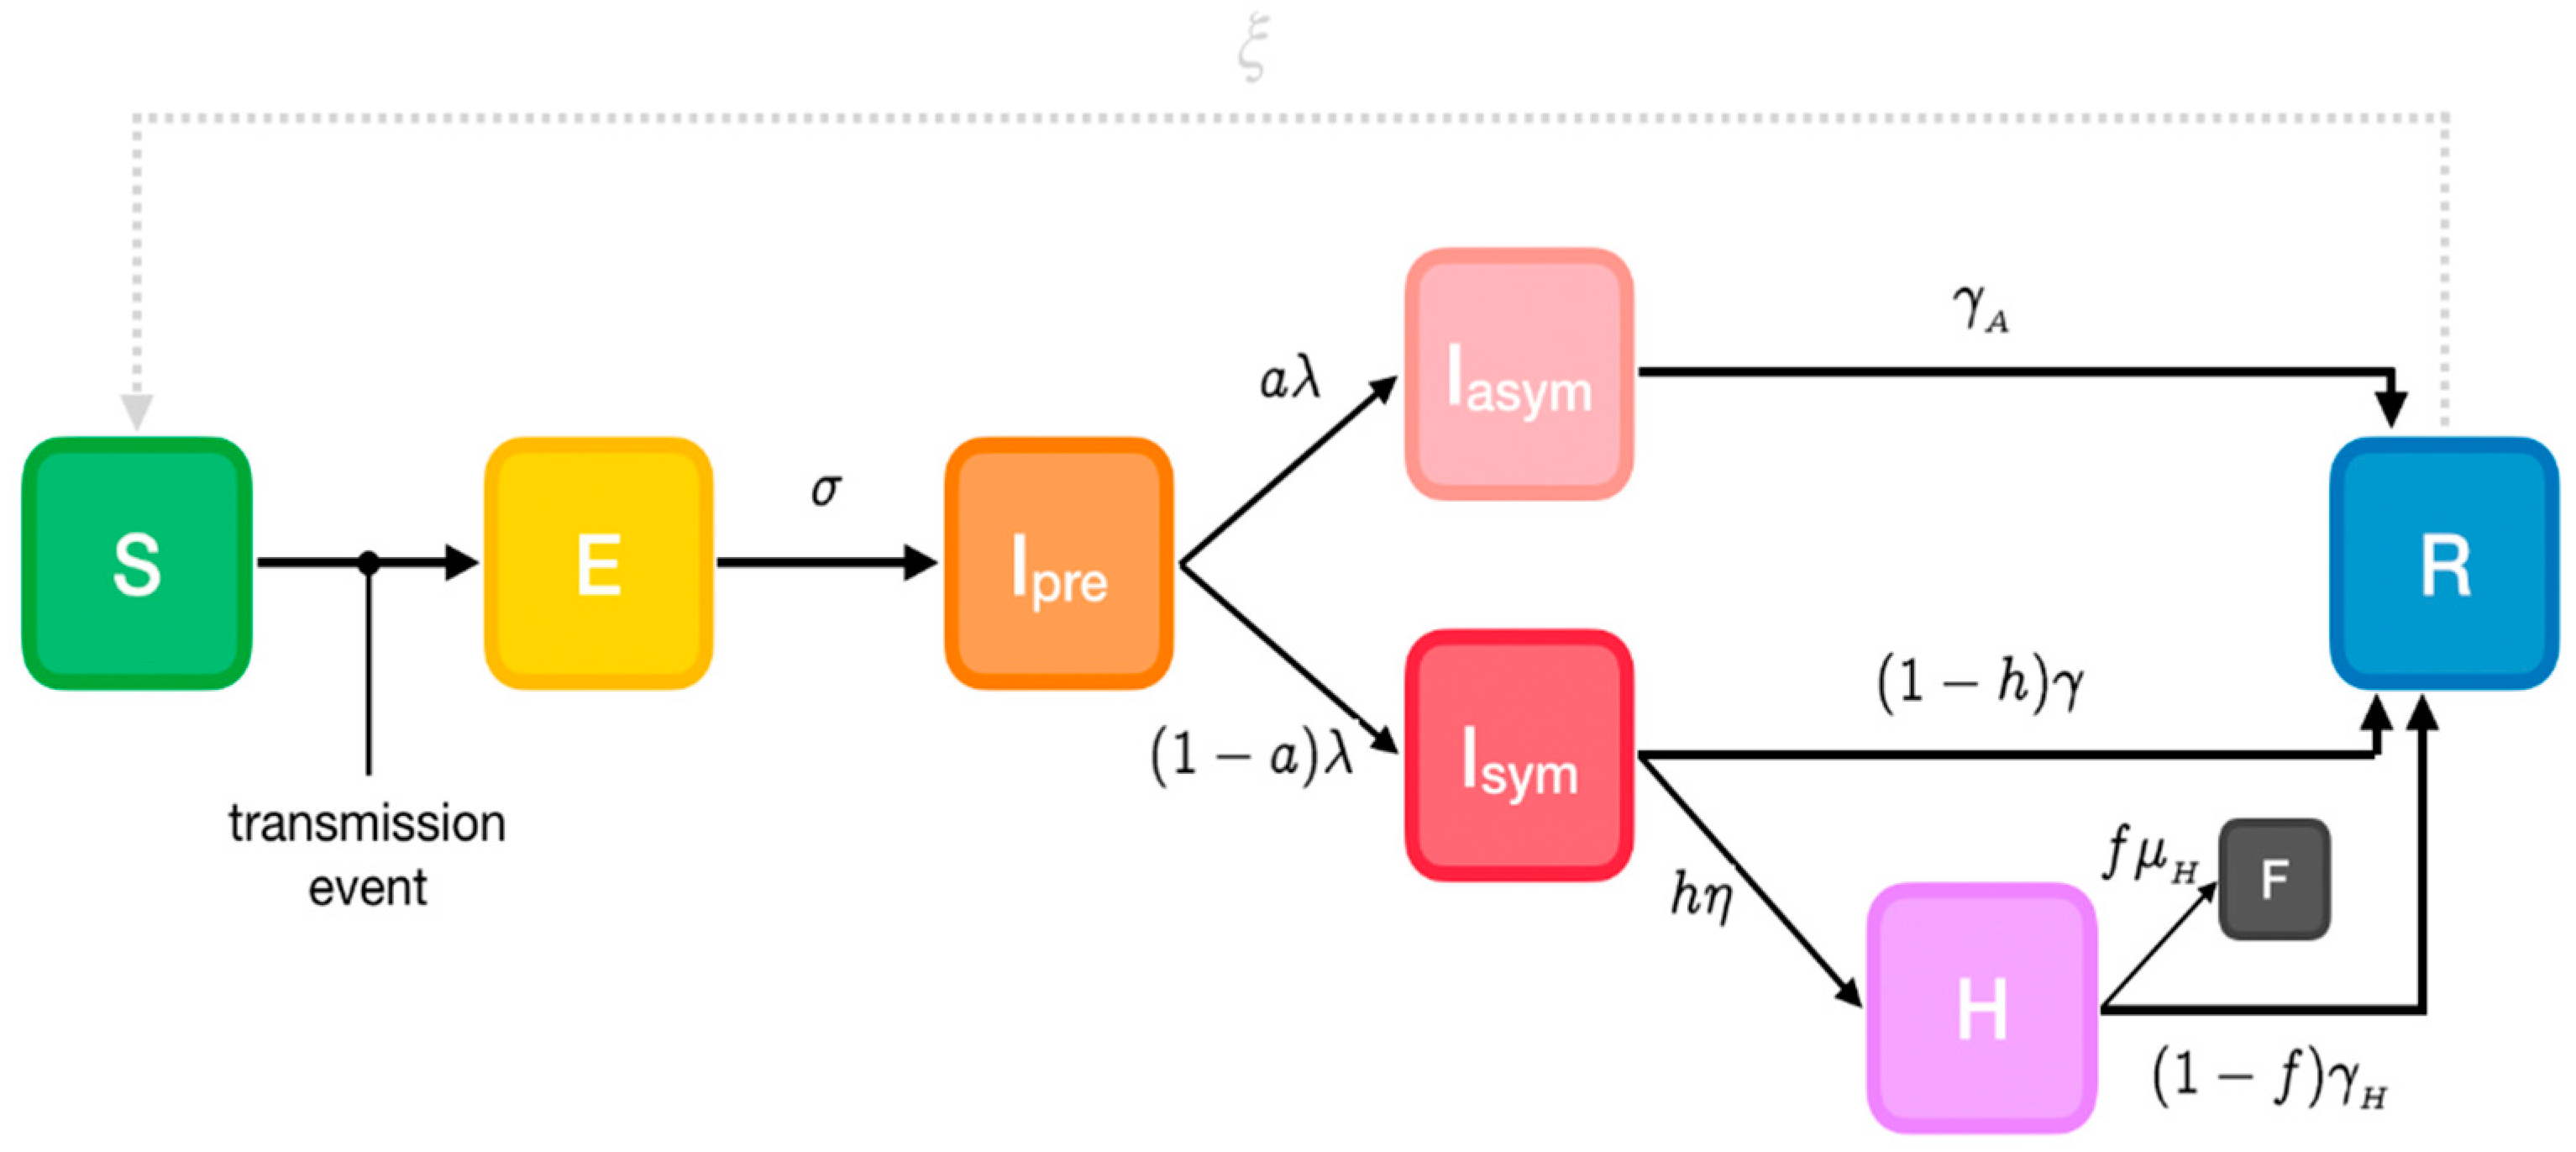
3.1. Phase-1 Model
Parameters
- α: Susceptibility
- β: Transmissibility of symptomatic individuals
- βA: Transmissibility of pre- and asymptomatic individuals
- σ: Rate of progression to infectiousness (1/latent period)
- λ: Rate of progression to (a)symptomatic state (1/pre-symptomatic period)
- a: Probability of an infected individual remaining asymptomatic
- h: Probability of a symptomatic individual being hospitalized
- η: Rate of progression to hospitalized state (1/onset-to-admission period)
- γ: Rate of recovery for non-hospitalized symptomatic individuals (1/symptomatic individuals infectious period)
- γA: Rate of recovery for asymptomatic individuals (1/asymptomatic individuals infectious period)
- γH: Rate of recovery for hospitalized symptomatic individuals (1/hospitalized individuals infectious period)
- f: Probability of death for hospitalized individuals (case fatality rate)
- μH: Rate of death for hospitalized individuals (1/hospital admission to death period)
- ξ: Rate of re-susceptibility (1/temporary immunity period; equal to 0 if a permanent immunity period is assumed)
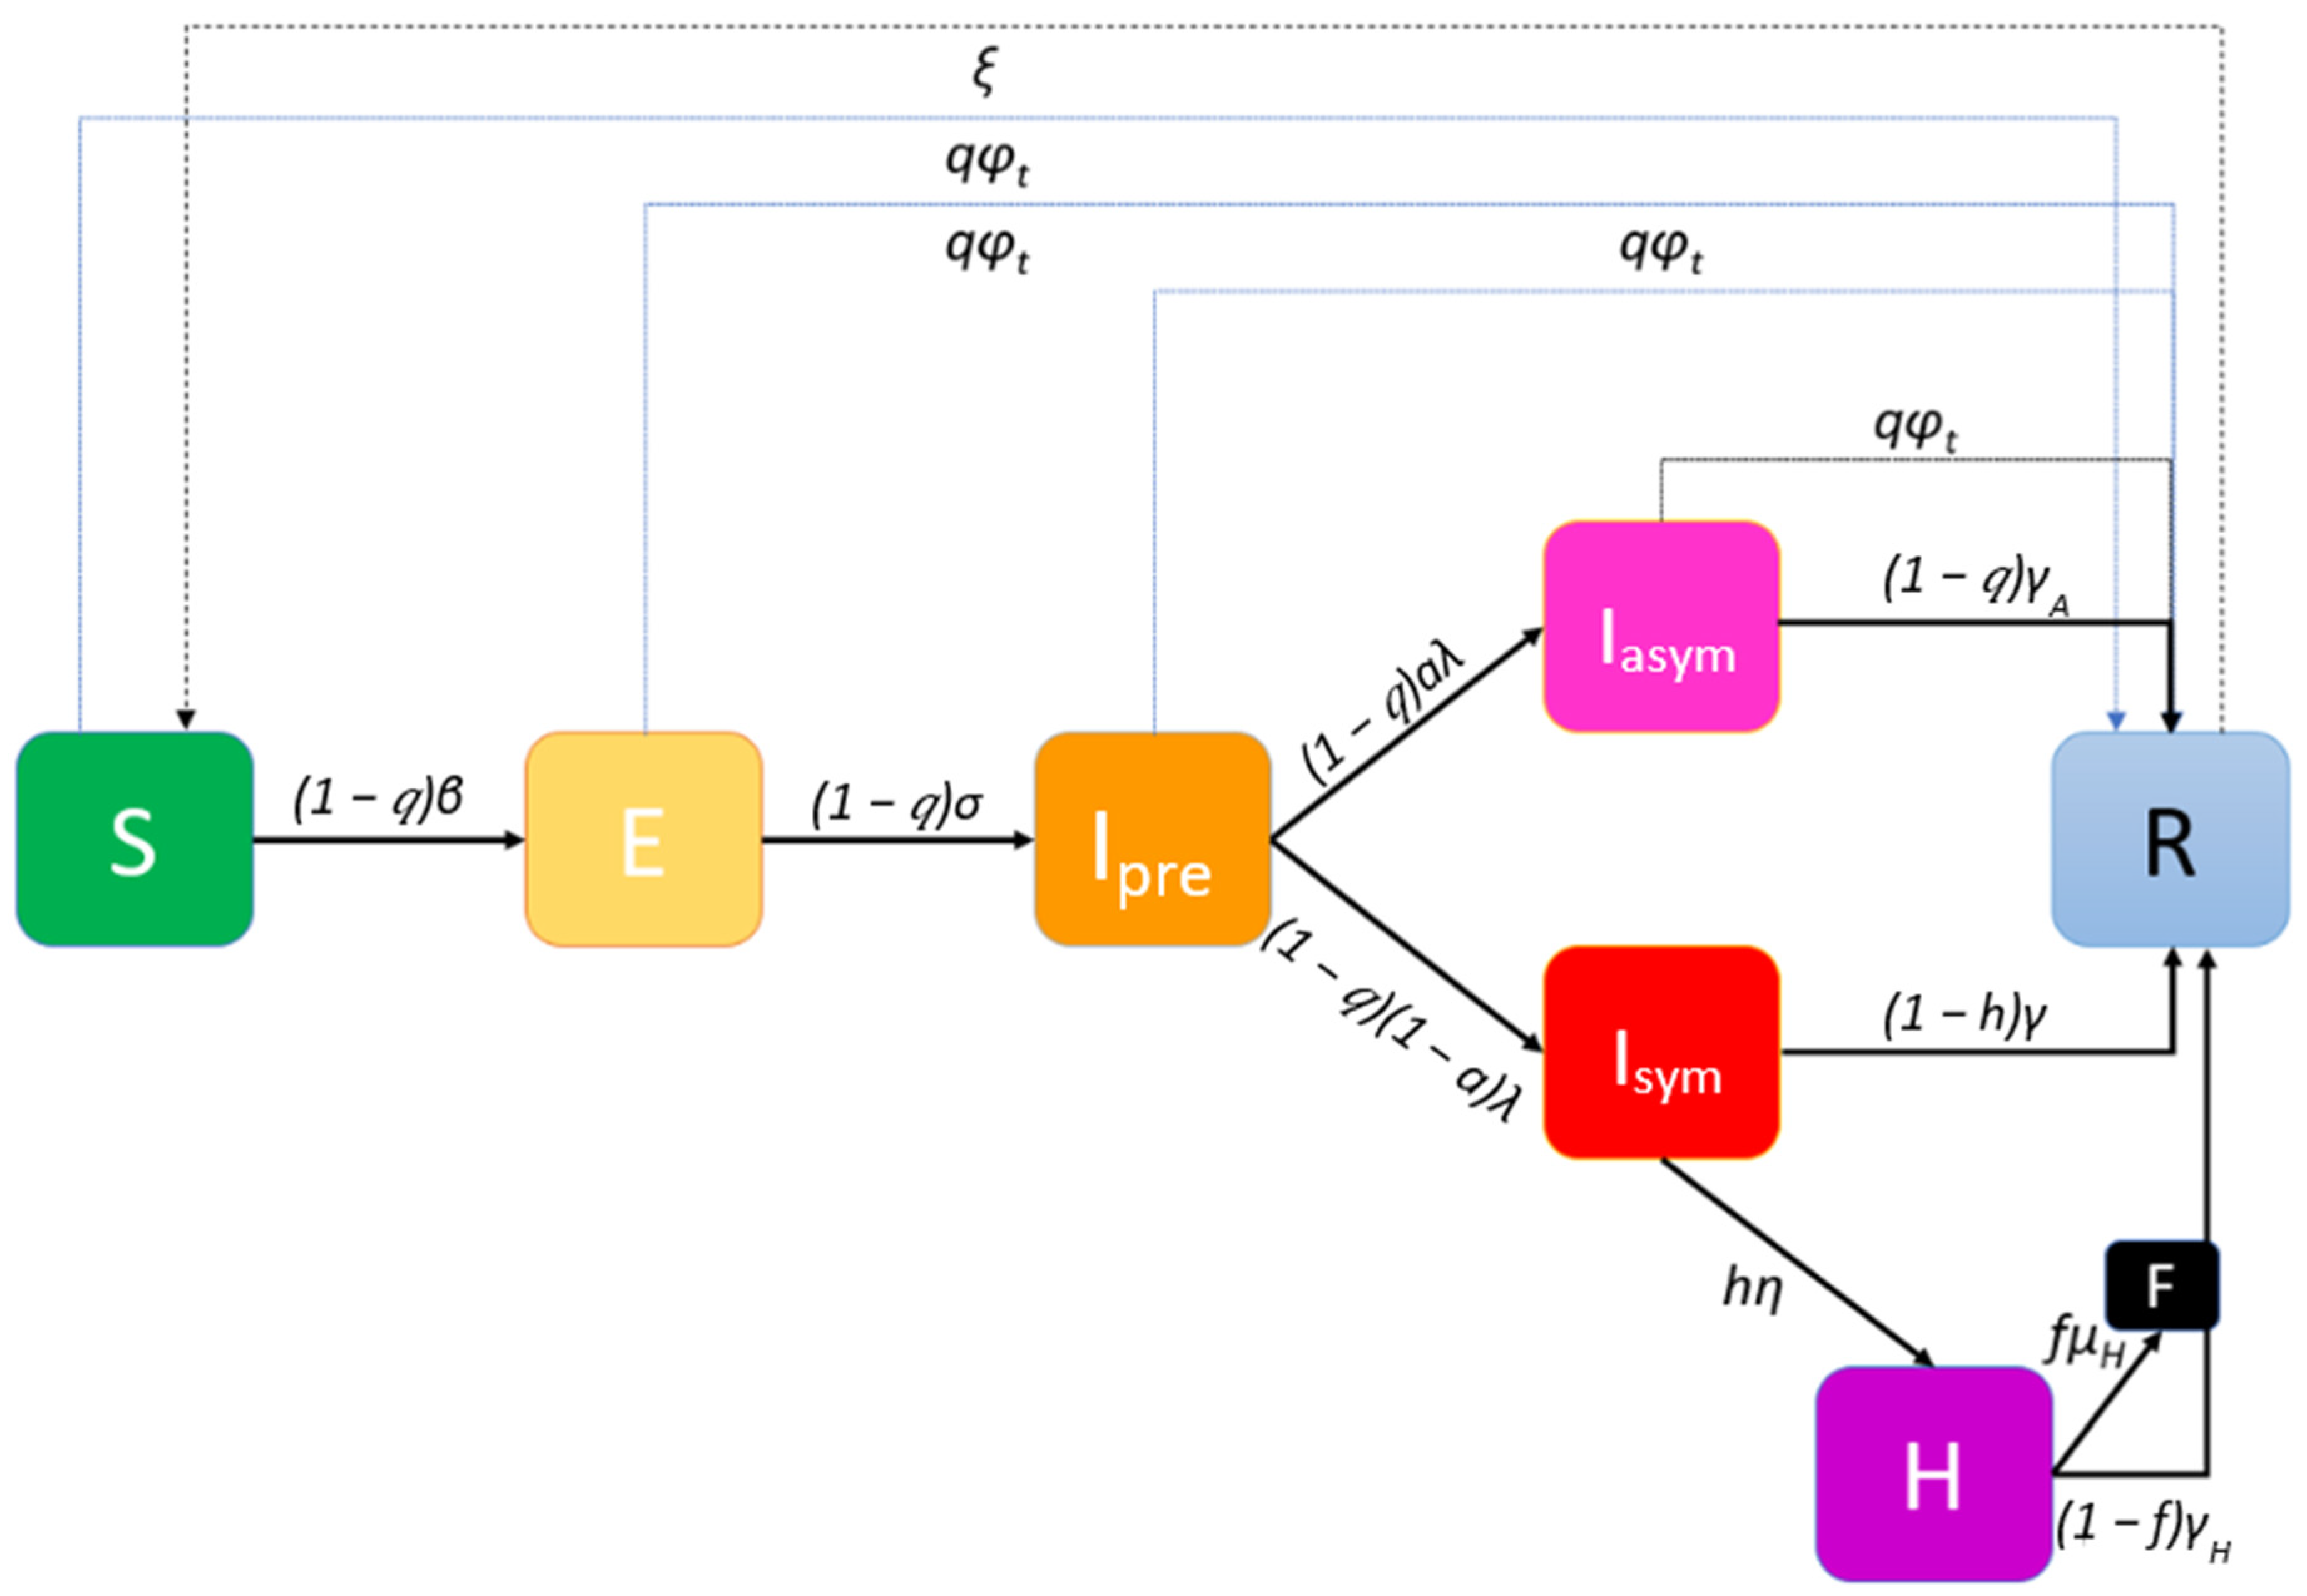
3.2. Phase-2 Model
3.3. Stochastic Network Model Implementation
3.4. Non-Pharmaceutical Interventions (NPIs)
3.5. Model Equations
3.6. Assumptions
- Regarding global interactions, every node in the population is equally likely to come into contact with every other node, and the population can be considered well-mixed. Thus, the contribution of the symptomatic subpopulation to an individual’s propensity for exposure is expressed through the mean transmissibility of the symptomatic individuals and the prevalence of symptomatic individuals in the overall population Isym/N. The contribution of pre- and asymptomatic infectious individuals involves the mean transmissibility of asymptomatic individuals and their prevalence (Ipre + Iasym)/N (https://github.com/ryansmcgee/seirsplus; accessed on 1 November 2020).
- Regarding local transmission, transmissibility is considered on a pairwise basis, i.e., every directed edge of the contact network representing transmission from infected node j to susceptible node i is assigned a transmissibility βji. The transmissibility of such an interaction is assumed in the proposed model to be equal to the transmissibility of the infected individual (i.e., βji = βj). The transition rate for any susceptible individual to become exposed due to local transmission is the product of that individual’s susceptibility and the total transmissibility of his/her infectious close contacts, divided by the size of his/her local network. The factor δji appears in the calculation of the propensity for exposure due to local transmission and is used to weight the transmissibility of interactions according to the connectivity of the interacting individuals, for example yielding a higher importance to a transmission between highly connected nodes-“superspreaders” (individuals who have more contacts also have more intense interactions). In this paper δji is defined as:where Dj and Di are the degrees of nodes j and i, respectively, and is the mean degree of the network. Similar to the global transmission, the contributions of symptomatic and pre-symptomatic infectious contacts to the propensity for exposure are calculated separately (https://github.com/ryansmcgee/seirsplus; accessed on 1 November 2020).
- The rate of re-susceptibility is assumed to be negligible (ξ is assumed to be equal to zero).
- The percentage q of the individuals that will be willing to participate in the mass vaccination and at the same time the vaccine will be effective on them is considered constant for all states.
- The number of vaccine-related deaths is negligible. This assumption is justified if individuals contraindicated for vaccination are totally excluded from the vaccination queue by a medical pre-screening.
4. Simulations’ Results
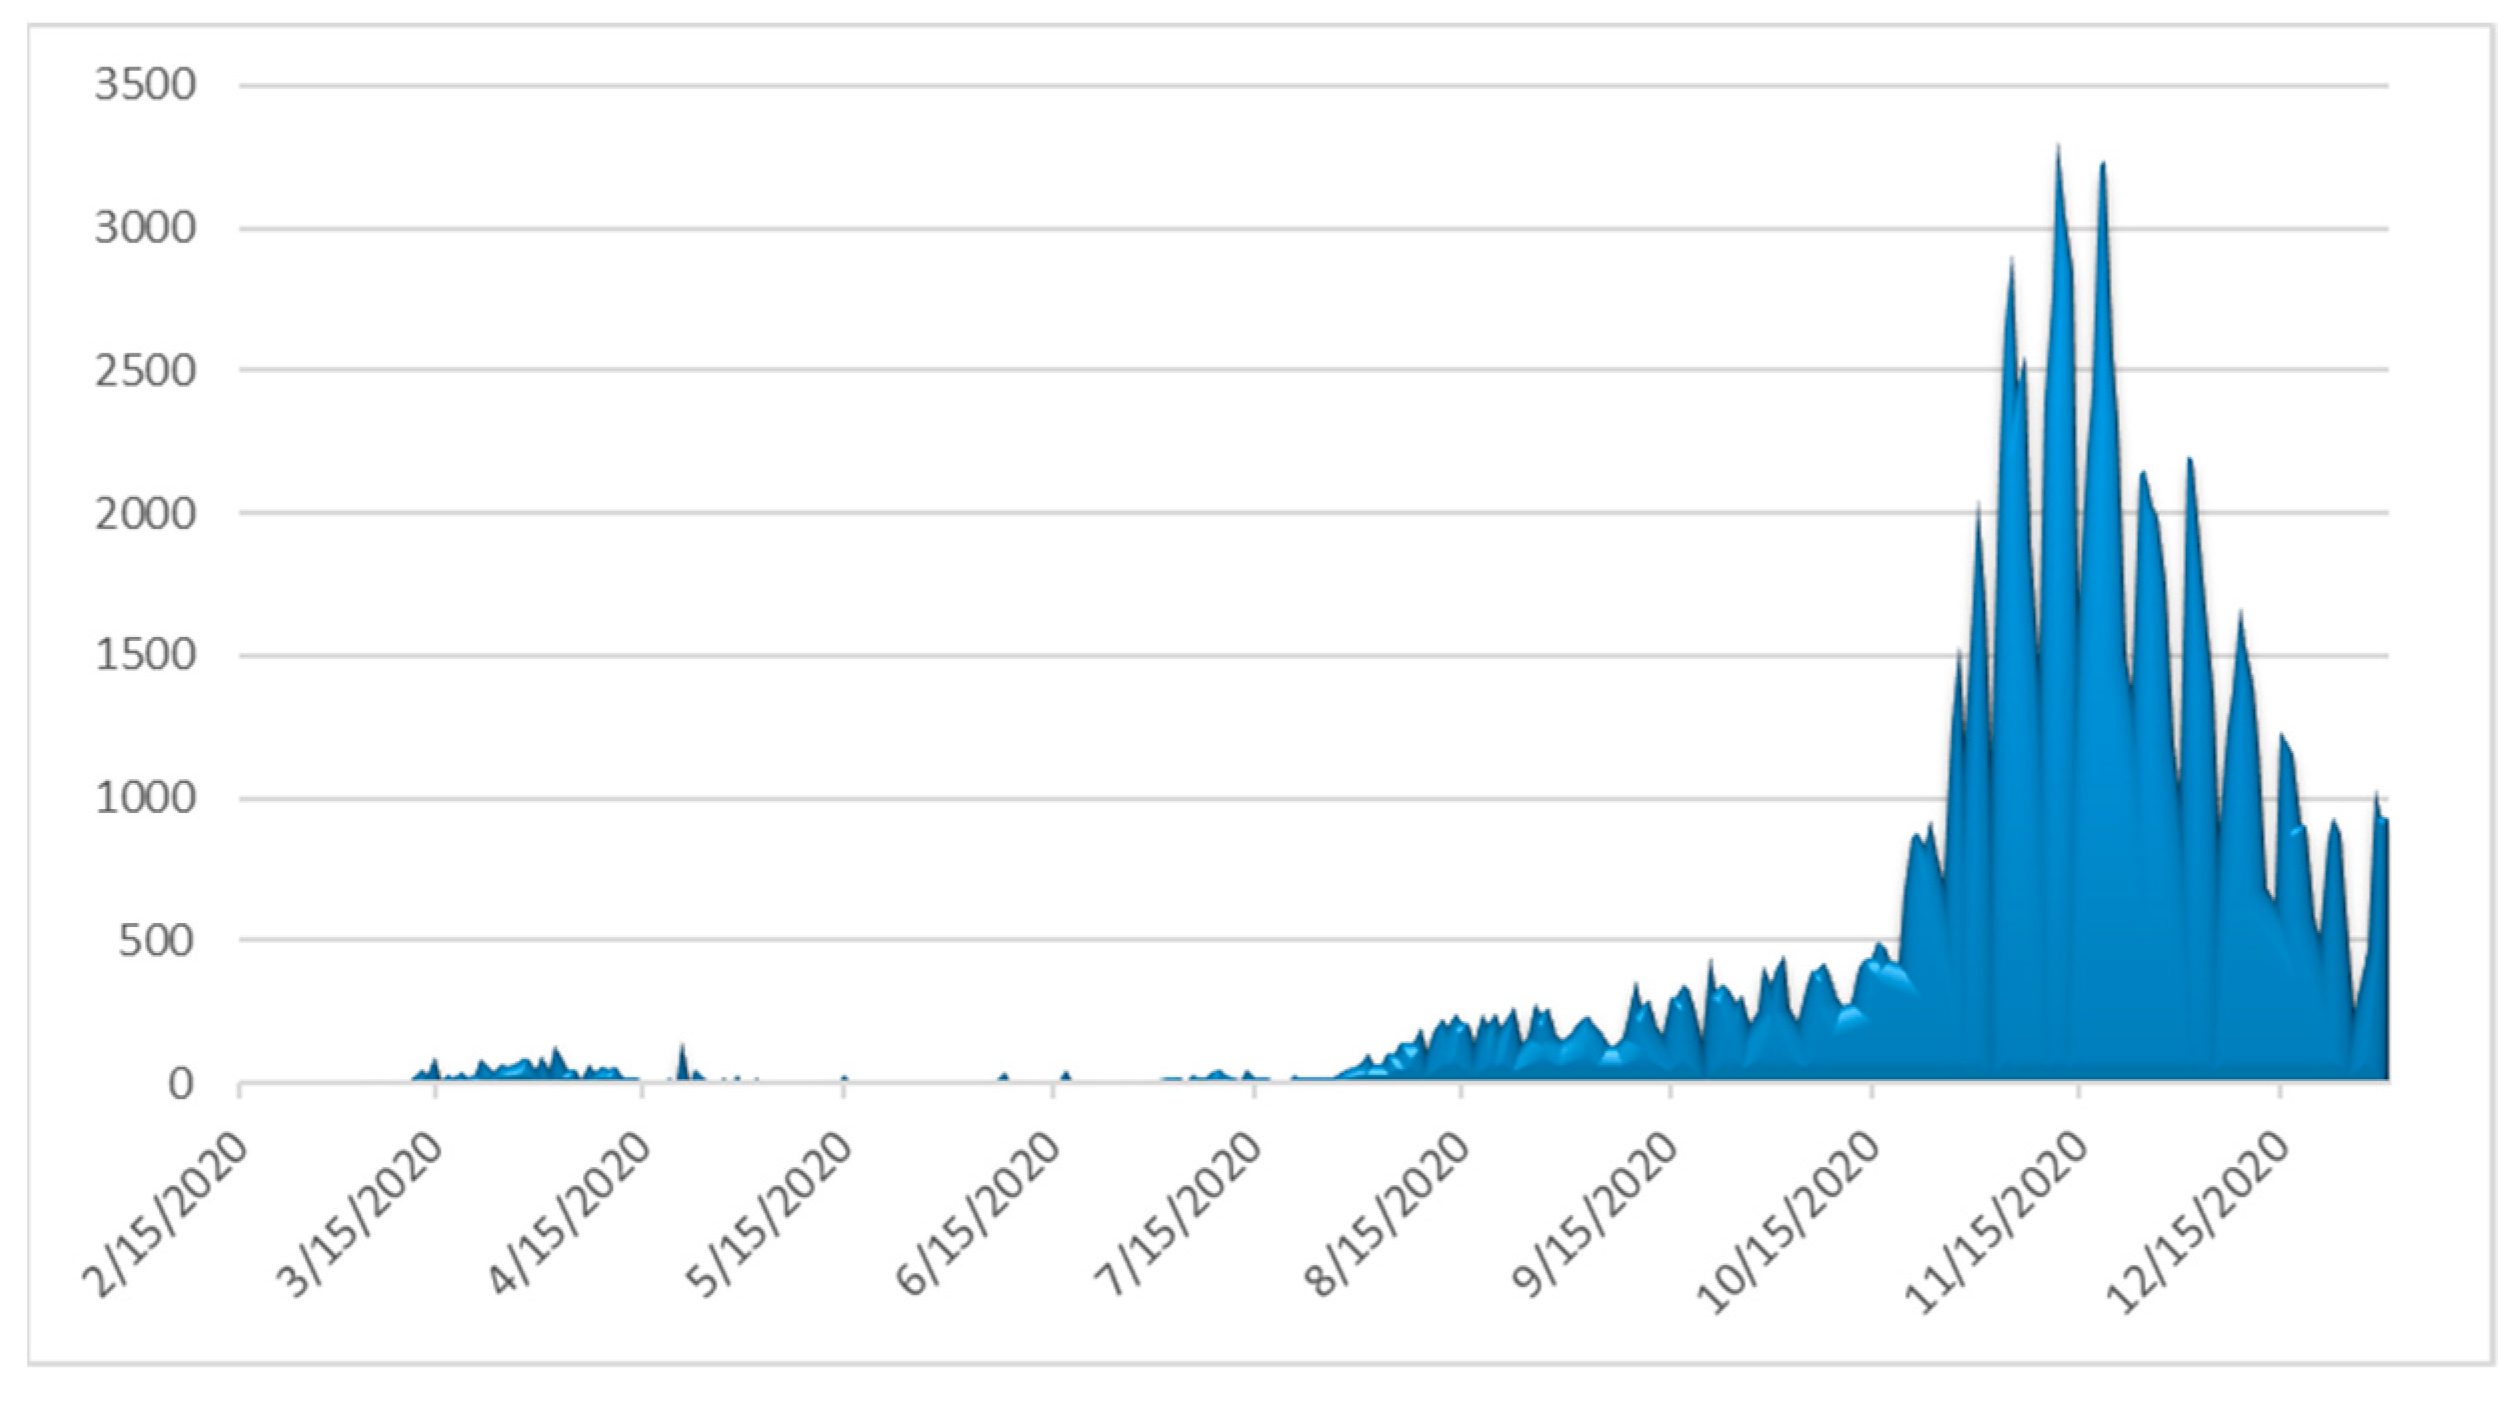
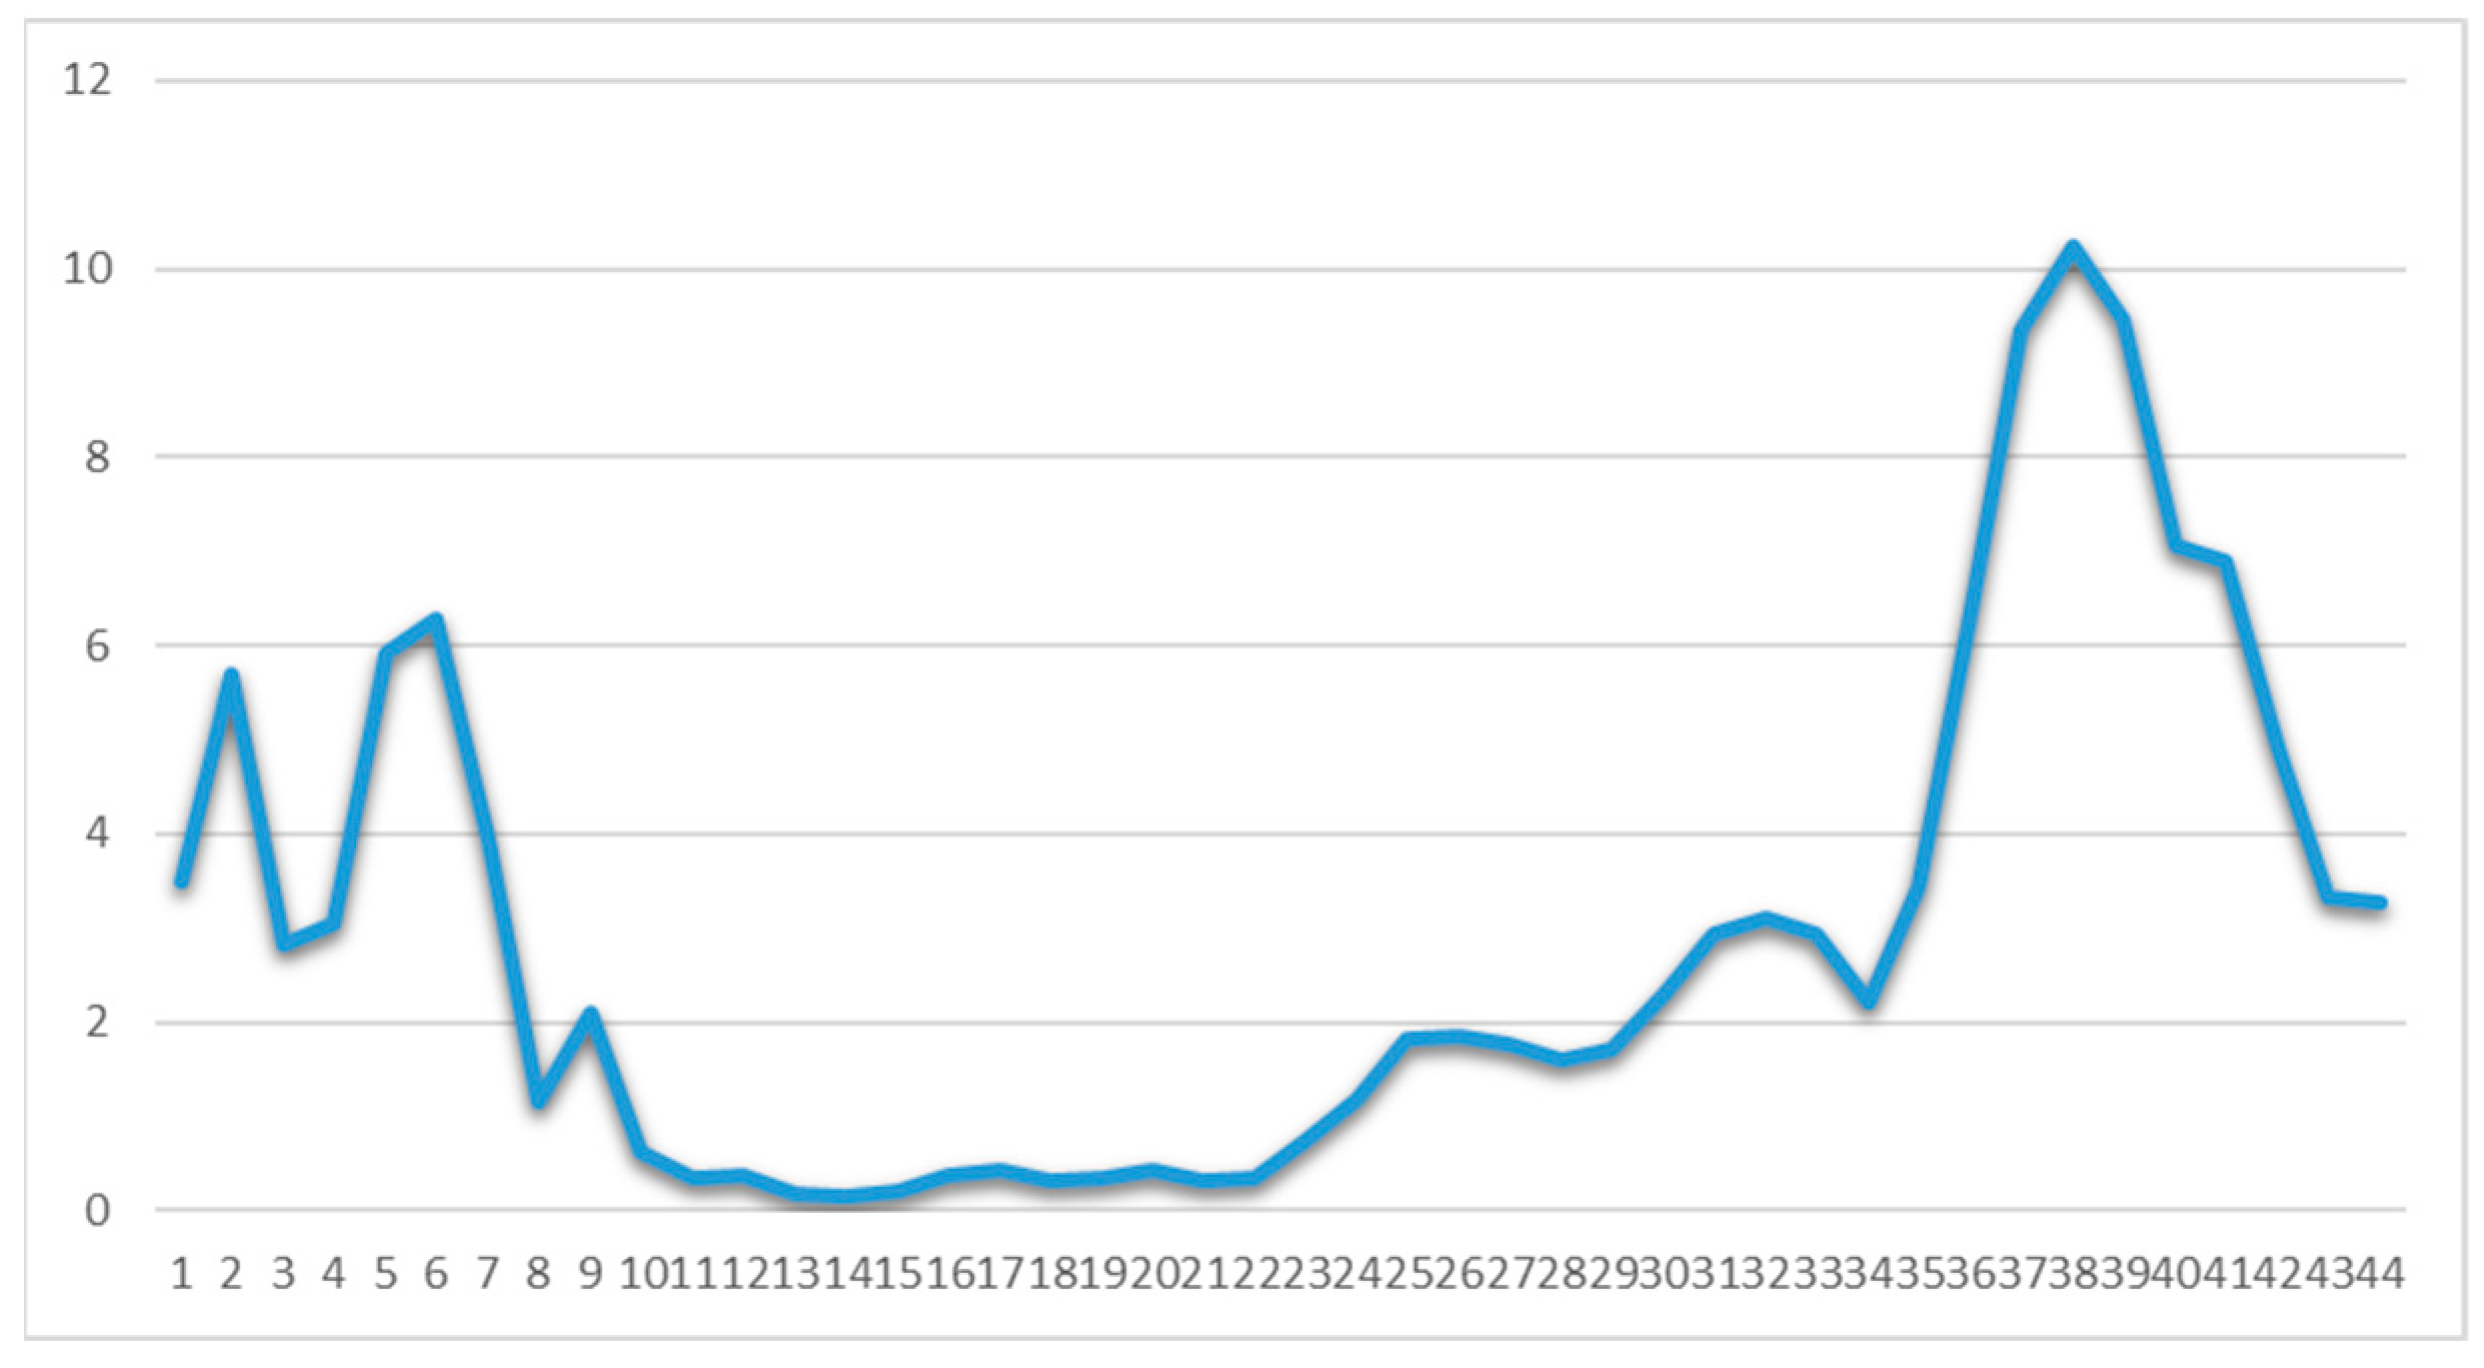
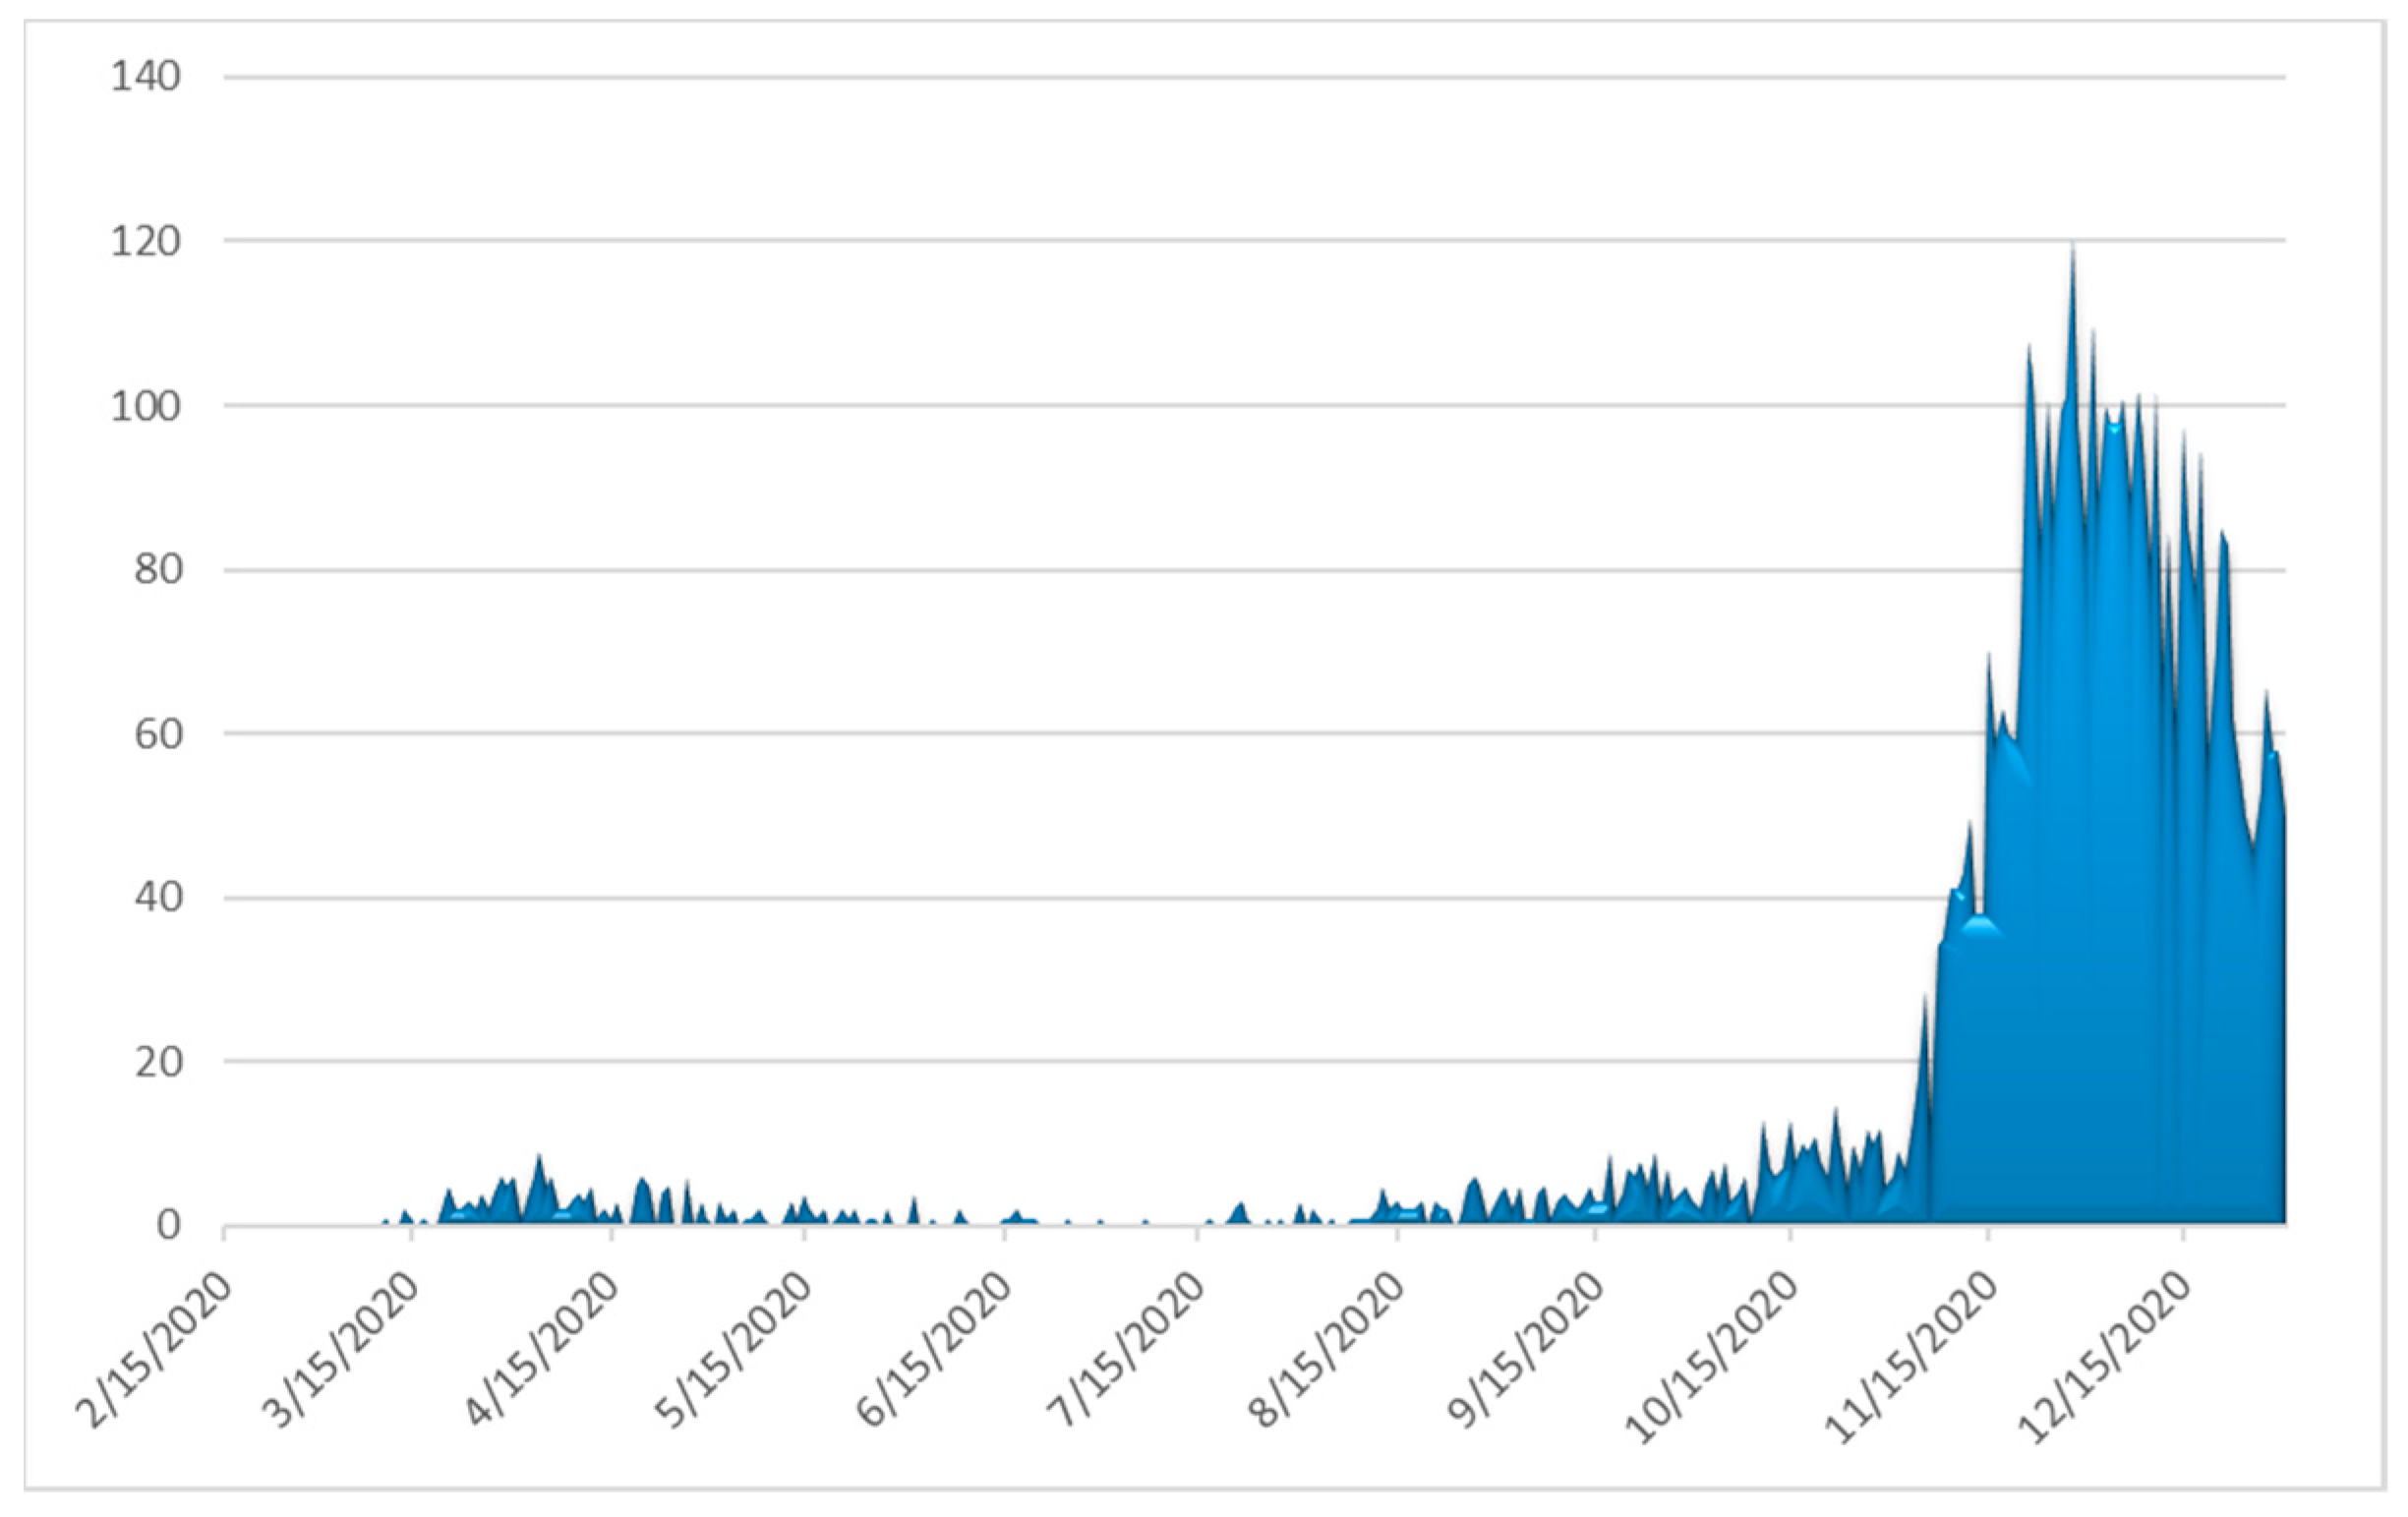
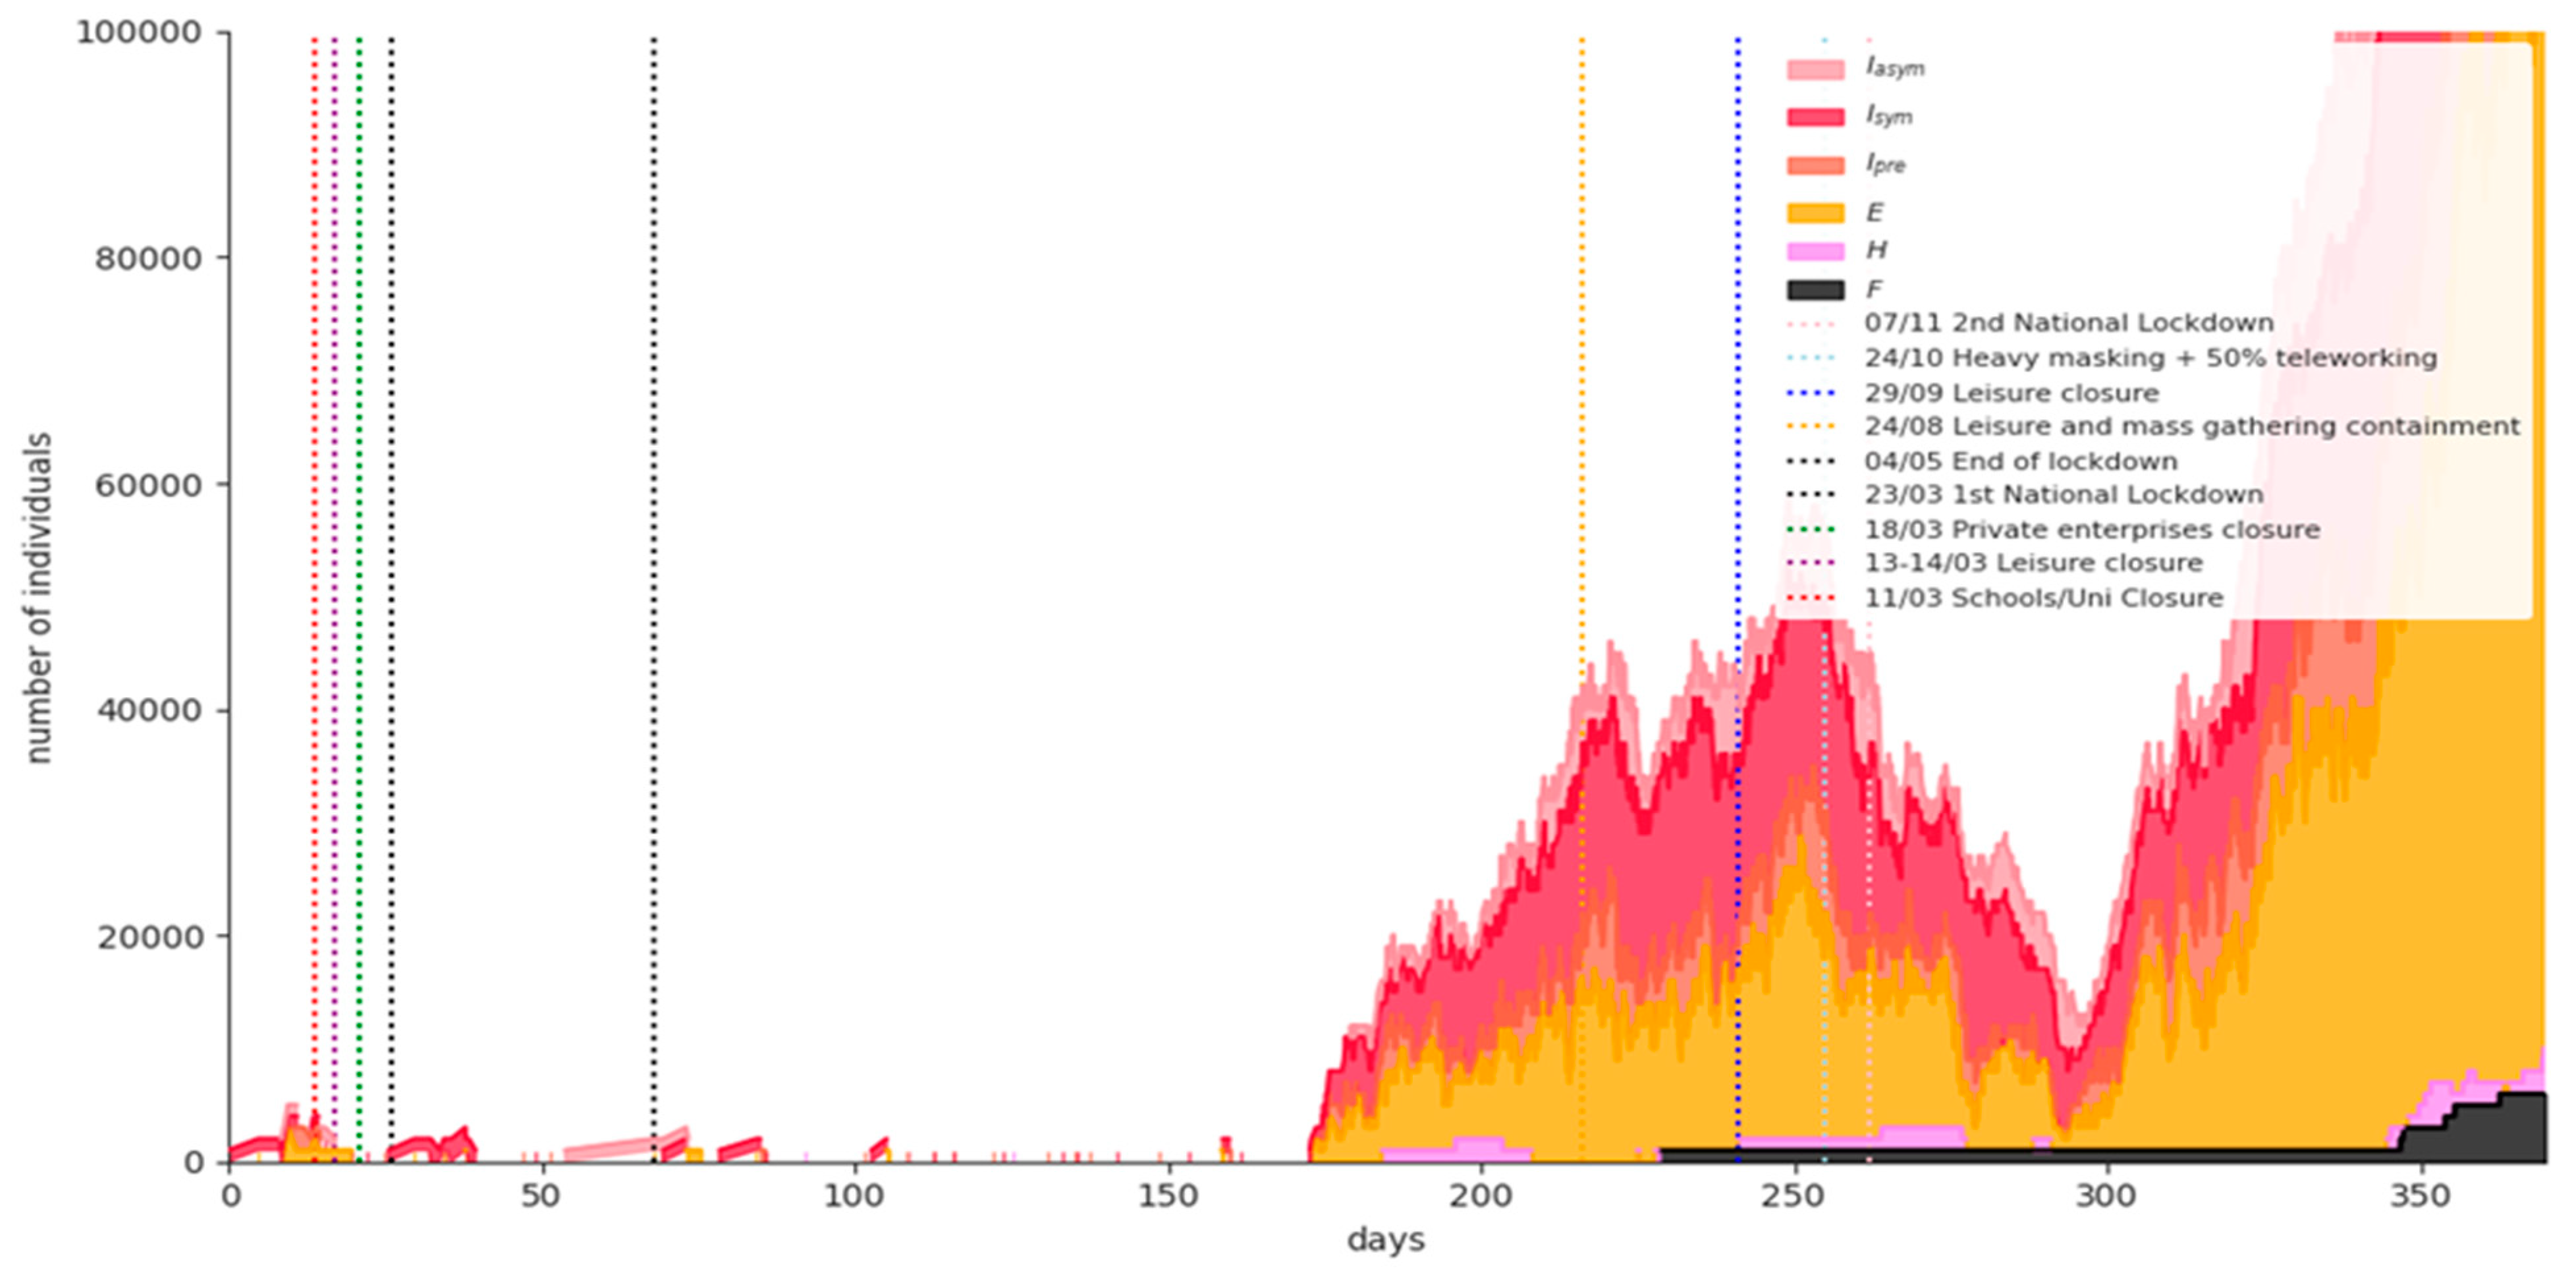
4.1. Covid-19 Background in Greece
4.2. Scenarios
- The baseline scenario, where the national lockdown and all NPIs are lifted on 8 January 2021;
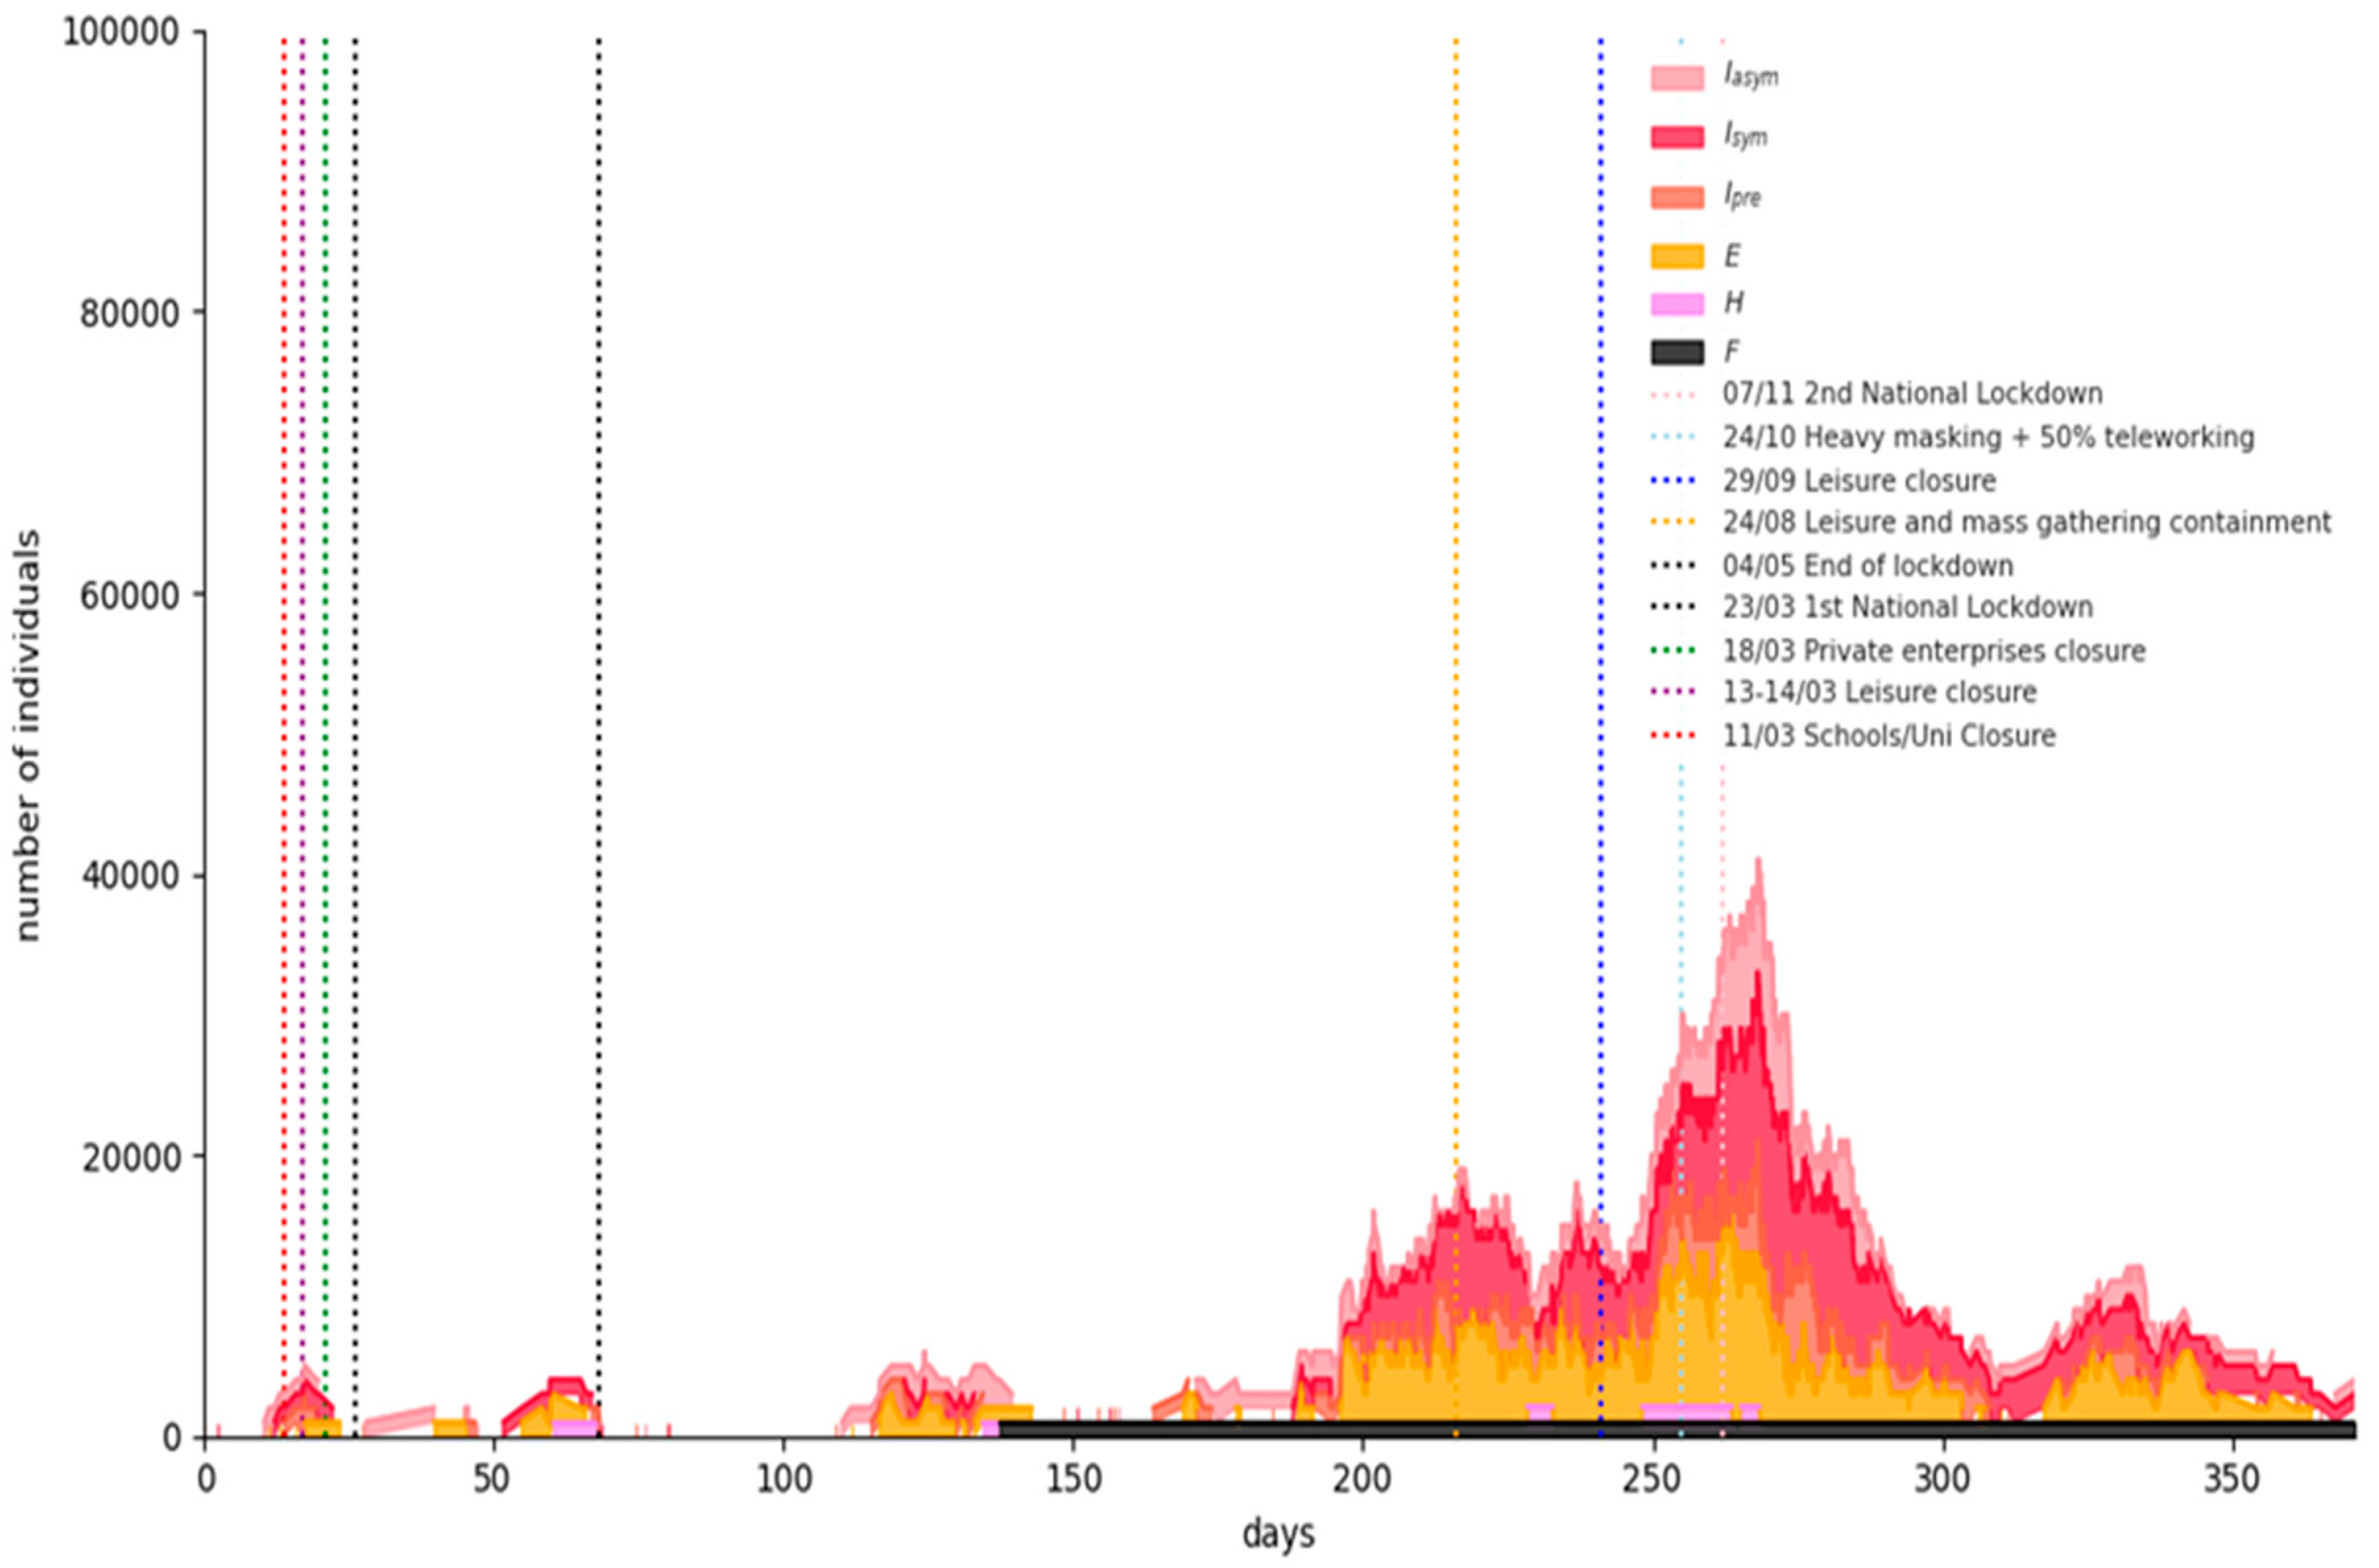
- A “semi-lockdown” scenario with school opening on 8 January 2021, partial retail sector operating, universal mask wearing and at least 50% teleworking; and
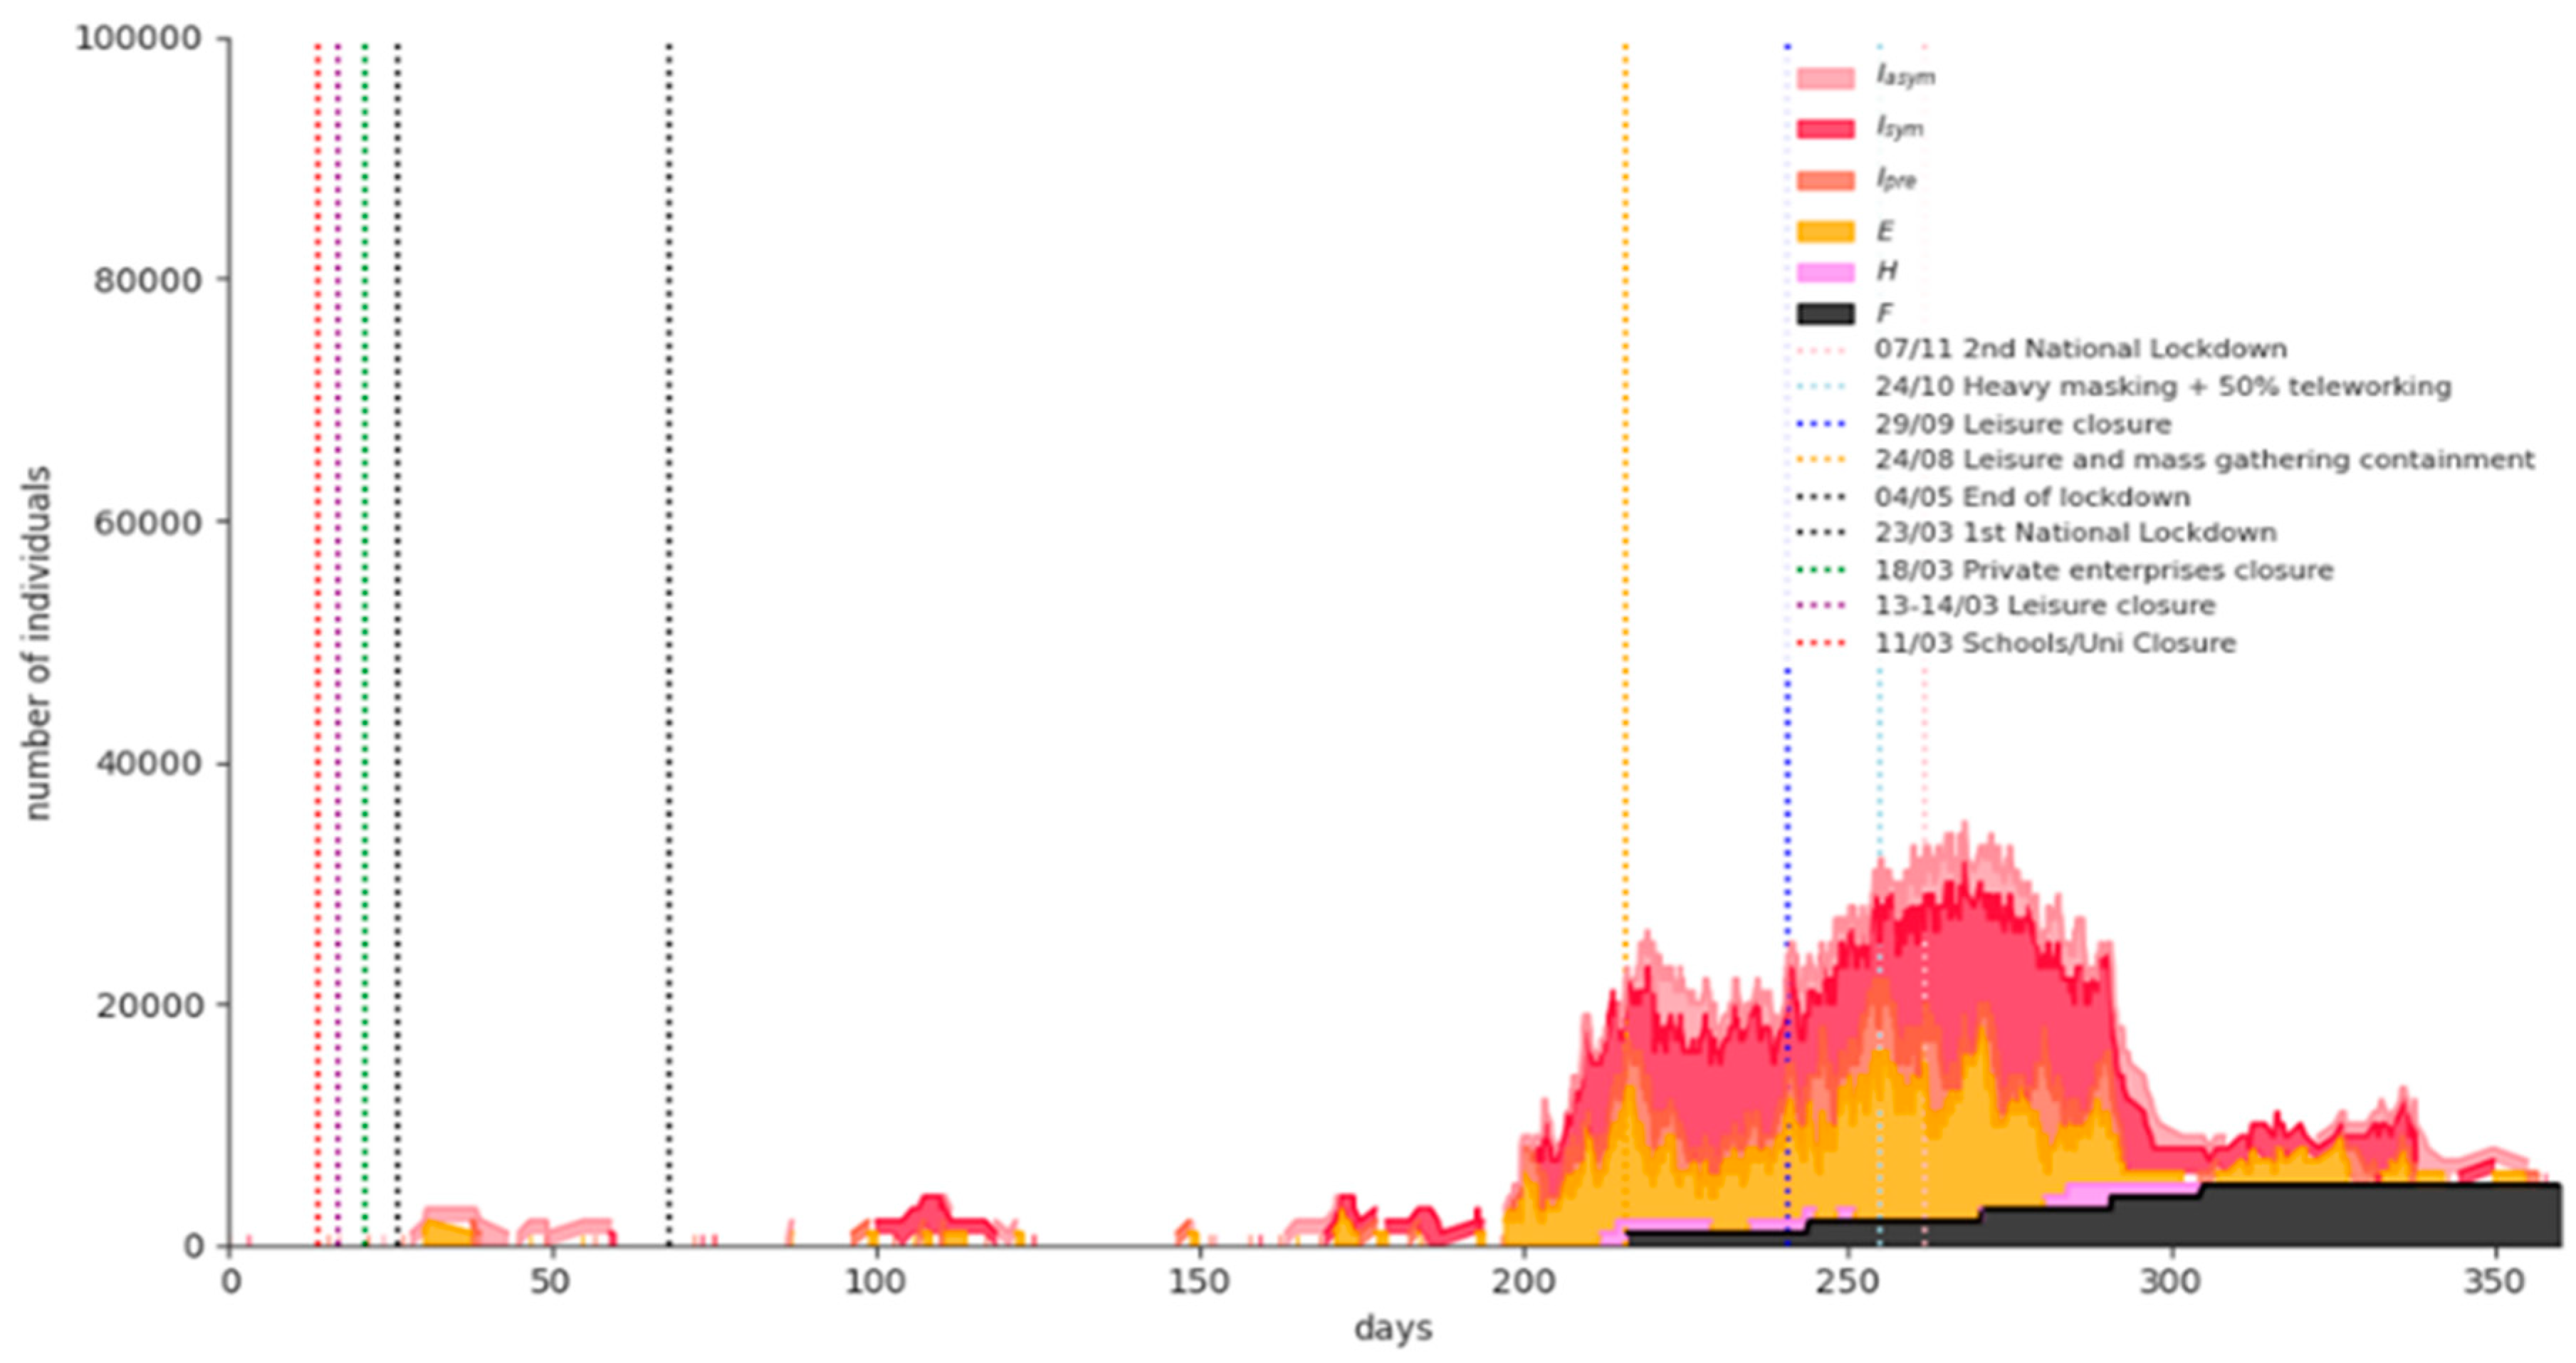
- A “rolling lockdown” scenario with a partial measures’ lift on 8 January 2021 and a third imposed nationwide lockdown in February 2021 (“rolling lockdowns” policy).
- Social distancing/teleworking/school closure. Social distancing/teleworking/school closure effect is captured on the one hand by the reduction of the individuals’ daily contacts (degree of the individual’s contact network), and on the other hand by the reduction of the locality parameter p. The graphs’ mean degrees and p by age group without any NPIs imposed are shown in Table 3 and the decrease in their values by age group when social distancing/teleworking/school closure measures are imposed is illustrated in Table 4.
- Lockdown. Lockdown stringency is captured with a further decrease in the individuals’ contacts network degree and in the probability p of individuals coming into contact with those outside their immediate network. This decrease differs by age group and the stringency of lockdown and is illustrated in Table 4.
- Mask wearing. The factor by which β is reduced as a result of mask wearing depends on the utilization level (simple recommendation/strong recommendation/mandatory) as well as individuals’ adherence, which is age-dependent. This decrease is illustrated in Table 4.
- An optimistic scenario with φt = 81,440 vaccinated persons per day (this is the design vaccination capacity).
- A most likely scenario with φt = 60,000 vaccinated persons per day
- A pessimistic scenario with φt = 40,000 vaccinated persons per day
4.3. Implementation
4.4. Results of the Scenarios
5. Discussion
- The vaccination prioritization is a very complex problem to solve. The vaccines that are gradually becoming available have different attributes, different administration schemes and different efficacies, varying from 62% to 94%.
- For the time being, the available data relate to the vaccines’ efficacy in preventing clinical disease only and not in halting infection/transmission. Moreover, in the proposed model efficacy is assumed to start as soon as the person is vaccinated in a single dose administration scheme (or after the reminder dose in a two-dose administration scheme), while a vaccinated individual might be still infectious for several days. The assumption seems reasonable under the light of the most recent research, where it seems that even after the first dose of vaccines administered in a two-dose scheme in a three-week time interval, efficacy is very high, reaching and exceeding 90% during days 15–28 after the first dose [36,37].
- The vaccines are considered as “waning/all-or-nothing” (providing perfect protection to a fraction of individuals who receive it). However, they could be proved to be “leaky”, i.e., only reducing the probability of infection. The proposed model can address this by calibrating accordingly parameter q.
- Finally, though a form must be filled by the individual before vaccination, this is unlikely to provide all the necessary information; vaccinators will be, for instance, to a large extent unaware of the susceptible/infectious status of all the asymptomatic individuals arriving at the vaccination system; it is, thus, certain that there will be a quantity of vaccines wasted per period. Therefore, an overestimation of vaccination results is possible in the proposed model.
6. Conclusions
Author Contributions
Funding
Institutional Review Board Statement
Informed Consent Statement
Acknowledgments
Conflicts of Interest
Appendix A. The SHARE COVID-19 Survey
- Health and health behavior (General health before and after the COVID-19 outbreak, practice of safety measures, e.g., social distancing, wearing a mask);
- Mental health (Anxiety, depression, sleeping problems, and loneliness before and after the COVID-19 outbreak);
- Infections and healthcare (COVID-19 related symptoms, SARS-CoV-2 testing and hospitalization, forgone medical treatment, satisfaction with treatments);
- Changes in work and economic situation (Unemployment, business closures, working from home, changes in working hours and income, financial support); and
- Social networks (Changes in personal contacts with family and friends, help given and received, personal care given and received).


| District | Number of Participants in SHARE COVID-19 Survey |
|---|---|
| East Macedonia and Thrace | 251 |
| Central Macedonia | 689 |
| West Macedonia | 132 |
| Epirus | 106 |
| Thessaly | 312 |
| West Greece | 200 |
| Central Greece | 228 |
| Attica | 1357 |
| Peloponessos | 192 |
| Ionian islands | 89 |
| North Aegean | 79 |
| South Aegean | 81 |
| Crete | 185 |
| Age | Relative Frequency |
|---|---|
| 50–59 years old | 13.6% |
| 60–69 years old | 35.8% |
| 70–79 years old | 30.1% |
| More than 80 years old | 20.5% |
References
- Izda, V.; Jeffries, M.A.; Sawalha, A.H. COVID-19: A review of therapeutic strategies and vaccine candidates. Clin. Immunol. 2021, 222, 108634. [Google Scholar] [CrossRef]
- Khan, F.N.; Khanam, A.A.; Ramlal, A.; Ahmad, S. A Review on Predictive Systems and Data Models for COVID-19. Stud. Comput. Intell. 2021, 923, 123–164. [Google Scholar]
- Mohamadou, Y.; Halidou, A.; Kapen, P.T. A review of mathematical modeling, artificial intelligence and datasets used in the study, prediction and management of COVID-19. Appl. Intell. 2020, 50, 3913–3925. [Google Scholar] [CrossRef]
- Cuevas, E. An agent-based model to evaluate the COVID-19 transmission risks in facilities. Comput. Biol. Med. 2020, 121, 103827. [Google Scholar] [CrossRef]
- Chang, S.L.; Harding, N.; Zachreson, C.; Cliff, O.M.; Prokopenko, M. Modelling transmission and control of the COVID-19 pandemic in Australia. Nat. Commun. 2020, 11, 5710. [Google Scholar] [CrossRef] [PubMed]
- Din, A.; Khan, A.; Baleanu, D. Stationary distribution and extinction of stochastic coronavirus (COVID-19) epidemic model. Chaos Solitons Fractals 2020, 139, 110036. [Google Scholar] [CrossRef]
- Boukanjime, B.; Caraballo, T.; El Fatini, M.; El Khalifi, M. Dynamics of a stochastic coronavirus (COVID-19) epidemic model with Markovian switching. Chaos Solitons Fractals 2020, 141, 110361. [Google Scholar] [CrossRef]
- Buckner, J.H.; Chowell, G.; Springborn, M.R. Dynamic Prioritization of COVID-19 Vaccines When Social Distancing is Limited for Essential Workers. medRxiv 2020. [Google Scholar] [CrossRef]
- Bubar, K.M.; Reinholt, K.; Kissler, S.M.; Lipsitch, M.; Cobey, S.; Grad, Y.H.; Larremore, D.B. Model-informed COVID-19 vaccine prioritization strategies by age and serostatus. Science 2021, 371, 916–921. [Google Scholar] [CrossRef] [PubMed]
- Buonomo, B. Effects of information-dependent vaccination behavior on coronavirus outbreak: Insights from a SIRI model. Ric. Mat. 2020, 69, 483–499. [Google Scholar] [CrossRef] [Green Version]
- Matrajt, L.; Eaton, J.; Leung, T.; Brown, E.R. Vaccine optimization for COVID-19: Who to vaccinate first? medRxiv 2020. [Google Scholar] [CrossRef]
- Paltiel, A.D.; Zheng, A.; Schwartz, J.L. Speed Versus Efficacy: Quantifying Potential Tradeoffs in COVID-19 Vaccine Deployment. Ann. Intern. Med. 2021. [Google Scholar] [CrossRef]
- Park, H.; Kim, S.H. A Study on Herd Immunity of COVID-19 in South Korea: Using a Stochastic Economic-Epidemiological Model. Environ. Resour. Econ. 2020, 76, 665–670. [Google Scholar] [CrossRef] [PubMed]
- Mukandavire, Z.; Nyabadza, F.; Malunguza, N.J.; Cuadros, D.F.; Shiri, T.; Musuka, G. Quantifying early COVID-19 outbreak transmission in South Africa and exploring vaccine efficacy scenarios. PLoS ONE 2020, 15, e0236003. [Google Scholar] [CrossRef] [PubMed]
- Grauer, J.; Löwen, H.; Liebchen, B. Strategic spatiotemporal vaccine distribution increases the survival rate in an infectious disease like Covid-19. Sci. Rep. 2020, 10, 21594. [Google Scholar] [CrossRef]
- Libotte, G.B.; Lobato, F.S.; Platt, G.M.; Neto, A.J.S. Determination of an optimal control strategy for vaccine administration in COVID-19 pandemic treatment. Comput. Methods Programs Biomed. 2020, 196, 105664. [Google Scholar] [CrossRef]
- Etxeberria-Etxaniz, M.; Alonso-Quesada, S.; De La Sen, M. On an SEIR Epidemic Model with Vaccination of Newborns and Periodic Impulsive Vaccination with Eventual On-Line Adapted Vaccination Strategies to the Varying Levels of the Susceptible Subpopulation. Appl. Sci. 2020, 10, 8296. [Google Scholar] [CrossRef]
- Getz, W.M.; Luisa-Vissat, L.; Salter, R. A Contact-Explicit Covid-19 Epidemic and Response Assessment Model. medRxiv 2020. [Google Scholar] [CrossRef]
- Choi, W.; Shim, E. Optimal strategies for vaccination and social distancing in a game-theoretic epidemiologic model. J. Theor. Biol. 2020, 505, 110422. [Google Scholar] [CrossRef]
- Iboi, E.A.; Ngonghala, C.N.; Gumel, A.B. Will an imperfect vaccine curtail the COVID-19 pandemic in the U.S.? Infect. Dis. Model. 2020, 5, 510–524. [Google Scholar]
- Maltsev, A.V.; Stern, M.D. Social heterogeneity drives complex patterns of the COVID-19 pandemic: Insights from a novel Stochastic Heterogeneous Epidemic Model (SHEM). medRxiv 2020. [Google Scholar] [CrossRef]
- Tetteh, J.N.A.; Nguyen, V.K.; Hernandez-Vargas, E.A. COVID-19 Network Model to Evaluate Vaccine Strategies towards Herd Immunity. medRxiv 2020. [Google Scholar] [CrossRef]
- Kuzdeuov, A.; Baimukashev, D.; Karabay, A.; Ibragimov, B.; Mirzakhmetov, A.; Nurpeiissov, M.; Lewis, M.; Varol, H.A. A network-based stochastic epidemic simulator: Controlling covid-19 with region-specific policies. IEEE J. Biomed. Health Inform. 2020, 24, 2743–2754. [Google Scholar] [CrossRef] [PubMed]
- Ota, M. Will we see protection or reinfection in COVID-19? Nat. Rev. Immunol. 2020, 20, 351. [Google Scholar] [CrossRef]
- Sypsa, V.; Roussos, S.; Paraskevis, D.; Lytras, T.; Tsiodras, S.; Hatzakis, A. Effects of Social Distancing Measures during the First Epidemic Wave of Severe Acute Respiratory Syndrome Infection, Greece. Emerg. Infect. Dis. 2021, 27, 452–462. [Google Scholar] [CrossRef] [PubMed]
- Kai, D.; Goldstein, G.-P.; Morgunov, A.; Nangalia, V.; Rotkirch, A. Universal masking is urgent in the covid-19 pandemic: Seir and agent based models, empirical validation, policy recommendations. arXiv 2020, arXiv:2004.13553. [Google Scholar]
- Hinch, R.; Probert, W.J.; Nurtay, A.; Kendall, M.; Wymatt, C.; Hall, M.; Lythgoe, K.; Cruz, A.B.; Zhao, L.; Stewart, A.; et al. OpenABM-Covid19—An agent-based model for non-pharmaceutical interventions against COVID-19 including contact tracing. medRxiv 2020. [Google Scholar] [CrossRef]
- Zhao, Z.; Zhu, Y.Z.; Xu, J.W.; Hu, Q.Q.; Lei, Z.; Rui, J.; Liu, X.; Wang, Y.; Luo, L.; Yu, S.S.; et al. A mathematical model for estimating the age-specific transmissibility of a novel coronavirus. medRxiv 2020. [Google Scholar] [CrossRef]
- Ferguson, N.M.; Laydon, D.; Nedjati-Gilani, G.; Imai, N.; Ainslie, K.; Baguelin, M.; Bhatia, S.; Boonyasiri, A.; Cucunubá, Z.; Cuomo-Dannenburg, G.; et al. Impact of Non-Pharmaceutical Interventions (NPIs) to Reduce COVID-19 Mortality and Healthcare Demand (Imperial College, 2020); Imperial College COVID-19 Response Team: London, UK, 2020. [Google Scholar]
- Mossong, J.; Hens, N.; Jit, M.; Beutels, P.; Auranen, K.; Mikolajczyk, R.; Massari, M.; Salmaso, S.; Tomba, G.S.; Wallinga, J.; et al. Social Contacts and Mixing Patterns Relevant to the Spread of Infectious Diseases. PLoS Med. 2008, 5, e74. [Google Scholar] [CrossRef]
- Bi, Q.; Lessler, J.; Eckerle, I.; Lauer, S.A.; Kaiser, L.; Vuilleumier, N.; Cummings, D.A.; Flahault, A.; Petrovic, D.; Guessous, I.; et al. Household Transmission of SARS-COV-2: Insights from a Population-based Serological Survey. medRxiv 2020. [Google Scholar] [CrossRef]
- Börsch-Supan, A. Survey of Health, Ageing and Retirement in Europe (SHARE) wave 8. COVID-19 Survey 1. Release Version 0.0.1. beta. SHARE-ERIC. Data Set. The Survey of Health, Ageing and Retirement in Europe (SHARE): SHARE Corona Survey (share-project.org), 2020. Available online: http://www.share-project.org/home0.html (accessed on 17 December 2020).
- Mahase, E. Covid-19: Pfizer vaccine efficacy was 52% after first dose and 95% after second dose, paper shows. BMJ 2020, 371, m4826. [Google Scholar] [CrossRef] [PubMed]
- Gillespie, D.T. A general method for numerically simulating the stochastic time evolution of coupled chemical reactions. J. Comput. Phys. 1976, 22, 403–434. [Google Scholar] [CrossRef]
- Dasaklis, T.K.; Rachaniotis, N.; Pappis, C. Emergency supply chain management for controlling a smallpox outbreak: The case for regional mass vaccination. Int. J. Syst. Sci. Oper. Logist. 2015, 4, 27–40. [Google Scholar] [CrossRef]
- Amit, S.; Regev-Yochay, G.; Afek, A.; Kreiss, Y.; Leshem, E. Early rate reductions of SARS-CoV-2 infection and COVID-19 in BNT162b2 vaccine recipients. Lancet 2021. [Google Scholar] [CrossRef]
- Voysey, M.; Clemens, S.A.C.; Madhi, S.A.; Weckx, L.Y.; Folegatti, P.M.; Aley, P.K.; Angus, B.; Baillie, V.L.; Barnabas, S.L.; Bhorat, Q.E.; et al. Single-dose administration and the influence of the timing of the booster dose on immunogenicity and efficacy of ChAdOx1 nCoV-19 (AZD1222) vaccine: A pooled analysis of four randomised trials. Lancet 2021. [Google Scholar] [CrossRef]
- Scherpenzeel, A.; Axt, K.; Bergmann, M.; Douhou, S.; Oepen, A.; Sand, G.; Schuller, K.; Stuck, S.; Wagner, M.; Börsch-Supan, A. Collecting survey data among the 50+ population during the COVID-19 outbreak: The Survey of Health, Ageing and Retirement in Europe (SHARE). Surv. Res. Methods 2020, 14, 217–221. [Google Scholar]


| Major NPIs | Starting Dates |
|---|---|
| School and University closures | 11 March 2020 |
| Leisure closure | 13–14 March 2020 |
| Private enterprises closure | 18 March 2020 |
| 1st national lockdown | 23 March 2020 |
| Masking recommendations (“Light masking”) | 4 May 2020 |
| Leisure—mass gathering containment | 24 August 2020 |
| Leisure closure | 29 September 2020 |
| Mandatory masking (“Heavy masking”) | 24 October 2020 |
| 2nd national lockdown | 7 November 2020 |
| Nursery schools—kindergarten—primary schools’ closure | 14 November 2020 |
| Parameter | Description | Value | Source |
|---|---|---|---|
| β | transmissibility of symptomatic individuals | [0.155, 0.4] | [25,26] and authors’ estimations |
| βA | transmissibility of pre- and asymptomatic individuals | β/2 | |
| σ | rate of progression to infectiousness | (3.5 days)−1 | |
| λ | rate of progression to (a)symptomatic state | (1.5 days)−1 | |
| n | rate of progression to hospitalized state | (5.5 days)−1 | |
| γ | rate of recovery for non-hospitalized symptomatic individuals | Gamma distributed with mean = (6 days)−1, s.d. = (2.4 days)−1 | |
| γA | rate of recovery for asymptomatic individuals | Gamma distributed with mean = (6 days)−1, s.d. = (2.4 days)−1 | |
| γH | rate of recovery for hospitalized symptomatic individuals | Gamma distributed with mean = (11.5 days)−1, s.d. = (2.3 days)−1 | |
| μH | rate of death for hospitalized individuals | Gamma distributed with mean = (11.774 days)−1, s.d. = (8.815 days)−1 |
| Age Group | Group Size (Hellenic Statistical Authority (statistics.gr; accessed on 10 November 2020)) | Relative Frequencies (%) | Relative Susceptibility α [27] | % Infected Asymptomatic a [27,28] | % Hospitalization h [27,29] and Authors’ Estimations | %CFR for Hospitalized f [27,29] and Authors’ Estimations | Masking Adherence (%) [27] and Statistical Surveys | Social Distancing Adherence (%) [27] and Statistical Surveys | Mean Degree [22,26,30], Seirs+ Covid-19 Notebooks and Authors’ Estimations | p [31] and Authors’ Estimations |
|---|---|---|---|---|---|---|---|---|---|---|
| 0 to 9 | 1,049,839 | 9.706 | 0.35 | 0.456 | 0.000011 | 0.0165 | 70–95 | 70–95 | 12.62 | 0.9 |
| 10 to 19 | 1,072,705 | 9.917 | 0.69 | 0.412 | 0.000114 | 0.0125 | 15.38 | 0.95 | ||
| 20–29 | 1,350,868 | 12.489 | 1.03 | 0.37 | 0.000495 | 0.025 | 12.89 | 0.7 | ||
| 30–39 | 1,635,304 | 15.119 | 1.03 | 0.332 | 0.003726 | 0.025 | 12.89 | 0.9 | ||
| 40–49 | 1,581,095 | 14.618 | 1.03 | 0.296 | 0.019272 | 0.0315 | 12.27 | 0.9 | ||
| 50–59 | 1,391,854 | 12.868 | 1.03 | 0.265 | 0.037107 | 0.08418 | 82.2 | 92.2 | 11.64 | 0.9 |
| 60–69 | 1,134,045 | 10.485 | 1.27 | 0.238 | 0.07067 | 0.1781 | 82.1 | 90.9 | 9.42 | 0.6 |
| 70–79 | 1,017,242 | 9.405 | 1.52 | 0.214 | 0.102833 | 0.38016 | 79.2 | 91.3 | 7.2 | 0.5 |
| 80+ | 583,334 | 5.393 | 1.52 | 0.192 | 0.131513 | 0.709 | 82.1 | 93.4 | 7.2 | 0.5 |
| Major NPIs | Starting Dates | Network Mean Degree (Age Distribution) [25,30] and Authors Estimations | β (Age Distribution) [26,32] and Authors Estimations | p (Age Distribution) [26,31] and Authors Estimations |
|---|---|---|---|---|
| School and University closures | 11/3/2020 | 0–9: 6, 10–19: 12, 20–29: 11, 30–39:12, 40–49: 12, 50–59: 11, 60–69: 9, 70+: 7 | 0–19: 0.5, 20–39: 0.6, 40–69: 0.3, 70+: 0.2 | |
| Leisure closure | 13–14/03/2020 | 0–9: 3, 10–19: 3, 20–29: 7, 30–39: 6 40–49: 6, 50–59: 6, 60–69: 8, 70+: 7 | 0–19: 0.3, 20–39: 0.4, 40–69: 0.3, 70+: 0.2 | |
| Private enterprises | 18/03/2020 | 0–19:3, 20–29:6, 30–59: 5, 60–69: 6, 70+: 4 | ||
| 1st national lockdown | 23/03/2020 | 0–19: 3, 20–29: 5, 30–69: 3, 70+: 2 | 20–29: 0.05, Remainder: 0.02 | |
| “Light” masking | 4/5/2020 | 0–49: 0.95β, 50+: 0.8β | ||
| Leisure—mass gathering containment | 24/08/2020 | 0–9: 12.62, 10–19: 15.38, 20–29: 12.89, 30–39:12.89, 40–49: 12.27, 50–59: 11.64, 60–69: 9.42, 70+: 7.2 | ||
| Leisure closure | 29/09/2020 | 0–9: 12.62, 10–19: 15.38, 20–29: 12, 30–39:11, 40–49: 11, 50–59: 11, 60–69: 8, 70+: 7 | 0–19: 0.6, 20–39: 0.7, 40–69: 0.5, 70+: 0.3 | |
| «Heavy” masking +teleworking 50% | 24/10/2020 | 0–9: 13, 10–19: 16, 20–29: 12, 30–39: 10, 40–49: 10, 50–59: 10, 60+: 7 | 0–19: 0.5β, 20–50: 0.65β, 50+: 0.2β | 0–19: 0.5, 20–39: 0.6, 40–69: 0.4, 70+: 0.2 |
| 2nd national lockdown | 7/11/2020 | 0–9: 12.62, 10–19: 7, 20–29: 8, 30–69: 7, 70+: 3 | 0–9: 0.3, 10–19: 0.3, 20–29: 0.1, Remainder: 0.03 | |
| Nursery schools—kindergarten—primary schools closure | 14/11/2020 | 0–19: 4, 20–29: 7, 30–69: 5, 70+: 3 | 20–29: 0.1, Remainder: 0.03 |
Publisher’s Note: MDPI stays neutral with regard to jurisdictional claims in published maps and institutional affiliations. |
© 2021 by the authors. Licensee MDPI, Basel, Switzerland. This article is an open access article distributed under the terms and conditions of the Creative Commons Attribution (CC BY) license (http://creativecommons.org/licenses/by/4.0/).
Share and Cite
Rachaniotis, N.P.; Dasaklis, T.K.; Fotopoulos, F.; Tinios, P. A Two-Phase Stochastic Dynamic Model for COVID-19 Mid-Term Policy Recommendations in Greece: A Pathway towards Mass Vaccination. Int. J. Environ. Res. Public Health 2021, 18, 2497. https://doi.org/10.3390/ijerph18052497
Rachaniotis NP, Dasaklis TK, Fotopoulos F, Tinios P. A Two-Phase Stochastic Dynamic Model for COVID-19 Mid-Term Policy Recommendations in Greece: A Pathway towards Mass Vaccination. International Journal of Environmental Research and Public Health. 2021; 18(5):2497. https://doi.org/10.3390/ijerph18052497
Chicago/Turabian StyleRachaniotis, Nikolaos P., Thomas K. Dasaklis, Filippos Fotopoulos, and Platon Tinios. 2021. "A Two-Phase Stochastic Dynamic Model for COVID-19 Mid-Term Policy Recommendations in Greece: A Pathway towards Mass Vaccination" International Journal of Environmental Research and Public Health 18, no. 5: 2497. https://doi.org/10.3390/ijerph18052497