
Changes in Personal Exposure to Fine Particulate Matter (PM2.5) during the Spring 2020 COVID-19 Lockdown in the UK: Results of a Simulation Model

 ,
,  ,
,  and
and 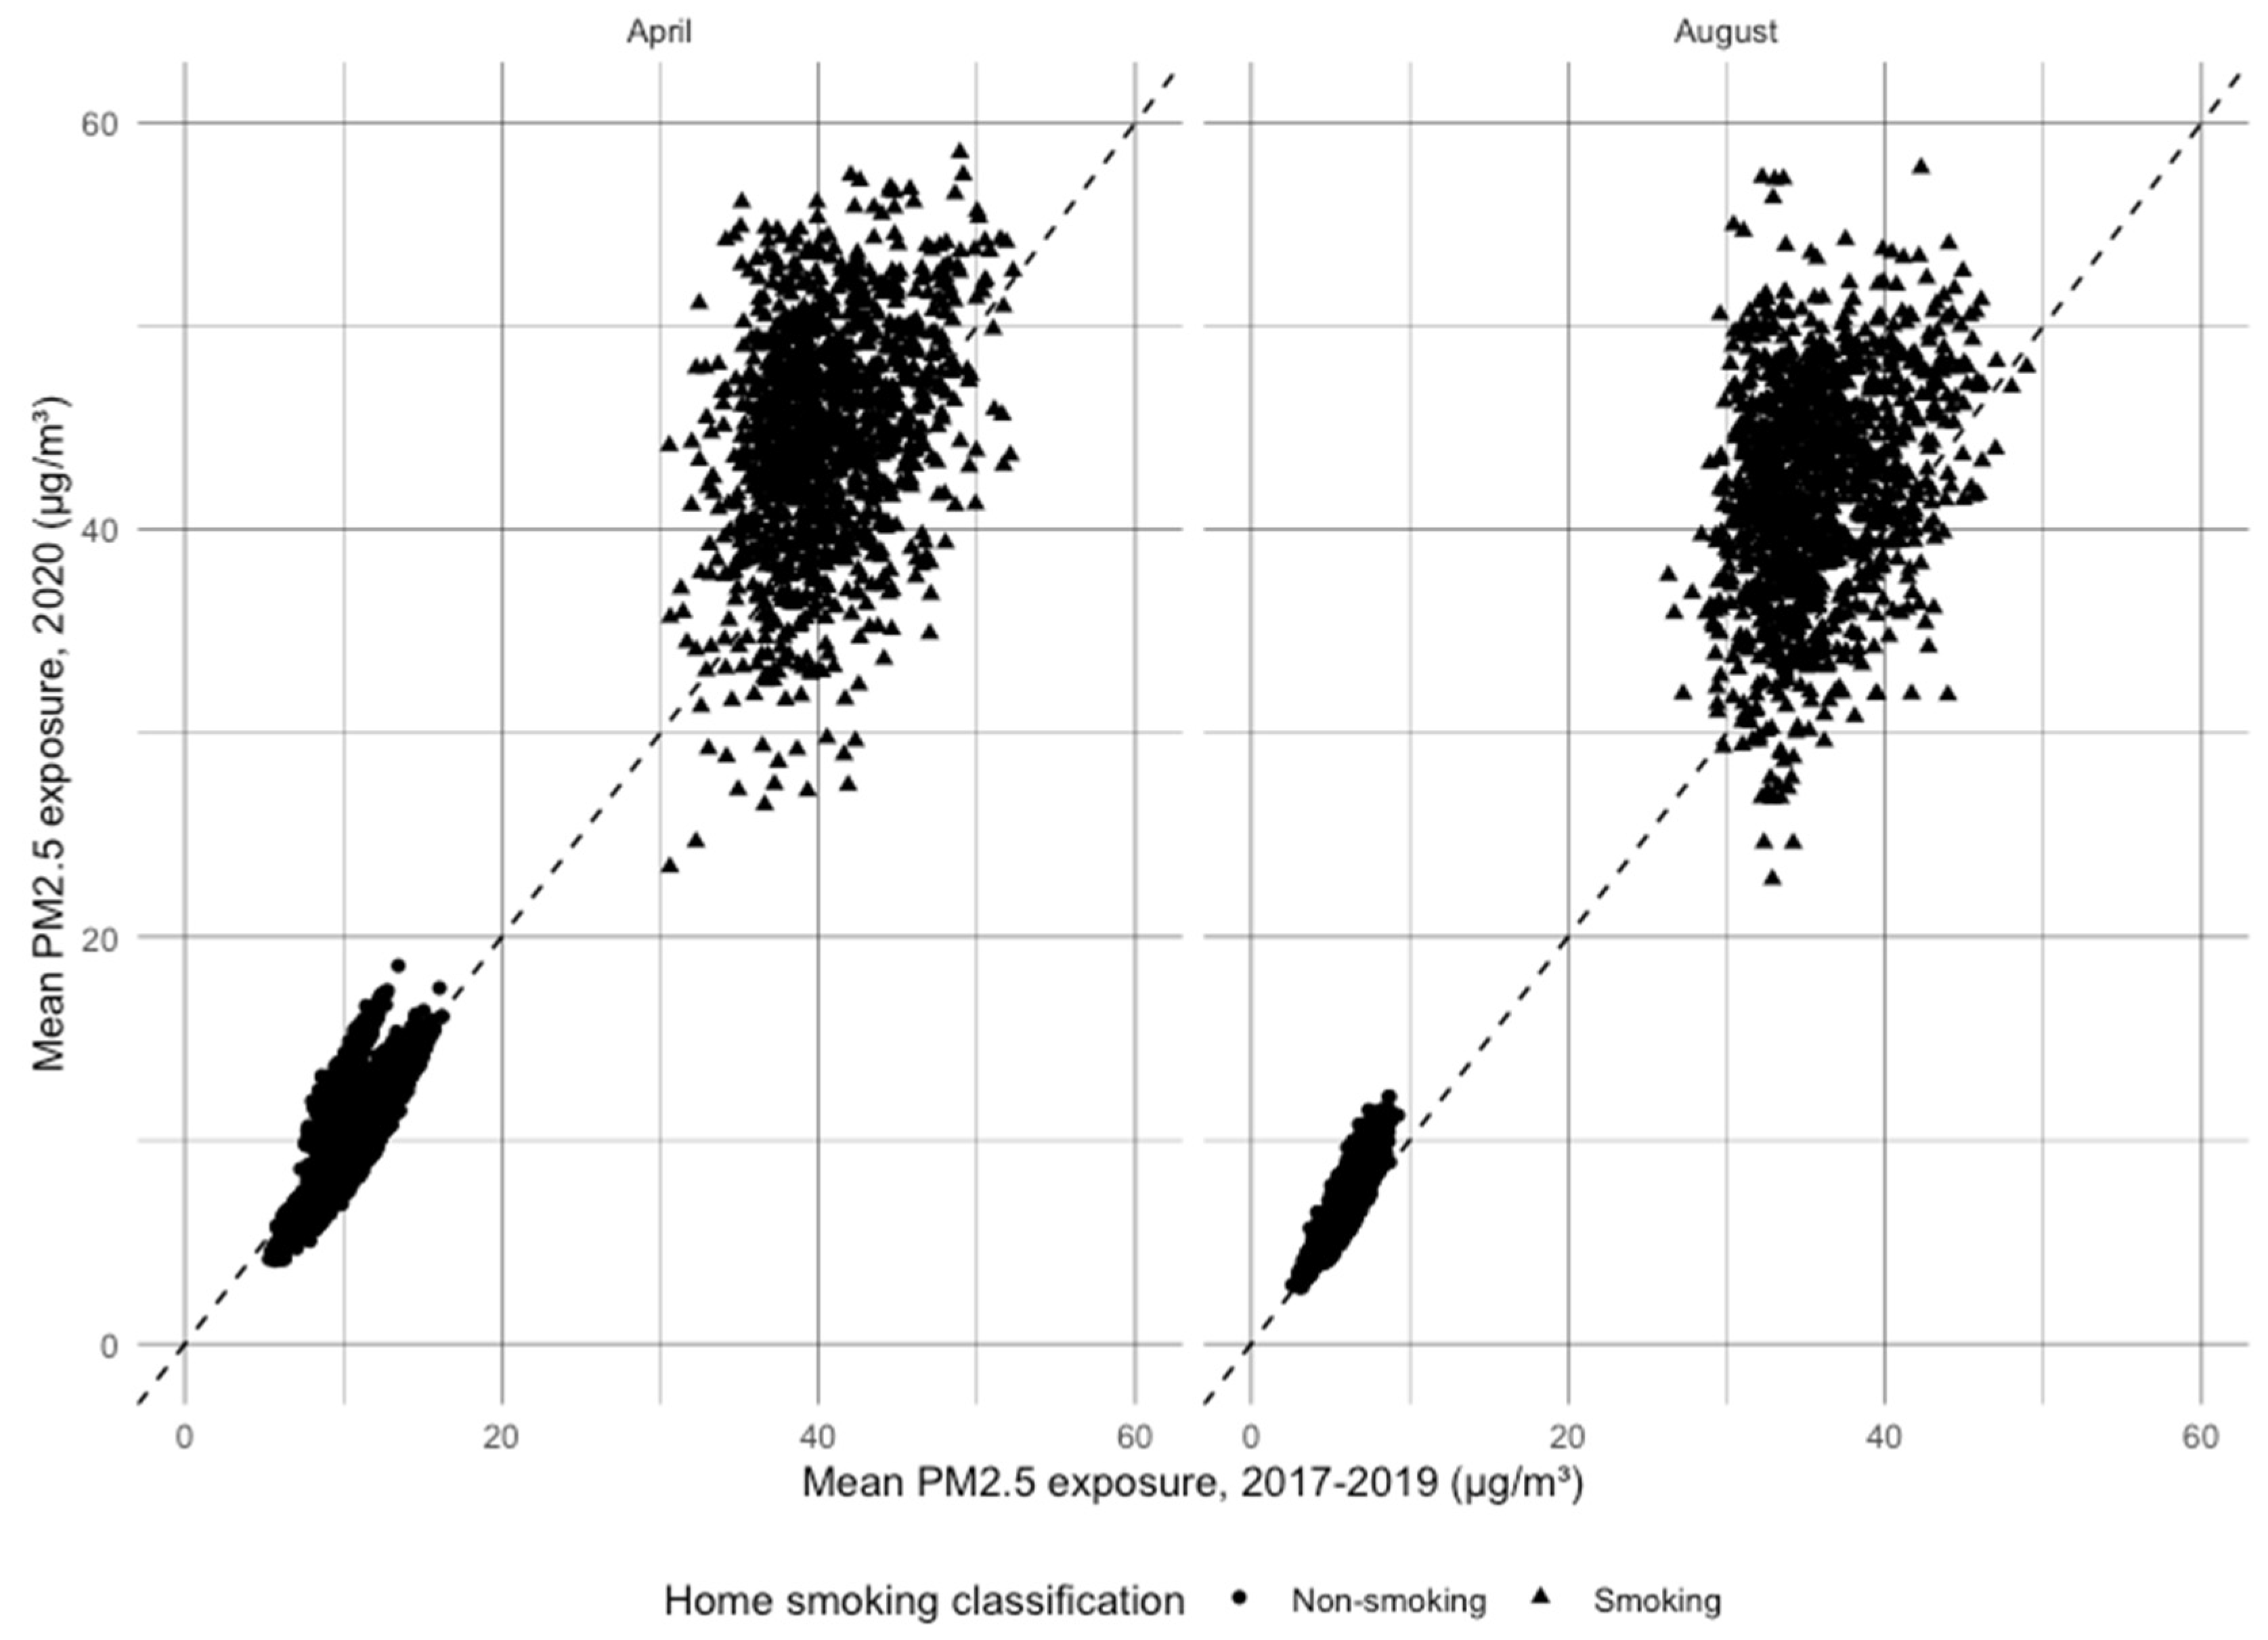
Abstract
:1. Introduction
2. Methods
2.1. Modelling Personal Exposure to PM2.5
2.2. Demographic and Time Use Data
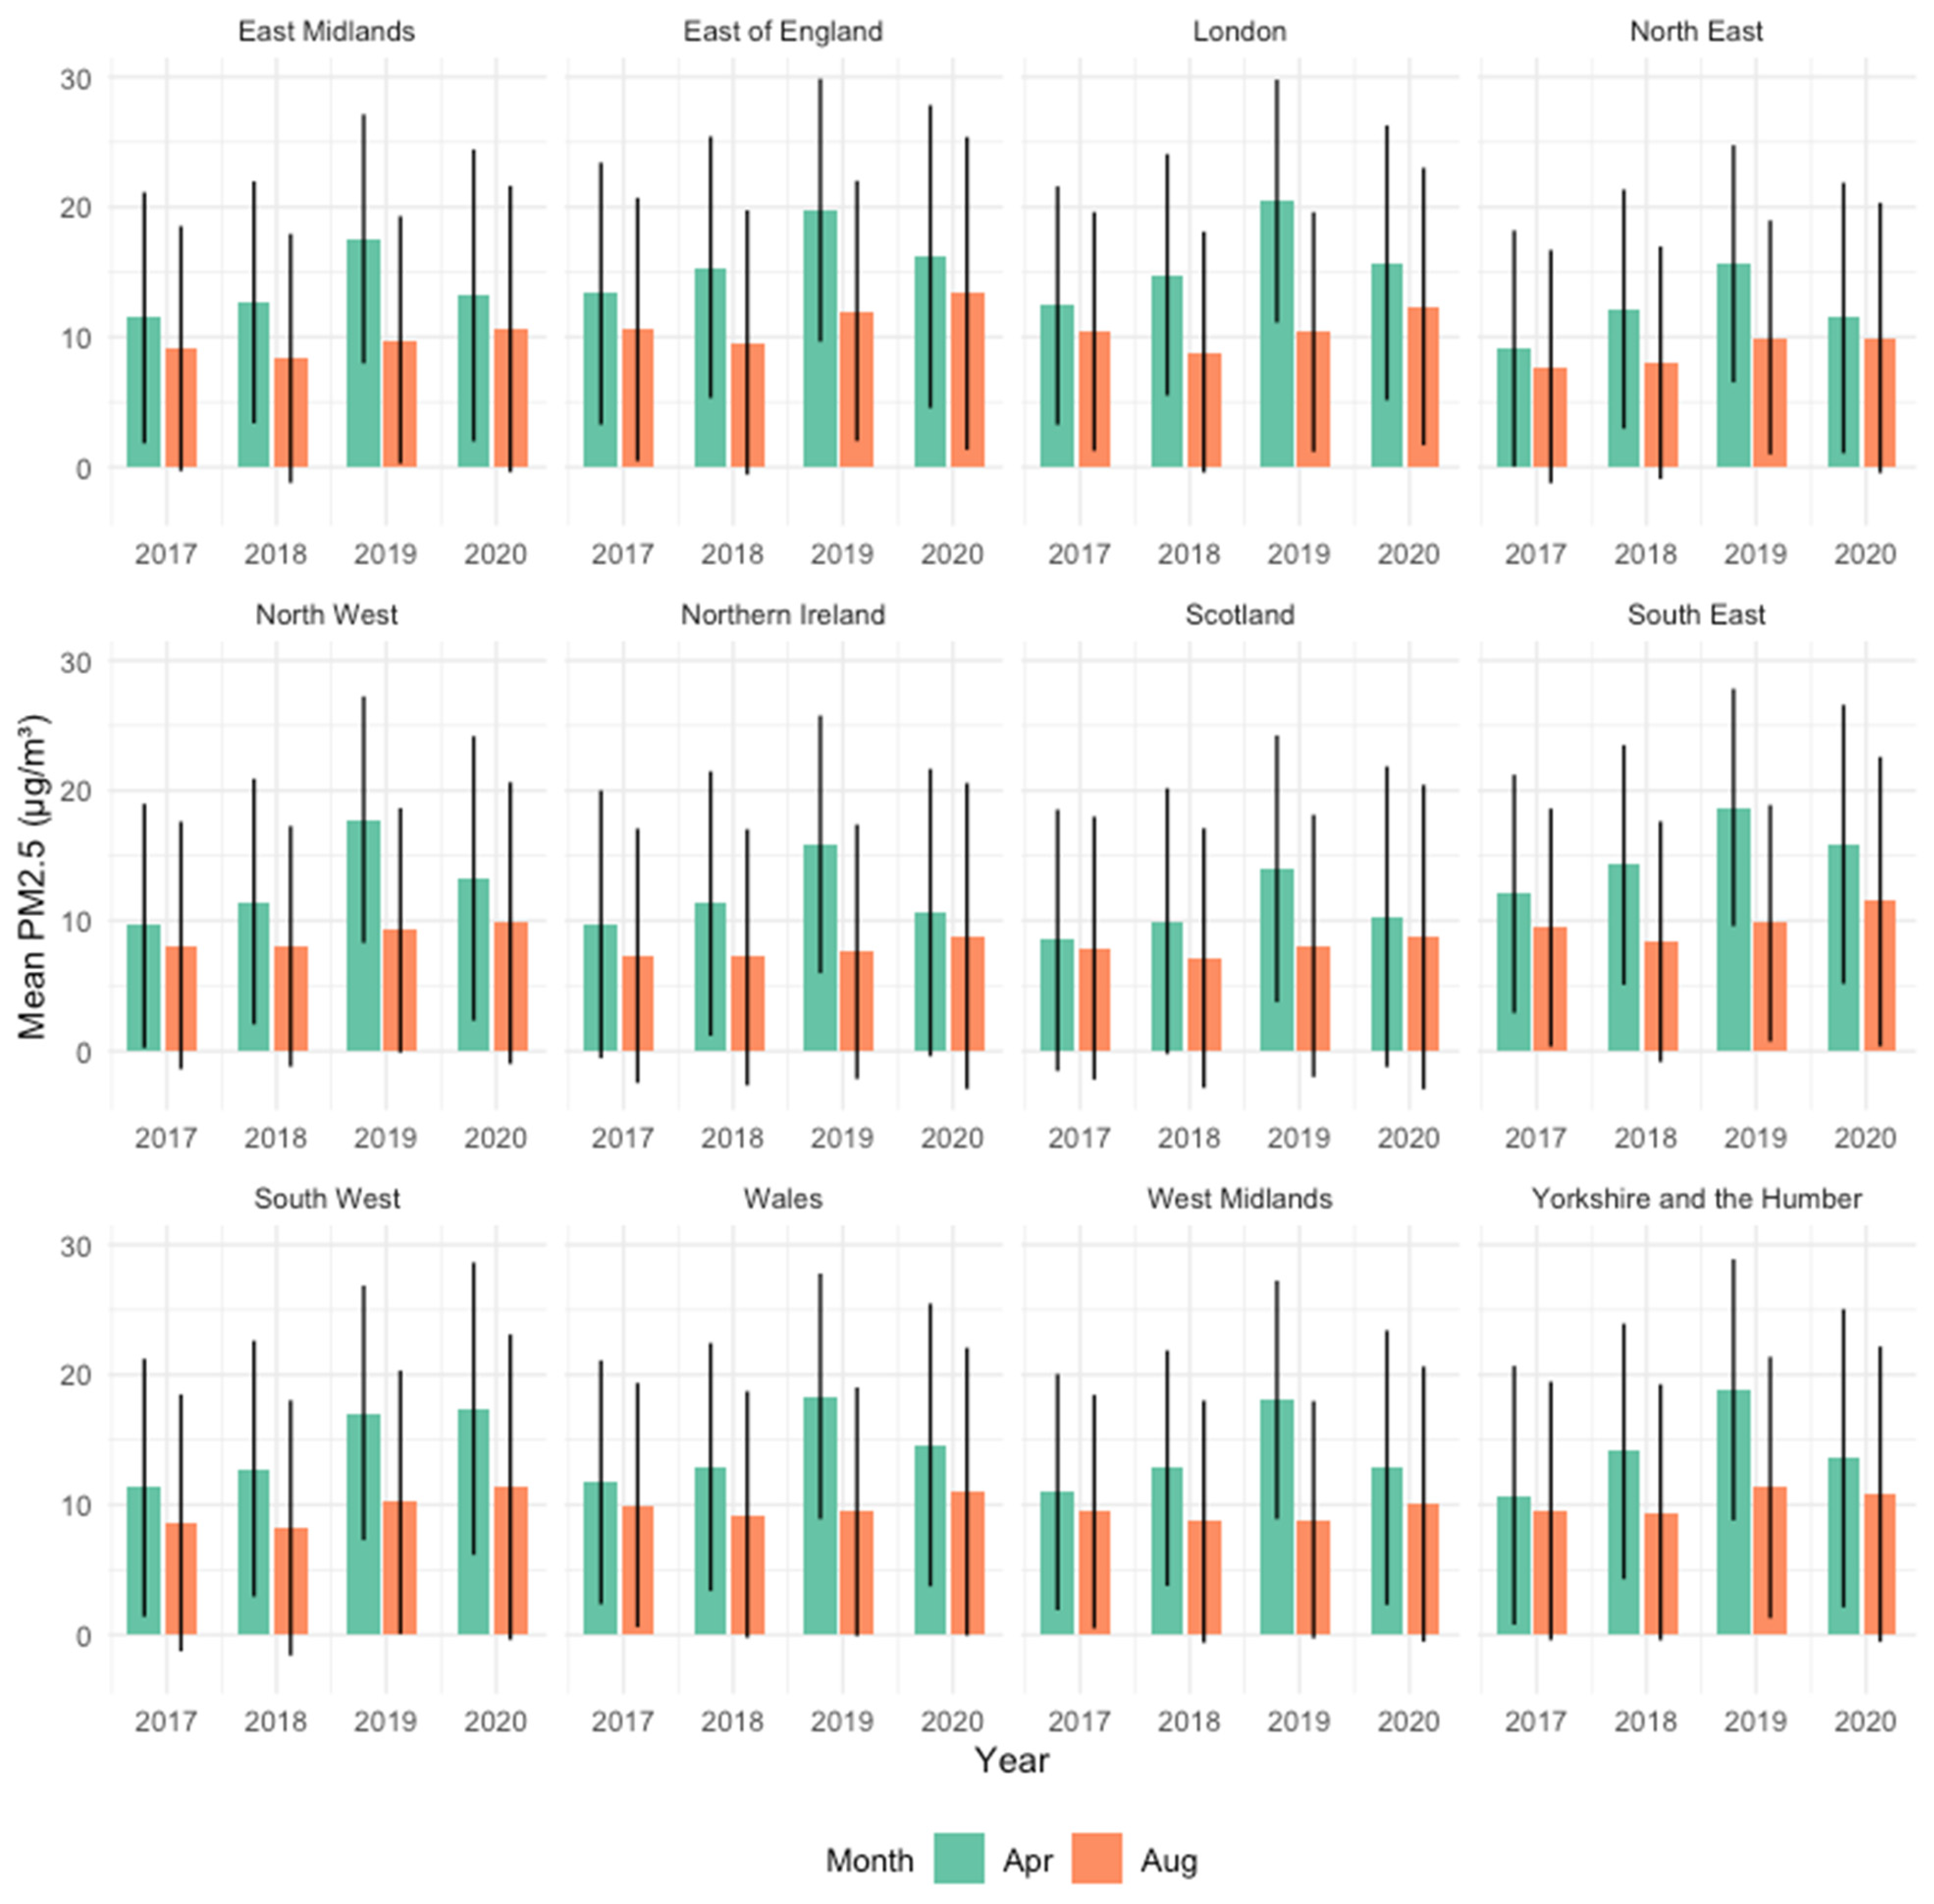
2.3. Ambient PM2.5 by Region
2.4. Indoor Air
2.5. Changes in Behaviour during Lockdown
2.6. Exposure Modelling
2.7. Statistical Analysis
2.8. Ethical Approval
3. Results
3.1. Overall Changes in Exposure
3.2. Changes in Exposure by Demographic Characteristics
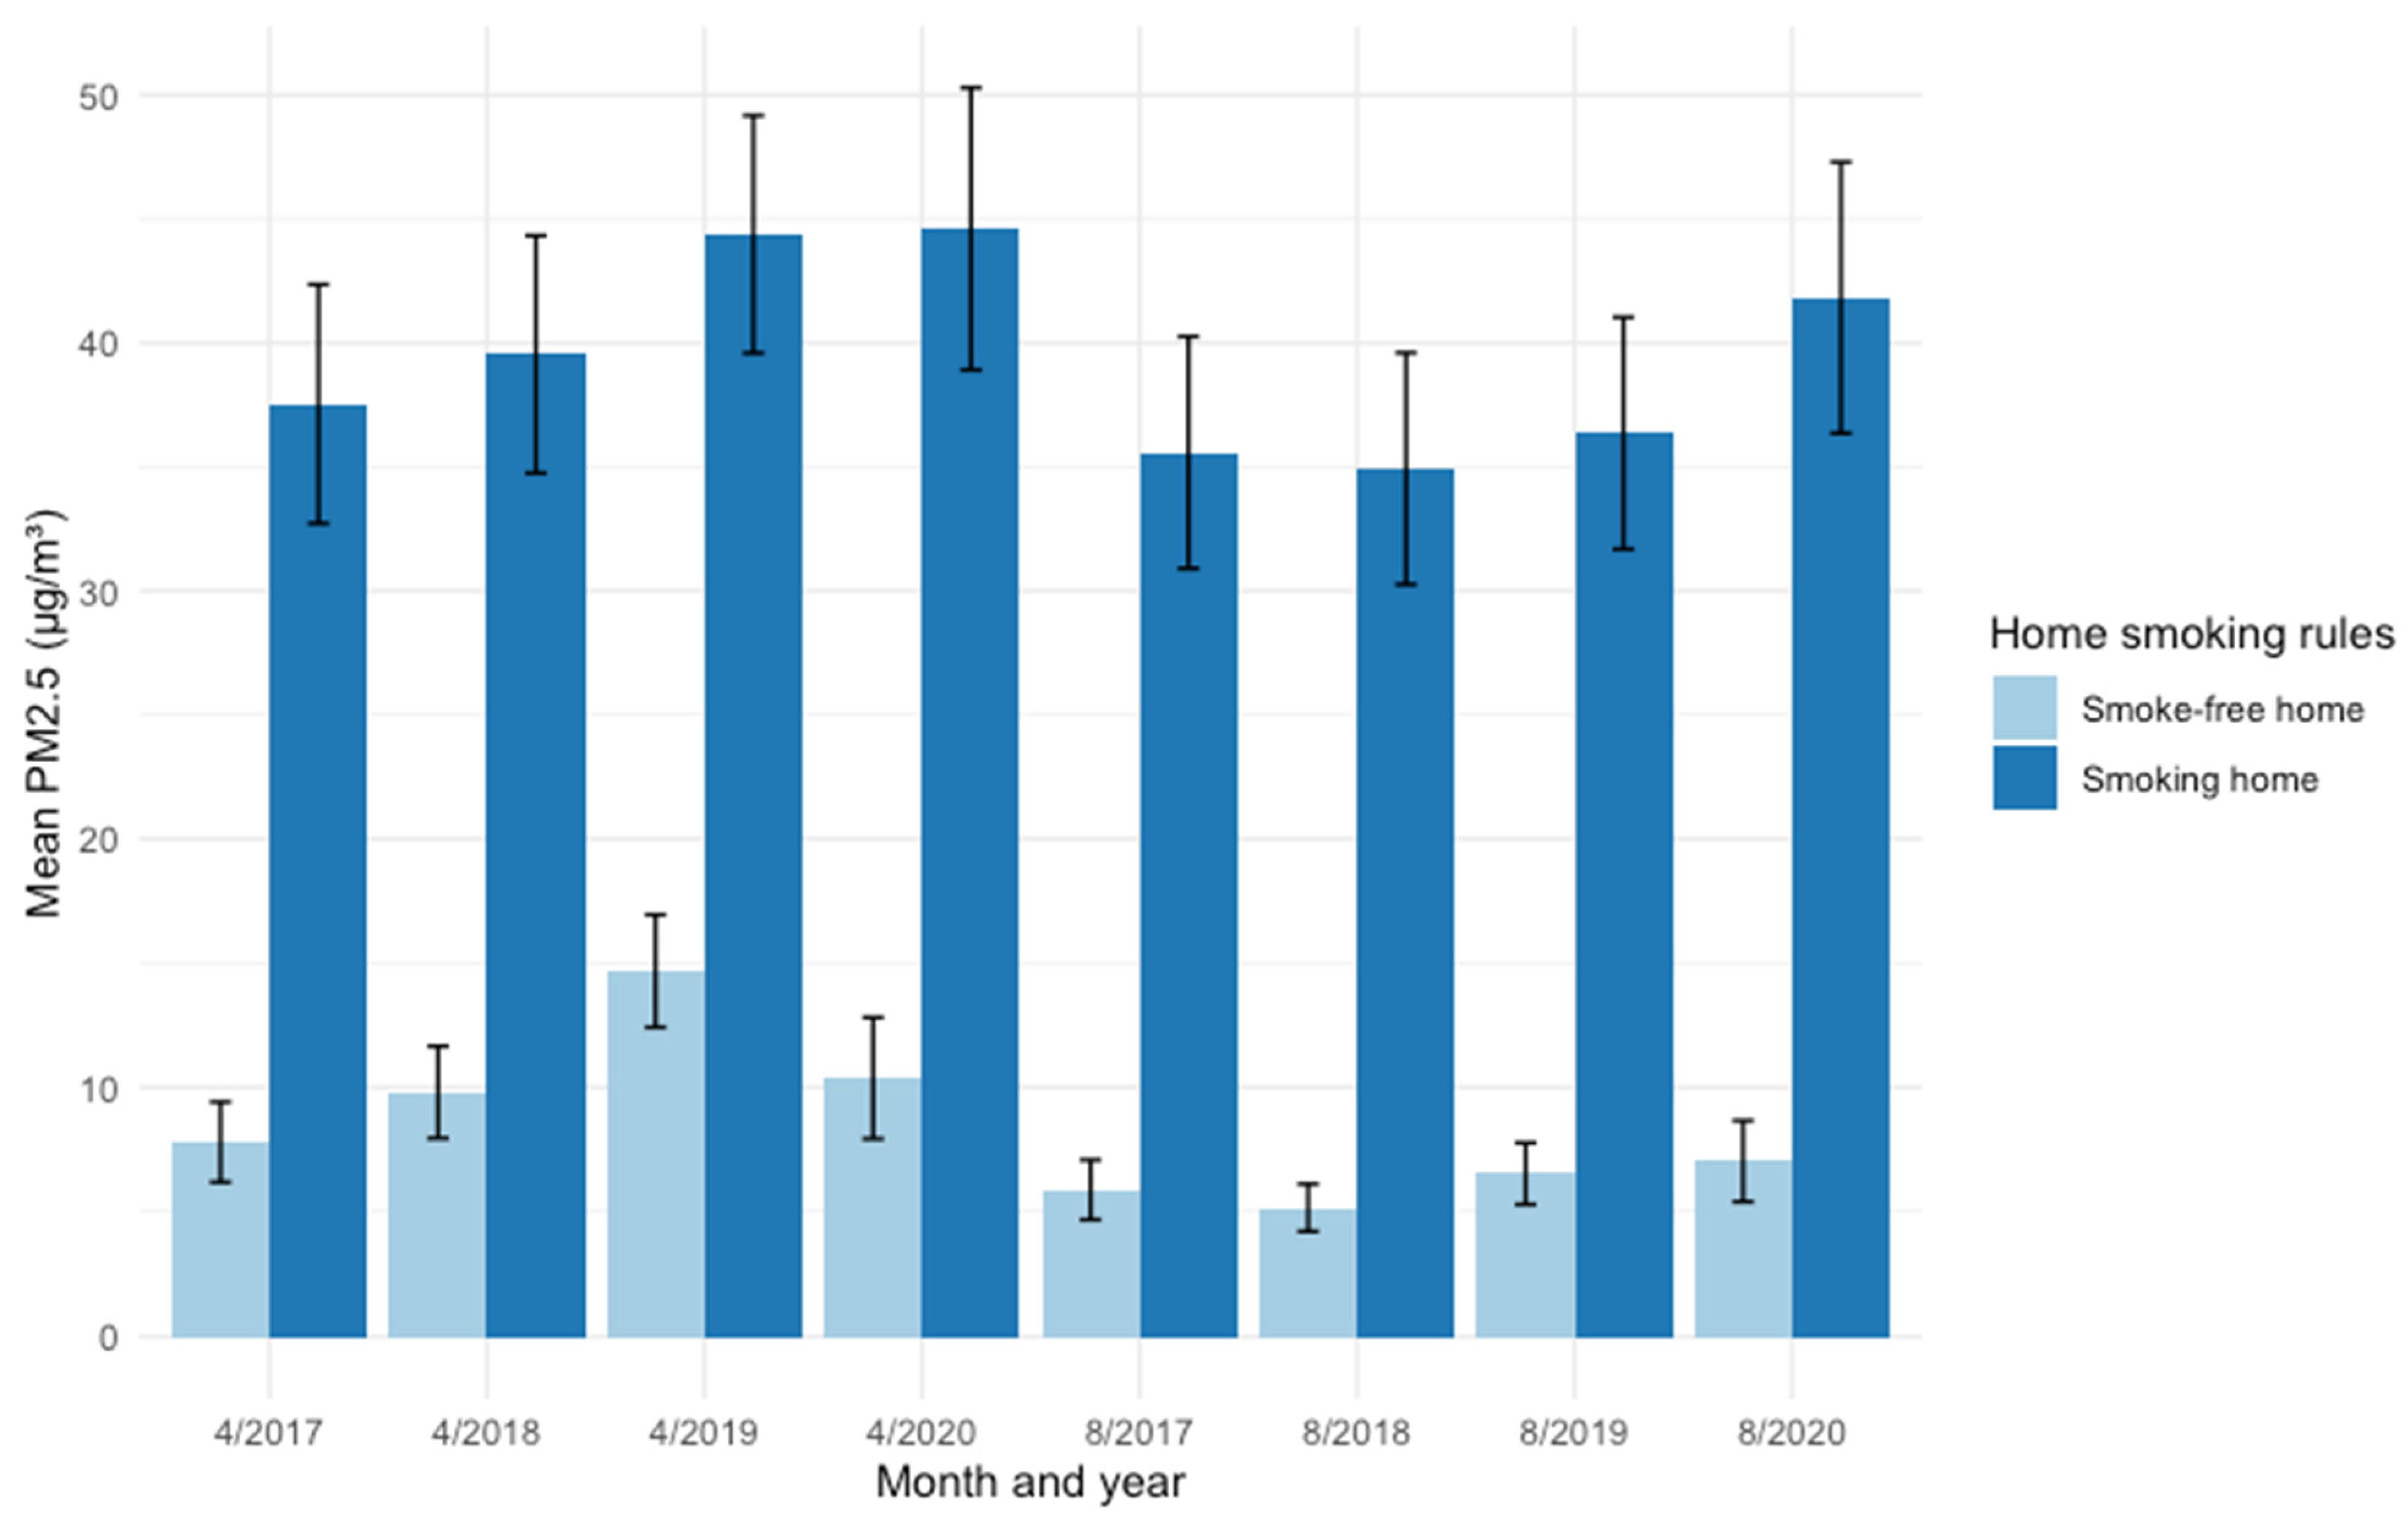
3.3. Level of Exposure by Whether Smoking Occurs in the Home
4. Discussion
4.1. Limitations
4.2. Future Research
5. Conclusions
Supplementary Materials
Author Contributions
Funding
Institutional Review Board Statement
Informed Consent Statement
Data Availability Statement
Conflicts of Interest
References
- Jephcote, C.; Hansell, A.L.; Adams, K.; Gulliver, J. Changes in air quality during COVID-19 ‘lockdown’ in the United Kingdom. Environ. Pollut. 2020, 272, 116011. [Google Scholar] [CrossRef]
- Dobson, R.; Semple, S. Changes in outdoor air pollution due to COVID-19 lockdowns differ by pollutant: Evidence from Scotland. Occup. Environ. Med. 2020, 77, 798–800. [Google Scholar] [CrossRef]
- Steinle, S.; Reis, S.; Sabel, C.E.; Semple, S.; Twigg, M.M.; Braban, C.F.; Leeson, S.R.; Heal, M.R.; Harrison, D.; Lin, C.; et al. Personal exposure monitoring of PM2.5 in indoor and outdoor microenvironments. Sci. Total Environ. 2015, 508, 383–394. [Google Scholar] [CrossRef] [Green Version]
- Daellenbach, K.R.; Uzu, G.; Jiang, J.; Cassagnes, L.-E.; Leni, Z.; Vlachou, A.; Stefenelli, G.; Canonaco, F.; Weber, S.; Segers, A.; et al. Sources of particulate-matter air pollution and its oxidative potential in Europe. Nature 2020, 587, 414–419. [Google Scholar] [CrossRef] [PubMed]
- Secrest, M.H.; Schauer, J.J.; Carter, E.M.; Lai, A.M.; Wang, Y.; Shan, M.; Yang, X.; Zhang, Y.; Baumgartner, J. The oxidative potential of PM2.5 exposures from indoor and outdoor sources in rural China. Sci. Total Environ. 2016, 571, 1477–1489. [Google Scholar] [CrossRef] [PubMed]
- Ni, Y.; Shi, G.; Qu, J. Indoor PM2.5, tobacco smoking and chronic lung diseases: A narrative review. Environ. Res. 2020, 181, 108910. [Google Scholar] [CrossRef] [PubMed]
- Fu, P.; Guo, X.; Cheung, F.M.H.; Yung, K.K.L. The association between PM2.5 exposure and neurological disorders: A systematic review and meta-analysis. Sci. Total Environ. 2019, 655, 1240–1248. [Google Scholar] [CrossRef]
- World Health Organisation. Global Ambient Air Quality Database (update 2018). 2018. Available online: http://www.who.int/airpollution/data/cities/en/ (accessed on 16 October 2018).
- World Health Organisation. SDG Indicator 11.6.2: Concentrations of fine particulate matter (PM2.5). Available online: https://www.who.int/data/gho/data/indicators/indicator-details/GHO/concentrations-of-fine-particulate-matter-(pm2-5) (accessed on 28 April 2021).
- Taiwo, A.M. Source Apportionment of Urban Background Particulate Matter in Birmingham, United Kingdom Using a Mass Closure Model. Aerosol Air Qual. Res. 2016, 16, 1244–1252. [Google Scholar] [CrossRef] [Green Version]
- Brown, L. National Radiation Survey in the UK: Indoor Occupancy Factors. Radiat. Prot. Dosim. 1983, 5, 203–208. [Google Scholar] [CrossRef]
- Semple, S.; Turner, S.; O’Donnell, R.; Adams, L.; Henderson, T.; Mitchell, S.; Lyttle, S.; Amos, A. Using air-quality feedback to encourage disadvantaged parents to create a smoke-free home: Results from a randomised controlled trial. Environ. Int. 2018, 120, 104–110. [Google Scholar] [CrossRef]
- Altuwayjiri, A.; Soleimanian, E.; Moroni, S.; Paolo, P.; Borgini, A.; De Marco, C.; Ruprecht, A.A.; Sioutas, C. The impact of stay-home policies during Coronavirus-19 pandemic on the chemical and toxicological characteristics of ambient PM2.5 in the metropolitan area of Milan, Italy. Sci. Total Environ. 2021, 758, 143582. [Google Scholar] [CrossRef] [PubMed]
- R Core Team. R: A Language and Environment for Statistical Computing. 2019. Available online: https://www.r-project.org/ (accessed on 28 October 2021).
- Census Microdata. Available online: https://census.ukdataservice.ac.uk/get-data/microdata.aspx (accessed on 25 November 2020).
- Office for National Statistics. NUTS Level 1 (January 2018) Full Clipped Boundaries in the United Kingdom. Open Geography Portal. 2019. Available online: https://geoportal.statistics.gov.uk/datasets/01fd6b2d7600446d8af768005992f76a_0?geometry=-34.075%2C51.101%2C29.207%2C59.782 (accessed on 7 April 2021).
- Gershuny, J.; Sullivan, O. United Kingdom Time Use Survey, 2014–2015. UK Data Serv. 2017, 8128. [Google Scholar] [CrossRef]
- Carslaw, D.C.; Ropkins, K. Openair—An R package for air quality data analysis. Environ. Modell. Softw. 2012, 27–28, 52–61. [Google Scholar] [CrossRef]
- Department for Environment Food and Rural Affairs. Automatic Urban and Rural Network (AURN). 2020. Available online: https://uk-air.defra.gov.uk/networks/network-info?view=aurn (accessed on 28 October 2021).
- Department for Environment F and RA (Defra). EU Standard Methods for Monitoring and UK Approach. Available online: https://uk-air.defra.gov.uk/networks/monitoring-methods?view=eu-standards (accessed on 28 October 2021).
- Taylor, J.; Shrubsole, C.; Symonds, P.; Mackenzie, I.; Davies, M. Application of an indoor air pollution metamodel to a spatially-distributed housing stock. Sci. Total Environ. 2019, 667, 390–399. [Google Scholar] [CrossRef]
- Klepeis, N.E.; Bellettiere, J.; Hughes, S.C.; Nguyen, B.; Berardi, V.; Liles, S.; Obayashi, S.; Hofstetter, C.R.; Blumberg, E.; Hovell, M.F. Fine particles in homes of predominantly low-income families with children and smokers: Key physical and behavioral determinants to inform indoor-air-quality interventions. PLoS ONE 2017, 12, e0177718. [Google Scholar] [CrossRef]
- Apelberg, B.J.; Hepp, L.M.; Avila-Tang, E.; Gundel, L.; Hammond, S.K.; Hovell, M.F.; Hyland, A.; Klepeis, N.E.; Madsen, C.C.; Navas-Acien, A.; et al. Environmental monitoring of secondhand smoke exposure. Tob. Control 2013, 22, 147–155. [Google Scholar] [CrossRef] [Green Version]
- Dobson, R.; Semple, S. “How do you know those particles are from cigarettes?”: An algorithm to help differentiate second-hand tobacco smoke from background sources of household fine particulate matter. Environ. Res. 2018, 166, 344–347. [Google Scholar] [CrossRef] [PubMed]
- Semple, S.; Ibrahim, A.E.; Apsley, A.; Steiner, M.; Turner, S. Using a new, low-cost air quality sensor to quantify second-hand smoke (SHS) levels in homes. Tob. Control 2015, 24, 153–158. [Google Scholar] [CrossRef]
- Semple, S.; Apsley, A.; MacCalman, L. An inexpensive particle monitor for smoker behaviour modification in homes. Tob. Control 2013, 22, 295–298. [Google Scholar] [CrossRef] [Green Version]
- Scottish Government Community Health & Social Care Directorate. Scottish Health Survey 2018: Key Findings. 2019. Available online: https://www.gov.scot/publications/scottish-health-survey-2018-summary-key-findings/ (accessed on 29 April 2020).
- He, C.; Morawska, L.; Gilbert, D. Particle deposition rates in residential houses. Atmos. Environ. 2005, 39, 3891–3899. [Google Scholar] [CrossRef] [Green Version]
- Mclean, J.; Wilson, V. Scottish Health Survey 2019—Volume 1: Main Report. Edinburgh: 2020. Available online: https://www.gov.scot/publications/scottish-health-survey-2019-volume-1-main-report/ (accessed on 12 February 2021).
- O’donnell, R.; Eadie, D.; Stead, M.; Dobson, R.; Semple, S. “I Was Smoking a Lot More during Lockdown because I Can”: A Qualitative Study of how UK Smokers Responded to the Covid-19 Lockdown. Int. J. Environ. Res. Public Health 2021, 18, 5816. [Google Scholar] [CrossRef]
- Office for National Statistics. Coronavirus and How People Spent Their Time under Lockdown. 2020. Available online: https://www.ons.gov.uk/economy/nationalaccounts/satelliteaccounts/bulletins/coronavirusandhowpeoplespenttheirtimeunderrestrictions/28marchto26april2020 (accessed on 28 April 2021).
- BBC News. Saharan Dust: Why Your Car Is Covered in Red Dirt. 2019. Available online: https://www.bbc.co.uk/news/uk-scotland-48037362 (accessed on 29 April 2020).
- Pope, C.A.; Coleman, N.; Pond, Z.A.; Burnett, R.T. Fine particulate air pollution and human mortality: 25+ years of cohort studies. Environ. Res. 2020, 183, 108924. [Google Scholar] [CrossRef]
- Menut, L.; Bessagnet, B.; Siour, G.; Mailler, S.; Pennel, R.; Cholakian, A. Impact of lockdown measures to combat Covid-19 on air quality over western Europe. Sci. Total Environ. 2020, 741, 140426. [Google Scholar] [CrossRef]
- Nakada, L.Y.K.; Urban, R.C. COVID-19 pandemic: Impacts on the air quality during the partial lockdown in São Paulo state, Brazil. Sci. Total Environ 2020, 730, 139087. [Google Scholar] [CrossRef]
- Collivignarelli, M.C.; Abbà, A.; Bertanza, G.; Pedrazzani, R.; Ricciardi, P.; Miino, M.C. Lockdown for CoViD-2019 in Milan: What are the effects on air quality? Sci. Total Environ 2020, 732, 139280. [Google Scholar] [CrossRef]
- Ropkins, K.; Tate, J.E. Early observations on the impact of the COVID-19 lockdown on air quality trends across the UK. Sci. Total Environ 2021, 754, 142374. [Google Scholar] [CrossRef]
- Edwards, L.; Rutter, G.; Iverson, L.; Wilson, L.; Chadha, T.S.; Wilkinson, P.; Milojevic, A. Personal exposure monitoring of PM2.5 among US diplomats in Kathmandu during the COVID-19 lockdown, March to June 2020. Sci. Total Environ 2021, 772, 144836. [Google Scholar] [CrossRef]
- Du, W.; Wang, J.; Wang, Z.; Lei, Y.; Huang, Y.; Liu, S.; Wu, C.; Ge, S.; Chen, Y.; Bai, K.; et al. Influence of COVID-19 lockdown overlapping Chinese Spring Festival on household PM2.5 in rural Chinese homes. Chemosphere 2021, 278, 130406. [Google Scholar] [CrossRef] [PubMed]
- Johnston, H.J.; Mueller, W.; Steinle, S.; Vardoulakis, S.; Tantrakarnapa, K.; Loh, M.; Cherrie, J.W. How Harmful Is Particulate Matter Emitted from Biomass Burning? A Thailand Perspective. Curr. Pollut. Rep. 2019, 5, 353–377. [Google Scholar] [CrossRef] [Green Version]
- Mills, S.; Brown, H.; Wrieden, W.; White, M.; Adams, J. Frequency of eating home cooked meals and potential benefits for diet and health: Cross-sectional analysis of a population-based cohort study. Int. J. Behav. Nutr. Phys. Act. 2017, 14, 109. [Google Scholar] [CrossRef] [PubMed]
- Nazar, G.P.; Lee, J.T.; Arora, M.; Millett, C. Socioeconomic Inequalities in Secondhand Smoke Exposure at Home and at Work in 15 Low- and Middle-Income Countries. Nicotine Tob. Res. 2016, 18, 1230–1239. [Google Scholar] [CrossRef] [PubMed] [Green Version]
- Moore, G.F.; Currie, D.; Gilmore, G.; Holliday, J.C.; Moore, L. Socioeconomic inequalities in childhood exposure to secondhand smoke before and after smoke-free legislation in three UK countries. J. Public Health 2012, 34, 599–608. [Google Scholar] [CrossRef] [PubMed]
- Orton, S.; Jones, L.L.; Cooper, S.; Lewis, S.; Coleman, T. Predictors of Children’s Secondhand Smoke Exposure at Home: A Systematic Review and Narrative Synthesis of the Evidence. PLoS ONE 2014, 9, e112690. [Google Scholar] [CrossRef] [Green Version]
- Gan, W.Q.; Mannino, D.M.; Jemal, A. Socioeconomic disparities in secondhand smoke exposure among US never-smoking adults: The national health and nutrition examination survey 1988–2010. Tob. Control 2015, 24, 568–573. [Google Scholar] [CrossRef]
- Department for Business E and, IS. Summary Results of the Domestic Wood Use Survey. London: 2016. Available online: www.gov.uk/government/statistics/digest-of-united-kingdom-energy-statistics-dukes-2014-printed-version (accessed on 10 June 2021).


Publisher’s Note: MDPI stays neutral with regard to jurisdictional claims in published maps and institutional affiliations. |
© 2022 by the authors. Licensee MDPI, Basel, Switzerland. This article is an open access article distributed under the terms and conditions of the Creative Commons Attribution (CC BY) license (https://creativecommons.org/licenses/by/4.0/).
Share and Cite
Dobson, R.; Eadie, D.; O’Donnell, R.; Stead, M.; Cherrie, J.W.; Semple, S. Changes in Personal Exposure to Fine Particulate Matter (PM2.5) during the Spring 2020 COVID-19 Lockdown in the UK: Results of a Simulation Model. Atmosphere 2022, 13, 273. https://doi.org/10.3390/atmos13020273
Dobson R, Eadie D, O’Donnell R, Stead M, Cherrie JW, Semple S. Changes in Personal Exposure to Fine Particulate Matter (PM2.5) during the Spring 2020 COVID-19 Lockdown in the UK: Results of a Simulation Model. Atmosphere. 2022; 13(2):273. https://doi.org/10.3390/atmos13020273
Chicago/Turabian StyleDobson, Ruaraidh, Douglas Eadie, Rachel O’Donnell, Martine Stead, John W. Cherrie, and Sean Semple. 2022. "Changes in Personal Exposure to Fine Particulate Matter (PM2.5) during the Spring 2020 COVID-19 Lockdown in the UK: Results of a Simulation Model" Atmosphere 13, no. 2: 273. https://doi.org/10.3390/atmos13020273