 Zehua Dong
 Qiyu Yan1,2
 Zhixian Liu
 Xiaosheng Wang
- 1Biomedical Informatics Research Lab, School of Basic Medicine and Clinical Pharmacy, China Pharmaceutical University, Nanjing, China
- 2Big Data Research Institute, China Pharmaceutical University, Nanjing, China
- 3Jiangsu Cancer Hospital, Jiangsu Institute of Cancer Research, The Affiliated Cancer Hospital of Nanjing Medical University, Nanjing, China
Background: Although several key molecules have been identified to modulate SARS-CoV-2 invasion of human host cells, the molecules correlated with outcomes in COVID-19 caused by SARS-CoV-2 infection remain insufficiently explored.
Methods: This study analyzed three RNA-Seq gene expression profiling datasets for COVID-19 and identified differentially expressed genes (DEGs) between COVID-19 patients and normal people, commonly in the three datasets. Furthermore, this study explored the correlation between the expression of these genes and clinical features in COVID-19 patients.
Results: This analysis identified 13 genes significantly upregulated in COVID-19 patients’ leukocyte and SARS-CoV-2-infected nasopharyngeal tissue compared to normal tissue. These genes included OAS1, OAS2, OAS3, OASL, HERC6, SERPING1, IFI6, IFI44, IFI44L, CMPK2, RSAD2, EPSTI1, and CXCL10, all of which are involved in antiviral immune regulation. We found that these genes’ downregulation was associated with worse clinical outcomes in COVID-19 patients, such as intensive care unit (ICU) admission, mechanical ventilatory support (MVS) requirement, elevated D-dimer levels, and increased viral loads. Furthermore, this analysis identified two COVID-19 clusters based on the expression profiles of the 13 genes, termed COV-C1 and COV-C2. Compared with COV-C1, COV-C2 more highly expressed the 13 genes, had stronger antiviral immune responses, were younger, and displayed more favorable clinical outcomes.
Conclusions: A strong antiviral immune response is essential in reducing severity of COVID-19.
Background
The coronavirus disease 2019 (COVID-19) pandemic caused by severe acute respiratory syndrome coronavirus 2 (SARS-CoV-2) infection has caused nearly 477 million cases and more than 6 million deaths as of March 25, 2022 (1). Moreover, the number of COVID-19 cases have been dramatically increasing since the virus has evolved to higher infectivity, such as the Omicron variant (2). Some key molecules contributing to SARS-CoV-2 invasion of human host cells have been identified, including angiotensin-converting enzyme 2 (ACE2), transmembrane serine protease 2 (TMPRSS2), FURIN, cathepsins B/L (CTSB/L), cyclin G associated kinase (GAK), AP2 associated kinase 1 (AAK1), and two pore segment channel 2 (TPCN2) (3–8). Besides, myriad studies have explored the factors responsible for the significantly different clinical outcomes in COVID-19 patients, including age (9), gender (10), viral load (11), immune (12), nutrient intake (13), and underlying medical conditions (14).
Although multi-omics analyses have identified molecular characteristics significantly associated with COVID-19 outcomes (15–17), there exist discrepant results among different studies. To overcome this limitation, in this study, we identified differentially expressed genes (DEGs) between COVID-19 patients and normal people in three datasets, respectively, and uncovered common DEGs among them. We further analyzed associations between these genes and clinical features of COVID-19 patients. This study is expected to provide molecular insights into mechanisms of COVID-19 infection and severity.
Methods
Datasets
Three RNA-Seq gene expression profiling datasets for COVID-19 were downloaded from the NCBI Gene Expression Omnibus (GEO) (https://www.ncbi.nlm.nih.gov/geo/). These datasets included GSE157103 (17) (gene expression profiles in 100 COVID-19 patients’ leukocyte samples) and GSE152075 (11) and GSE156063 (18) (gene expression profiles in SARS-CoV-2-infected human tissues from nasopharyngeal swabs). Table 1 is a summary of these datasets, and more details on these datasets are presented in the Supplementary Table S1.
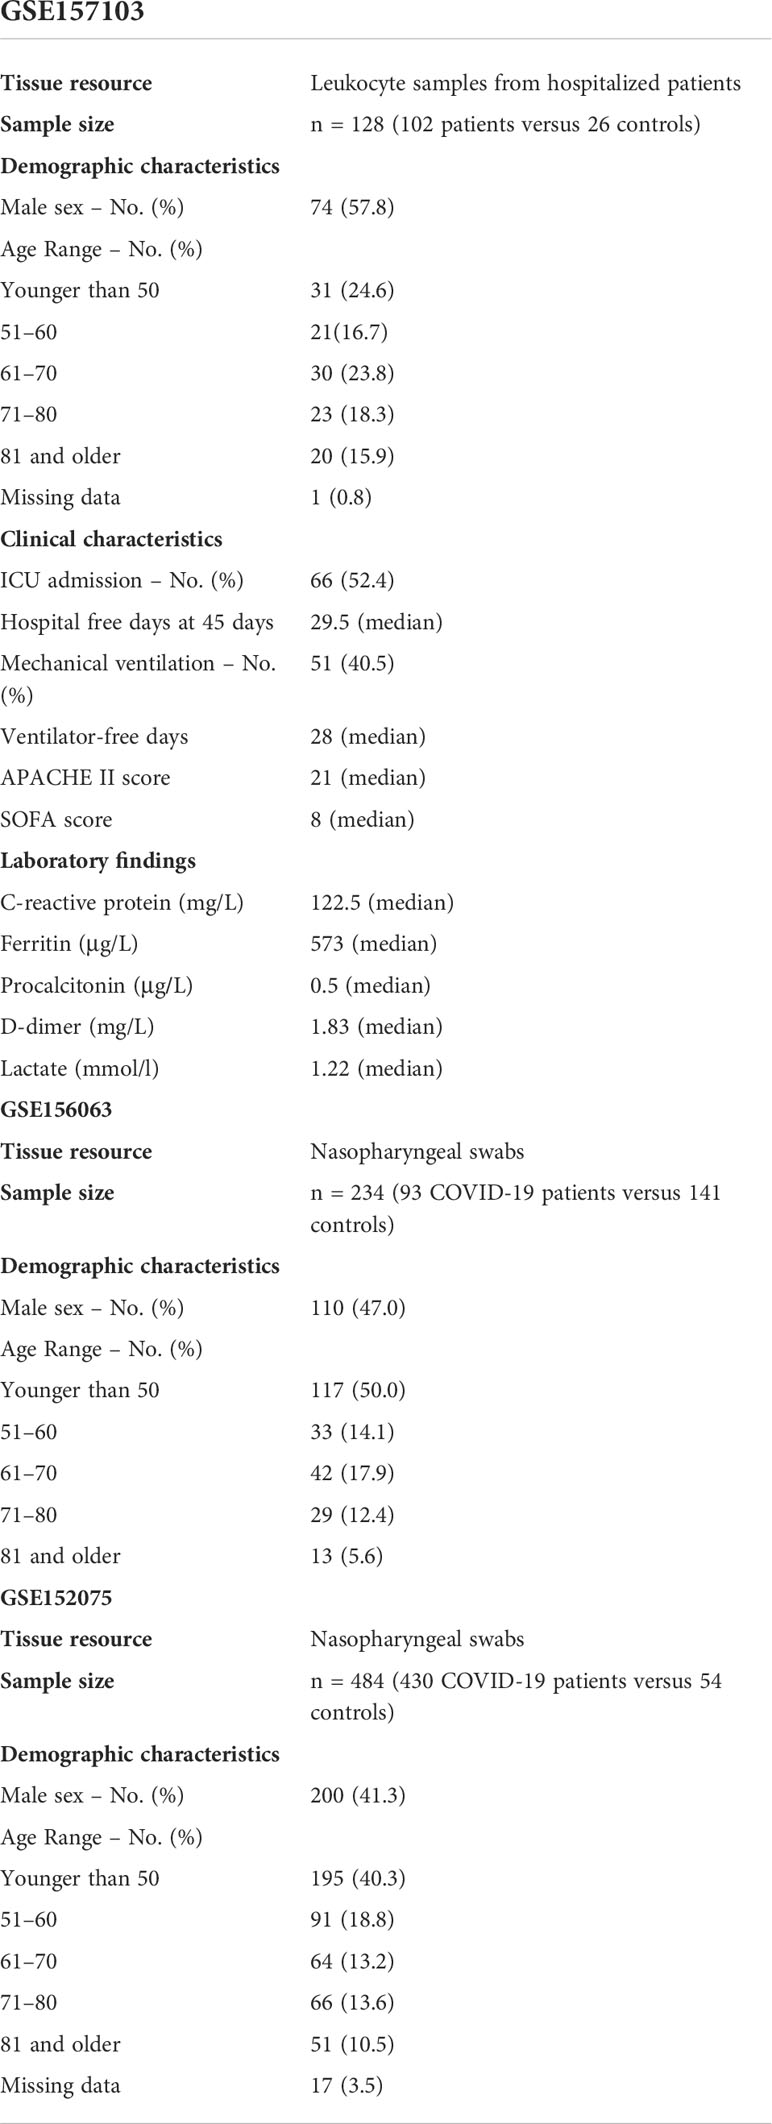
Table 1 A summary of the datasets.
Quantifying immune signatures’ enrichment levels
The single-sample gene-set enrichment analysis (ssGSEA) (19) was utilized to evaluate an immune signature’s enrichment level in a COVID-19 patient based on the expression profiles of its marker genes. The ssGSEA output the enrichment score of a gene set in a sample based on the degree of the genes in the gene set coordinately up- or down-regulated in the sample (19). The ratios of two immune signatures were defined as the base-2 log-transformed values of the geometric mean expression levels of all marker genes of an immune signature divided by those of another immune signature. The marker genes of the immune signatures analyzed were shown in Table 2.
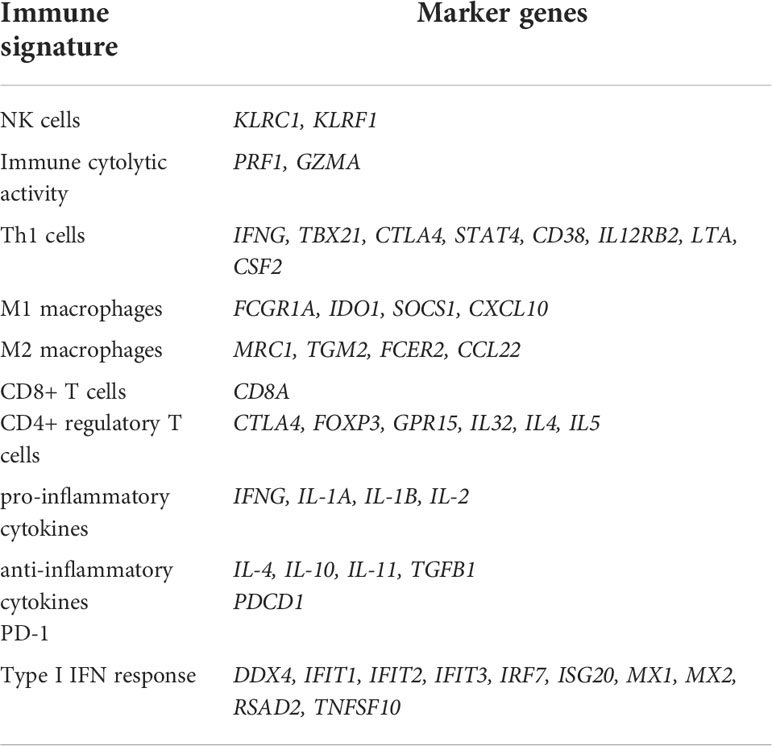
Table 2 Immune signatures and their marker genes.
Identifying DEGs between COVID-19 patients and normal people
We identified DEGs between COVID-19 patients and normal people by Student’s t test with a threshold of adjusted P-value < 0.05 and mean expression fold change (FC) > 1.5. The Benjamini-Hochberg method (20) was used to calculate the false discovery rate (FDR) to adjust for P-values in multiple tests.
Clustering analysis
We hierarchically clustered COVID-19 patients based on the expression profiles of the common DEGs between COVID-19 patients and normal people in the three datasets.
Before clustering, we normalized gene expression values by z-score and transformed them into distance matrices by the R function “dist” with the parameter: method = “Euclidean.” The hierarchical clustering was performed with the function “hclust” in the R package “Stats” with the parameters: method = “ward.D2” and members = NULL.
Statistical analysis and visualization
In comparisons of two classes of data, the Mann–Whitney U test was used if they were not normally distributed; otherwise, Student’s t test was utilized. The Pearson or Spearman method was employed to evaluate the correlation between two groups of data. The Fisher’s exact test was utilized to evaluate the association between two categorical variables. With the input of a significance level of 0.05, large effect sizes recommended by Cohen (21), and the sample sizes of COVID-19 patients and normal controls in the datasets into related functions in the R package “pwr“, we performed power calculations for all statistical tests in this study. All statistical analyses were performed in the R programming environment (version 4.1.2). The R package “ggplot2” was utilized to plot figures.
Results
Common DEGs between COVID-19 patients and normal people in the three datasets
This analysis found 13 genes whose expression levels were significantly higher in COVID-19 patients than in normal controls, consistently in the three datasets (two-tailed Student’s t test, FDR < 0.05; FC > 1.5). These genes included OAS1, OAS2, OAS3, OASL, HERC6, SERPING1, IFI6, IFI44, IFI44L, CMPK2, RSAD2, EPSTI1, and CXCL10 (Table 3).

Table 3 The 13 genes significantly upregulated in COVID-19 patients.
Notably, all these genes are involved in antiviral immune responses or immune regulation (22–30). Among these genes, four genes (OAS1, OAS2, OAS3, and OASL) encode members of the 2′–5′-oligoadenylate synthetase (OAS) family (31). It is justified that these genes are upregulated in COVID-19 patients since the OAS family plays important roles in the antiviral activity of interferons (32). HERC6 (HECT And RLD Domain Containing E3 Ubiquitin Protein Ligase Family Member 6) is related to pathways of class I MHC mediated antigen processing and presentation and innate immune system (33, 34). SERPING1 (serpin family G member 1) encodes a highly glycosylated plasma protein functioning in the regulation of the complement cascade (35). Several genes encode proteins induced by interferon, including IFI6 (interferon alpha inducible protein 6), IFI44 (interferon induced protein 44), and IFI44L (interferon induced protein 44 like). CMPK2 (cytidine/uridine monophosphate kinase 2) encodes an enzyme in the nucleotide synthesis salvage pathway involved in the regulation of terminal differentiation of monocytic cells (36). RSAD2 (radical S-adenosyl methionine domain containing 2) encodes a member of the S-adenosyl-L-methionine (SAM) superfamily of enzymes, which is an interferon-inducible antiviral protein playing a role in antiviral response and innate immune signaling (37). EPSTI1 (epithelial stromal interaction 1) encodes a protein playing a role in M1 macrophage polarization (27). CXCL10 (C-X-C motif chemokine ligand 10) is an antimicrobial gene encoding a chemokine of the CXC subfamily and ligand for the receptor CXCR3. The binding of CXCL10 to CXCR3 exerts pleiotropic effects on immune regulation (38). CXCL10 could also regulate the “cytokine storm” response to SARS-CoV-2 infection (39).
This analysis found that the 13 upregulated genes likely had significant positive expression correlations with the genes which are key regulators of SARS-CoV-2 infection, including ACE2, TMPRSS2, AAK1, CTSB, CTSL, FURIN, GAK, and TPCN2 (6–8, 40–43) (Pearson correlation, P < 0.05) (Figure 1A, Supplementary Figure S1). Interestingly, these genes were significantly downregulated in the intensive care unit (ICU) COVID-19 patients versus non-ICU patients (two-tailed Student’s t test, FDR < 0.05; FC > 1.5) in GSE157103 (Figure 1B). 11 of the 13 genes were significantly downregulated in the mechanical ventilatory support (MVS) patients versus non-MVS patients (FDR < 0.05; FC > 1.5) (Figure 1C). Moreover, all these genes showed significant negative expression correlations with D-dimer levels (Spearman correlation, FDR < 0.05) (Figure 1D), whose elevation was associated with COVID-19 severity (44). In GSE152075, the expression levels of the 13 genes were significantly and negatively correlated with viral loads (Spearman correlation, FDR < 0.05) (Figure 1E). In addition, this analysis found that many of the 13 genes had significant negative expression correlations with ages of COVID-19 patients (Figure 1F). Taken together, these results indicate that upregulation of these molecules is associated with better clinical outcomes in COVID-19 patients.
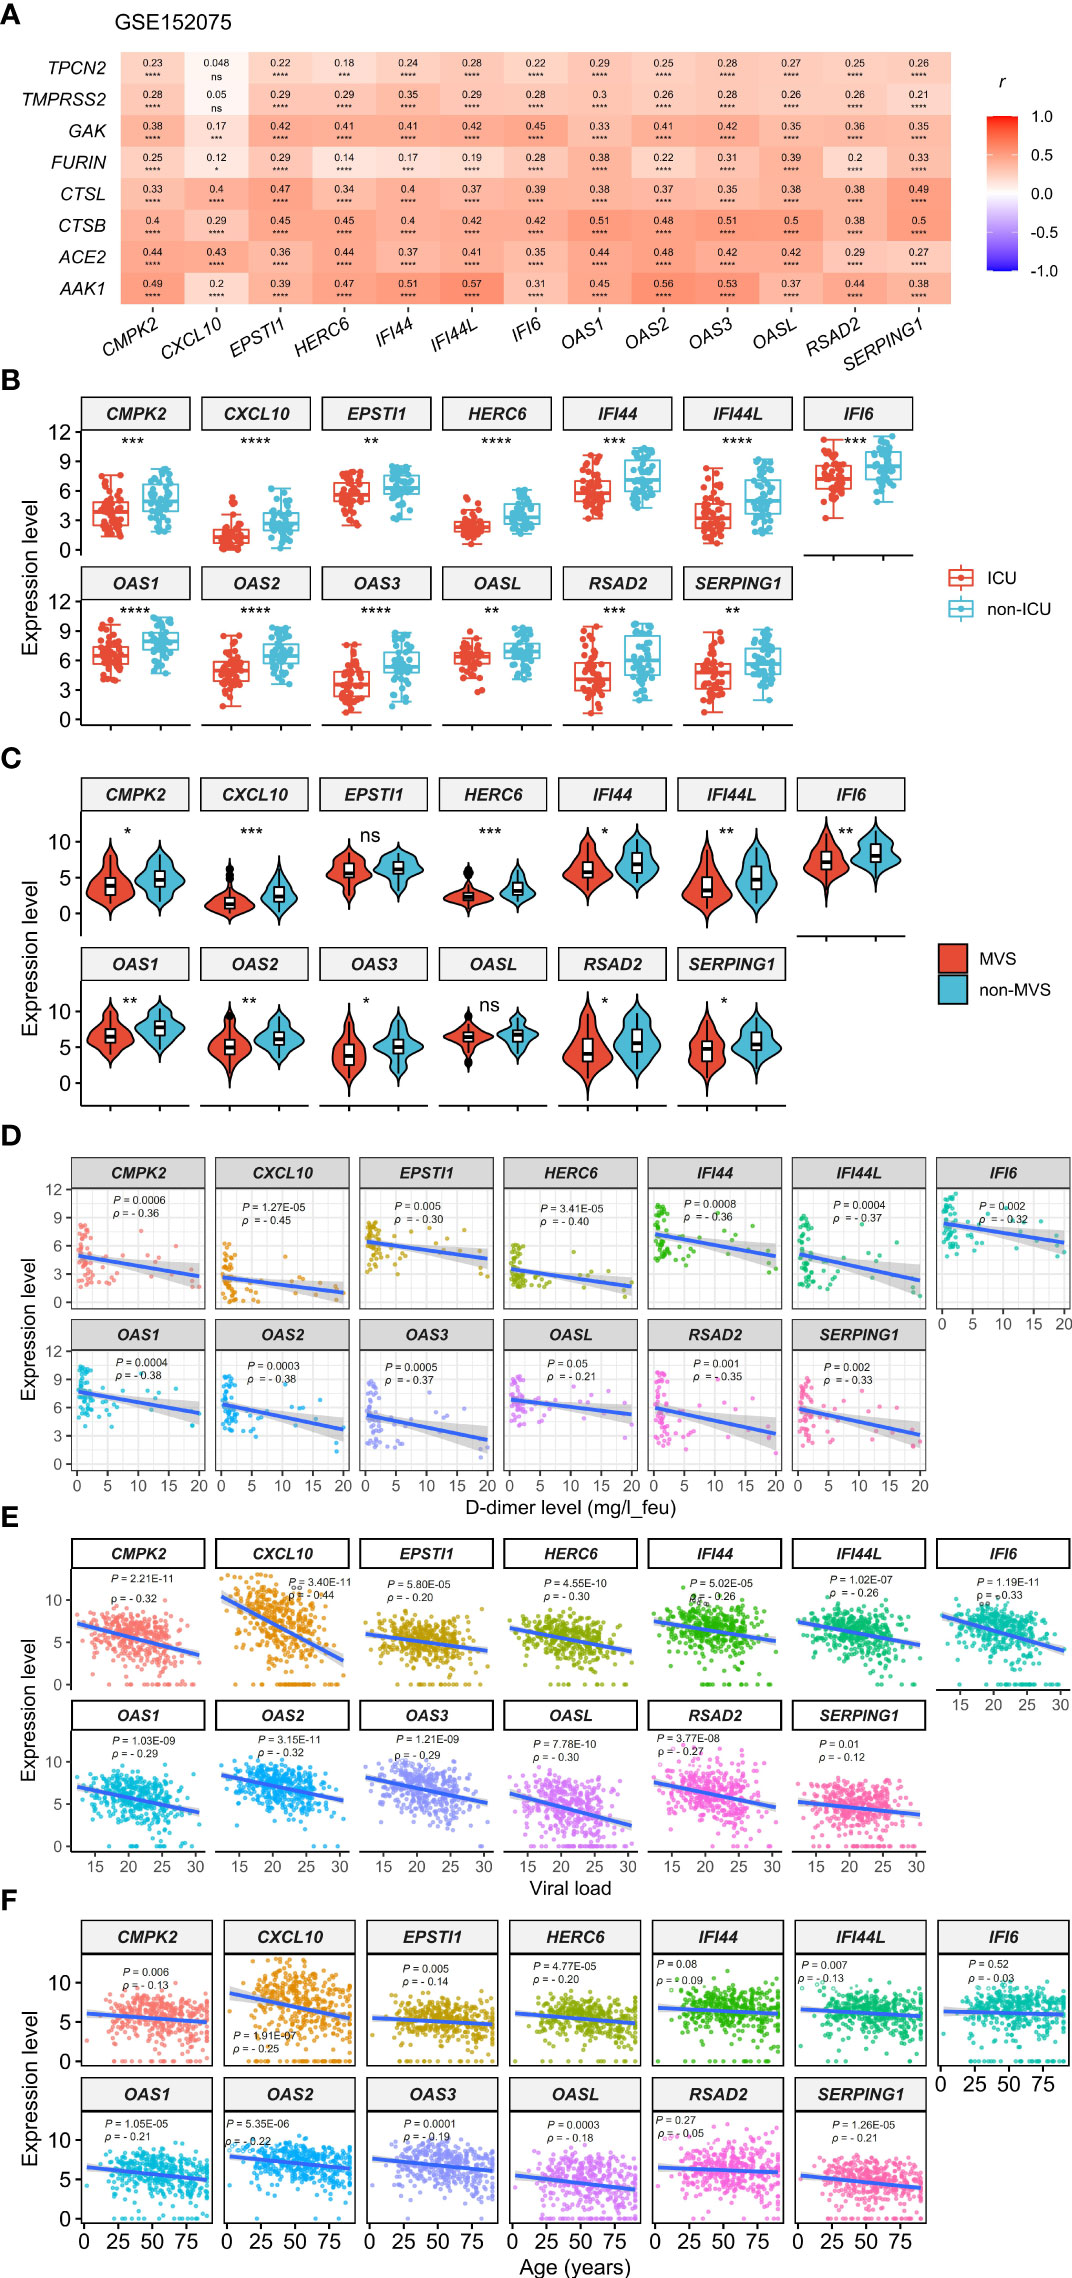
Figure 1 Expression correlations of the 13 genes upregulated in COVID-19 patients with the key regulators of SARS-CoV-2 infection and clinical features of COVID-19 patients. (A) Heatmap showing expression correlations between the 13 genes and 8 key regulators of SARS-CoV-2 infection in GSE152075. Pearson correlation coefficients (r) and P-values are shown. (B, C) Comparisons of the 13 genes’ expression levels between ICU and non-ICU, and between MVS and non-MVS COVID-19 patients. Two-tailed student’s t test P-values are shown. (D–F) Expression correlations of the 13 genes with D-dimer levels, viral loads, and ages of COVID-19 patients. Spearman correlation coefficients (ρ) and P-values are shown. The results shown in (B–F) were obtained by analyzing the dataset GSE157103. ICU, intensive care unit; MVS, mechanical ventilatory support. *P < 0.05, **P < 0.01, ***P < 0.001, ****P < 0.0001, ns: not significant. They also apply to the following figures.
Identification of COVID-19 subtypes based on expression profiles of the 13 upregulated genes in COVID-19 patients
Based on the expression levels of the 13 genes upregulated in COVID-19 patients, we identified two COVID-19 clusters consistently in the three datasets (GSE152075, GSE156063, and GSE157103) by hierarchical clustering. We termed them COV-C1 and COV-C2, respectively (Figure 2A). The 13 genes had significantly higher expression levels in COV-C2 than in COV-C1 (FDR < 0.05; FC > 1.5) (Figure 2B). In GSE152075, COV-C2 patients were younger than COV-C1 patients (one-tailed Mann–Whitney U test, P = 7.61 × 10⁻⁵), while COV-C2 had significantly lower viral loads than COV-C1 (P = 3.67 × 10⁻¹⁰) (Figure 3A). It indicates a significantly negative association between age and viral loads, in line with a previous report (45). In GSE157103, the proportion of ICU patients was significantly lower in COV-C2 than in COV-C1 (37.7% versus 69.3%; Fisher’s exact test, P = 0.004); the proportion of MVS patients was also significantly lower in COV-C2 than in COV-C1 (31.1% versus 59.0%; Fisher’s exact test, P = 0.007) (Figure 3B). Ventilator-free days is a measure of outcomes in treating acute respiratory distress syndrome and correlate inversely with disease severity (46). This analysis found that COV-C2 patients were with significantly more ventilator-free days than COV-C1 patients (P = 0.01) (Figure 3C). In addition, several COVID-19 severity-associated laboratory measurements, such as D-dimer and procalcitonin, displayed significantly lower levels in COV-C2 than in COV-C1 (P < 0.02) (Figure 3C). Altogether, these results indicated better outcomes in COV-C2 compared with COV-C1.
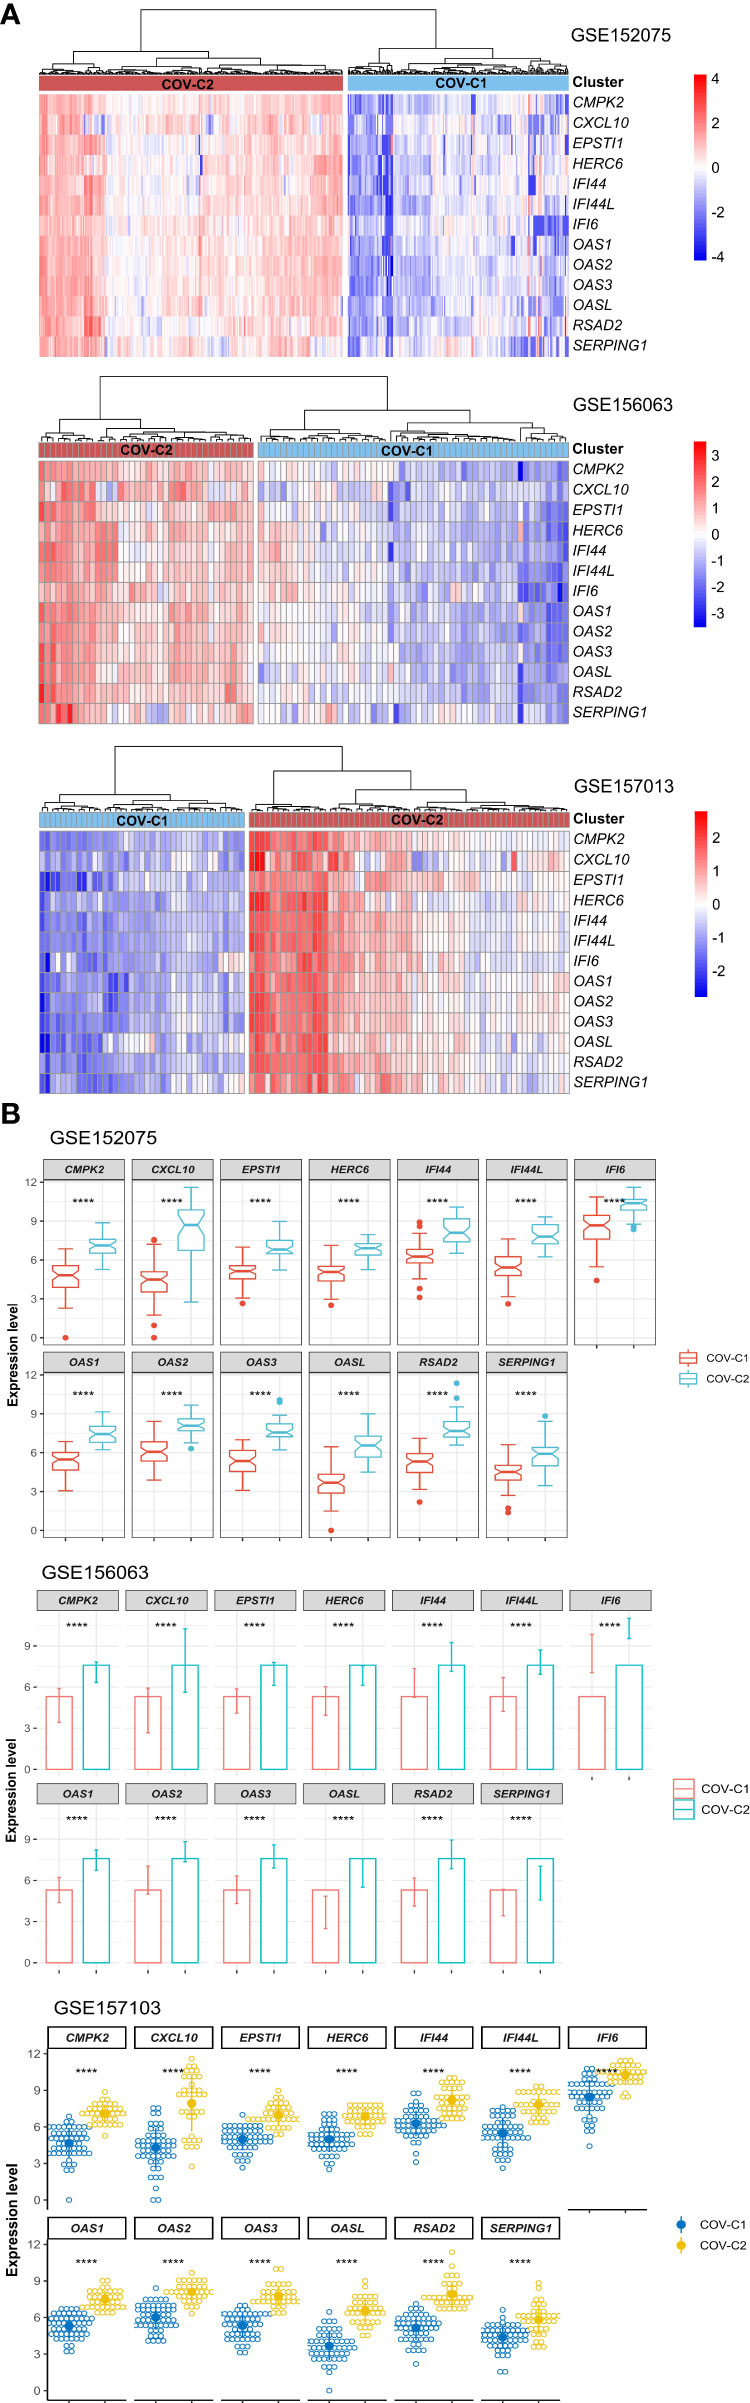
Figure 2 Identification of COVID-19 subtypes based on expression profiles of the 13 upregulated genes in COVID-19 patients. (A) Hierarchical clustering identifying two COVID-19 subtypes: COV-C1 and COV-C2, consistently in three datasets. (B) The 13 genes have significantly higher expression levels in COV-C2 than in COV-C1. Two-tailed student’s t test P-values are shown. ****P < 0.0001.
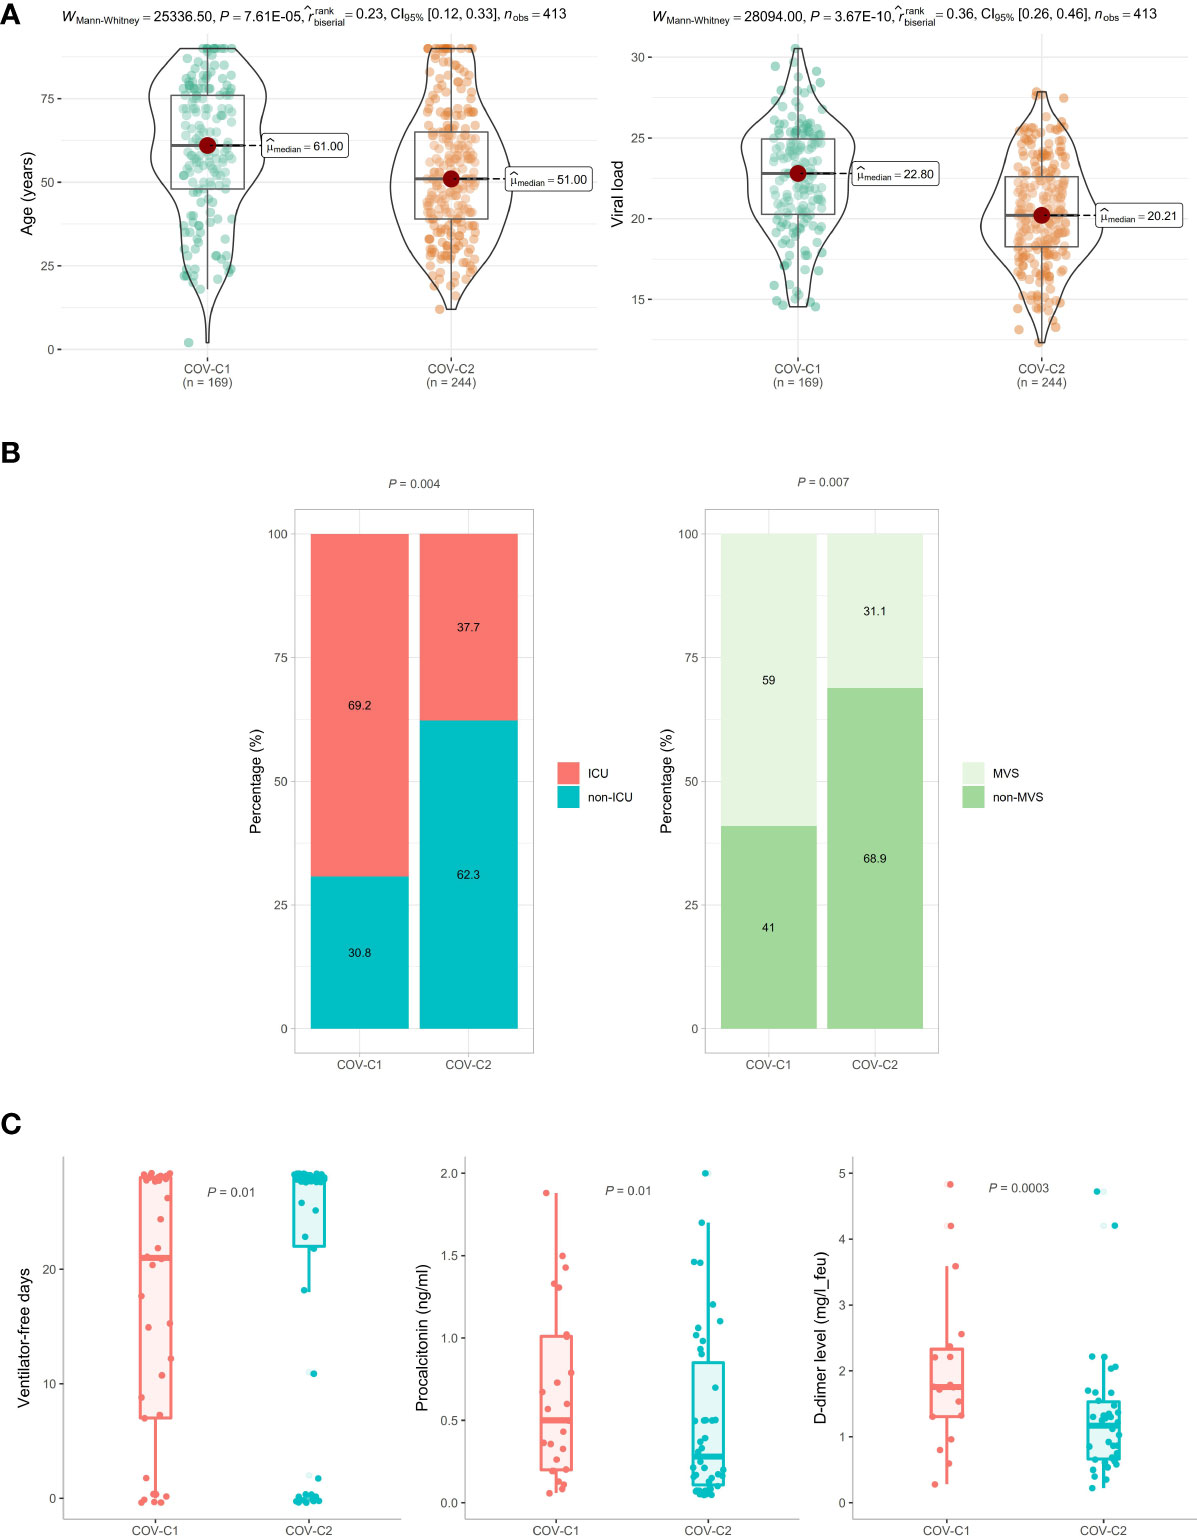
Figure 3 Comparisons of clinical features between COV-C1 and COV-C2 patients. (A) In GSE152075, COV-C2 patients are younger and have significantly lower viral loads than COV-C1 patients. (B) COV-C2 has significantly lower proportions of ICU patients and MVS patients than COV-C1. Fisher’s exact test P-values are shown. (C) COV-C2 patients are with significantly more ventilator-free days and have significantly lower levels of D-dimer and procalcitonin than COV-C1 patients. One-tailed Mann–Whitney U test P-values are shown. The results shown in (B, C) were obtained by analyzing the dataset GSE157103.
COV-C2 patients have significantly stronger antiviral immune signatures than COV-C1 patients
We compared the enrichment scores (ssGSEA scores) of five antiviral immune signatures between COV-C1 and COV-C2. These immune signatures included NK cells, immune cytolytic activity, type I interferon (IFN) response, M1 macrophages, and Th1 cells. This analysis found that the enrichment scores of these immune signatures were likely higher in COV-C2 than in COV-C1 (Figure 4A). Moreover, the ratios of immunostimulatory/immunoinhibitory signatures (CD8+/CD4+ regulatory T cells, M1/M2 macrophages, pro-/anti-inflammatory cytokines, and CD8+/PD-1) were likely higher in COV-C2 than in COV-C1 (Figure 4B). Altogether, these results suggested the stronger antiviral immune responses displayed in COV-C2 versus COV-C1 patients. The stronger antiviral immune responses could contribute to better outcomes in COV-C2 relative to COV-C1 patients.
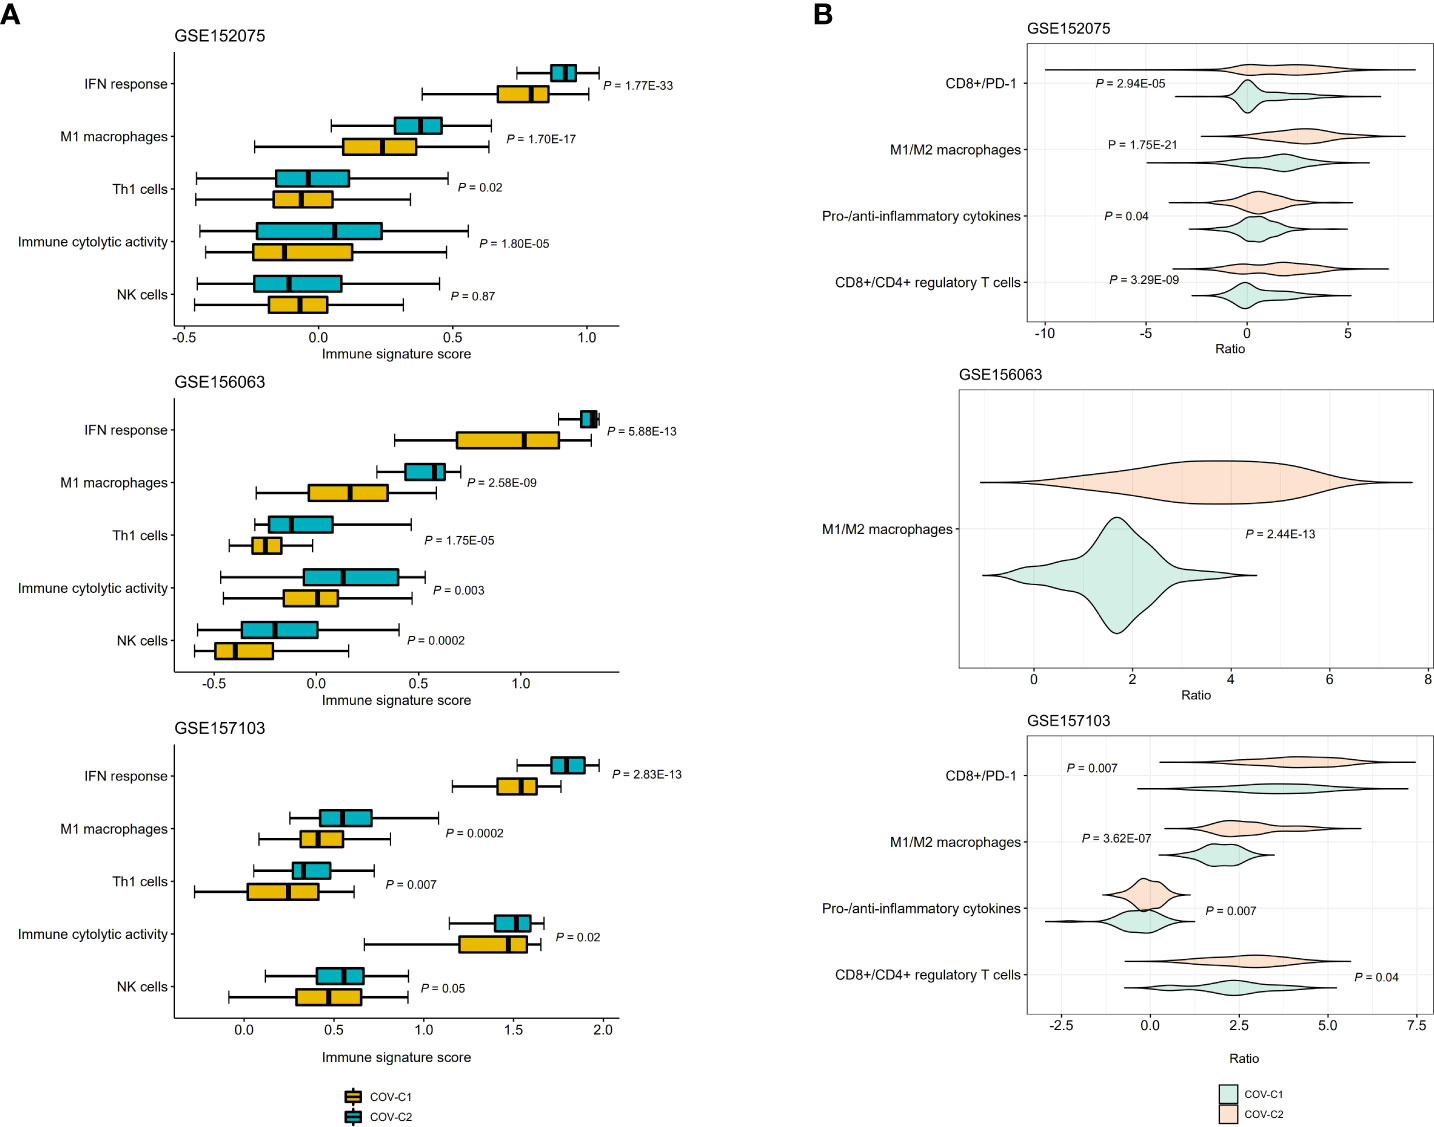
Figure 4 Comparisons of antiviral immune signatures between COV-C1 and COV-C2 patients. (A) COV-C2 patients likely have higher enrichment scores of antiviral immune signatures than COV-C1 patients. One-tailed Mann–Whitney U test P-values are shown. (B) COV-C2 patients have significantly higher ratios of immunostimulatory over immunoinhibitory signatures. Two-tailed student’s t test P-values are shown.
Discussion
In this study, we identified 13 genes significantly upregulated in COVID-19 patients’ leukocyte and SARS-CoV-2-infected nasopharyngeal tissue. This analysis found that all these genes are involved in the regulation of host immune signaling. Moreover, these genes’ upregulation is likely associated with better clinical outcomes in COVID-19 patients. It is justified since these molecules’ upregulation is associated with increased antiviral immune responses to reduce COVID-19 disease severity. Based on the expression profiles of the 13 genes, we uncovered two COVID-19 subtypes (COV-C1 and COV-C2) reproducibly in three different datasets. Compared with COV-C1, COV-C2 more highly expressed these upregulated genes in COVID-19 patients and had stronger antiviral immune responses. As a result, COV-C2 displayed more favorable clinical outcomes.
The expression levels of the 13 genes were likely to correlate negatively with ages of COVID-19 patients, and COV-C1 patients were younger than COV-C1 patients. These results suggest that younger patients have stronger antiviral immune responses than old patients. It could partially explain why younger patients are less likely to develop severe COVID-19 (9). Intriguingly, younger patients had lower viral loads than old patients, although the former displayed stronger antiviral immune responses than the latter. It is reasonable since the stronger antiviral immune responses promote the elimination of more SARS-CoV-2 viruses in younger patients.
Our results showed no significant association between sex and antiviral immune responses in COVID-19 patients, although female patients are likely to have better prognosis than male patients (10). In fact, some other factors could be responsible for the better outcomes in female versus male patients, such as estrogen levels (47), C-reactive protein abundance (48), lifestyle (49), underlying conditions (50), and renin-angiotensin system (51).
Our results suggest that a strong antiviral immune response is essential in reducing severity of COVID-19. However, excessive immune response, known as “cytokine storm,” may result in worse clinical outcomes in COVID-19 patients (52). These results collectively indicate that both insufficient and excessive immune responses may contribute to COVID-19 severity.
This study has several limitations. First, this study obtained the results merely by bioinformatics analyses, whose reliability needs to be validated by experimental and clinical data. Second, because the sample size in this study is limited, the results need to be supported by analyzing more datasets. Nevertheless, the power analysis showed that all the powers of the statistical tests were greater than 0.95 using a significance threshold of 0.05, large effect sizes, and the sample sizes of the datasets. Finally, the results and conclusions were obtained by analyzing mRNA expression data. However, the gene expression pattern is not necessarily identical to the protein expression pattern due to some factors influencing the mapping from gene expression to protein expression, e.g., post-translational modification. Thus, the verification of our findings at protein level is a must.
Data availability statement
The original contributions presented in the study are included in the article/Supplementary Material. Further inquiries can be directed to the corresponding authors.
Ethics statement
Ethical review and approval was not required for the study on human participants in accordance with the local legislation and institutional requirements. The patients/participants provided their written informed consent to participate in this study.
Author contributions
ZD: software, validation, formal analysis, investigation, data curation, visualization, writing-review & editing. QY: Software, validation, formal analysis, visualization. WC: software, validation, investigation. ZL: investigation, supervision, funding acquisition. XW: conceptualization, methodology, resources, investigation, writing-original draft, writing-review & editing, supervision, project administration, funding acquisition. All authors contributed to the article and approved the submitted version.
Funding
This work was supported by the China Pharmaceutical University (grant number 3150120001 to XW), Natural Science Foundation of Jiangsu Province (grant number BK20201090 to ZL), and China Postdoctoral Science Foundation (grant number 2021M691338 to ZL).
Conflict of interest
The authors declare that the research was conducted in the absence of any commercial or financial relationships that could be construed as a potential conflict of interest.
Publisher’s note
All claims expressed in this article are solely those of the authors and do not necessarily represent those of their affiliated organizations, or those of the publisher, the editors and the reviewers. Any product that may be evaluated in this article, or claim that may be made by its manufacturer, is not guaranteed or endorsed by the publisher.
Supplementary material
The Supplementary Material for this article can be found online at: https://www.frontiersin.org/articles/10.3389/fimmu.2022.930866/full#supplementary-material
Supplementary Figure 1 | Heatmap showing expression correlations between the 13 genes and 8 key regulators of SARS-CoV-2 infection in GSE157103 and GSE156063. Pearson correlation coefficients (r) and P-values are shown.
Supplementary Table 1 | The details on the datasets used in this study.
References
1. Layer JV, Debaize L, Van Scoyk A, House NC, Brown AJ, Liu Y, et al. Polymerase delta promotes chromosomal rearrangements and imprecise double-strand break repair. Proc Natl Acad Sci USA (2020) 117(44):27566–77. doi: 10.1073/pnas.2014176117
2. Viana R, Moyo S, Amoako DG, Tegally H, Scheepers C, Althaus CL, et al. Rapid epidemic expansion of the SARS-CoV-2 omicron variant in southern Africa. Nature (2022) 603(7902):679–86. doi: 10.1038/s41586-022-04411-y
3. Kuhn JH, Li W, Choe H, Farzan M. Angiotensin-converting enzyme 2: a functional receptor for SARS coronavirus. Cell Mol Life Sci (2004) 61(21):2738–43. doi: 10.1007/s00018-004-4242-5
4. Hoffmann M, Kleine-Weber H, Schroeder S, Kruger N, Herrler T, Erichsen S, et al. SARS-CoV-2 cell entry depends on ACE2 and TMPRSS2 and is blocked by a clinically proven protease inhibitor. Cell (2020) 181(2):271–80 e8. doi: 10.1016/j.cell.2020.02.052
5. Rahman N, Basharat Z, Yousuf M, Castaldo G, Rastrelli L, Khan H. Virtual screening of natural products against type II transmembrane serine protease (TMPRSS2), the priming agent of coronavirus 2 (SARS-CoV-2). Molecules (2020) 25(10):2271. doi: 10.3390/molecules25102271
6. Wu C, Zheng M, Yang Y, Gu X, Yang K, Li M, et al. Furin: A potential therapeutic target for COVID-19. iScience (2020) 23(10):101642. doi: 10.1016/j.isci.2020.101642
7. Di Maria E, Martini P, Gennarelli M. Naringerin as candidate drug against SARS-CoV-2: The role for TPC2 genomic variants in COVID-19. Pharmacol Res (2021) 164:105402. doi: 10.1016/j.phrs.2020.105402
8. Prasad K, Ahamad S, Gupta D, Kumar V. Targeting cathepsins: A potential link between COVID-19 and associated neurological manifestations. Heliyon (2021) 7(10):e08089. doi: 10.1016/j.heliyon.2021.e08089
9. Zhou F, Yu T, Du R, Fan G, Liu Y, Liu Z, et al. Clinical course and risk factors for mortality of adult inpatients with COVID-19 in wuhan, China: a retrospective cohort study. Lancet (2020) 395(10229):1054–62. doi: 10.1016/S0140-6736(20)30566-3
10. Onder G, Rezza G, Brusaferro S. Case-fatality rate and characteristics of patients dying in relation to COVID-19 in Italy. JAMA (2020) 323(18):1775–6. doi: 10.1001/jama.2020.4683
11. Lieberman NAP, Peddu V, Xie H, Shrestha L, Huang ML, Mears MC, et al. In vivo antiviral host transcriptional response to SARS-CoV-2 by viral load, sex, and age. PloS Biol (2020) 18(9):e3000849. doi: 10.1371/journal.pbio.3000849
12. Chen Z, Feng Q, Zhang T, Wang X. Identification of COVID-19 subtypes based on immunogenomic profiling. Int Immunopharmacol (2021) 96:107615. doi: 10.1016/j.intimp.2021.107615
13. Grant WB, Lahore H, McDonnell SL, Baggerly CA, French CB, Aliano JL, et al. Evidence that vitamin d supplementation could reduce risk of influenza and COVID-19 infections and deaths. Nutrients (2020) 12(4):988. doi: 10.3390/nu12040988
14. Javanmardi F, Keshavarzi A, Akbari A, Emami A, Pirbonyeh N. Prevalence of underlying diseases in died cases of COVID-19: A systematic review and meta-analysis. PloS One (2020) 15(10):e0241265. doi: 10.1371/journal.pone.0241265
15. Laing AG, Lorenc A, Del Molino Del Barrio I, Das A, Fish M, Monin L, et al. A dynamic COVID-19 immune signature includes associations with poor prognosis. Nat Med (2020) 26(10):1623–35. doi: 10.1038/s41591-020-1038-6
16. Huang L, Shi Y, Gong B, Jiang L, Zhang Z, Liu X, et al. Dynamic blood single-cell immune responses in patients with COVID-19. Signal Transduct Target Ther (2021) 6(1):110. doi: 10.1038/s41392-021-00526-2
17. Overmyer KA, Shishkova E, Miller IJ, Balnis J, Bernstein MN, Peters-Clarke TM, et al. Large-Scale multi-omic analysis of COVID-19 severity. Cell Syst (2021) 12(1):23–40 e7. doi: 10.1016/j.cels.2020.10.003
18. Mick E, Kamm J, Pisco AO, Ratnasiri K, Babik JM, Castaneda G, et al. Upper airway gene expression reveals suppressed immune responses to SARS-CoV-2 compared with other respiratory viruses. Nat Commun (2020) 11(1):5854. doi: 10.1038/s41467-020-19587-y
19. Hänzelmann S CR, Guinney J. GSVA: gene set variation analysis for microarray and RNA-seq data. BMC Bioinf (2013) 14:7. doi: 10.1186/1471-2105-14-7
20. Benjamini Y, Hochberg Y. Controlling the false discovery rate: a practical and powerful approach to multiple testing. J R Stat Soc B (1995) 57:289–300. doi: 10.1111/j.2517-6161.1995.tb02031.x
21. Serdar CC, Cihan M, Yucel D, Serdar MA. Sample size, power and effect size revisited: simplified and practical approaches in pre-clinical, clinical and laboratory studies. Biochem Med (Zagreb) (2021) 31(1):010502. doi: 10.11613/BM.2021.010502
22. Kristiansen H, Gad HH, Eskildsen-Larsen S, Despres P, Hartmann R. The oligoadenylate synthetase family: An ancient protein family with multiple antiviral activities. J Interferon Cytokine Res (2011) 31(1):41–7. doi: 10.1038/s41586-022-04411-y
23. Hochrainer K, Mayer H, Baranyi U, Binder B, Lipp J, Kroismayr R. The human HERC family of ubiquitin ligases: novel members, genomic organization, expression profiling, and evolutionary aspects. Genomics (2005) 85(2):153–64. doi: 10.1016/j.ygeno.2004.10.006
24. DeDiego ML, Martinez-Sobrido L, Topham DJ. Novel functions of IFI44L as a feedback regulator of host antiviral responses. J Virol (2019) 93(21):e01159–19. doi: 10.1128/JVI.01159-19
25. DeDiego ML, Nogales A, Martinez-Sobrido L, Topham DJ. Interferon-induced protein 44 interacts with cellular FK506-binding protein 5, negatively regulates host antiviral responses, and supports virus replication. mBio (2019) 10(4):e01839–19. doi: 10.1128/mBio.01839-19
26. Lai JH, Wu DW, Wu CH, Hung LF, Huang CY, Ka SM, et al. Mitochondrial CMPK2 mediates immunomodulatory and antiviral activities through IFN-dependent and IFN-independent pathways. iScience (2021) 24(6):102498. doi: 10.1016/j.isci.2021.102498
27. Kim Y-H, Lee J-R, Hahn M-J. Regulation of inflammatory gene expression in macrophages by epithelial-stromal interaction 1 (Epsti1). Biochem Biophys Res Commun (2018) 496(2):778–83. doi: 10.1016/j.bbrc.2017.12.014
28. Lee EY, Lee Z-H, Song YW. CXCL10 and autoimmune diseases. Autoimmun Rev (2009) 8(5):379–83. doi: 10.1016/j.autrev.2008.12.002
29. Severa M, Coccia EM, Fitzgerald KA. Toll-like receptor-dependent and -independent viperin gene expression and counter-regulation by PRDI-binding factor-1/BLIMP1. J Biol Chem (2006) 281(36):26188–95. doi: 10.1074/jbc.M604516200
30. Hochrainer K, Mayer H, Baranyi U, Binder B, Lipp J, Kroismayr R. The human HERC family of ubiquitin ligases: novel members, genomic organization, expression profilin`g, and evolutionary aspects. Genomics (2005) 85(2):153–64. doi: 10.1016/j.ygeno.2004.10.006
31. Justesen J, Hartmann R, Kjeldgaard NO. Gene structure and function of the 2'-5'-oligoadenylate synthetase family. Cell Mol Life Sci (2000) 57(11):1593–612. doi: 10.1007/PL00000644
32. Eskildsen S, Justesen J, Schierup MH, Hartmann R. Characterization of the 2'-5'-oligoadenylate synthetase ubiquitin-like family. Nucleic Acids Res (2003) 31(12):3166–73. doi: 10.1093/nar/gkg427
33. Jacquet S, Pontier D, Etienne L. Rapid evolution of HERC6 and duplication of a chimeric HERC5/6 gene in rodents and bats suggest an overlooked role of HERCs in mammalian immunity. Front Immunol (2020) 11:605270. doi: 10.3389/fimmu.2020.605270
34. Mao X, Sethi G, Zhang Z, Wang Q. The emerging roles of the HERC ubiquitin ligases in cancer. Curr Pharm Design (2018) 24(15):1676–81. doi: 10.2174/1381612824666180528081024
35. Defendi F, Thielens NM, Clavarino G, Cesbron JY, Dumestre-Perard C. The immunopathology of complement proteins and innate immunity in autoimmune disease. Clin Rev Allergy Immunol (2020) 58(2):229–51. doi: 10.1007/s12016-019-08774-5
36. Xu Y, Johansson M, Karlsson A. Human UMP-CMP kinase 2, a novel nucleoside monophosphate kinase localized in mitochondria. J Biol Chem (2008) 283(3):1563–71. doi: 10.1074/jbc.M707997200
37. Honarmand Ebrahimi K. A unifying view of the broad-spectrum antiviral activity of RSAD2 (viperin) based on its radical-SAM chemistry. Metallomics (2018) 10(4):539–52. doi: 10.1039/C7MT00341B
38. Tokunaga R, Zhang W, Naseem M, Puccini A, Berger MD, Soni S, et al. CXCL9, CXCL10, CXCL11/CXCR3 axis for immune activation - a target for novel cancer therapy. Cancer Treat Rev (2018) 63:40–7. doi: 10.1016/j.ctrv.2017.11.007
39. Coperchini F, Chiovato L, Croce L, Magri F, Rotondi M. The cytokine storm in COVID-19: An overview of the involvement of the chemokine/chemokine-receptor system. Cytokine Growth Factor Rev (2020) 53:25–32. doi: 10.1016/j.cytogfr.2020.05.003
40. Wickenhagen A, Sugrue E, Lytras S, Kuchi S, Noerenberg M, Turnbull ML, et al. A prenylated dsRNA sensor protects against severe COVID-19. Science (2021) 374(6567):eabj3624. doi: 10.1126/science.abj3624
41. Praissman JL, Wells L. Proteomics-based insights into the SARS-CoV-2-Mediated COVID-19 pandemic: A review of the first year of research. Mol Cell Proteomics (2021) 20:100103. doi: 10.1016/j.mcpro.2021.100103
42. Liu T, Luo S, Libby P, Shi GP. Cathepsin l-selective inhibitors: A potentially promising treatment for COVID-19 patients. Pharmacol Ther (2020) 213:107587. doi: 10.1016/j.pharmthera.2020.107587
43. Praveen D, Puvvada RC, M VA. Janus kinase inhibitor baricitinib is not an ideal option for management of COVID-19. Int J Antimicrob Agents (2020) 55(5):105967. doi: 10.1016/j.ijantimicag.2020.105967
44. Rostami M, Mansouritorghabeh H. D-dimer level in COVID-19 infection: a systematic review. Expert Rev Hematol (2020) 13(11):1265–75. doi: 10.1080/17474086.2020.1831383
45. Euser S, Aronson S, Manders I, van Lelyveld S, Herpers B, Sinnige J, et al. SARS-CoV-2 viral-load distribution reveals that viral loads increase with age: a retrospective cross-sectional cohort study. Int J Epidemiol (2022) 50(6):1795–803. doi: 10.1093/ije/dyab145
46. Lin B, Ferguson C, White JT, Wang S, Vessella R, True LD, et al. Prostate-localized and androgen-regulated expression of the membrane-bound serine protease TMPRSS2. Cancer Res (1999) 59(17):4180–4.
47. Sund M, Fonseca-Rodriguez O, Josefsson A, Welen K, Fors Connolly AM. Association between pharmaceutical modulation of oestrogen in postmenopausal women in Sweden and death due to COVID-19: a cohort study. BMJ Open (2022) 12(2):e053032. doi: 10.1136/bmjopen-2021-053032
48. Mussini C, Cozzi-Lepri A, Menozzi M, Meschiari M, Franceschini E, Rogati C, et al. Better prognosis in females with severe COVID-19 pneumonia: possible role of inflammation as potential mediator. Clin Microbiol Infect (2021) 27(8):1137–44. doi: 10.1016/j.cmi.2020.12.010
49. The Lancet. The gendered dimensions of COVID-19. Lancet (2020) 395(10231):1168. doi: 10.1016/S0140-6736(20)30823-0
50. Mohamed MO, Gale CP, Kontopantelis E, Doran T, de Belder M, Asaria M, et al. Sex differences in mortality rates and underlying conditions for COVID-19 deaths in England and Wales. Mayo Clin Proc (2020) 95(10):2110–24. doi: 10.1016/j.mayocp.2020.07.009
51. Viveiros A, Rasmuson J, Vu J, Mulvagh SL, Yip CYY, Norris CM, et al. Sex differences in COVID-19: candidate pathways, genetics of ACE2, and sex hormones. Am J Physiol Heart Circ Physiol (2021) 320(1):H296–304. doi: 10.1152/ajpheart.00755.2020
Keywords: COVID-19, intensive care unit, mechanical ventilatory support, viral loads, antiviral immune responses, COVID-19 clusters
Citation: Dong Z, Yan Q, Cao W, Liu Z and Wang X (2022) Identification of key molecules in COVID-19 patients significantly correlated with clinical outcomes by analyzing transcriptomic data. Front. Immunol. 13:930866. doi: 10.3389/fimmu.2022.930866
Received: 20 May 2022; Accepted: 03 August 2022;
Published: 22 August 2022.
Edited by:
Guido Poli, Vita-Salute San Raffaele University, ItalyReviewed by:
Gajanan Katkar, University of California, San Diego, United StatesGeorgia Damoraki, National and Kapodistrian University of Athens, Greece
Copyright © 2022 Dong, Yan, Cao, Liu and Wang. This is an open-access article distributed under the terms of the Creative Commons Attribution License (CC BY). The use, distribution or reproduction in other forums is permitted, provided the original author(s) and the copyright owner(s) are credited and that the original publication in this journal is cited, in accordance with accepted academic practice. No use, distribution or reproduction is permitted which does not comply with these terms.
*Correspondence: Zhixian Liu, liuzhixian@njmu.edu.cn; Xiaosheng Wang, xiaosheng.wang@cpu.edu.cn