
COVID-19 Effects and Resilience of Vegetable Farmers in North-Western Nigeria

 ,
,  and
and
Abstract
:1. Introduction
2. Materials and Methods
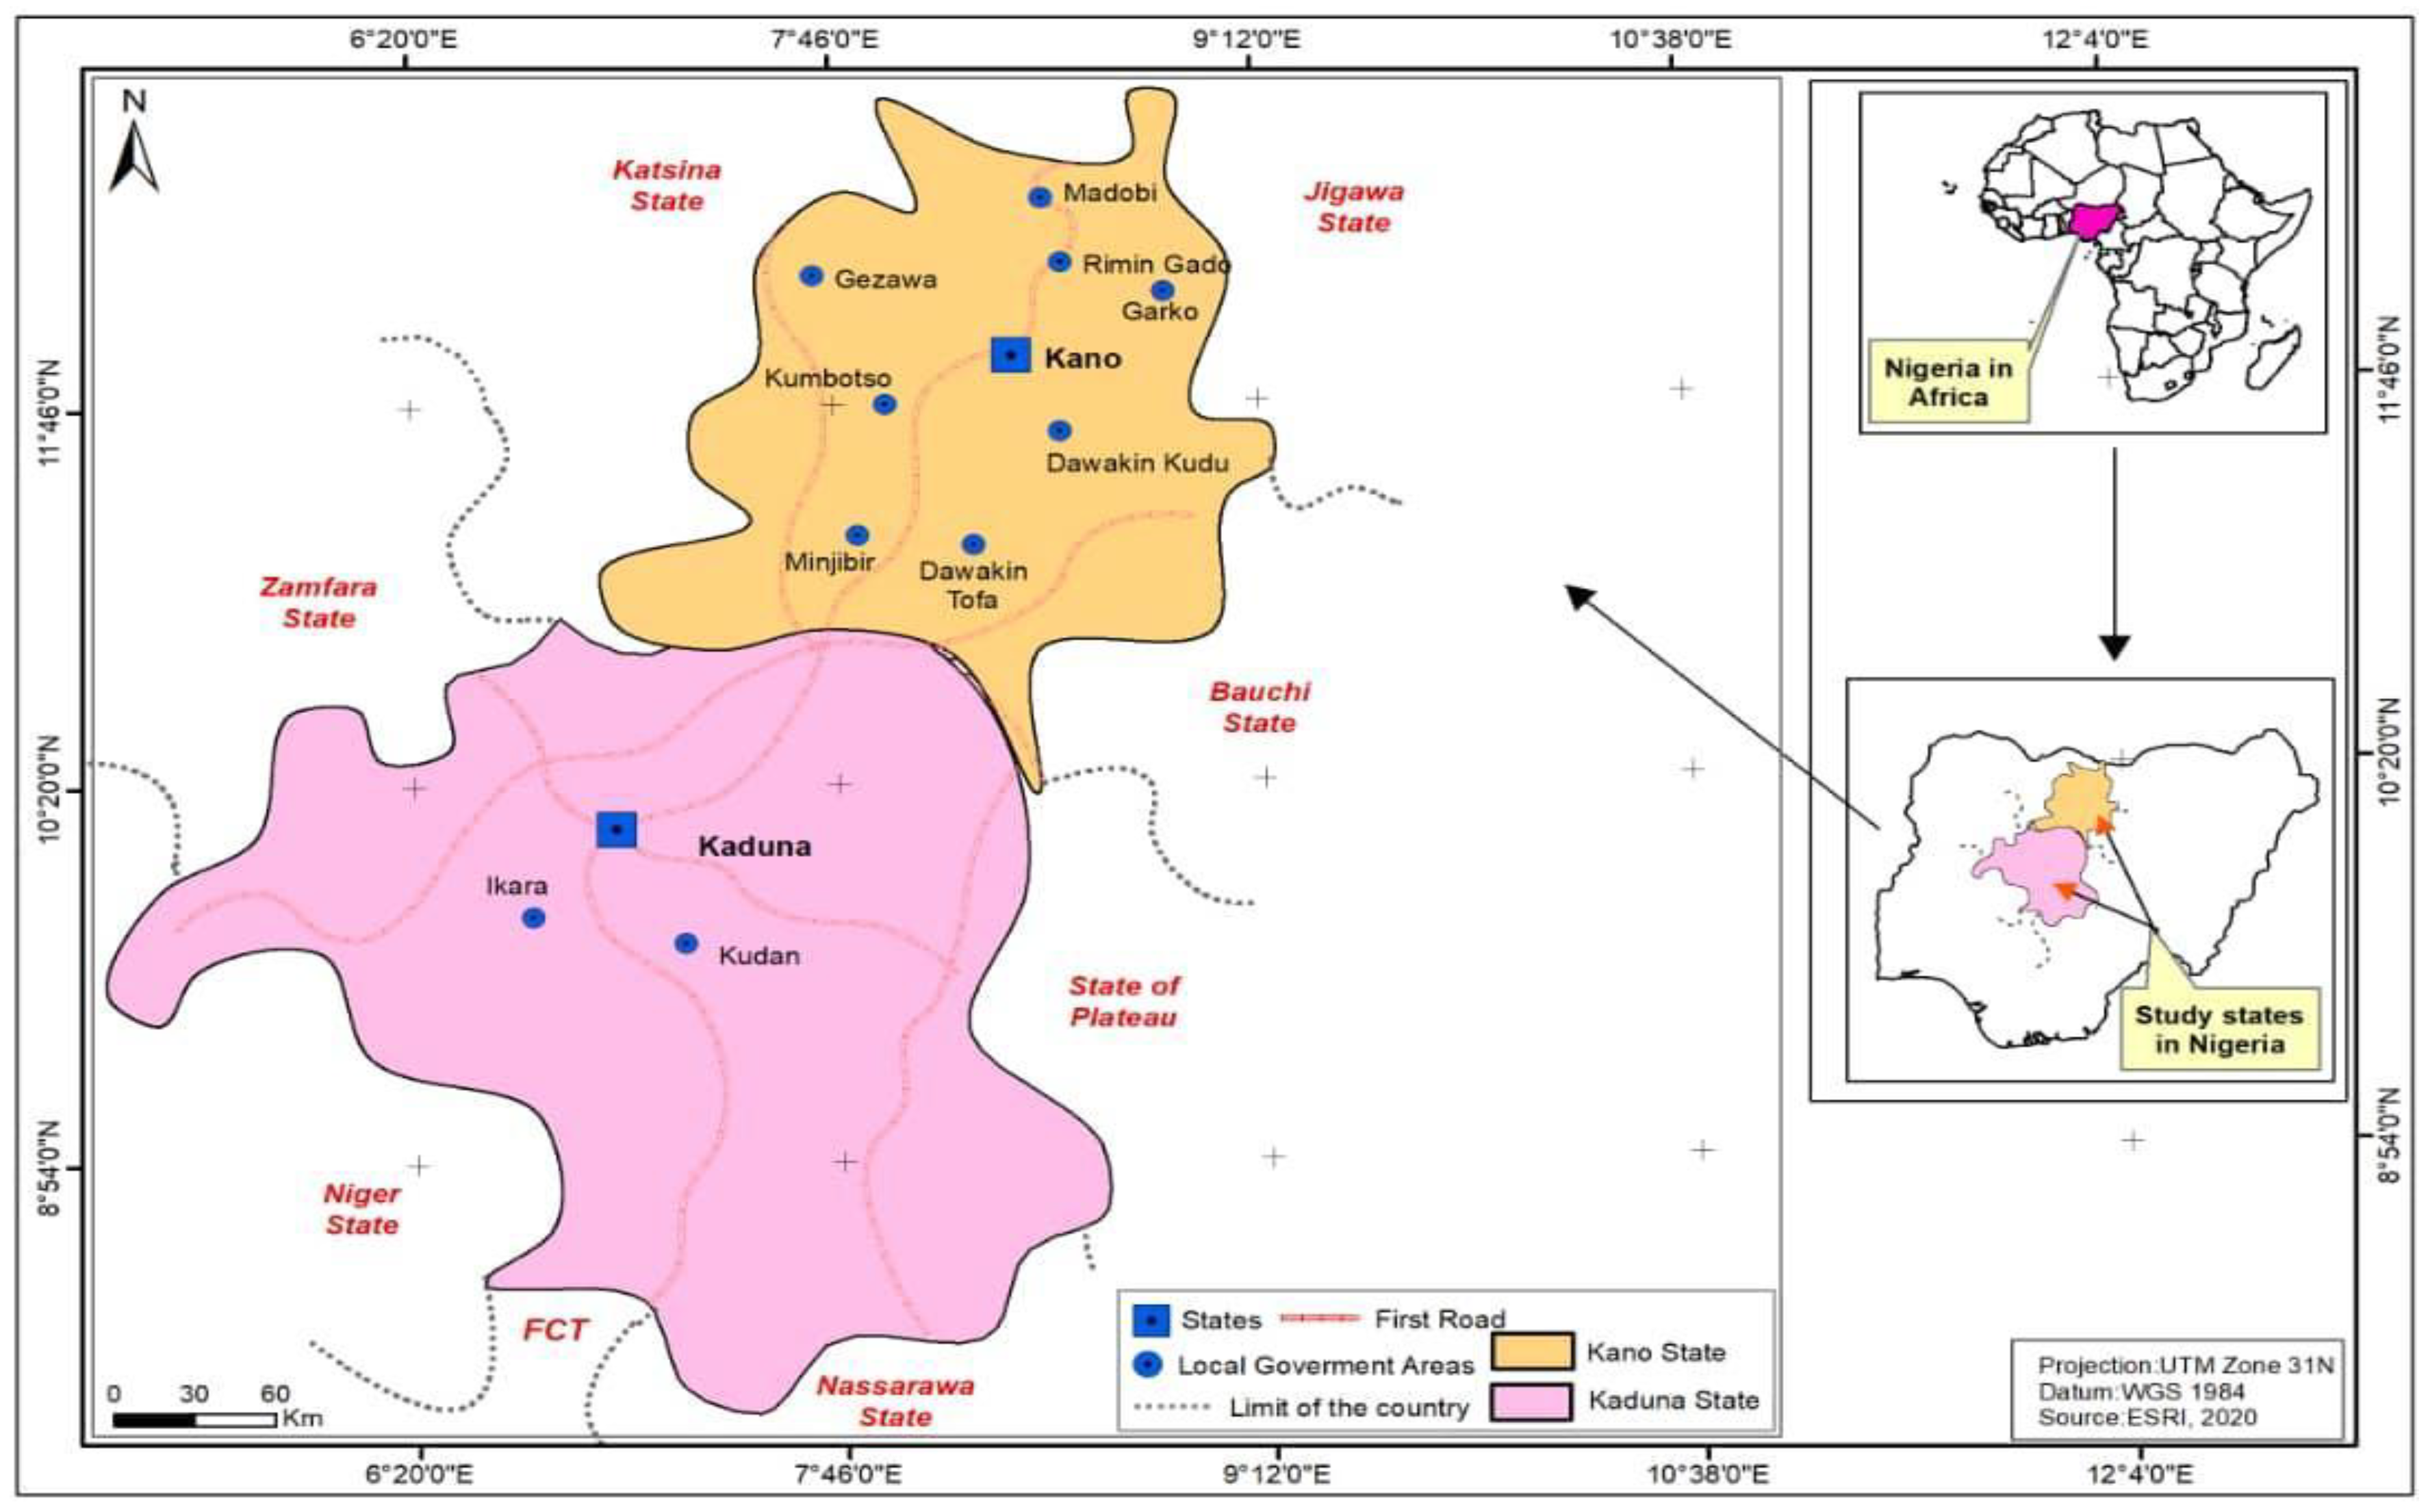
2.1. Sampling and Data Collection
2.2. Data Analysis
- Age: Age is a typical proxy for experience, wisdom, etc. We therefore expect that older people will be better able to cope with the COVID-19 pandemic.
- Level of education: Education is often linked to better knowledge to take informed decisions that ensure efficiency, higher income, etc. We hypothesise that more educated farmers will be more likely to adopt coping strategies.
- Household size: Larger households have more labour available and might be more flexible in terms of labour reallocation if hired labour were to become scarce. Due to the availability of labour, they can also be more flexible in terms of adopting strategies that might be more labour intensive. We assume that larger household will be more likely to adopt coping strategies in response to the COVID-19 pandemic.
- Marital status: Married farmers often have dependent household members and need considerable income flows from sales to meet non-food expenses. We anticipate that married farmers will be more likely to adopt coping strategies in response to the COVID-19 pandemic.
- Household assets: Ownership of assets can be seen as a proxy for wealth. Assets can be used to smoothen consumption or to pay for an investment to shield the household from a crisis. We hypothesise that assets are positively associated with the adoption of coping strategies.
- Access to credit: Like household assets, access to credit can help to sustain livelihoods or make adjustments to avoid losses. We assume that farmers who have access to credit will be more likely to adopt coping strategies.
- Vegetable production within the last twelve months: We assume that farmers who produce vegetables often will likely adopt coping strategies as a means to sustain their livelihoods. This variable can be seen as a proxy for farmers who are active in vegetable production with the assumption that these farmers will more likely be in a better position to adopt observed coping measures.
- Government extension services: Access to extension services can help farmers to change and build their resilience and capacity to deal with shocks [32] by exposing them to innovations, information, etc. Government extension services often provide farmers with general technical support. We expect that farmers with access to government extension services are better able to respond to the COVID-19 pandemic by adopting coping strategies.
- Private extension services: Like government extension services, private extension services from local or international non-governmental organisations provide support to farmers and often target specific areas or aspects of production. We anticipate that farmers with access to private extension services will be better able to adopt coping strategies.
- Scale of perception of the effects of COVID-19: We used a 5-point Likert scale from 1 (not affected at all) to 5 (severely affected) to measure the perception of the effects of COVID-19. We anticipate that the use of a coping strategy is by default a response of the perception of effects of the COVID-19 pandemic or its related effects. Hence, we assume that stronger perceptions about the effects of COVID-19 will be associated with the adoption coping strategies.
- Scale of challenges in accessing farm inputs: We also used a 5-point Likert scale from 1 (not affected at all) to 5 (severely affected) to measure the challenges in accessing farm inputs. As the COVID-19 pandemic is likely to slow down the distribution of farm inputs, we assume that farmers who already face challenges in accessing inputs might be less likely to cope with the effects of COVID-19 pandemic.
- Scale of challenges in vegetable storage and commercialisation: A 5-point Likert scale from 1 (not affected at all) to 5 (severely affected) was used to measure the challenge scale in vegetable storage and commercialisation. We assume that farmers who already face challenges in storing or marketing their vegetables will have more difficulties in coping with the effects of the COVID-19 pandemic as vegetables are highly perishable goods.
- LGA dummies: LGA’s specific characteristics such as size, existence of basic infrastructure etc. could affect the behaviour of farmers. We controlled for differences between LGAs by using LGA dummies.
3. Results and Discussion
3.1. Socio-Economic Characteristics of Respondents
3.2. Respondents’ Perceptions of the Effects of COVID-19
3.3. Scale of Challenges in Vegetable Production, Storage and Sale
3.4. COVID-19 Coping Strategies and the Socio-Economic Drivers
- Drivers of production-oriented coping strategies:
- Age: We observe that older farmers tend to reduce the supply volume by producing more of their own food (p < 0.01). This can be explained by the fact that older farmers have less physical capacity to make investments and tend to prefer falling back to subsistence production.
- Education: The level of education shows mixed-effects on the decisions to adopt production-oriented coping strategies that are aimed at reducing the supply volume. More educated farmers are less likely to opt for producing more of their own food (p < 0.10) and this helps them to control better what they eat. In the same way, these farmers are more likely to eat more of their own production (p < 0.10) given that they faced more difficulties to sell their vegetables and want to avoid income losses.
- Marital status: Married farmers are found to be more likely to adopt production-oriented strategies that reduce the supply volume by deciding to produce less crops for selling (p < 0.01). As hypothesised, for married farmers, it is critical to ensure that income flows from sales to meet non-food expenses and they have lower incentive if market prices or demand are reduced for some crops. This could also be the result of a strategy diverting the required amount required for producing of crops for selling to other activities with a more “guaranteed” demand as vegetable production may be perceived as risky considering the lower demand and high perishability in the context of the pandemic.
- Household size: Larger households were less likely to reduce their supply volume compared to smaller households (p < 0.01). Farmers with a higher number of household members were more likely to engage in coping strategies that are labour intensive and also allow them producing enough food for their households. Access and entitlement to natural capital significantly determined the decisions taken by smallholder African traditional vegetable farmers to cope with shocks [32].
- Household asset index: Wealthier households had mixed behaviours in terms of production-oriented coping strategies. Wealthier households were less likely to produce less crops for selling and more likely to produce more for own consumption.
- Credit access: Access to credit mostly drove production-oriented coping strategies that reduced vegetable supply. The estimated coefficients are significant on the decisions to produce less crops for selling (p < 0.01) and producing more of own food (p < 0.10). This indicates that farmers who have access to credit are likely to maintain their production, but switch from supplied markets to using more for their own consumption. This could help smooth the impact on food consumption.
- Private extension services: Private extension services have mixed-effects on the farmers’ decisions towards production-strategies that reduce the supply volume. These services encourage farmers to produce more crops for selling (p < 0.01) and also to produce more of own food (p < 0.01).
- Perception of the effects of COVID-19: A stronger perception of COVID-19 seems to encourage farmers to produce more crops for selling. This could be because farmers also understand that more nutritious and healthy food that include vegetables are recommended. This also highlights the existence of a demand for vegetable that could encourage farmers to produce more, if well communicated.
- Challenge in accessing farm inputs: Unexpectedly, farmers who faced more challenges in accessing farm inputs were less likely to adopt coping strategies such as producing less crops for selling (p < 0.01).
- Challenge in storage and sales: Farmers who faced more challenges in storage and sales were more likely to produce less crops for selling (p < 0.01). This way, they avoid post-harvest losses especially if they were not able to sell out all their production.
- Drivers of market-oriented strategies coping strategies:
- Age: Compared to younger farmers, older farmers are also less likely to adopt market-oriented strategies such as more processing (p < 0.05) or finding new markets (p < 0.01). Like in the case of production-oriented strategies, it may be that older farmers have less capacity to make investments and tend to prefer falling back to subsistence production.
- Marital status: Married farmers had mixed-behaviours in relation with respect to market-oriented strategies. They tend to process less (p < 0.05) but explore new markets (p < 0.01). Consistent with the above explanation on production-oriented strategies, married farmers reduce their production but still explore new markets to sell their products.
- Household size: Despite the market challenges, larger households were less likely to invest in storing (p < 0.01).
- Production in the last 12 months: Farmers who declared that they produced vegetables within the 12 months preceding the survey were more likely to adopt market-oriented coping strategies such as processing (p < 0.05) and reducing the selling price (p < 0.05). These farmers are typically those who were able to sustain their production (i.e., start new cultivation cycles) to some extent despite the pandemic and who needed to sell their products.
- Government extension services: Farmers who benefited from government extension services were more likely to adopt market-oriented coping strategies and more precisely the reduction of selling price (p < 0.05).
- Challenge in accessing farm inputs: Farmers who faced more challenges in accessing farm inputs were less likely to look for new markets (p < 0.05). As they produce less for selling, they also limit their investments in alternative markets.
- Challenge in storage and sales: Farmers who faced more challenges in storage and sales were also more likely to adopt coping strategies such as processing (p < 0.05) and finding new markets (p < 0.05). They seem to be aware of the market demand and consider storage as a key constraint to solve.
4. Conclusions
Author Contributions
Funding
Institutional Review Board Statement
Informed Consent Statement
Data Availability Statement
Acknowledgments
Conflicts of Interest
References
- Ali, Z.; Green, R.; Zougmoré, R.B.; Mkuhlani, S.; Palazzo, A.; Prentice, A.M.; Haines, A.; Dangour, A.D.; Scheelbeek, P.F.D. Long-term impact of West African food system responses to COVID-19. Nat. Food 2020, 1, 768–770. [Google Scholar] [CrossRef]
- Bisson, L.; Hambleton, T. COVID-19 Impact on West African Value Chains Countries. In CRU_Clingendael Policy Brief. Available online: https://www.clingendael.org/sites/default/files/2020-06/Policy_Brief_COVID-19_Impact_on_West_African_Value_Chains_June_2020.pdf (accessed on 16 August 2021).
- Mahmud, M.; Riley, E. Household response to an extreme shock: Evidence on the immediate impact of the Covid-19 lockdown on economic outcomes and well-being in rural Uganda. World Dev. 2021, 140, 21. [Google Scholar] [CrossRef]
- Mhlanga, D.; Ndhlovu, E. Socio-Economic Implications of the COVID-19 Pandemic for Smallholder Livelihoods in Zimbabwe. Sahar. J. 2020, 1, 174–199. [Google Scholar]
- OECD. Evaluation of the Impact of the Coronavirus (COVID-19) on Fruit and Vegetables Trade, pp. 1–14. 2020. Available online: https://www.oecd.org/agriculture/fruit-vegetables/oecd-covid-19-impact-on-fruit-and-vegetables-trade.pdf (accessed on 1 September 2021).
- Ozili, P. COVID-19 in Africa: Socio-Economic Impact, Policy Response and Opportunities. Int. J. Sociol. Soc. Policy 2020, 25. Available online: https://www.emerald.com/insight/content/doi/10.1108/IJSSP-05-2020-0171/full/html (accessed on 1 September 2021).
- FAO. Promotion of Fruit and Vegetables for Health: Report of the Pacific Regional Workshop. Available online: http://www.fao.org/3/a-i4935e.pdf (accessed on 6 August 2021).
- Hamulczuk, M.; Skrzypczyk, M. COVID-19, spatial market integration and producer prices: A case study of eu agri-food markets. Stud. Agric. Econ. 2021, 123, 53–61. [Google Scholar] [CrossRef]
- Aman, F.; Masood, S. How Nutrition can help to fight against COVID-19 Pandemic. Pak. J. Med. Sci. 2020, 36, 121–123. [Google Scholar] [CrossRef]
- De Faria Coelho-Ravagnani, C.; Corgosinho, F.C.; Sanches, F.L.F.Z.; Prado, C.M.M.; Laviano, A.; Mota, J.F. Dietary recommendations during the COVID-19 pandemic. Nutr. Rev. 2021, 79, 382–393. [Google Scholar] [CrossRef]
- Dessalegn, B. Transitory coping strategies of food-insecure smallholder farmer households: The case of Ilu Gelan District, West Shoa Zone, Oromia Reginal State, Ethiopia. Agric. Food Secur. 2018, 7, 70. [Google Scholar] [CrossRef] [Green Version]
- FAO. Fruit and vegetables—Your dietary essentials. In The International Year of Fruits and Vegetables, 2021, Background Paper; FAO: Rome, Italy, 2020; p. 36. [Google Scholar] [CrossRef]
- Asante, L.A.; Mills, R.O. Exploring the Socio-Economic Impact of COVID-19 Pandemic in Marketplaces in Urban Ghana. Afr. Spectr. 2020, 55, 170–181. [Google Scholar] [CrossRef]
- FAO. FAO’s Response to COVID-19: Building to Transform, Council Hundred and Sixty-Sixth Session (cl 166/5), 14p, no. Hundred and Sixty-Sixth Session (166/5), p. 14. 2021. Available online: http://www.fao.org/3/ne895en/ne895en.pdf (accessed on 1 September 2021).
- Lucas, B. Impacts of Covid-19 on Inclusive Economic Growth in Middle-Income Countries, K4D Helpdesk Report 811; Institute of Development Studies: Brighton, UK, 2020; Volume 811, p. 32. [Google Scholar]
- World Bank Group. Commodity Markets Outlook. Implications of COVID-19 for Commodities, Worldbank, no. April, pp. 1–100. 2020. Available online: https://openknowledge.worldbank.org/bitstream/handle/10986/33624/CMO-April-2020.pdf?sequence=9&isAllowed=y (accessed on 11 August 2021).
- Tsiboe, F.; Asravor, J.; Osei, E. Vegetable production technical efficiency and technology gaps in Ghana. Afr. J. Agric. Resour. Econ. 2019, 14, 255–278. [Google Scholar]
- Gu, H.-Y.; Wang, C.-W. Impacts of the COVID-19 pandemic on vegetable production and countermeasures from an agricultural insurance perspective. J. Integr. Agric. 2020, 19, 2866–2876. [Google Scholar] [CrossRef]
- Abdul, I.M. COVID-19, Lockdown And Transitory Food Insecurity In Nigeria. Food Agribus. Manag. 2020, 1, 31–35. [Google Scholar] [CrossRef]
- Aromolaran, A.B.; Muyanga, M. Impact of COVID-19 on Food Systems and Rural Livelihoods in Nigeria. Round 2. In Agricultural Policy Research in Africa (APRA) COVID-19 Country Report; Future Agricultures Consortium ©: Brighton, UK, 2020; Volume 7, pp. 2–3. [Google Scholar] [CrossRef]
- Harris, J. Diets in a Time of Coronavirus: Don’t Let Vegetables Fall off the Plate. IFPRI Blog Post, pp. 1–5. 2020. Available online: https://www.ifpri.org/blog/diets-time-coronavirus-dont-let-vegetables-fall-plate (accessed on 6 August 2021).
- Harris, J.; Depenbusch, L.; Pal, A.A.; Nair, R.M.; Ramasamy, S. Food system disruption: Initial livelihood and dietary effects of COVID-19 on vegetable producers in India. Food Secur. 2020, 12, 841–851. [Google Scholar] [CrossRef]
- Ridley, W.; Devadoss, S. The Effects of COVID-19 on Fruit and Vegetable Production. Appl. Econ. Perspect. Policy 2021, 43, 329–340. [Google Scholar] [CrossRef] [PubMed]
- Tamru, S.; Hirvonen, K.; Minten, B. Impacts of the COVID-19 Crisis on Vegetable Value Chains in Ethiopia; IFPRI: International Food Policy Research Institute: Washington, DC, USA, 2020; pp. 81–83. Available online: https://www.ifpri.org/blog/impacts-covid-19-crisis-vegetable-value-chains-ethiopia (accessed on 14 March 2021).
- Varrella, S. Nigeria: Agricultural Activities, by Type and Area. 2020. Available online: https://www.statista.com/statistics/1119593/households-participating-in-agricultural-activities-in-nigeria-by-type-and-area/ (accessed on 17 May 2021).
- Mukaila, R.; Obetta, A.E.; Awoyelu, F.E.; Chiemela, C.J.; Ugwu, A.O. Marketing Analysis of Vegetables: The Case of Carrot and Cucumber Marketing in Enugu State, Nigeria. Turk. J. Agric.-Food Sci. Technol. 2021, 9, 346–351. [Google Scholar] [CrossRef]
- World Population Prospects. The 2019 Revision: Nigeria Population. 2021. Available online: https://www.worldometers.info/world-population/nigeria-population/ (accessed on 13 May 2021).
- ILO. Rapid Situational Analysis of the Employment-Climate- Environment Nexus Nigeria: Identifying Just Transition Policies; ILO: Geneva, Switzerland, 2020; p. 20. Available online: https://www.ilo.org/global/topics/green-jobs/publications/situational-analysis/WCMS_757097/lang--en/index.htm (accessed on 1 September 2021).
- Greene, W.H. Discrete Choice Modeling. In The Handbook of Econometrics: Vol. 2, Applied Econometrics; Forthcomin, Volume 2, no. January 2007; Mills, T., Patterson, K., Eds.; Palgrave: London, UK, 2000; pp. 7–78. Available online: https://www.researchgate.net/publication/24133061 (accessed on 20 August 2021).
- Cappellari, L.; Jenkins, S.P. Multivariate probit regression using simulated maximum likelihood. Stata J. 2003, 3, 278–294. [Google Scholar] [CrossRef] [Green Version]
- Sharma, M. Coping: Strategies. 2003. Available online: https://www.researchgate.net/publication/274193314_Coping_Strategies (accessed on 12 May 2021).
- Ngenoh, E.; Kebede, S.W.; Bett, H.K.; Bokelmann, W. Coping with Shocks and Determinants among Indigenous Vegetable Smallholder Farmers in Kenya. Agric. Sci. 2018, 9, 804–823. [Google Scholar] [CrossRef] [Green Version]
- Lapatinas, A. The effect of COVID-19 Confinement Policies on Community Mobility Trends in the EU; Publications Office of the European Union: Luxembourg, 2020; p. 5. Available online: https://publications.jrc.ec.europa.eu/repository/handle/JRC120972 (accessed on 1 September 2021).
- PWC. Responding To the Impact of COVID-19 on Food Security and Agriculture in Nigeria. 2020. Available online: www.pwc.com/ng/covid-19 (accessed on 19 June 2021).
- Ilesanmi, F.F.I.; Ilesanmi, O.S.; Afolabib, A. The effects of the COVID-19 pandemic on food losses in the agricultural value chains in Africa: The Nigerian case study. Public Heal. Pract. 2020, 2, 3. [Google Scholar] [CrossRef]
- Koos, C.; Hangoma, P.; Maestad, O. Household Wellbeing and Coping Strategies in Africa during COVID-19: Findings from High Frequency Phone Surveys, Chr. Michelsen Institute (cmi) Report, No. 4, p. 32. 2020. Available online: www.cmi.no/publications/7391-household-wellbeing-and-coping-strategies-in-africa-during-covid-19-findings-from-high-frequency (accessed on 1 September 2021).
- Czekaj, M.; Adamsone-Fiskovica, A.; Tyran, E.; Kilis, E. Small farms’ resilience strategies to face economic, social, and environmental disturbances in selected regions in Poland and Latvia. Glob. Food Sec. 2020, 26, 8. [Google Scholar] [CrossRef]
- Darnhofer, I.; Fairweather, J.; Moller, H. Assessing a farm’s sustainability: Insights from resilience thinking. Int. J. Agric. Sustain. 2010, 8, 186–198. [Google Scholar] [CrossRef]
- Van Vliet, J.A.; Schut, A.G.T.; Reidsma, P.; Descheemaeker, K.; Slingerland, M.; Van de Ven, G.W.J.; Giller, K.E. De-mystifying family farming: Features, diversity and trends across the globe. Glob. Food Sec. 2015, 5, 11–18. [Google Scholar] [CrossRef]
- Daugstad, K. Resilience in mountain farming in Norway. Sustainability 2019, 11, 3476. [Google Scholar] [CrossRef] [Green Version]


| State | LGA | Sample Size |
|---|---|---|
| Kudan | Kudan | 59 |
| Ikara | 50 | |
| Kano | Dawakin Kudu | 80 |
| Dawakin Tofa | 72 | |
| Minjibir | 29 | |
| Garko | 29 | |
| Kumbotso | 50 | |
| Rimin Gado | 50 | |
| Madobi | 51 | |
| Gezawa | 51 | |
| Total | 521 | |
| LGA | Age (Years) | Marital Status (1/0) | HH Size (# People) | Education (Years) | Asset Index * | Produced Vegetables During Last 12 Months (1/0) | Access to Credit (1/0) | Government Extension Services (1/0) | Private Extension Services (1/0) |
|---|---|---|---|---|---|---|---|---|---|
| Kudan (n = 59) | 42.78 (11.42) | 1.00 | 5.86 (1.54) | 8. 86 (3.99) | 0.26 (0.10) | 1.00 | 0.00 | 0.01 (0.13) | 0.15 (0.36) |
| Ikara (n = 50) | 40.48 (8.49) | 1.00 | 5.26 (1.16) | 11.54 (4.32) | 0.43 (0.18) | 1.00 | 0.00 | 0.00 | 0.14 (0.35) |
| Dawakin Kudu (n=80) | 39.47 (10.16) | 0.97 (0.15) | 2.29 (0.71) | 8.42 (6.65) | 0.08 (0.06) | 0.12 (0.33) | 0.00 | 0.14 (0.34) | 0.24 (0.42) |
| Dawakin Tofa (n = 72) | 42.00 (13.86) | 0.85 (0.36) | 5.72 (2.40) | 7.69 (5.77) | 0.13 (0.05) | 0.79 (0.40) | 0.88 (0.32) | 0.11 (0.32) | 0.17 (0.37) |
| Minjibir (n = 29) | 46.96 (13.09) | 0.96 (0.18) | 6.65 (1.88) | 9.83 (6.49) | 0.10 (0.01) | 0.69 (0.47) | 0.38 (0.49) | 0.00 | 0.00 |
| Garko (n = 29) | 36.48 (11.27) | 0.96 (0.18) | 2.07 (0.37) | 10.10 (5.92) | 0.06 (0.08) | 0.10 (0.50) | 0.00 | 0.00 | 0.03 (0.18) |
| Madobi (n = 51) | 44.55 (10.20) | 1.00 | 6.25 (1.65) | 7.43 (5.20) | 0.27 (0.16) | 0.55 (0.50) | 0.00 | 0.16 (0.36) | 0.21 (0.41) |
| Gezawa (n = 51) | 46.24 (12.75) | 0.84 (0.37) | 7.80 (3.50) | 13.90 (5.94) | 0.44 (0.23) | 0.43 (0.50) | 0.00 | 0.08 (0.27) | 0.21 (0.41) |
| Kumbutso (n = 50) | 42.88 (12.00) | 1.00 | 6.28 (2.01) | 8.72 (4.49) | 0.33 (0.15) | 0.74 (0.44) | 0.00 | 0.00 | 0.00 |
| Rimin Gado (n = 50) | 43.94 (12.00) | 0.84 (0.37) | 9.02 (4.99) | 15.26 (4.60) | 0.19 (0.13) | 0.04 (0.19) | 0.00 | 0.00 | 0.00 |
| Total (N = 521) | 43.94 (12.20) | 0.94 (0.24) | 5.64 (3.13) | 9.97 (5.94) | 0.23 (0.18) | 0.57 (0.50) | 0.14 (0.35) | 0.06 (0.24) | 0.13(0.34) |
| LGA | Extent to Which Households Were Affected by […] Over the Last 5 Years on a Scale From 1 (Not Affected at All) to 5 (Severely Affected) | |||
|---|---|---|---|---|
| Natural Disasters A | Theft, Illness, Death B | Production Shocks C | COVID-19 D | |
| Kudan (n = 59) | 1.00 (0.04) | 1.02 (0.08) | 1.04 (0.12) | 2.62 (0.39) |
| Ikara (n = 50) | 1.00 (0) | 1.01 (0.07) | 1.01 (0.06) | 2.20 (0.40) |
| Dawakin Kudu (n = 80) | 1.29 (0.05) | 1.01 (0.09) | 1.08 (0.22) | 3.21 (0.57) |
| Dawakin Tofa (n = 72) | 1.00 (0) | 1.28 (0.39) | 1.19 (0.28) | 3.73 (0.41) |
| Minjibir (n = 29) | 1.00 (0) | 1.04 (0.16) | 1.27 (0.31) | 4.00 (0.02) |
| Garko (n = 29) | 1.00 (0) | 1.00 (0) | 1.07 (0.21) | 3.59 (0.64) |
| Madobi (n = 51) | 1.00 (0) | 1.02 (0.13) | 1.12 (0.19) | 1.21 (0.19) |
| Gezawa (n = 51) | 1.26 (0.41) | 1.28 (0.60) | 1.37 (0.28) | 4.43 (0.39) |
| Kumbutso (n = 50) | 1.00 (0) | 1.01 (0.07) | 1.02 (0.09) | 1.21 (0.08) |
| Rimin Gado (n = 50) | 1.45 (0.54) | 1.72 (0.58) | 1.25 (0.39) | 4.80 (0.26) |
| Total (N = 521) | 1.11 (0.33) | 1.15 (0.37) | 1.14 (0.26) | 3.07 (1.23) |
| LGA | Effect of the COVID-19 Measures […] on a Scale From 1 (Not Affected at All) to 5 (Severely Affected) | |||||
|---|---|---|---|---|---|---|
| General Lockdown | Curfew | Input Market Closure | Social Distancing | Movement Restriction | Quarantine | |
| Kudan (n = 59) | 3.71 (0.72) | 1.95 (1.07) | 3.74 (0.54) | 1.20 (0.52) | 3.10 (0.80) | 1.34 (0.88) |
| Ikara (n = 50) | 3.98 (0.14) | 1.62 (1.09) | 2.80 (0.95) | 1.16 (0.42) | 2.32 (0.87) | 1.10 (0.42) |
| Dawakin Kudu (n = 80) | 3.56 (5.97) | 3.35 (0.92) | 3.15 (1.07) | 3.19 (1.06) | 3.18 (0.86) | 2.63 (1.28) |
| Dawakin Tofa (n = 72) | 3.89 (0.36) | 3.92 (0.40) | 3.92 (0.37) | 3.87 (0.44) | 3.94 (0.41) | 3.87 (0.53) |
| Minjibir (n = 29) | 4.00 (0) | 4.03 (0.19) | 4.00 (0) | 4.00 (0) | 4.00 (0) | 4.00 (0) |
| Garko (n = 29) | 3.52 (0.87) | 3.62 (0.90) | 3.51 (0.87) | 3.59 (0.95) | 3.65 (0.86) | 3.48 (0.99) |
| Madobi (n = 51) | 1.90 (0.46) | 1.80 (0.60) | 1.39 (0.66) | 1.10 (0.30) | 1.14 (0.40) | 1.00 (0) |
| Gezawa (n = 51) | 4.90 (0.30) | 4.76 (0.47) | 4.59 (0.57) | 4.51 (0.70) | 4.55 (0.64) | 3.14 (1.48) |
| Kumbutso (n = 50) | 1.98 (0.14) | 1.98 (0.25) | 1.38 (0.53) | 1.08 (0.27) | 1.06 (0.24) | 1.00 (0) |
| Rimin Gado (n = 50) | 4.92 (0.27) | 4.90 (0.30) | 4.82 (0.44) | 4.88 (0.33) | 4.88 (0.33) | 4.58 (0.93) |
| Total (N = 521) | 3.63 (1.09) | 3.16 (1.38) | 3.32 (1.30) | 2.83 (1.57) | 3.16 (1.37) | 2.55 (1.55) |
| Employment | Loss of Income/Revenues | Food Shortages | Cost of Food | Cost of Medicines | Shortage in Input Supply | |
| Kudan (n = 59) | 1.81 (0.80) | 2.47 (0.86) | 2.49 (1.07) | 3.52 (0.73) | 2.90 (0.86) | 3.24 (0.75) |
| Ikara (n = 50) | 2.06 (0.71) | 2.38 (0.83) | 1.90 (0.91) | 2.50 (0.73) | 2.52 (1.09) | 2.12 (0.94) |
| Dawakin Kudu (n = 80) | 3.09 (1.19) | 2.91 (1.24) | 3.30 (0.10) | 3.44 (0.98) | 3.32 (0.94) | 3.40 (1.14) |
| Dawakin Tofa (n = 72) | 3.03 (1.37) | 3.49 (0.99) | 3.72 (0.59) | 3.71 (0.54) | 3.72 (0.51) | 3.71 (0.49) |
| Minjibir (n = 29) | 3.96 (0.18) | 4.00 (0) | 4.00 (0) | 4.00 (0) | 4.00 (0) | 4.00 (0) |
| Garko (n = 29) | 3.79 (0.82) | 3.48 (1.09) | 3.62 (0.98) | 3.65 (0.97) | 3.52 (0.91) | 3.62 (0.90) |
| Madobi (n = 51) | 1.04 (0.28) | 1.04 (0.19) | 1.04 (0.28) | 1.06 (0.31) | 1.04 (0.20) | 1.00 (0) |
| Gezawa (n = 51) | 4.76 (0.55) | 4.49 (0.78) | 4.49 (0.73) | 4.72 (0.53) | 3.86 (1.09) | 4.37 (0.69) |
| Kumbutso (n = 50) | 1.00 (0) | 0.98 (0.14) | 1.00 (0) | 1.00 (0) | 1.02 (0.14) | 1.02 (0.14) |
| Rimin Gado (n = 50) | 4.82 (0.39) | 4.90 (0.30) | 4.66 (0.63) | 4.88 (0.33) | 4.64 (0.66) | 4.82 (0.48) |
| Total (N = 521) | 2.85 (1.54) | 2.96 (1.47) | 2.99 (1.45) | 3.24 (1.40) | 3.04 (1.36) | 3.11 (1.41) |
| LGA | Access to Seeds | Access to Fertilisers | Access to Pesticides | Hired Casual Labour | Agricultural Equipment | Access to Credit | Mean Score |
|---|---|---|---|---|---|---|---|
| Kudan (n = 59) | 1.13 (0.51) | 1.20 (0.55) | 1.19 (0.57) | 1.00 | 1.00 | 0.18 (0.75) | 0.95 (0.28) |
| Ikara (n = 50) | 1.00 (0) | 1.28 (0.78) | 1.00 | 1.00 | 1.06 (0) | 0.10 (0.50) | 0.91 (0.21) |
| Dawakin Kudu (n = 80) | 1.16 (0.51) | 1.35 (0.08) | 1.44 (0.91) | 1.44 (0.92) | 1.50 (0.00) | 0.30 (0.85) | 1.20 (0.67) |
| Dawakin Tofa (n = 72) | 1.80 (1.33) | 2.89 (1.39) | 2.75 (1.40) | 1.05 (0.84) | 0.92 (0.57) | 0.30 (0.23) | 1.57 (0.75) |
| Minjibir (n = 29) | 1.52 (1.40) | 2.55 (1.78) | 2.69 (1.85) | 0.96 (1.05) | 0.69 (0.47) | 0.00 | 1.40 (0.97) |
| Garko (n = 29) | 1.34 (0.81) | 1.34 (0.77) | 1.52 (1.02) | 1.55 (1.12) | 1.59 (1.05) | 0.31 (0.85) | 1.27 (0.79) |
| Madobi (n = 51) | 1.00 | 1.00 | 1.00 | 1.05 (0.31) | 1.00 | 0.00 | 0.84 (0.05) |
| Gezawa (n = 51) | 2.78 (0.81) | 3.20 (1.00) | 3.25 (0.18) | 2.88 (1.12) | 2.82 (0.97) | 2.29 (0.92) | 2.87 (0.60) |
| Kumbutso (n = 50) | 1.00 | 1.00 | 1.00 | 1.00 | 1.00 | 1.00 | 0.83 (0) |
| Rimin Gado (n = 50) | 2.62 (0.72) | 2.56 (0.88) | 3.36 (0.77) | 2.64 (0.72) | 2.86 (0.70) | 2.36 (0.69) | 2.73 (0.35) |
| Total (N = 521) | 1.53 (0.98) | 1.83 (1.23) | 1.90 (1.31) | 1.45 (0.99) | 1.44 (0.97) | 0.55 (1.07) | 1.45 (0.89) |
| LGA | Lack of Storage | Lack of Transportation Means | Closure/ Restriction of Markets | Lack of Buyers/Markets | Low Selling Prices | Access to Credit | Mean Score |
|---|---|---|---|---|---|---|---|
| Kudan (n = 59) | 1.07 (0.41) | 1.13 (0.60) | 1.13 (0.60) | 1.22 (0.67) | 1.22 (0.64) | 1.05 (0.28) | 1.14 (0.36) |
| Ikara (n = 50) | 1.08 (0.39) | 1.20 (0.61) | 1.26 (0.72) | 1.28 (0.78) | 1.36 (0.85) | 1.00 | 1.20 (0.48) |
| Dawakin Kudu (n = 80) | 1.47 (0.97) | 1.42 (0.92) | 1.47 (0.99) | 1.50 (1.03) | 1.35 (0.76) | 1.26 (0.69) | 1.41 (0.75) |
| Dawakin Tofa (n = 72) | 1.74 (1.11) | 2.14 (1.21) | 2.24 (1.28) | 2.30 (1.14) | 2.36 (0.31) | 2.12 (0.24) | 2.15 (1.13) |
| Minjibir (n = 29) | 1.83 (1.46) | 2.10 (1.52) | 2.10 (1.52) | 2.24 (1.57) | 2.21 (1.54) | 2.10 (1.50) | 2.10 (1.46) |
| Garko (n = 29) | 1.17 (0.66) | 1.21 (0.62) | 1.31 (0.81) | 1.24 (0.73) | 1.14 (0.51) | 1.03 (0.18) | 1.18 (0.43) |
| Madobi (n = 51) | 1.00 | 1.00 | 1.00 | 1.02 (0.14) | 1.00 | 1.00 | 1.00 (0.02) |
| Gezawa (n = 51) | 3.25 (0.95) | 3.21 (0.92) | 3.47 (0.76) | 3.39 (0.77) | 3.43 (0.92) | 3.35 (0.87) | 3.35 (0.59) |
| Kumbutso (n = 50) | 1.00 | 1.00 | 1.00 | 1.00 | 1.00 | 1.00 | 1.00 |
| Rimin Gado (n = 50) | 3.14 (0.78) | 3.02 (0.79) | 3.46 (0.68) | 3.38 (0.72) | 3.22 (0.76) | 3.22 (0.79) | 3.24 (0.49) |
| Total (N = 521) | 1.67 (1.12) | 1.74 (1.14) | 1.84 (1.23) | 1.85 (1.22) | 1.83 (1.21) | 1.71 (1.14) | 1.77 (1.09) |
| LGA | Production-Oriented Strategies | Market-Oriented Strategies | |||||
|---|---|---|---|---|---|---|---|
| Producing Less Crops for Selling (1/0) | Producing More of Own Food (1/0) | Eat More Own Production (1/0) | Process More (1/0) | Store More (1/0) | Find New Markets (1/0) | Reduce the Selling Price (1/0) | |
| Kudan (n = 59) | 0.00 | 0.00 | 0.32 (0.47) | 0.02 (0.13) | 0.12 (0.33) | 0.00 | 0.17 (0.38) |
| Ikara (n = 50) | 0.00 | 0.00 | 0.54 (0.50) | 0.06 (0.24) | 0.10 (0.30) | 0.04 (0.26) | 0.12 (0.33) |
| Dawakin Kudu (n = 80) | 0.02 (0.16) | 0.04 (0.19) | 0.06 (0.24) | 0.37 (0.49) | 0.47 (0.50) | 0.02 (0.16) | 0.05 (0.22) |
| Dawakin Tofa (n = 72) | 0.51 (0.50) | 0.01 (0.12) | 0.01 (0.12) | 0.00 | 0.00 | 0.01 (0.12) | 0.00 |
| Minjibir (n = 29) | 0.72 (0.45) | 0.00 | 0.00 | 0.00 | 0.00 | 0.00 | 0.00 |
| Garko (n = 29) | 0.00 | 0.00 | 0.00 | 0.62 (0.49) | 0.45 (0.51) | 0.00 | 0.00 |
| Madobi (n = 51) | 0.08 (0.27) | 0.61 (0.49) | 0.13(0.35) | 0.25 (0.44) | 0.53 (0.50) | 0.00 | 0.00 |
| Gezawa (n = 51) | 0.06 (0.24) | 0.06 (0.24) | 0.47 (0.50) | 0.08 (0.27) | 0.14 (0.35) | 0.11 (0.33) | 0.14 (0.35) |
| Kumbutso (n = 50) | 0.02 (0.14) | 0.68 (0.47) | 0.58 (0.50) | 0.12 (0.33) | 0.10 (0.30) | 0.00 | 0.00 |
| Rimin Gado (n = 50) | 0.00 | 0.06 (0.24) | 0.96 (0.20) | 0.08 (0.27) | 0.04 (0.19) | 0.00 | 0.02 (0.14) |
| Total (N = 521) | 0.13 (0.34) | 0.14 (0.35) | 0.31 (0.46) | 0.15 (0.36) | 0.20 (0.40) | 0.02 (0.14) | 0.05 (0.22) |
| Explanatory Variables | Production-Oriented Strategies | Market-Oriented Strategies | |||||
|---|---|---|---|---|---|---|---|
| Producing Less Crops for Selling (1/0) | Producing More for Own Consumption (1/0) | Eat More Own Production (1/0) | Process More (1/0) | Store More (1/0) | Find New Markets (1/0) | Reduce the Selling Price (1/0) | |
| Age (years) | −0.01 (0.01) | 0.02 *** (0.00) | 4 × 10 –3 (0.01) | −0.01 ** (0.00) | −4 × 10⁻³ (0.01) | −0.04 *** (0.01) | 1 × 10⁻³ (0.01) |
| Level of education (years) | −0.023 (0.03) | −0.16 * (0.08) | 0.03 ** (0.02) | −0.02 (0.02) | −1 × 10⁻³ (0.01) | 8 × 10⁻³ (0.05) | 3 × 10– 3 (0.04) |
| HH head currently married (1/0) | 0.44 *** (0.09) | −0.51 (0.94) | −0.19 (0.29) | −0.88 ** (0.44) | −0.01 (0.17) | 0.47 ***(0.18) | −0.19 (0.22) |
| HH size (# people) | −0.04 *** (0.02) | 0.01 (0.09) | 0.03 (0.03) | −0.00 (0.03) | −0.07 *** (0.03) | −0.00 (0.06) | 0.06 (0.03) |
| HH assets index | −1.24 *** (0.43) | 1.53 ** (0.64) | 0.36 (0.71) | 0.08 (0.38) | −0.89 (0.67) | −0.73 (1.81) | −0.63 (0.47) |
| Production the last 12 months (1/0) | 0.15 (0.29) | 0.12 (0.29) | 0.18 (0.15) | 0.71 ** (0.34) | 0.09 (0.21) | −0.73 (0.87) | 0.55 ** (0.27) |
| Credit access (1/0) | −0.89 *** (0.25) | 4.95 * (2.61) | −0.01 (0.58) | −0.02 (0.23) | −0.03 (0.19) | 4.17 (23.76) | −2 × 10–11 (5.80) |
| Government extension services (1/0) | −0.53 (0.39) | 0.39 (0.43) | −0.01 (0.37) | −0.46 (0.28) | 0.54 (0.29) | 0.64 (0.71) | 0.65 ** (0.32) |
| Private extension services (1/0) | −0.61 *** (0.25) | 0.78 *** (0.14) | 0.53 (0.40) | −0.33 (0.41) | 0.29 (0.21) | −0.11 (0.47) | 0.05 (0.40) |
| Effects of COVID-19 (mean perception score) | −0.41 *** (0.13) | −0.18 (0.36) | 0.11 (0.18) | −1 × 10⁻³ (0.23) | 0.28 (0.17) | −0.014 (0.31) | −0.19 (0.22) |
| Challenge in accessing inputs (mean perception score) | −0.44 *** (0.16) | 0.25 (0.45) | −0.14 (0.15) | −0.40 (0.27) | −0.19 (0.26) | −0.69 ** (0.29) | −0.10 (0.24) |
| Challenge in storage and selling (mean perception score) | 1.16 *** (0.16) | −0.37 (0.30) | 0.11 (0.09) | 0.42 ** (0.20) | 0.09 (0.15) | 0.83 ** (0.36) | 0.50 (0.30) |
Publisher’s Note: MDPI stays neutral with regard to jurisdictional claims in published maps and institutional affiliations. |
© 2021 by the authors. Licensee MDPI, Basel, Switzerland. This article is an open access article distributed under the terms and conditions of the Creative Commons Attribution (CC BY) license (https://creativecommons.org/licenses/by/4.0/).
Share and Cite
Yegbemey, R.N.; Komlan Ahihou, C.M.; Olorunnipa, I.; Benali, M.; Afari-Sefa, V.; Schreinemachers, P. COVID-19 Effects and Resilience of Vegetable Farmers in North-Western Nigeria. Agronomy 2021, 11, 1808. https://doi.org/10.3390/agronomy11091808
Yegbemey RN, Komlan Ahihou CM, Olorunnipa I, Benali M, Afari-Sefa V, Schreinemachers P. COVID-19 Effects and Resilience of Vegetable Farmers in North-Western Nigeria. Agronomy. 2021; 11(9):1808. https://doi.org/10.3390/agronomy11091808
Chicago/Turabian StyleYegbemey, Rosaine N., Christelle M. Komlan Ahihou, Ifeoluwa Olorunnipa, Marwan Benali, Victor Afari-Sefa, and Pepijn Schreinemachers. 2021. "COVID-19 Effects and Resilience of Vegetable Farmers in North-Western Nigeria" Agronomy 11, no. 9: 1808. https://doi.org/10.3390/agronomy11091808