1. Introduction
After the detection of COVID-19 in late 2019, the virus spread across the globe, with over 624 million detected cases by October 2022 (
https://news.google.com/COVID19/map?hl=en-PK&mid=%2Fm%2F02j71&gl=PK&ceid=PK%3Aen, accessed on 14 February 2023). Due to COVID-19, the world has faced unprecedented health and economic challenges that have left the world at a halt. Recently, China and India have witnessed a resurgence of COVID-19 cases that in some way jeopardized their struggle against the pandemic. After the detection and spread of COVID-19, vaccines were developed at an unprecedented speed to lower the virus’s mortality rate. The vaccines have shown excellent results in immunogenicity and protection against this virus. The results also indicate that they effectively reduce the virus’s transmission. The vaccines can also provide immunity from severe diseases expected to last for around eight months to one year [
1]. Many countries faced the issue of a limited supply of vaccines regarding their demand. New variants of the COVID-19 virus, such as delta, omicron, and many others, arose based on mutations. Despite being vaccinated, individuals were affected by the virus due to these variants.
In the early stages of the pandemic, the world needed mass production of vaccines to overcome the limited supply and meet the disastrous situation’s demands. Different countries faced the problem of vaccine production due to a lack of resources, eventually impacting their production capacity [
2]. On the other hand, new variants of COVID-19 challenged the effectiveness of the so-called fully vaccinated individuals. In such a situation, it could be essential to identify who should be vaccinated first to control the spread of the virus. Different healthcare professionals proposed rules and regulations, as well as organizational measures to prevent virus transmission [
3].
With the prevalent spread of COVID-19 along with all the variants and the expectation to have new variants, the demand for an all-time effective vaccine still exists today. In the meantime, anti-vaccine activists have polarized millions of people in North America and Europe, who do not follow the vaccination course because of being influenced by plenty of fake news. Furthermore, recently, the resilience shown by the Chinese people towards the complete lockdown because of the recent surge in the virus effectiveness demands new ways to handle the case of the pandemic spread. In case of an emergence of any new variant of COVID-19, the existing complete lockdown strategy enforced by many countries might be challenged. The lockdown and mass-scale blocking of economic activities have shaken several economies worldwide. The economic comeback of many countries is far from the expectation in case of expected recession worldwide this year.
Among the affected in multiple factions of life, the educational institutions received the most severe consequences of the lockdown strategy. The complete shutdown of the universities and schools caused uncertain changes in the attitudes of the youth in isolation. Educational institutes are considered key players in disease transmission with a substantial public health impact. In the context of the pandemic, institutes around the globe tried to find the best strategies to reorganize their activities to minimize the risk of contagion among their students. Preventive measures were taken to prevent the faculty and staff during the internal virus outbreak [
4]. Going online at an educational institution became the only option during the COVID-19 period, significantly impacting the global education system.
Most institutes started implementing virtual classes; however, due to the lack of available facilities and relevant staff training, delivering online lectures was unsuccessful. On the other hand, students could not receive their full attention and reflect their best in online teaching. In such cases, institutes were forced to develop strategies to conduct on-campus classes so that the lectures were delivered in a steady flow while limiting the spread of the virus to the minimum. Consequently, the physical attendance of students on campus on alternate days was the best solution to reduce student strength, thereby avoiding the congestion of students on campus and controlling the spread of viruses. By allowing students to attend classes on alternating days, we should be able to identify, isolate or vaccinate individuals who can slow down the transmission rate of the virus.
Because of the unprecedented situation caused by the pandemic, several studies have proposed different strategies to mitigate the adverse effects of the complete lockdown at universities. A holistic approach recommends that institutions identify the infected students early by speeding up the detection process, reducing the spread of COVID-19 in respective groups [
5]. A simulation-based study evaluated the effectiveness of the spread of COVID-19 viruses by limiting human mobility. The study considered group-to-group interactions instead of considering individuals as spreaders among the groups [
6]. Considering e-learning as an alternative to the physical learning environment was left as the only option; however, improving group-based learning methodology is proposed by [
7] to reduce the spread faster. The COVID-19 era has passed. However, few interventions have been made to identify smart methods for keeping the universities running while reducing the risk of spread. A strategy was proposed to identify the critical nodes first to prioritize the vaccination process with the expectation of minimizing the spread over the network [
8]. This study is closest to our method, considering the human interactions in the form of networks and then vaccinating the key figures, having most of the spread risk accordingly. After an exhaustive literature search, it can be stated that social-network-analysis-based elimination of key university students has not been studied well and demands detailed analysis.
According to the social network (SN) theories, human interaction tends to form networks. These networks hold several attributes that can be called complex networks technically. In most real-world networks, structural patterns exist that can be used to model the rate of the spread of information, virus, technology adoption, and many more. SN-based studies have revealed that not all nodes contribute equally toward spreading information or viruses among the networks. However, there exists a few highly centric nodes with a high tendency to spread information or viruses faster than the rest of the nodes in the networks.
Based on the social network theories, it can be hypothesized that university students’ interactions may result in the emergence of complex network formation. These networks will also possess a few highly centric nodes as compared to the average degree of each node in the network. Individuals with higher centrality scores will have more tendency to spread the virus; thus, they should be vaccinated first to slow the spread of COVID-19. Otherwise, such individuals should be isolated from the rest of the community to break down the respective information/virus propagation pathways. The following section shares an outline of the structural properties of complex networks and the formal definition of centralities in such networks.
Complex Networks and Key Nodes
Complex networks contain challenges, including identifying critical nodes, identifying communities of interest, and modeling the network on incomplete information.
In recent years, due to wide-scale applications and great theoretical significance, the identification of influential nodes in complex networks has attracted much attention, such as in disease control [
9,
10,
11], 10 transportation systems [
12], network cascades [
13], cooperative framework [
14], mobility networks [
15], distribution of infections [
16], and many more.
A random network model [
17] is presented for the traditional epidemic spread models, such as the susceptible–infectious–recovered (SIR) model [
18]. A network of patients, hospitals, and an inter-hospital-transfer-based model is presented where nodes represent patients and hospitals [
14].
Several network properties, including density, the clustering coefficient, and degree centrality, are considered in the present study for a better representation of the student interaction networks. Graph density of networks can be defined as the ratio of the number of edges with reference to maximum probable edges [
19]. Graph density describes the connections and differences in the networks having the same type of relationships. The clustering coefficient is another property of a network, and it is defined as a measure of the number of nodes contributing to the formation of triads [
20]. Degree centrality, closeness centrality, and betweenness centrality can be used to define the key or influential nodes [
21]. By using all the properties mentioned earlier, we can analyze the role of each node in a network, and thereby apply strategies to restrict COVID-19 accordingly.
There exist several methods to predict the structure of complex networks from data; the Watts–Strogatz model [
22], Erdős–Rényi [
23] model, and the sequential algorithm model [
24]. These models can be employed to formulate network models from certain information.
Although several research articles have been published recently on educational institutes [
3,
25,
26,
27,
28,
29], to the best of our knowledge, none of them have taken into account the communication structures of students within a class and their influence on the transmission of this contagious virus. The socio-pattern dataset is based on school-based students’ interaction data in a specific setting. The number of students is limited to 118 [
30]. Generalizing the social interaction patterns found at the school level to university-level institutions is not possible, until the studies are replicated and validated under the same settings.
In the present study, we obtained data from more than 20 sections/classes of the university. The university classes are composed of elective classes mainly, which are different from the school structure (particularly in southeast Asia). Several network modeling techniques are used to model the students’ interaction networks to observe the criticality of several nodes. We had to approximate the network as we had incomplete interaction data.
In this work, the construction of an interaction network was a challenging task. Without using the sensors, we predicted the network from the questionnaire. The approximated networks were validated from the trends found with likewise class data. In the first stage, class networks were predicted, and then the inter-class relationships were predicted. This attempt is closer to the local situation, which can be mapped in our local universities. Therefore, this technique can be used in our local settings. In the presence of other studies, none of the universities reported anything on using complex network methods for a smart lockdown or anything similar.
This research provides insight into how communication within a class occurs and visualizes the role of nodes having distinct network properties. It provides a comparative analysis of different graph generation models and the role of key transmitter nodes in institutional networks. This research focuses on the student–student interaction in educational institutes to control viral spread. This interaction is analyzed by using two types of networks, i.e., the multivariate single-class networks of different classes. The solution proposed in this research is to avoid the complete lockdown or complete online studies at the universities/institutes by reducing the interaction significantly.
The contributions of this paper are as follows:
A novel smart method is proposed and applied to identify the interaction networks among university-level students and identify critical nodes;
The effectiveness of network modeling techniques is presented for the student’s interaction networks;
The study shows that removing a few critical nodes from our methods, i.e., the students, will significantly drop the rate of the spread of a potential virus among the entire network. Higher education institutions can use this technique to avoid a complete lockdown in case of a pandemic in the future.
The rest of the paper is organized as follows.
Section 2 highlights the research methodology discussion, followed by the data collection process described in
Section 3. The network analysis is conducted in
Section 4. The results and discussion of those results are formulated in
Section 5 and
Section 6, respectively. The SNA modeling approaches were highlighted in the research methodology, along with a comparison of each. Furthermore, the pragmatics of employing SNA techniques over the students’ interaction networks are presented in detail under the context of a virus spread on established spread models.
2. Research Methodology
This paper addresses the gap in applying SNA for preventing internal outbreaks within educational institutes, providing a methodology to support occupational health and safety services in designing and selecting preventive measures to reduce the risk of epidemics.
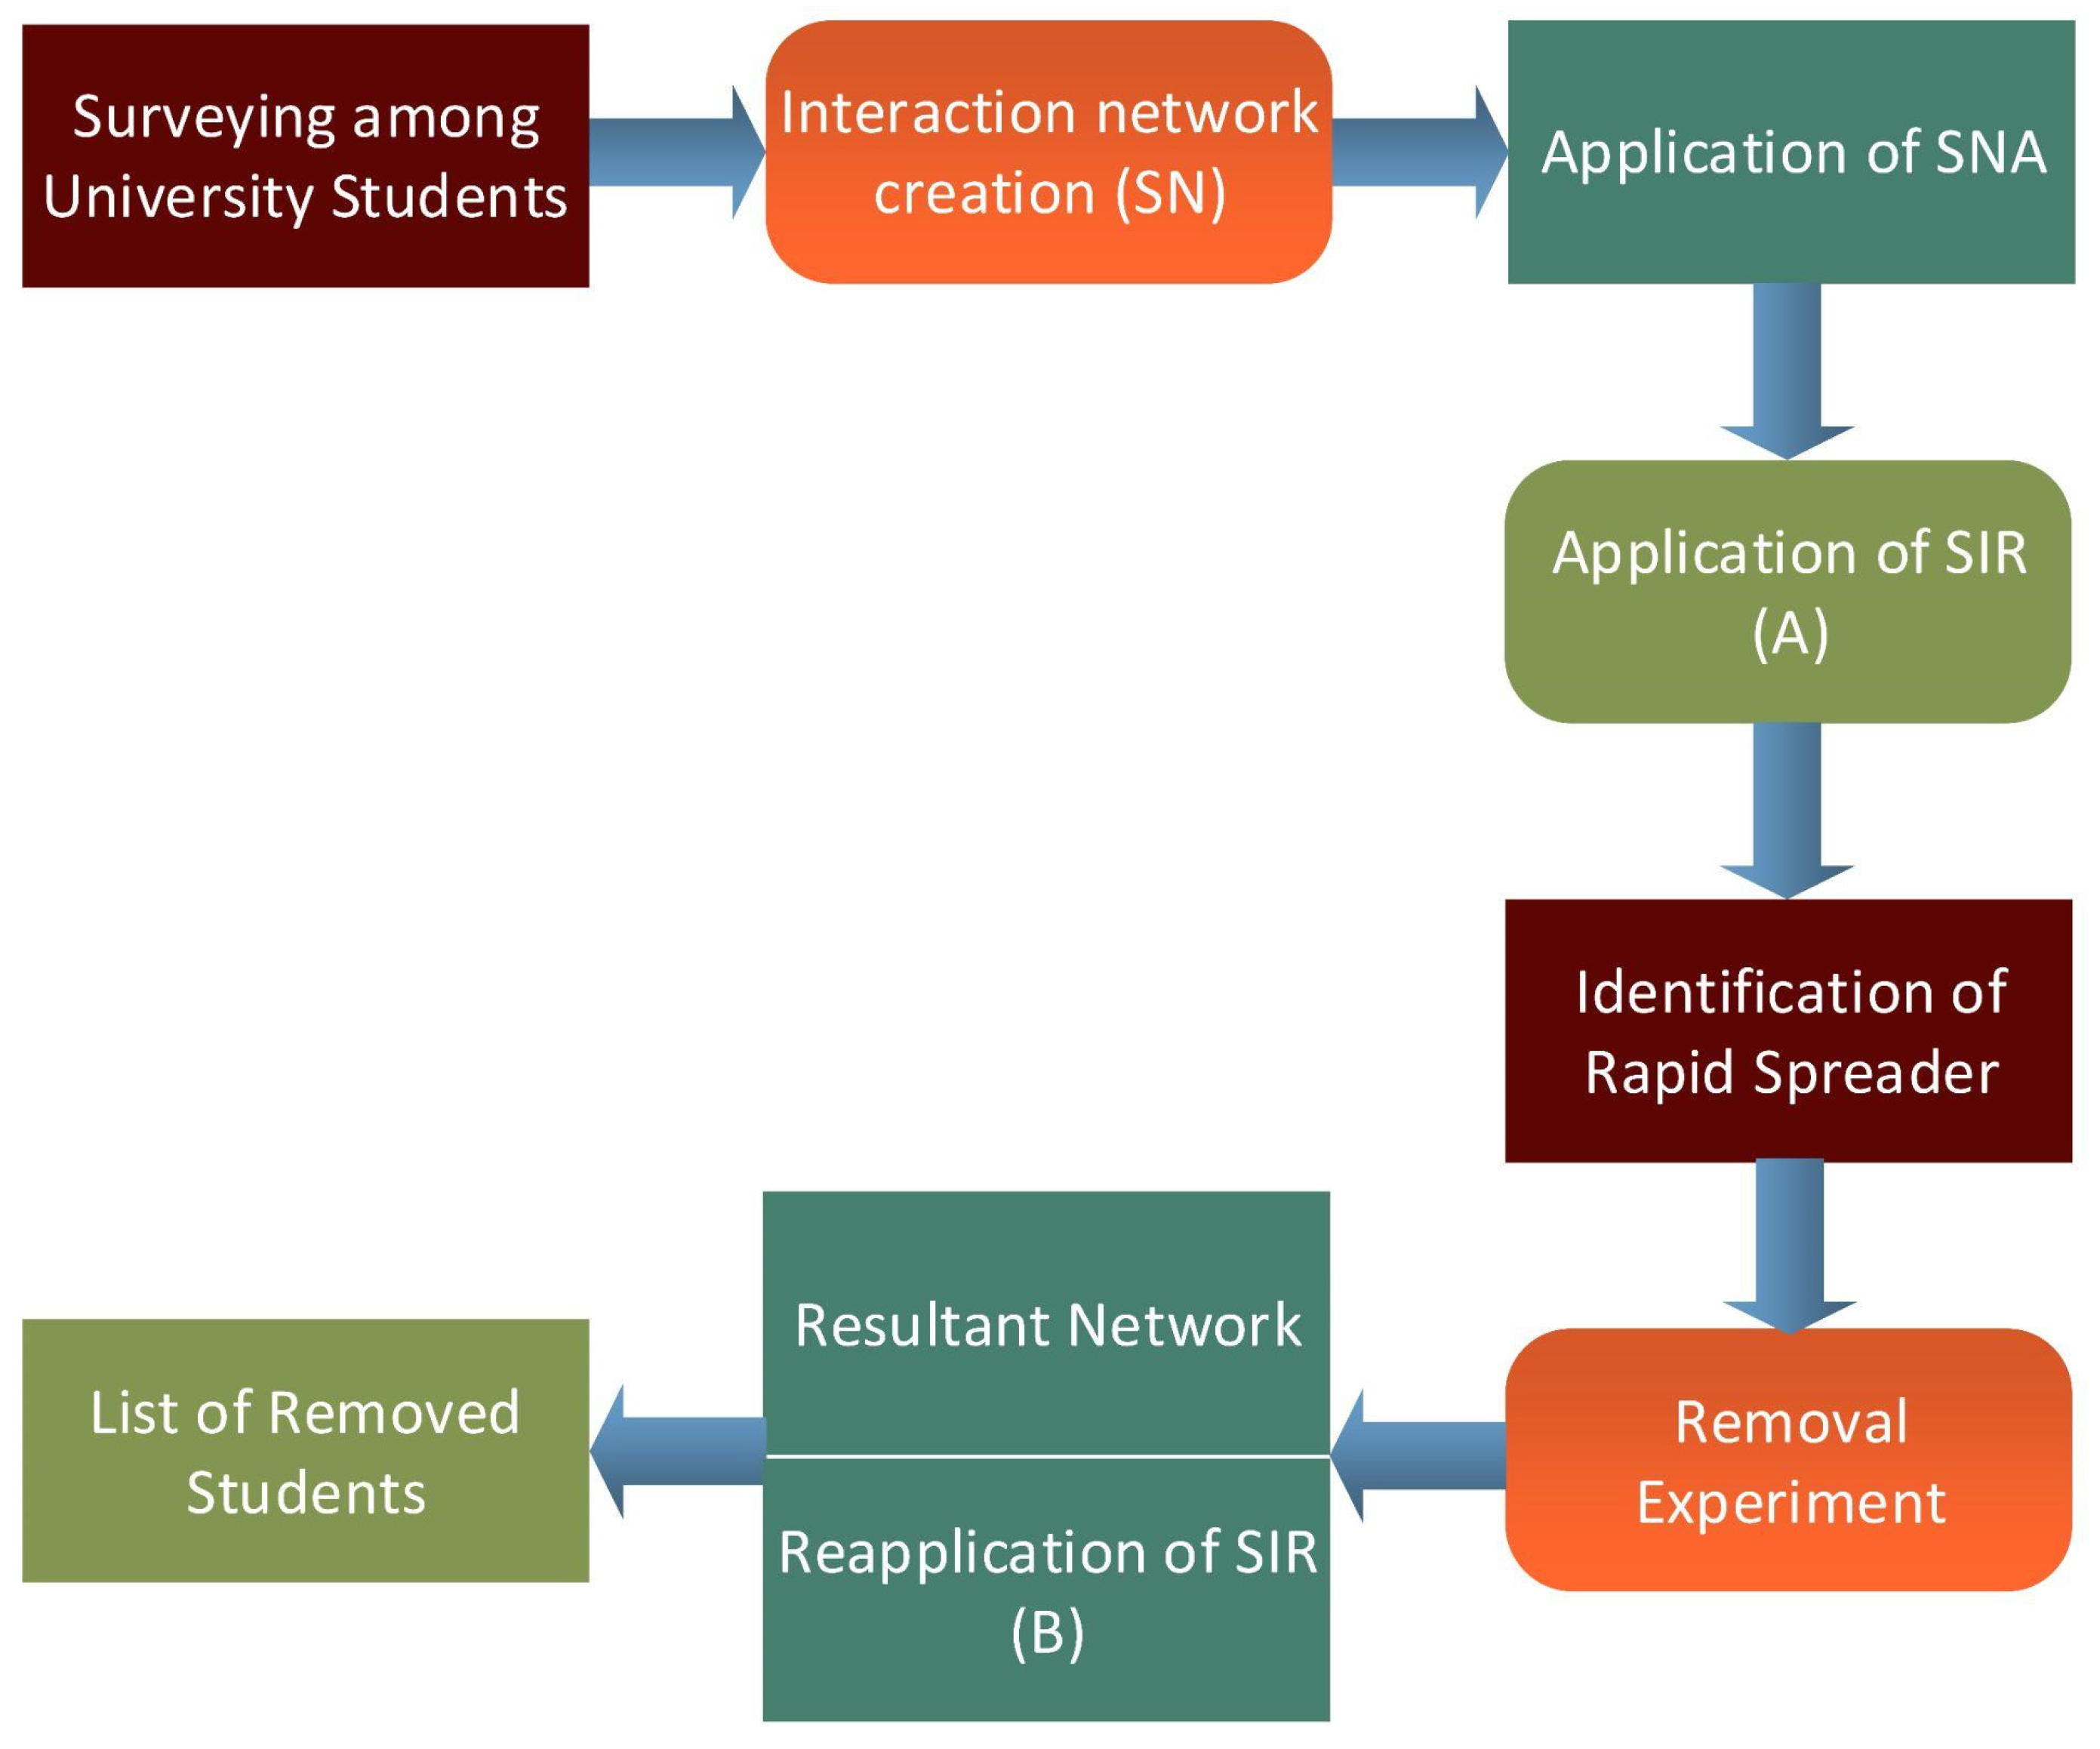
Figure 1 presents the stages of the study, including surveying students, modeling social networks, observing key attributes at the network level, applying the SIR model, and the role of node removal over different types of networks.
3. Data Collection
Initially, students’ data are needed to simulate a network and visualize how class communication occurs between the students. After creating a network, different social network analysis techniques were applied to analyze the structure of the network and the role of additional attributes. The foremost step is to collect data from university students, which results in the development of social networks. A questionnaire was generated and distributed among the undergraduate classes of the university. The following questions were included in the survey.
How many friends do they have in the class?
How many people do they usually have discussions with for more than 10 min?
How many popular students are there in this class?
Are you a popular student in this class?
The first question is asked to connect to their respective nodes in the generated network. Knowing their class friends, we could use this as a degree attribute in the network. The second question signified the count of their strong and weak connections in the network. The next question was asked to identify several highly centric nodes in the class that might be key transmitters of the virus. The last questions told us whether they were the highly centric-nodes of the class network or not.
The data were collected from different batches of students enrolled in various courses. Their distribution is shown in
Table 1.
3.1. Social Network Generation
Through a survey, a large dataset was developed about the interaction pattern of students. A threshold was set to a minimum of twenty (20) responses per class to model the network from the data. The survey did not include the identity of any of the students to maintain ethical standards.
3.2. Watts–Strogatz
The Watts–Strogatz model is employed on the given data to simulate a small-world network [
22]. By generating a network for each class individually, we can validate our data by analyzing their social network attributes. All networks show the same pattern in their network attribute values.
3.3. Erdős–Rényi
The second model was used to simulate the network is Erdős–Rényi. The model creates a random network with mean degree of
k = Np [
23]. It simulates a network with a low clustering coefficient. For creating a network using the Erdős–Rényi model, the required parameters are N (number of edges) and P (probability of adding an edge between nodes). The number of students is taken as the value for N for each class, while the value of
p is equal to 0.5.
The distribution of edges among nodes based on different models is depicted in the
Table 2, which also presents network properties to compare the results of each model. The Erdős–Rényi model, compared to the other two models, has a higher density on average but a lower clustering coefficient.
The proposed methodology is applied to the graphs that are generated through the dataset collected from the questionnaire. The developed dataset is based on the responses of 358 students. These students belong to 29 different class sections having enrolments in 53 other courses. The data are then transformed into various forms to generate networks using different models. Each model creates a network of 19 different class sections with a response of more than the threshold value, i.e., 20 responses minimum.
Figure 2 and
Figure 3 represent the structure of the networks generated by the following network-generating modeling techniques.
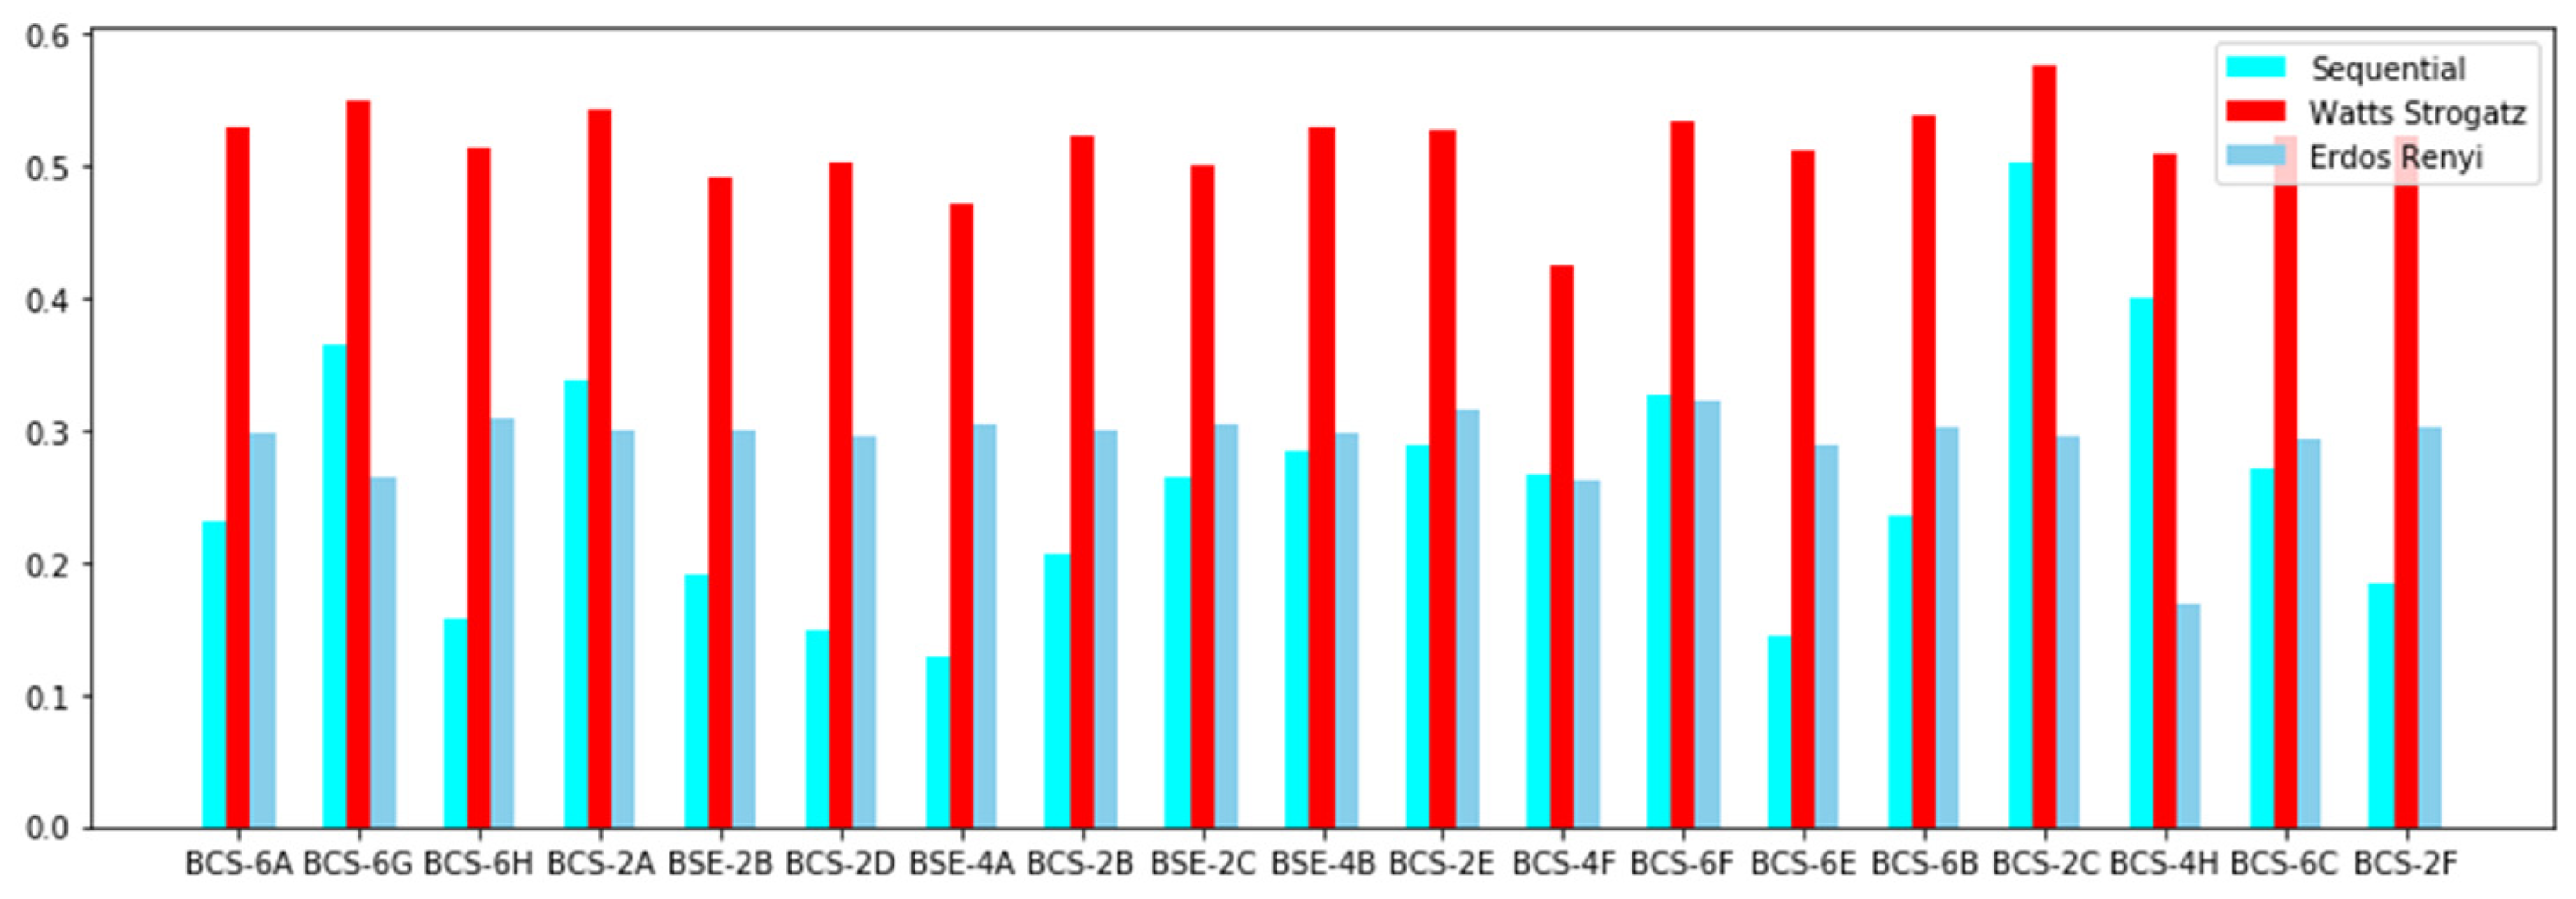
Figure 4 presents the difference among the generated networks based on the density attribute. Among the generated networks,
Figure 5 represents the difference on the basis of the clustering coefficients. This shows that the Watts model has a higher clustering coefficients than the other two models, which refers to the nature of networks closer to the real-world networks. An outline is presented in the following section regarding the network-generating models.
3.4. Sequential Model
To develop a real-world network, a sequential model is used to simulate the social network of each class. This model uses the sum of degrees of each node in a network and generates a maximum degree [
24]. The algorithm for this model [
24] is provided below
Start with an empty set E of edges. Let also d = (d1, …, dn) be an n-tuple of integers and initialize it by d = d;
Choose two vertices, vi, vj ∈ V, with probability proportion didj(1 − didj) among all pairs of i, j with i ≠ j and (vi, vj) ∈ E. Add (vi, vj) to E and reduce each of d1, d1j by 1;
Repeat step (2) until no more edges can be added to E;
If |𝐸| < 2𝑚 report failure and restart from step (1), otherwise output 𝐺 = (𝑉, 𝐸).
For this model, we used the number of friends provided in the survey as the degree of each individual in the class. For our research, we called these individual classes intra-class networks.
4. Network Analysis
The assessments of the generated networks are performed in two ways. First, the overall network characteristics are assessed, most of which relate to the network’s cohesion. Second, the role of each node in the network contributes to the overall cohesion of the network; hence, the spread of the virus is analyzed. Generally, the network’s cohesion metrics of students will provide a reference value to analyze how the different measures taken on the node influenced the values. The main cohesion metrics that are evaluated are as follows:
The
average degree represents the average ties per node, so a student is tied to how many other students are in a class. For the reduction of the contagion risk, the lower the rate value, the better.
Network Density is the ratio of observed edges to the number of possible edges for a given network. Hence, it represents the number of ties; students are divided by the maximum number of connections in the network. The lower this rate, the better for containing the risk of the spread of contagion. The density of the network with total nodes
n with cardinality
m can be defined by
The Clustering Coefficient measures how connected a vertex’s neighbors are to one another. So a high clustering coefficient means the students are tightly formed in a group. The clustering coefficient of the network with nodes
N, each having degree
ki and
Li number of edges between
ki neighbors of node
i, can be represented as:
4.1. Susceptible–Infectious–Recovered (SIR)
Different mathematical methods are available to determine the impact of strong and weak ties in spreading a pandemic. One of them is the susceptible–infectious–recovered (SIR) model, which has been the choice of many researchers in studying the COVID-19 spread patterns [
24]. This model calculates the theoretical number of infected people in a population over some time. It works by making three different groups of a population studied. The groups are susceptible, infectious, and recovered. Everyone in that population can be in any of the abovementioned groups at a given time. Initially, all the individuals are put in the susceptible compartment because they might contract the disease and become infected. The individuals who are once infected progress toward the recovery group. This recovery group contains individuals who are no longer a threat for spreading the disease and can be either dead or recovered [
25].
In this research, influential nodes are identified by different methods, and the SIR model was applied after removing nodes from each technique. By using the SIR model to the network formed after the removal of nodes, we can identify how we can restrict the spread of the virus by taking these individuals out of the picture by either quarantine, isolation, vaccination, or extra protective health and safety measures, and we did this by mapping our data onto a network and finding out the effect of taking out selected data.
4.2. Identification of Potential Rapid Spreaders
Once the cohesion metrics are calculated for all networks of students for the baseline scenario, a strategy was built to identify which nodes should be removed from the network. By removing the nodes, we could analyze which nodes play a vital role in transmitting the virus. For this purpose, we considered the following strategies to identify the influential nodes in a network.
Degree centrality (DC) indicates whether the node is centric in a network. Generally, nodes with high centrality also have high degrees [
31]. The nodes having high centrality can be considered the key spreaders, as they are the centric nodes and also have high degrees, due to which they can transmit the virus across the network. This node works as the joining link in the network. By removing these nodes, we could analyze how the centrality node plays a role in spreading the virus. By eliminating the node using this strategy, we could observe the spread by analyzing the network’s cohesion metrics. The DC of node
i, is defined as Du et al. [
32]
Betweenness centrality is a way of detecting the amount of influence a node has over the flow of information in a graph [
31]. It is often used to find nodes that bridge one part of a graph to another. This parameter would help us analyze how nodes that serve as a bridge play a role in transmitting the virus within the network. The BC of node
i is defined as Du et al. [
32]
Closeness centrality (CC) is a way of detecting nodes that can spread information very efficiently through a graph [
31]. The closeness centrality of a node measures its average farness (inverse distance) to all other nodes. Nodes with a high closeness score have the shortest distances to all other nodes. The CC of node
i is defined by Du et al. [
32]
The PageRank (PR) algorithm [
33] is a famous variant of eigenvector centrality and is used to rank websites in the Google search engine and other commercial scenarios [
33,
34]. Like the eigenvector centrality, PageRank supposes that the importance of a webpage is determined by both the quantity and the quality of the pages linked to it [
35]. Initially, each node obtains a one-unit PR value. Then, every node evenly distributes the PR value to its neighbors along its outgoing links. Mathematically, the PR value of node vi at
t step is [
36]
Most countries are currently using a random removal strategy to vaccinate their citizens. The same approach was used in our research to randomly select a node from the class and then vaccinate it and observe how the selection of this node has affected the overall network attributes, and hence, impacted the spread of the virus.
The influential nodes that can promote the most virus transmission are identified using the above strategies. A threshold was set to 5 percent for each iteration. The given threshold independently removes nodes identified by each strategy, and their cohesion metrics are calculated. By comparing the impacts of each strategy on cohesion metrics on the generated network, we can point out influential nodes identified by which strategy diffuses the network more rapidly and slows the transmission rate of the virus.
5. Results
The proposed methodology is applied to the graphs that are generated through the dataset collected from the questionnaire. The developed dataset is based on the responses of 358 students. These students belong to 29 different class sections having enrolments in 53 other courses. The data are then transformed into various forms to generate networks using different models. Each model creates a network of 19 different class sections with a response of more than the threshold value, i.e., 20 responses minimum.
After the Erdős–Rényi, Watts–Strogatz, and sequential model networks were generated, the node removal process was performed. In this process, nodes are removed using influential node identification strategies. Multiple iterations are performed in which 5 percent of nodes are removed using each strategy. After each iteration, network attributes are calculated to compare their changes. Nodes are kept removed until 50 percent of nodes are removed from each network and their attributes are calculated.
5.1. Effects on Graph Density
Measuring the graphs’ density can help us identify sparse versus dense connections among the students or the nodes. Density is computed over the generated graph of each class section. Among all the strategies, only two of the class sections have minor differences; otherwise, most of the class sections reflect the same results. The initial density of section BCS-2C was calculated as A 0.33. In the first iteration, 5% of nodes were removed from the network based on different centrality-based and random selections. The centrality-based strategies and PageRank provided similar results on various iterations. After removing nodes, the density of centrality-based removal graphs decreased to 0.27, while for the random selection, the density was 0.31. The difference between each strategy was 0.04, and centrality-based removal provided better results than random removal. After the removal of 50% of nodes, the density of the centrality-based strategy decreased to 0.13, with an average of 0.04 decrease per iteration, while the random nodes removal density increased to 0.34. The same behavior can be observed in section BCS-6G. In the rest of the class sections, centrality-based and PageRank removal provided better results, with density decreasing in each iteration. In contrast, the random removal strategy’s effect on density was very minute.
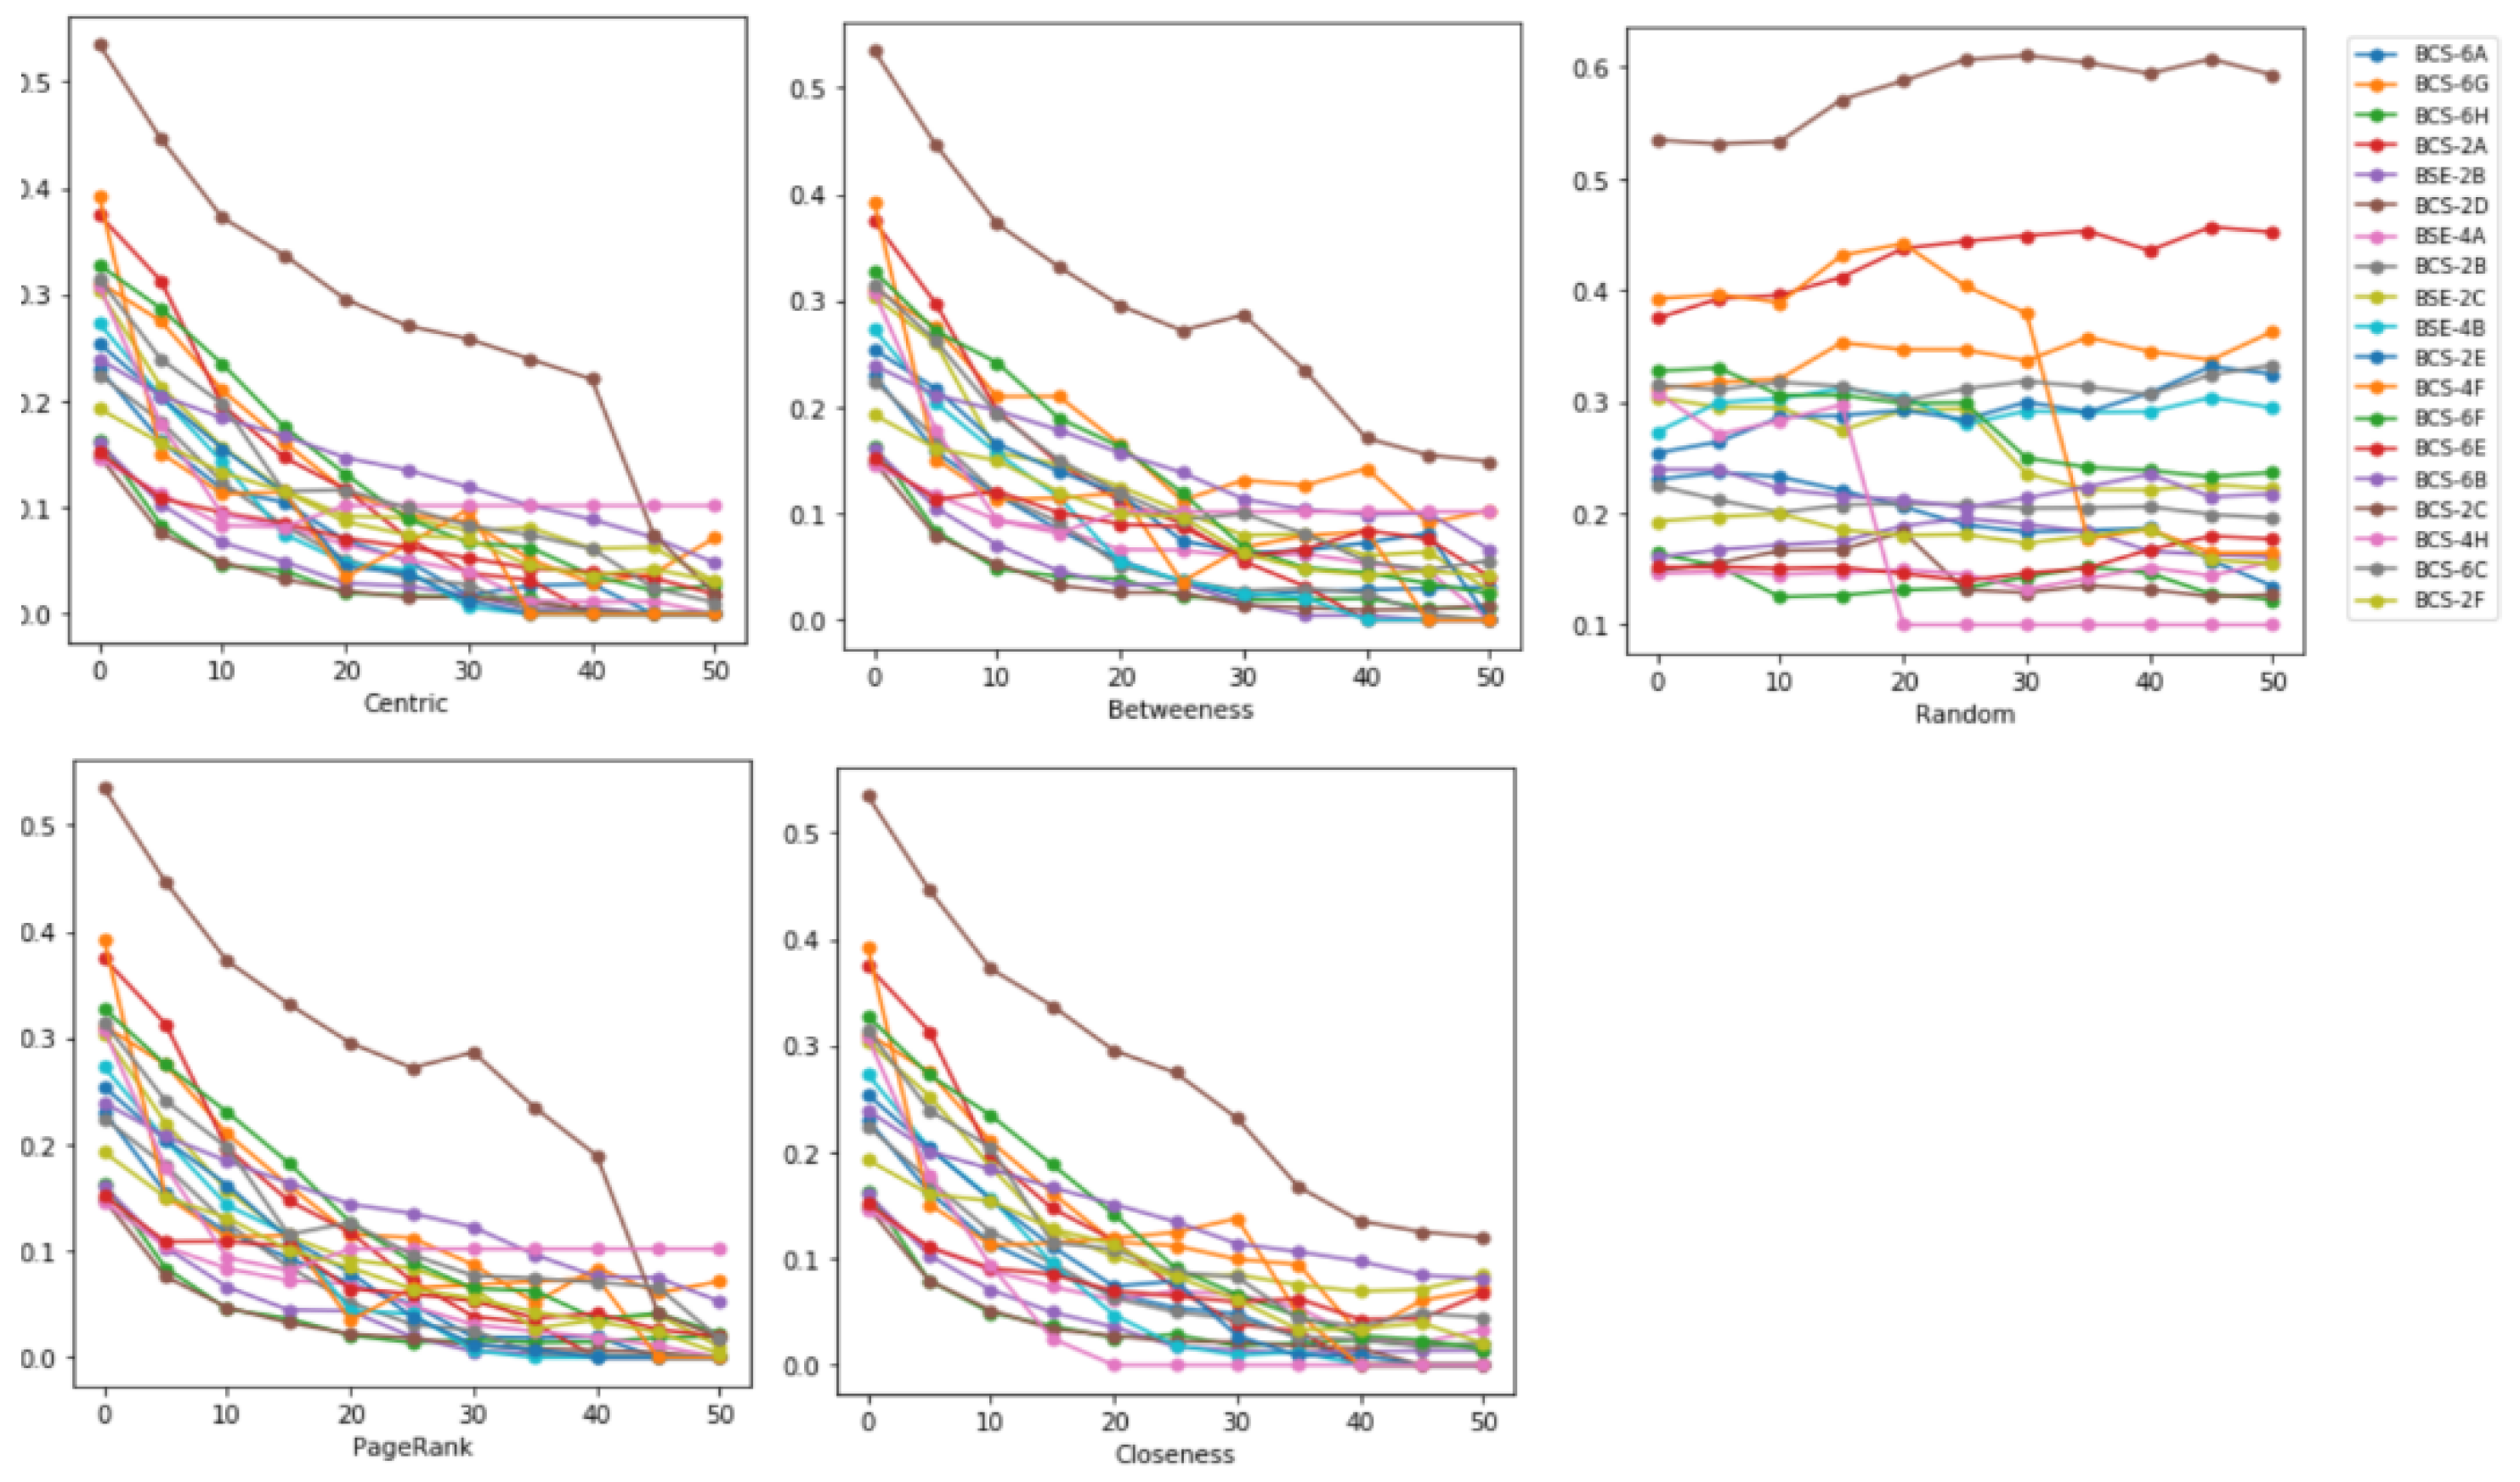
Figure 6 displays the density value after each iteration for the sequential model. It is observed that the density decreases more rapidly in a centrality-based removal strategy concerning each iteration. On the other hand, the density is not always decreased when nodes are eliminated using the random technique; occasionally, it rises or stays the same. The network’s density decreases when nodes are eliminated based on centrality and PageRank measurements, and this tendency is seen across all 19 class sections. In comparison with the random removal of nodes, the network density increases in most of the class sections when nodes are gradually removed.
Figure 5 shows that the density of the majority of class sections declined by 50% in less than 20 iterations.
5.2. Effects on Clustering Coefficient
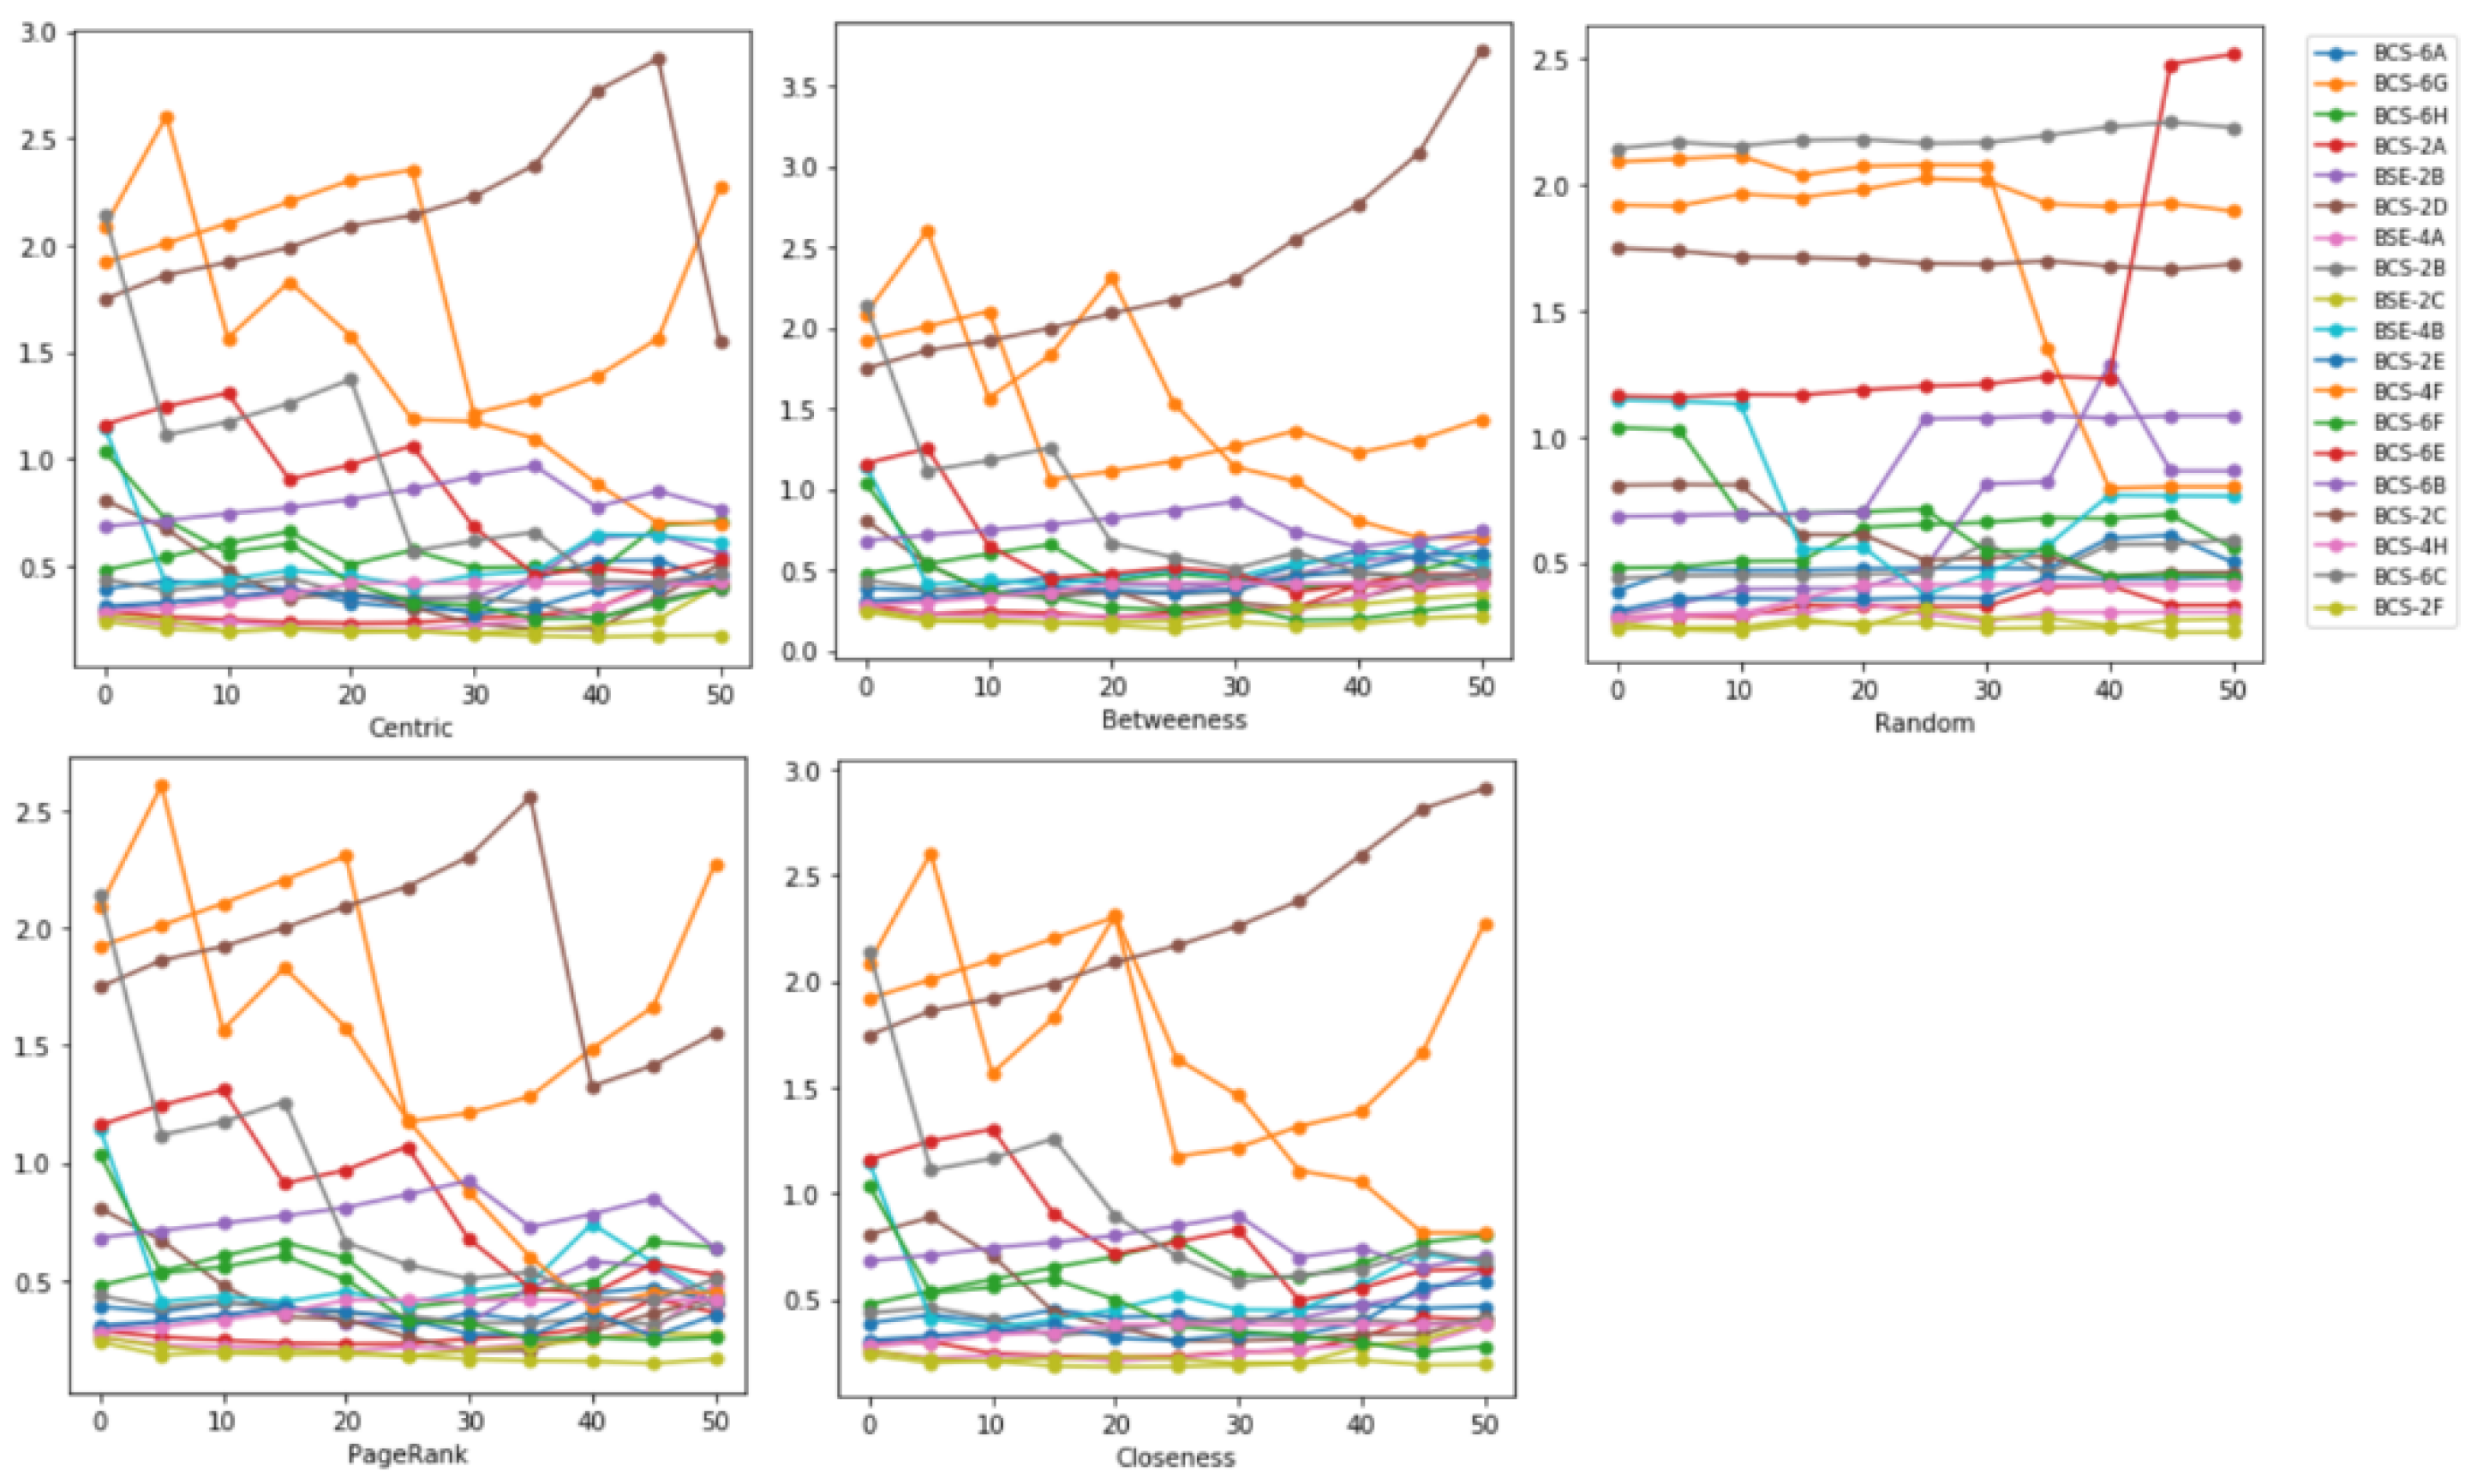
The clustering coefficient also showed a similar behavior on node removal in each iteration. Networks in which nodes are removed using high centrality converge to the optimum clustering coefficient, their value decreases without divergence. In comparison, PageRank provided the second best results by converging to the optimum with a single divergent. Betweenness and closeness did not converge to the optimum but provided similar results. Both provided the maximum clustering coefficient of 0.15, while high centrality and PageRank gave the maximum clustering coefficient of 0.1. Randomly selected nodes gave the worst result by diverging in most cases and gave a maximum clustering coefficient of 0.6. In most of the class sections, the clustering coefficient increased or remained the same. It converges to near optimum in only 4 out of 20 class sections. This decrease in clustering coefficient value proves that the network’s connectedness is decreasing,
Figure 7. By selecting nodes on centrality measures, the network becomes disconnected. Using these results, we can see how by selecting highly centric nodes, the positivity rate of the virus can declined, and the transmission of the virus can be controlled.
5.3. Effects on Average Path Length
By observing the average path length metric, we can identify how far a node is from another node in a network. With this, we can find the transmission path of the virus. The longer it takes for nodes to connect, the slower the transmission rate will be. All strategies except random provided the same results in all of the instances. In just one instance, betweenness centrality and closeness centrality provided better results with a higher average path length than the centrality and PageRank results. Using a random strategy, 90% of the instances did not show any change in their average path length from the first iteration to the last,
Figure 8.
5.4. Virus Transmission Using SIR
In this study, after node removal in each iteration, the SIR model was applied to a network generated based on all strategies. By using the SIR model, we can identify which influential node identification method best diffuses the technique to restrict the spread of the virus. After identifying the influential nodes, these nodes were removed from the network and the SIR model was utilized to analyze the transmission rate of viruses within the network. After a 25% node removal from each strategy, for highly centric strategies, the maximum infection reached 145 nodes having an average maximum infection between 60 to 100 individuals. The infection lasted 150 days, and most instances lasted between 25 and 50 days. The betweenness strategy observed the same behavior, but the maximum infection lasted 90 days, with an average range between 30 and 60 days. Similarly, PageRank and closeness strategy had a similar maximum infection rate, but maximum infection lasted 68 and 85 days, respectively, with an average ranging between 30 to 50 and 20 to 60 days.
The infection rate in networks generated due to random strategy had a maximum infection of 158 individuals with an average range between 60 to 110 days. The infection lasted in the network for 100 days, with an average between 25 to 60 days. This behavior can be visualized in
Figure 9.
From these results, we can observe that highly centric nodes have the fastest infection spread, while the closeness, betweenness, and closeness have a comparatively slower infection spread within the network. Places where there is no shortage of medical supplies to treat the infection can tackle the spread rate and mitigate the diffusion rate of the virus. The disadvantage of this strategy is that most individuals become infected in a short period due to limited resource locality, so treating all individuals in a short period would not be easy. Instead, treating 140 individuals in a year would be more feasible compared to 50 individuals in a day.
The virus spread in-betweenness, closeness, and PageRank strategy gives an advantage because the infection within the network spreads slowly. It takes longer to infect all individuals and decreases the maximum number of infected individuals at a given time. By identifying individuals using this strategy in locations where there is a lack of medical resources to treat the infected, we can effectively target the resources to treat individuals. We can easily manage to mitigate the transmission of the virus.
5.5. Analysis of Erdős–Rényi and Watts–Strogatz Networks
For the gathered data, random and small-world networks are generated for all class sections. To analyze the effects of both strategies on these networks, similar to the sequential model, the node removal process was performed, and all cohesion metrics were calculated. A homogenous pattern similar to a sequential model was observed as density and clustering coefficients decreased more rapidly in centric-based removal. In contrast, density in random removal displayed mixed results that mainly remained at the same density value.
By selecting nodes based on the centrality measure, we can identify such nodes that can be labeled as the key nodes of the network. These nodes play a vital role in the cohesion of the network and can be the top transmitters of the virus. However, if we select a node randomly, the probability of the key node being selected is very low.
In
Figure 5,
Figure 6 and
Figure 7, it can be visualized that removing the nodes having high centrality reduces the impact on the cohesion metrics of the graph. In only a few cases of randomly selected nodes, we can observe that the density is reduced; however, in most cases, it increases or remains the same. While in all cases of highly centric node removal, the density decreases, or in some instances, it remains the same. We can also observe a similar pattern on average path length and clustering coefficient. The clustering coefficient of the graph drops rapidly on highly centric node removal, while on the random node selection, it does not give a constant change; instead, it can be observed that the clustering coefficient increases and also decreases in a random selection of nodes.
In case individuals are selected based on centric value, we can observe a similar pattern in the COVID-19 positivity rate and control the spread by selecting key individuals with high centrality measures rather than randomly selecting individuals.
6. Discussion and Limitations
This study has demonstrated a strategy that can be used to deal with an emergency state at educational institutions in COVID-19-affected cities. A detailed survey was conducted at a university to identify the homogeneity among the network structure at inter- and intra-class interactions. Initially, the data were collected in batches to generate networks using different models like the Watts–Strogatz model [
22], the Erdős–Rényi model [
23], and the sequential algorithm model [
24]. The modeled networks represent the social interaction networks of each class. The assessment of social networks is widely performed based on multiple measures, including centrality, modularity, and resilience. The centrality measure refers to the structural representation of the network regarding the presence of highly centric nodes, which distinguishes a random network from a classical complex network. The modularity represents the overall topological connectedness among the subnetworks of the networks. A network’s resilience indicates a network’s ability to hold its properties after removing certain nodes. In the present study, network centrality measures were computed, including average degree, density, and clustering coefficient. Based on the found interactions, the generated networks were then evaluated regarding resilience towards rapidly spreading the virus.
The predicted social networks of students’ interaction are evaluated to compute the resilience of these networks. The notion behind evaluating resilience is to identify the networks’ structural sensitivity over removing fewer nodes. While considering the predicted students’ network as complex networks, it is hypothesized that removing a few ‘selected’ nodes would have more impact on the networks than removing randomly picked nodes. The node removal method was employed to evaluate the resilience of the networks. The nodes were removed from the network by using popular, influential node identification strategies based on degree centrality, betweenness centrality, closeness centrality, PageRank, and based on random removal. Considering each centrality measure, the top-scored nodes were removed. The impact of the removal of prospective influential nodes in comparison to the randomly selected nodes is first observed over the network properties, including the average path length, density, and clustering coefficient of each network. To address the core problem of restricting the potential spread of the virus over the network, we further investigated the spread over the resultant networks. Susceptible–infectious–recovered (SIR) model was used to evaluate, and then the SIR model was applied to analyze the transmission of the contagions. Iteratively, all the generated networks were evaluated, and it was found that highly centric node removal reduces the spread compared to the randomly selected node removal. In the presence of complex network structures having highly centric nodes, the virus among the neighbors tends to spread rapidly, and it reduces the overall network diameter. That can be interpreted in the prevalence of complex network attributes in student interaction networks.
The present study limited its scope to understanding the intra-class interaction patterns that can be considered strong ties in the literature on social networks. However, one can investigate the impact of the long ties while viewing the entire university as a single network to model the spread of long-range connections, e.g., through members of sport groups or drama societies. The interacting students may not be highly centric within the class but can transmit the virus in communities at longer distances. Furthermore, the area of complex networks has recently observed advances in mesoscopic centrality awareness node significance. It refers to the idea that community structures may possess significant information regarding highly centric individuals within the community, but do not receive attention from centrality-score mining algorithms at the network level. This information may open new avenues for scientists to examine the discussed problem differently.
These results will help to manage the classes during the serge of any possible COVID-19 variant by isolating the influential nodes or prioritizing complete vaccination courses. From the result, we can observe that the nodes selected for vaccination from centrality measures decrease the density and other cohesion metrics compared to randomly selected nodes. The spread of the virus can be reduced by simply choosing the top-network contributors and isolating or immunizing them. The overall positive rate of COVID-19 can be reduced, and its dissemination can be controlled by choosing and immunizing people with high-centric values. By using such techniques, universities can avoid total lockdown, or not achieve “complete lockdown,” they can continue their academic endeavors. The schools have different social structures, particularly in South East Asia. Therefore, it has been mentioned repeatedly that the results only apply to the universities unless applied and evaluated at school-level students.
7. Conclusions
The global pandemic spread greatly affected social interactions independent of age, location, and race. The educational institutions received the worst impact because of the complete lockdown. The present study offered an alternative solution to complete lockdown, particularly targeting higher education institutions in Southeast Asian countries. The study identified the underlying structural interaction pattern among university students evaluated through social network analysis techniques. The social network analysis techniques focused on the centrality measures to identify key individuals among the predicted students’ networks. The interaction networks are analyzed in terms of the spread of disease with the help of spread models, which showed that removing a few individuals decreased the spread rate among the contagions. The results offer an opportunity for institutes of higher education to continue their educational activities with the elimination of a few students. The strategy can be considered a smart method to reduce the spread of the disease while continuing educational activities without complete lockdowns.
The present study can also benefit offices and other educational institutions by implementing similar experiments. This strategy will allow a continuous availability of professional services and educational activities, even during any potential pandemic in the future.
Author Contributions
Conceptualization, S.K.H. and R.A.S.M.; methodology, R.A.S.M.; software, S.K.H.; validation, S.K.H. and R.A.S.M.; formal analysis, S.K.H.; investigation, S.K.H. and R.A.S.M.; resources, S.K.H. and R.A.S.M.; data curation, S.K.H. and R.A.S.M.; writing—original draft preparation, S.K.H.; writing—review and editing, F.S. and N.K.K.; visualization, supervision, R.A.S.M. and H.J.S.; project administration, H.J.S. and R.A.S.M. All authors have read and agreed to the published version of the manuscript.
Funding
The article processing charge (APC) was funded by the Research Management Centre (RMC), Universiti Malaysia Sabah, through the UMS/PPI-DPJ1 Journal Article Fund.
Institutional Review Board Statement
Submitted. The study was conducted in accordance with the Declaration of Helsinki, and approved by the Institutional Research Ethics Committee of National University of Computer and Emerging Sciences, Pakistan (No. 258, 14 February 2023).
Informed Consent Statement
Not applicable.
Data Availability Statement
Not applicable.
Acknowledgments
The authors are thankful to the Universiti Malaysia Sabah, Kota Kinabalu, Sabah, Malaysia, for providing funding for this work. The authors would also like to thank FAST-NUCES in Karachi, Pakistan, for the administrative and technical assistance.
Conflicts of Interest
The authors declare no conflict of interest. The funders had no role in the design of the study; in the collection, analyses, or interpretation of data; in the writing of the manuscript, or in the decision to publish the results.
References
- Tartof, S.Y.; Slezak, J.M.; Fischer, H.; Hong, V.; Ackerson, B.K.; Ranasinghe, O.N.; Frankland, T.B.; Ogun, O.A.; Zamparo, J.M.; Gray, S.; et al. Effectiveness of mRNA BNT162b2 COVID-19 vaccine up to 6 months in a large integrated health system in the USA: A retrospective cohort study. Lancet 2021, 398, 1407–1416. [Google Scholar] [CrossRef] [PubMed]
- Weeden, K.A.; Cornwell, B. The Small-World Network of College Classes: Implications for Epidemic Spread on a University Campus. Sociol. Sci. 2020, 7, 222–241. [Google Scholar] [CrossRef] [PubMed]
- Wasserman, S.; Faust, K. Social Network Analysis: Methods and Applications; Cambridge University Press: Cambridge, UK, 1994. [Google Scholar]
- Cirrincione, L.; Plescia, F.; Ledda, C.; Rapisarda, V.; Martorana, D.; Moldovan, R.E.; Theodoridou, K.; Cannizzaro, E. COVID-19 Pandemic: Prevention and Protection Measures to Be Adopted at the Workplace. Sustainability 2020, 12, 3603. [Google Scholar] [CrossRef]
- Poole, S.F.; Gronsbell, J.; Winter, D.; Nickels, S.; Levy, R.; Fu, B.; Burq, M.; Saeb, S.; Edwards, M.D.; Behr, M.K.; et al. A holistic approach for suppression of COVID-19 spread in workplaces and universities. PLoS ONE 2021, 16, e0254798. [Google Scholar] [CrossRef]
- Wang, H.; Ghosh, A.; Ding, J.; Sarkar, R.; Gao, J. Heterogeneous interventions reduce the spread of COVID-19 in simulations on real mobility data. Sci. Rep. 2021, 11, 7809. [Google Scholar] [CrossRef]
- Yeo, S.C.; Lai, C.K.Y.; Tan, J.; Gooley, J.J. A targeted e-learning approach for keeping universities open during the COVID-19 pandemic while reducing student physical interactions. PLoS ONE 2021, 16, e0249839. [Google Scholar] [CrossRef] [PubMed]
- Petrizzelli, F.; Guzzi, P.H.; Mazza, T. Beyond COVID-19 pandemic: Topology-aware optimization of vaccination strategy for minimizing virus spreading. Comput. Struct. Biotechnol. J. 2022, 20, 2664–2671. [Google Scholar] [CrossRef] [PubMed]
- Okabe, Y.; Shudo, A. Microscopic Numerical Simulations of Epidemic Models on Networks. Mathematics 2021, 9, 932. [Google Scholar] [CrossRef]
- ZWang, Z.; Andrews, M.A.; Wu, Z.-X.; Wang, L.; Bauch, C.T. Coupled disease–behavior dynamics on complex networks: A review. Phys. Life Rev. 2015, 15, 1–29. [Google Scholar]
- Barabási, A.-L.; Gulbahce, N.; Loscalzo, J. Network medicine: A network-based approach to human disease. Nat. Rev. Genet. 2011, 12, 56–68. [Google Scholar] [CrossRef] [Green Version]
- Borge-Holthoefer, J.; Moreno, Y. Absence of influential spreaders in rumor dynamics. Phys. Rev. E 2012, 85, 026116. [Google Scholar] [CrossRef] [PubMed] [Green Version]
- Wang, L.; Zheng, S.; Wang, Y.; Wang, L. Identification of critical nodes in multimodal transportation network. Phys. A Stat. Mech. Appl. 2021, 580, 126170. [Google Scholar] [CrossRef]
- Wang, B.; Zhang, Z.; Qi, X.; Liu, L. Identify Critical Nodes in Network Cascading Failure Based on Data Analysis. J. Netw. Syst. Manag. 2020, 28, 21–34. [Google Scholar] [CrossRef]
- Wang, P.; Lu, J.-A.; Jin, Y.; Zhu, M.; Wang, L.; Chen, S. Statistical and network analysis of 1212 COVID-19 patients in Henan, China. Int. J. Infect. Dis. 2020, 95, 391–398. [Google Scholar] [CrossRef] [PubMed]
- Zhou, Y.; Liu, X.C.; Grubesic, T. Unravel the impact of COVID-19 on the spatio-temporal mobility patterns of microtransit. J. Transp. Geogr. 2021, 97, 103226. [Google Scholar] [CrossRef]
- Bedoya-Maya, F.; Calatayud, A.; Giraldez, F.; González, S.S. Urban mobility patterns and the spatial distribution of infections in Santiago de Chile. Transp. Res. Part A Policy Pract. 2022, 163, 43–54. [Google Scholar] [CrossRef] [PubMed]
- Albert, R.; Barabási, A.-L. Statistical mechanics of complex networks. Rev. Mod. Phys. 2002, 74, 47–97. [Google Scholar] [CrossRef] [Green Version]
- Telatnik, M. Social Network Analysis: How to Get Started. 7 September 2022. Available online: https://builtin.com/data-science/social-network-analysis (accessed on 2 February 2023).
- Lizardo, O.; Jilbert, I. Social Networks: An Introduction. 6 January 2020. Available online: https://bookdown.org/omarlizardo/_main/ (accessed on 2 February 2023).
- Gupta, A.K.; Sardana, N. Significance of clustering coefficient over jaccard index. In Proceedings of the 2015 Eighth International Conference on Contemporary Computing (IC3), Noida, India, 20–22 August 2015; pp. 463–466. [Google Scholar]
- Sharma, D.; Surolia, A. Degree centrality. In Encyclopedia of Systems Biology; Springer: Berlin/Heidelberg, Germany, 2013; p. 558. [Google Scholar]
- Bayati, M.; Kim, J.H.; Saberi, A. A sequential algorithm for generating random graphs. Algorithmica 2010, 58, 860–910. [Google Scholar] [CrossRef] [Green Version]
- Block, P.; Hoffman, M.; Raabe, I.J.; Dowd, J.B.; Rahal, C.; Kashyap, R.; Mills, M.C. Social network-based distancing strategies to flatten the COVID-19 curve in a post-lockdown world. Nat. Hum. Behav. 2020, 4, 588–596. [Google Scholar] [CrossRef]
- Milner, F.A.; Zhao, R. S-I-R Model with Directed Spatial Diffusion. Math. Popul. Stud. 2008, 15, 160–181. [Google Scholar] [CrossRef]
- Tolles, J.; Luong, T. Modeling Epidemics with Compartmental Models. JAMA 2020, 323, 2515–2516. [Google Scholar] [CrossRef] [PubMed]
- Colosi, E.; Bassignana, G.; Barrat, A.; Colizza, V. Modelling COVID-19 in school settings to evaluate prevention and control protocols. Anaesth. Crit. Care Pain Med. 2022, 41, 101047. [Google Scholar] [CrossRef] [PubMed]
- Contreras, D.A.; Colosi, E.; Bassignana, G.; Colizza, V.; Barrat, A. Impact of contact data resolution on the evaluation of interventions in mathematical models of infectious diseases. J. R. Soc. Interface 2022, 19, 20220164. [Google Scholar] [CrossRef]
- Faucher, B.; Assab, R.; Roux, J.; Levy-Bruhl, D.; Kiem, C.T.; Cauchemez, S.; Zanetti, L.; Colizza, V.; Boëlle, P.-Y.; Poletto, C. Agent-based modelling of reactive vaccination of workplaces and schools against COVID-19. Nat. Commun. 2022, 13, 1414. [Google Scholar] [CrossRef] [PubMed]
- Colosi, E.; Bassignana, G.; Contreras, D.A.; Poirier, C.; Boëlle, P.-Y.; Cauchemez, S.; Yazdanpanah, Y.; Lina, B.; Fontanet, A.; Barrat, A.; et al. Screening and vaccination against COVID-19 to minimise school closure: A modelling study. Lancet Infect. Dis. 2022, 22, 977–989. [Google Scholar] [CrossRef] [PubMed]
- Fournet, J.; Barrat, A. Contact Patterns among High School Students. PLoS ONE 2014, 9, e107878. [Google Scholar] [CrossRef] [Green Version]
- Freeman, L.C. Centrality in social networks: Conceptual clarification. In Social Network: Critical Concepts in Sociology; Routledge: Londres, UK, 2002; Volume 1, pp. 238–263. [Google Scholar]
- Du, Y.; Gao, C.; Hu, Y.; Mahadevan, S.; Deng, Y. A new method of identifying influential nodes in complex networks based on TOPSIS. Phys. A Stat. Mech. Appl. 2014, 399, 57–69. [Google Scholar] [CrossRef]
- Brin, S.; Page, L. The anatomy of a large-scale hypertextual Web search engine. Comput. Netw. ISDN Syst. 1998, 30, 107–117. [Google Scholar] [CrossRef]
- Langville, A.N.; Meyer, C.D. Who’s #1?: The Science of Rating and Ranking; Princeton University Press: Princeton, NJ, USA, 2012. [Google Scholar]
- Lü, L.; Chen, D.; Ren, X.-L.; Zhang, Q.-M.; Zhang, Y.-C.; Zhou, T. Vital nodes identification in complex networks. Phys. Rep. 2016, 650, 1–63. [Google Scholar] [CrossRef] [Green Version]
Figure 1.
Research Methodology: this represents the flow of the study and presents the stages of the study, including surveying students, modeling social networks, observing key attributes at the network level, applying the SIR model, and the role of node removal over different types of networks.
Figure 1.
Research Methodology: this represents the flow of the study and presents the stages of the study, including surveying students, modeling social networks, observing key attributes at the network level, applying the SIR model, and the role of node removal over different types of networks.
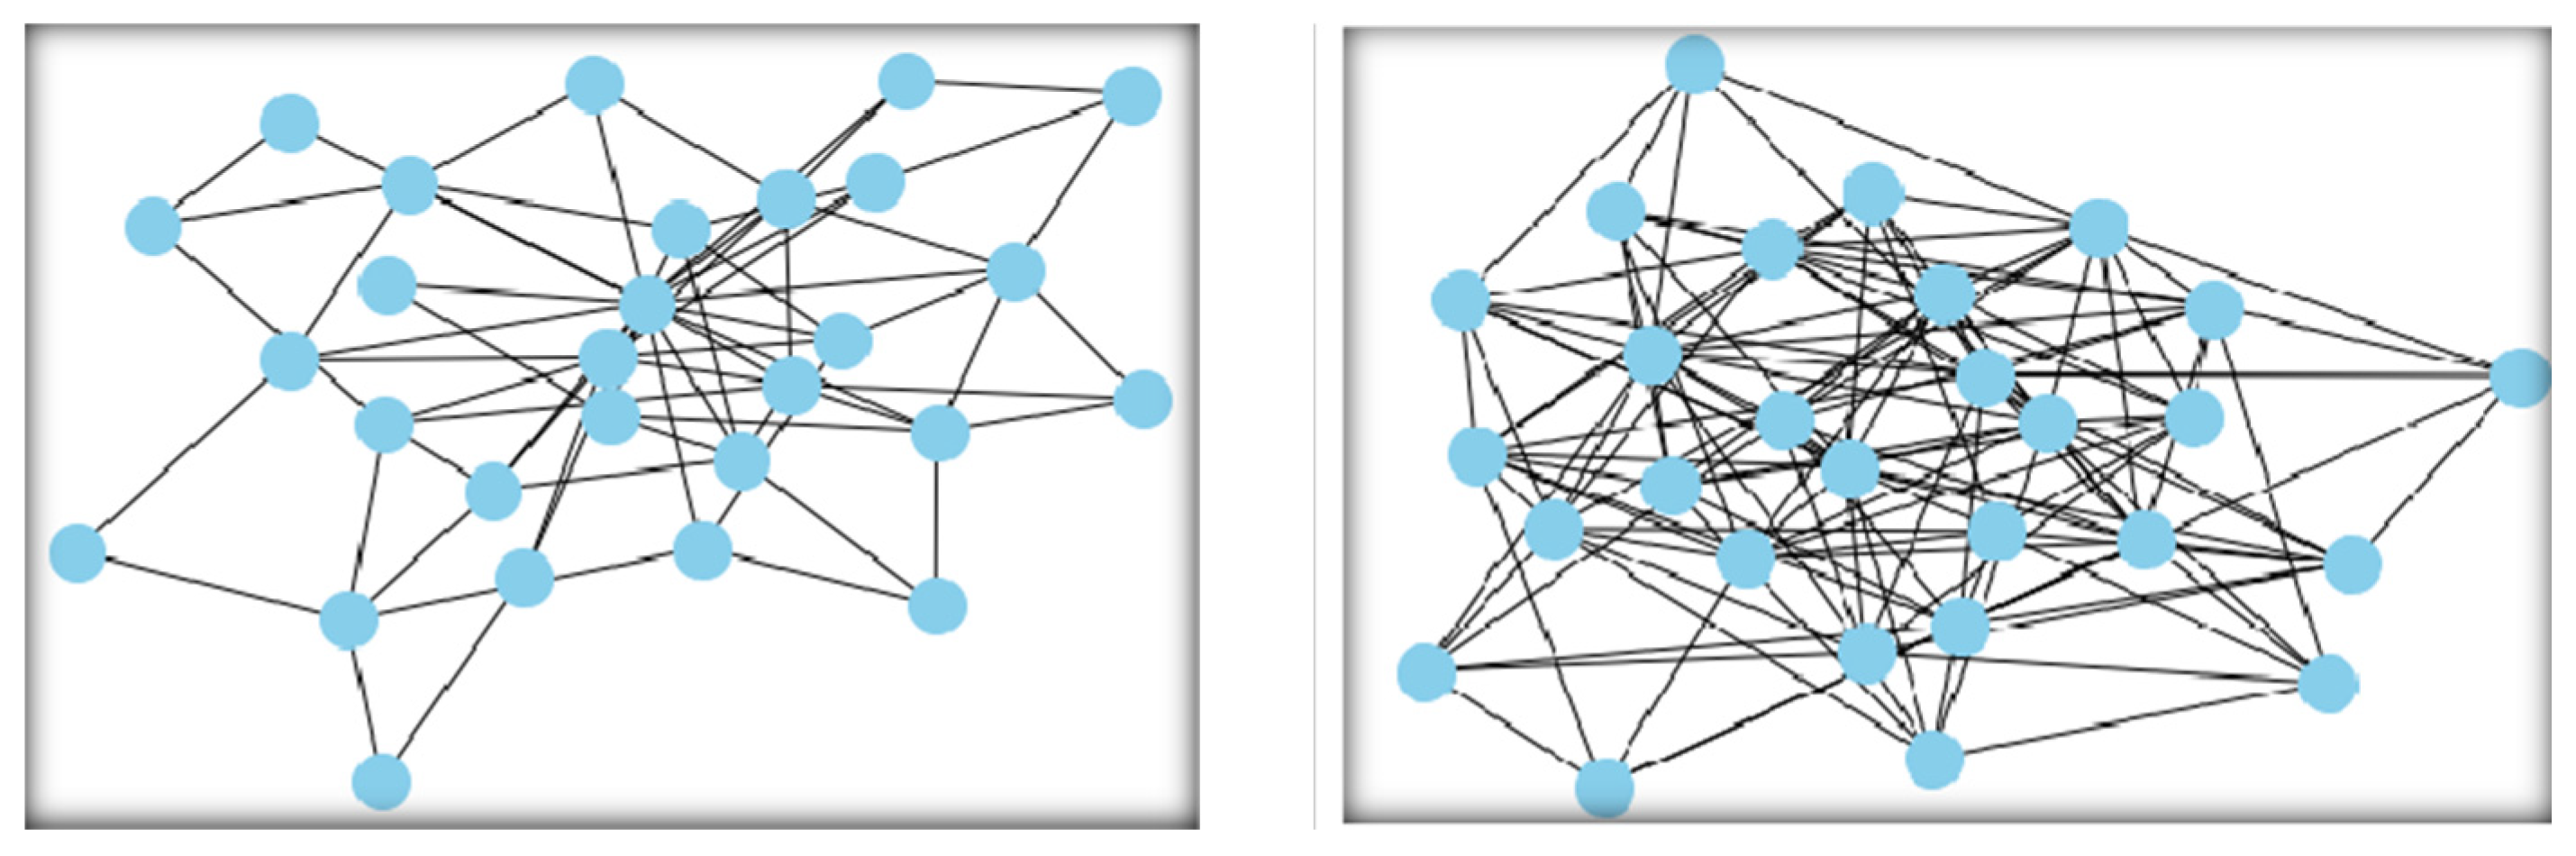
Figure 2.
For a better understanding of the modeled networks, two generated networks are presented: The Watts–Strogatz-based model (left) and the Erdős–Rényi-based model (right) for the same class, BCS-4F. Both network models are distinct in terms of centrality measure and clustering coefficient. The Erdős–Rényi model is dense with the absence of highly centric nodes, and the Watts models contain the highly centric nodes in the generated model.
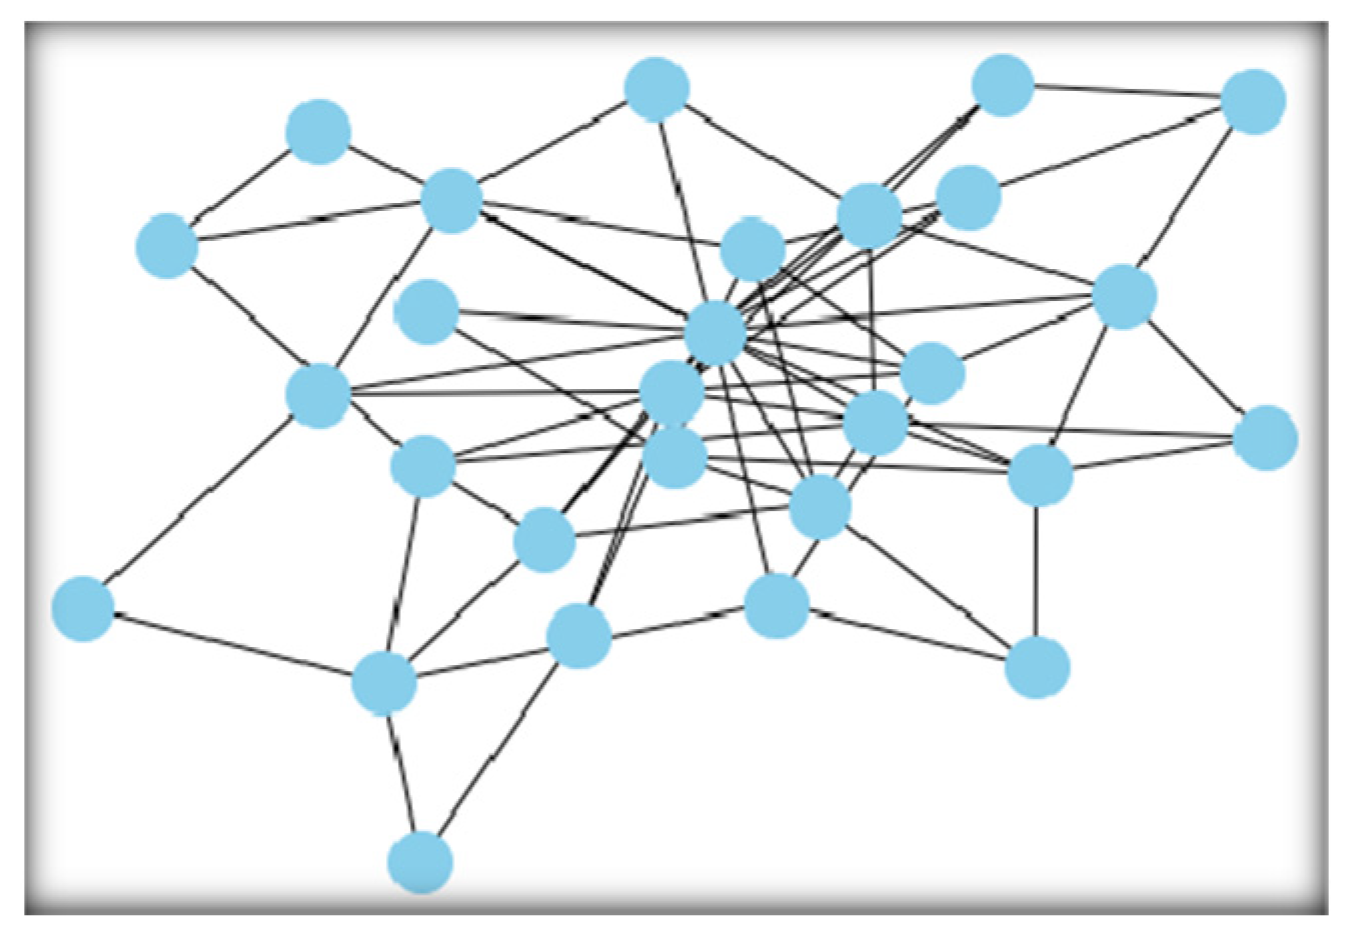
Figure 3.
The network generated by the sequential method is different from Erdős–Rényi along with some similarities with the Watts model. Networks were generated using the sequential model for section BCS-4F.
Figure 3.
The network generated by the sequential method is different from Erdős–Rényi along with some similarities with the Watts model. Networks were generated using the sequential model for section BCS-4F.
Figure 4.
Density comparison between networks generated through sequential, Watts–Strogatz and Erdős modeling techniques. This shows that the networks generated through the Watts model are dense in nature in comparison to the other two methods.
Figure 4.
Density comparison between networks generated through sequential, Watts–Strogatz and Erdős modeling techniques. This shows that the networks generated through the Watts model are dense in nature in comparison to the other two methods.
Figure 5.
The clustering coefficient is a reliable measure to interpret the nature of the complex real-world network. A comparison between clustering coefficients is presented based on the used models, including sequential, Watts–Strogatz, Erdős–Rényi.
Figure 5.
The clustering coefficient is a reliable measure to interpret the nature of the complex real-world network. A comparison between clustering coefficients is presented based on the used models, including sequential, Watts–Strogatz, Erdős–Rényi.
Figure 6.
Impact of node removal on density. It is shown in the figure that the removal of nodes has a significant difference on several network attributes, including density, betweenness, average centrality, closeness centrality, and PageRank centrality. The impact of node removal is observed over the networks generated through the sequential method and presented results in comparison with networks generated through a random model.
Figure 7.
The impact of node removal on the clustering coefficient is evaluated among the networks generated through the sequential method and random method. The trend shows that the removal of significant nodes (on the two types of networks) results in different cohesion.
Figure 7.
The impact of node removal on the clustering coefficient is evaluated among the networks generated through the sequential method and random method. The trend shows that the removal of significant nodes (on the two types of networks) results in different cohesion.
Figure 8.
The impact of node removal on average path length is evaluated among the networks generated through sequential and random methods. The trend shows that the removal of significant nodes (on the two types of networks) has different results. The random-model-based networks have little impact on the average path length after removing significant nodes.
Figure 9.
Virus transmission on the network using different strategies. The rate of the spread of the virus is predicted after removing nodes through multiple criteria, including degree, betweenness, random, PageRank, and closeness centrality. The results show that the removal of highly centric nodes tends to reduce the spread of the virus over generated models. Betweenness-centrality-based removal was found to be second best, closer to the closeness centrality measure.
Table 1.
The table shows the distribution of edges among the nodes based on the several used models. Network properties are also presented in the table to observe the difference between the result of each model. The Erdős–Rényi model has a higher density on average with a low clustering coefficient concerning the two other models.
| Students | 353 |
|---|
| Batches | 4 |
| Sections | 35 |
| Courses | 53 |
| Courses | |
| This means students per course | 35 |
| Median student per course | 7 (49.6) |
| Courses with 50+ students | 13 |
| Class | |
| Mean students per class | 12.1 |
| Median students per class | 11 |
| Mean co-enrolled students | 7.34 |
| Median co-enrolled students | 2 (17.2) |
| Class with 50+ students | 15 |
| Class with 20+ students | 22 |
Table 2.
The table shows the distribution of edges among the nodes based on several models. Network properties are also presented in the table to observe the difference between the result of each model. The Erdős–Rényi model has a higher density on average with a low clustering coefficient concerning the two other models.
| | Sequential
Algorithms | Erdős–Rényi
Algorithms | Watts–Strogatz
Algorithms |
|---|
| Nodes | 1747 | 1747 | 1747 |
| Edges | 9449 | 49,963 | 10,453 |
| Average Density | 0.13 | 0.50 | 0.16 |
| Standard Deviation of Density | 0.06 | 0.01 | 0.1 |
| Average Clustering Coefficient | 0.25 | 0.10 | 0.52 |
| Standard Deviation of Clustering Coefficient | 0.094 | 0.03 | 0.03 |
| Disclaimer/Publisher’s Note: The statements, opinions and data contained in all publications are solely those of the individual author(s) and contributor(s) and not of MDPI and/or the editor(s). MDPI and/or the editor(s) disclaim responsibility for any injury to people or property resulting from any ideas, methods, instructions or products referred to in the content. |
© 2023 by the authors. Licensee MDPI, Basel, Switzerland. This article is an open access article distributed under the terms and conditions of the Creative Commons Attribution (CC BY) license (https://creativecommons.org/licenses/by/4.0/).

 ,
, 


