Sentiment Analysis on Utilizing Online Transportation of Indonesian Customers Using Tweets in the Normal Era and the Pandemic Covid-19 Era with Support Vector Machine
Sentiment Analysis on Utilizing Online Transportation of Indonesian Customers Using Tweets in the Normal Era and the Pandemic Covid-19 Era with Support Vector Machine
Volume 5, Issue 5, Page No 389-394, 2020
Author’s Name: Jajam Haerul Jamana), Rasdi Abdulrohman, Aries Suharso , Nina Sulistiowati, Indah Purnama Dewi
View Affiliations
Fakultas Ilmu Komputer, Universitas Singaperbangsa Karawang, Karawang, 41361, Indonesia
a)Author to whom correspondence should be addressed. E-mail: jajam.haeruljaman@staff.unsika.ac.id
Adv. Sci. Technol. Eng. Syst. J. 5(5), 389-394 (2020); ![]() DOI: 10.25046/aj050549
DOI: 10.25046/aj050549
Keywords: Support Vector Machine, Covid-19 Era, Sentiment Analysis, Text Mining

Export Citations
Online transportation in Indonesia is a new trend of transportation that is currently used among the lower to upper society. The change in behavior began in 2011 and is growing to this day, The comments that are growing on social media are very important for the online transportation company the negative comments lower the level of users while the good comments increase the users’ level. Thus, the comments influence the overall trust of their customers. Among social media, Twitter is a place where many people convey feelings of pleasure and displeasure timely, especially at a time when the COVID-19 pandemic is becoming a serious outbreak. Through these “tweets,” many customers express their experience with the service. In this paper, we aim to analyze the experience of online transportation consumers using Support Vector Machine. The data were taken in two periods, i.e. April 2019 (“the normal era”) and June 2020 (“the COVID-19 pandemic outbreak. Class logging is done based on 3 categories namely positive, negative and normal, while in mining the data we labeled with the keywords @grabID and @gojekindonesia, 1618 data were obtained with a ratio of 1183 is normal era data and 435 data in the era of COVID-19 pandemic, The highest accuracy results occurred in the normal era with a ratio of 10% as test data and 90% as its training data on linear and sigmoid kernels of 0.8060 while the COVID-19 era only got the highest accuracy of 0.59 in linear kernels with a ratio of 60:40. This is a sign that the COVID-19 pandemic does not contribute to decreasing trust in the service.
Received: 27 March 2020, Accepted: 24 June 2020, Published Online: 21 September 2020
1. Introduction
Online transportation in Indonesia began to operate in early 2011 and continues to develop since 2015. It is now one of the most in-demand service needs in Indonesia [1] which is prominently run by two large companies. Despite the in-app review, many customers choose to post their responses or suggestions even disappointment in social media, such as Twitter.
Sentiment analysis is part of data mining which uses text as the object of analysis. Simply stated, it describes a concept of knowledge capture obtained by appraising opinions or sentiments that are incurred from the expression with text as an object.
Some scholars also refer to sentiment analysis as opinion mining. People give their reviews in the form of unstructured formats through blogs, forums, etc. These unstructured reviews have been processed to extract opinions from them and these opinions can be positive, negative, or neutral [2].
The purpose of this paper is to unravel the underlying online transportation review on Twitter or tweets and compare them in two periods: the normal era and the Covid-19 pandemic era. The data was analyzed using vector machine support with the python language.
2. Related Work
Several papers explain the use of SVM with its performance. In previous studies [3], the author explains of the 800 data obtained by being divided into two 500 sections for test data and 300 for data testing, the results obtained were quite high at 0.80. However, this research possesses a weakness on the side of its features so that it can be calcified. Another study was conducted In the paper [4] the author purposed who compared the performance of SVM and Naïve Bayes algorithms with the following stages in the preprocessing data set converted into structured reviews to then converted back to numerical using the lexicon-based approach, this preprocessing approach uses feature selection and semantic analysis, here are the word cutting, POS bar tagging and calculating sentiment scores with the stone dictionary from SentiWorldNet. These were then put into the classification process using both SVM and Naïve Bayes. The result was that from 3 data sets tested (Gold, Film, and Twitter) achieved performance for a naïve bay of 69.10%, 74.55%, and 76.67%, for SVM gained 72.74%, 74.73%, and 76.92%, apart from two comparison algorithms also performed using the RBF kernel where the result was 73.56%, 74,745 and 78.18%. Further analysis resulted in the highest accuracy value by RBF kernel, so the use of the RBF kernel is highly recommended. In another paperm it is presented a sentiment analysis of regional head candidates using an SVM algorithm to build the model. The data sets were taken from news documents about regional heads in East Java 2018, i.e. Kompas, JPNN, Republika, and Detik, The result was that Gus Ipul as a candidate for regional head number two has precision value, remember, and AUC as many 0.940, 0.948 and 0.890 respectively. Models built on the data resulted in a good performance with accurate estimation.
While sentiments regarding the use of transportation are presented in the following papers. The paper introduced SVM and nonnegative matrix factorization in the stock market prediction process using Twitter and historical data. The stock exchange dataset used LQ 45 from August 2018 to January 2019. This feature consists of closing price, volume, percentage of topics, and sentiment. The price and volume were taken from yahoo finance data, while topics and sentiments were retrieved from the comments of every stock market in LQ45. The result obtained 60.16% accuracy.
The second in [5], the author presented also showed that SVM provides a fairly good level of accuracy from 1183 data to 90% training data and 10% data testing, the result is linear use 0.8, RBF 0.78, Sigmoid 0.8, and polynomial 0.77.
The author performs conducted a review of his comments from Twitter related to the use of transportation managed by the government of DKI Jakarta namely “TransJakarta” algorithm used is Convolutional Neural Network, architecture testing using VGG, ResNet, and GoogleNet, consisting of 16 layers, ResNet 34 layers, and GoogleNet 22 layers, the results obtained from the Resnet 34 layer architecture model provide the best F-Score 98.11%, better than VGG which has the highest F-Score score of 96.74% and GoogleNet 96.80%.
The author presented a paper with the title “Exploring the Performance Characteristics of the Naïve Bayes Classifier in the Sentiment Analysis of an Airline’s Social Media Data,” the purpose is to know comments of airline operator users on Twitter using Naïve Bayes its architectural model, The dataset obtained was a negative sentiment of 37.47% and positive by 65.53%, They highlighted that the large training data set is potential to improve the accuracy of classifier classification.
3. Material and Method
3.1. Data Collecting / Methods and Technique
In the early stages of this paper is limited to the two largest online transportation companies in Indonesia namely GoJek Indonesia and GrabId, following the retrieval of data taken from [5] in April 2019 then continued the process of crawling data using twitter APIs in April to June 2020 where this era is referred to as the era of COVID-19 pandemic.
3.2. Research Planning
The planning of the research consists of 5 stages as follows:
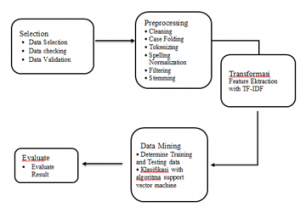
Figure 1: Research Planning [5]
3.2.1. Data Selecting
Data retrieval was carried out in the data crawling process. The content of the data was customer key access is as the entry key into Twitter APIs, Access Tokens, and access token secrets for the final stage of data crawling. The keyword, i.e. @grabid and @gojekindonesia was used and tweets published in April 2019 until June 2020 were selected. The data were randomly retrieved so that not all days were taken. Then the data was examined using the help of the Indonesian dictionary in the literary package as standardization of Natural Language Processing (NLP) to be then labeled, The data was validated by a team of Indonesian language experts in the language center building at Universitas Singaperbangsa Karawang.
3.2.2. Preprocessing
· Cleaning
This stage is the process by which the data is cleaned, while some of the writings that must be cleaned between others are writings in the form of @ symbols like “@”, “#” and characters “!$%^&*()_”, the purpose of which is to make the data readable clearly.
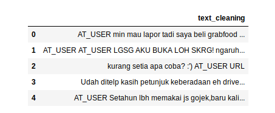
Figure 2: Text Cleaning Process
· Cse folding
Case folding is a stage where data is standardized. The letters, words, or sentences that sentence case, upper case, capital each word, and toggle case were changed into lowercase so that the uniformity of the data is maintained.
· Tokenizing
Tokenization is a process in which sentences are cut into tokens. Some punctuation marks such as commas, dots, and others were limited. Tokens will be read into words according to Indonesian language grammar.
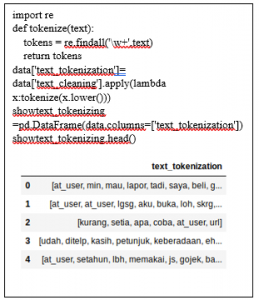
Figure 3: Source Code and Result Tokenization Text
· Spelling and Normalization
To be able to read more clearly, the spelling was normalized so the words are in proper spelling, Also, many abbreviations were normalized such as min being admin, telp to telephon (make/made a phone call).
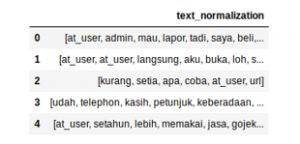
Figure 4: Normalization Text
· Filtering Process
The step was to remove unused words, this process is also called Stop Word.
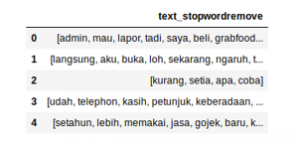
Figure 5: Filtering Text
· Stemming
A Steaming is done to retrieve the main words of each sentence. The things to note in this process are the removal of all affixes, prefixes, endings, or both.
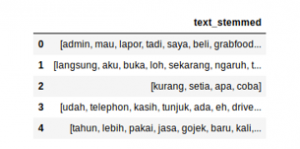
Figure 6: Steaming Process
3.3. Data Transformation
After the preprocessing phase is completed, the transport process in which the term used is TF-IDF (Term Frequencies – Inverse Document Frequency) which is a step of changing from categorical values to numerical values. The data is then extracted into values.
3.4. Text mining with SVM
The next step is data mining with SVM as the model, Positive, Negative, and Neutral were the 3 classes used, as follows:
Table 1: Scenario
| Scenario | Training | Testing |
| S1 | 0.5 | 0.5 |
| S2 | 0.6 | 0.4 |
| S3 | 0.7 | 0.3 |
| S4 | 0.8 | 0.2 |
| S5 | 0.9 | 0.1 |
3.5. Evaluation
The evaluation was carried out to see the performance of SVM performance, accuracy being the benchmark for performance, accuracy will determine how well the initial data is obtained, preprocessing, and transformation.
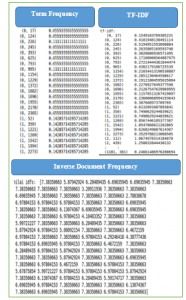
Figure 7: Transformation
4. Result
There are more than 3,000 data gained in the crawling process. The data was then preprocessed and resulted in much as 1618 for the normal era and 435 for the Covid-19 eras.
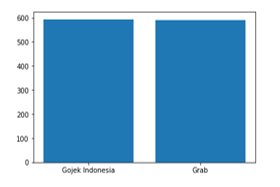
Figure 8: Comparison of objects on data in normal eras.
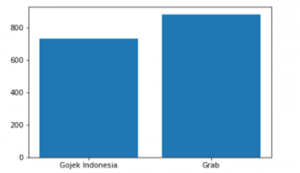
Figure 9: Comparison of objects on data with Covid-19 eras
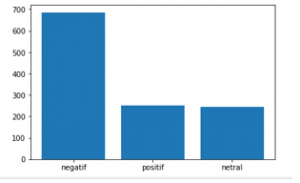
Figure 10: Sentiment Comparation in the normal eras.
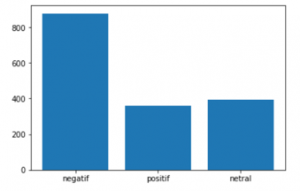
Figure 11: Sentiment Comparation With Covid-19 eras
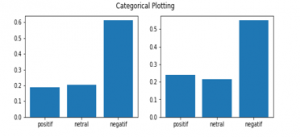
Figure 12: Categorical Plotting normal eras
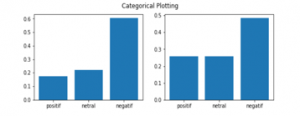
Figure 13: Categorical Plotting with Covid-19 eras
In Figure 12 the data is separated into categories based on the object, for Gojek Indonesia 733 data was generated while for Grab ID 885 data was generated. Each category was then revealed the pattern as shown in Table 3 during the normal era and Table in the pandemic era.
Table 2: Indonesia Linguists Validation Result in the normal eras
| Data | Gojek Indonesia | GrabID |
| Total | 733 | 885 |
Table 3: Indonesia Linguists Sentiment Validation Result in the normal eras
| Sentiment | Gojek Indonesia | Grab ID |
| Positive | 111 | 140 |
| Negative | 363 | 323 |
| Neutral | 120 | 126 |
Table 4: Indonesia Linguists Sentiment Validation Result with Covid-19 eras
| Object | Gojek Indonesia | Grab ID |
| Positive | 127 | 226 |
| Negative | 443 | 429 |
| Neutral | 163 | 225 |
Table 4 shows that there is a significant increase in the sentiment of online transportation in the Covid-19 era
Table 5: Presentation of data increase after coupled with COVID-19 era
| Object | Positive | Negative | Neutral |
| GojekIndonesia | 0,14 | 0.22 | 0.36 |
| Grab ID | 0.61 | 0.33 | 0.79 |
Table 6: Result of Various Kernel Accuracy in Normal Eras
| Scenario | Kernel | |||
| Linear | RBF | Sigmoid | Poly | |
| 50:50 | 0.64 | 0.59 | 0.63 | 0.59 |
| 60:40 | 0.77 | 0.74 | 0.75 | 0.75 |
| 70:30 | 0.66 | 0.64 | 0.61 | 0.61 |
| 80:20 | 0.76 | 0.74 | 0.70 | 0.71 |
| 90:10 | 0.80 | 0.78 | 0.80 | 0.77 |
Tables 6 and 7 show that following the additional data from the COVID-19 era, there is a decrease in inaccuracy. Hence, this is very poor data with which high accuracy is rather difficult to achieve. It is assumed that the trend is heavily influenced by the transportation policies, both from the Government and company in the pandemic era, such as health protocols on online transportation partners that make the performance of the online transportation decrease.
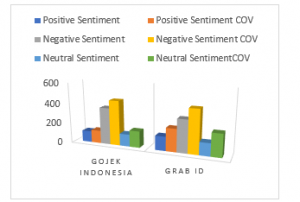
Figure 14: Increased of sentiment in the Covid-19 era
Table 7: Result of Various Kernel Accuracy with Additional data Covid-19 Era
| Kernel | Scenarios | ||||
| 50:50 | 60:40 | 70:30 | 80:20 | 90:10 | |
| 1. Linear | 0.58 | 0.59 | 0.51 | 0.54 | 0.55 |
| 2. Rbf | 0.55 | 0.56 | 0.51 | 0.50 | 0.50 |
| 3. Sigmoid | 0.57 | 0.57 | 0.49 | 0.53 | 0.53 |
| 4. Poly | 0.52 | 0.53 | 0.47 | 0.47 | 0.47 |
5. Conclusion
This study aimed to compare sentiment analysis toward online transportation service in pre-and whilst COVID-19 pandemic era by VMS. It is found that the performance in every kernel in the pandemic era decreased. In the normal era, the highest accuracy obtained is in the linear kernel, and sigmoid with a ratio of 90:10 results in an accuracy of 0.8. Meanwhile, in the pandemic era, the highest accuracy is only found in linear kernels with a ratio of 50:40 which is 0.59. The accuracy likely declined due to several factors, such as poor and unstructured initial data and the costumers’ reluctance to adopt the health protocol which contributes to the raise of displeased with the service.
Conflict of Interest
The trend of transportation service is to continue to develop and attract various research in the field. However, this study is neither attributive nor sponsored by any company mentioned in the research.
- F.Y. Kristo, Awal Mula Transportasi Online Menjamur di Indonesia, Detik.Com, 2017.
- A.S.H. Basari, B. Hussin, I.G.P. Ananta, J. Zeniarja, “Opinion mining of movie review using hybrid method of support vector machine and particle swarm optimization,” in Procedia Engineering, 453–462, 2013, doi:10.1016/j.proeng.2013.02.059.
- D.G. Nugroho, Y.H. Chrisnanto, A. Wahana, “Analisis Sentimen Pada Jasa Ojek Online … (Nugroho dkk.),” 156–161, 2015.
- B. Jadav, V. Vaghel, “Sentiment Analysis using Support Vector Machine based on Feature Selection and Semantic Analysis,” International Journal of Computer Applications, 146(13), 26–30, 2016.
- J.H. Jaman, R. Abdulrohman, “Sentiment Analysis of Customers on Utilizing Online Motorcycle Taxi Service at Twitter with the Support Vector Machine,” in ICECOS 2019 – 3rd International Conference on Electrical Engineering and Computer Science, Proceeding, 231–234, 2019, doi:10.1109/ICECOS47637.2019.8984483.