

ISSN: 0973-7510
E-ISSN: 2581-690X
Coronavirus disease 2019 (COVID-19), which is a major global concern, is characterized by a progressive disease pattern involving diverse host immune responses. Programmed cell death marker-1(PD-1) expression, a critical checkpoint for T cell exhaustion, can be modulated by interleukin-10, which also mediates apoptotic T cell cytopenia. We aimed to measure the level of PD-1 expression and to investigate its correlation with IL-10 serum levels in modulating T cell effector function, correlating the results with the level of severity of the disease. This study involved 40 patients with COVID-19 and 20 healthy controls. Using flow cytometry, the expression of PD-1 was determined on CD8+ T lymphocytes and CD4+ T lymphocytes. ELISA was used to determine the levels of IL-10 in the serum. We found a remarkable decrease in T cell counts with functionally exhausted surviving T cells in the patient groups, especially in patients with severe disease. PD-1 expression increased significantly in CD4+, CD8+, and total T cells, showing a higher expression in CD8+ T cells. The patient groups had significantly higher serum IL-10 levels than the control group. The ROC analysis demonstrated the predictive role of IL-10 levels in disease severity (65% sensitivity, 80% specificity, and AUC = 0.806). IL-10 serum levels and PD-1 expression in total T cells were positively correlated, suggesting that IL-10 participates in T cell exhaustion.
T cell exhaustion markers, PD-1, IL-10, COVID-19, SARS-CoV-2
Coronavirus disease 2019 (COVID-19) is considered to be a worldwide pandemic with 2,597,381 deaths and 116,874,912 confirmed COVID-19 cases globally according to the report of the World Health Organization (WHO) dated March 9, 20211,2. Severe acute respiratory syndrome coronavirus 2 (SARS-CoV-2), which is the cause of this pandemic, is a new beta corona virus belonging to the order Nidovirales, with a positive single-stranded RNA3,4.
A greater number of COVID-19 cases have mild symptoms including fever and cough, which usually go away after 2–3 weeks1. Unfortunately, critical cases rapidly develop acute respiratory distress syndrome, metabolic acidosis, multiorgan failure, coagulation disorders, septic shock, and finally death1,5.
This heterogeneous disease pattern of acute SARS-CoV-2 infection presents with differential cytokine patterns that may be directed by variable immunological responses to the virus and investigating these responses is a critical step toward precision medicine in this disease4.
T cell exhaustion refers to impaired T cell function, occurring throughout infections and malignancies, described as continuously expressed inhibitory receptors and weak effector function, which is distinct from functional effector T cells in terms of transcriptional state6,7.
Programmed cell death-1(PD-1) (CD279), which belongs to the CD28 superfamily, is considered one of the most commonly studied immune checkpoints. Its expression on the surface of B and T lymphocytes is chromosomally encoded by the programmed cell death 1 gene8.
Once PD-1 binds to its ligands, it delivers inhibitory signals to adjacent cells and exerts immune-regulatory effects on T cells by down regulating T cell activity8,9. As an important checkpoint, it plays a significant role in T cell exhaustion6.
The dramatic increase in interleukin-10 (IL-10) serum levels is a distinctive feature of the cytokine storm that occurs with COVID-1910. Researchers know that IL-10 can suppress inflammation through a negative feedback mechanism. Even so, many clinical studies have proposed that early pro-inflammatory IL-10 elevation plays a pathological role in COVID-19 severity10,11.
In this study, we aimed to measure the level of PD-1 expression and to investigate its correlation with IL-10 serum levels in modulating T cell effector function, correlating the results with the level of severity of the disease.
Our study involved 40 patients with COVID-19, who were classified as 20 severe cases and 20 moderate cases according to the WHO guidelines for the clinical management of COVID-1912, from Ain Shams University Hospitals. Twenty healthy control subjects were included in this study. The study was conducted from July – October 2020.
All the patients enrolled in this study were clinically and radiologically diagnosed with COVID-19 and confirmed based on a positive RT-PCR performed on their respiratory samples.
None of the participants included in this study had chronic infections, cancers, immunological disorders, or were on immunosuppressive therapy.
Under the complete standard aseptic technique, 5 mL of blood was withdrawn from each participant, collected as 3 mL blood in an EDTA tube for flow cytometric analysis and 2 mL blood in a tube without additives for enzyme-linked immunosorbent assay (ELISA).
The two tubes were transferred immediately to the Ain Shams Hospital laboratory for the separation of mononuclear cells and serum for further steps.
Flow cytometric analysis
CD3, CD4, CD8, and CD279 monoclonal antibodies were used to detect CD279+ CD4+ T cells and CD279+ CD8+ T cells as follows:
Separation of peripheral blood mononuclear cells from the blood was done using density gradient centrifugation; then purification of the isolated cells was performed using anti-human CD3-PC5 (Beckman Coulter, USA), anti-human CD4-FITC (Beckman Coulter, USA), anti-human CD8-PE (Beckman Coulter, USA), and in addition, PD1 expression was measured using anti-human CD279-PC7 (Beckman Coulter, USA).
The labeled samples were analyzed using flow cytometry and the NAVIOS CXP software (Beckman Coulter, USA).
Separation of the serum for ELISA
The second part of the sample collected for ELISA was left for 10–20 min at 20 – 22°C to clot before centrifugation at 500 – 1000 × g for 20 min. The serum was collected in a tube and preserved at -80°C until analysis using the human IL-10 ELISA kit (Biotech, LTD, China) according to the manufacturer’s instructions.
Data management and analysis
Statistical analysis was conducted using SPSS 23.0 statistical software. The mean, standard deviations, and ranges were used to presenting the parametric quantitative data, although the interquartile range (IQR) and median were accustomed to present non-parametric quantitative data. The numbers and percentages were used to represent qualitative variables. The qualitative data were compared between the two groups using the chi-square test. In addition, the independent t-test was used to compare the quantitative parametric data between the two groups, and the non-parametric distributions were tested using the Mann-Whitney test. Quantitative parametric data between more than two categories were compared using the one-way ANOVA test, while the Kruskal-Wallis test was used for non-parametric distribution. The correlation of paired data was analyzed using Spearman’s correlation coefficient. For moderate and severe COVID-19 cases, the ROC AUC of IL-10 serum levels was calculated. Statistical significance was set at P <0.05.
Our study was conducted on 40 patients with COVID-19 admitted to isolation wards at the Ain Shams University Hospitals. The numbers of males and females were 21 (52.5%) and 19 (47.5%), respectively, while there were 20 healthy control subjects in the control group; they were equally divided into both sexes with a mean age of 44.35 ± 14.47. The study was conducted from July–October 2020. All the studied groups were subjected to blood sample collection, and the expression of PD-1 was measured using flow cytometric analysis, and IL-10 serum levels were measured using ELISA.
A full history was taken and patients with predisposing diseases were categorized as follows; diabetes mellitus 10 (25.0%), hypertension 16 (40.0%), chronic kidney disease 7 (17.5%), hepatic diseases 5 (12.5%), ischemic heart disease 3 (7.5%), bronchial asthma 2 (5.0%) and chronic obstructive pulmonary disease 1 (2.5%).
We first compared the healthy control, moderate, and severe groups regarding the predisposing factors, and they were significantly different regarding chronic kidney disease only, without any other significant differences in the other predisposing factors.
To understand the effect of COVID-19 on T cells, we analyzed cell counts and the expression of PD-1 on CD4+, CD8+, and total T cells. A highly significant decrease in total T cell counts (p = 0.000), CD4+ T cells (p = 0.000), and CD8+ T cells (p = 0.000) was found in patient groups, particularly in the severe group (Table 1). In addition, a highly significant increase in the expression of PD-1 on CD4+, CD8+, and total T cells (p = 0.000) was detected among the three groups. Both the moderate and severe groups expressed higher levels of PD-1 on CD8+ T cells, as shown in Table 2.
Table (1):
Comparison between the healthy control, moderate, and severe groups regarding Total T cell count, CD4+ T cell count, and CD8+ T cell count.
| T cell count (number/ml) |
Healthy control group | Moderate group | Severe group | P-valuea | |
|---|---|---|---|---|---|
| No. = 20 | No. = 20 | No. = 20 | |||
| Total T cell | Mean ± SD | 1348.22 ± 281.92 | 687.78 ± 326.03 | 337.15 ± 101.06 | 0.000 |
| Range | 808.6 – 1677.5 | 303.6 – 1468.7 | 184.8 – 513.9 | ||
| CD4+ T cell | Mean ± SD | 797.78 ± 239.90 | 402.33 ± 181.70 | 191.10 ± 64.56 | 0.000 |
| Range | 445.9 – 1159.2 | 155.6 – 866 | 71.1 – 291 | ||
| CD8+ T cell | Mean ± SD | 501.74 ± 137.06 | 254.08 ± 142.04 | 153.05 ± 70.93 | 0.000 |
| Range | 327.6 – 736.8 | 77.5 – 491.4 | 31.4 – 275.2 |
There was a high statistically significant decrease in total T cell counts (P-value: 0.000), CD4+ T cell counts (P-value: 0.000), and CD8+ T cell counts (P-value: 0.000) in patient groups especially in patients with severe disease.
a: P-value > 0.05: Non significant; P-value < 0.05: Significant; P-value < 0.01: Highly significant
The used test for statistical analysis is the One Way ANOVA test.
The severe group had a highly significant increase in CRP (p = 0.000) and D-dimer levels (p = 0.001) than the moderate group.
Serum IL-10 levels in the patient groups were significantly higher than those in the control group (p = 0.000) (Fig. 1).

Fig. 1. Comparison between the healthy control group, moderate group and severe group regarding IL-10 serum level revealing a higher level in patient groups than in the control group. The used test for statistical analysis is the One Way ANOVA test.
Furthermore, we examined the relationship between IL-10 and other inflammatory markers that have been used as markers for the diagnosis and prognosis of COVID-19. We found a highly significant positive correlation among IL-10 serum levels, CRP levels (p = 0.003) and IL-10 serum levels, D-dimer levels (p = 0.018).
Table (2):
Comparison between the healthy control group, moderate group, and severe group regarding % PD1 expression.
| Healthy control group | Moderate group | Severe group | P-value a | ||
|---|---|---|---|---|---|
| No. = 20 | No. = 20 | No. = 20 | |||
| PD1 on total T cells |
Median (IQR) | 0.9 (0.8 – 1.6) | 2.25 (1.75 – 3.15) | 7.8 (4.65 – 15.3) | 0.000 |
| Range | 0.6 – 1.8 | 1.4 – 4.6 | 3.1 – 39.2 | ||
| PD1 on CD4 | Median (IQR) | 1.45 (1.2 – 1.9) | 3.05 (2.45 – 4.95) | 15.7 (8.25 – 24.9) | 0.000 |
| Range | 0.7 – 4.1 | 1 – 12.3 | 4 – 45.9 | ||
| PD1 on CD8 | Median (IQR) | 1.7 (1.4 – 2.7) | 4.6 (2.55 – 5.9) | 18.4 (7.45 – 35.55) | 0.000 |
| Range | 1 – 3.2 | 1.7 – 15.5 | 2.2 – 91.7 | ||
A high statistically significant increase in % PD1 expression on CD4+, CD8+, and total T cells (p-value: 0.000) was detected between the three groups, with higher expression on CD8+ T cells in both moderate and severe groups.
a: P-value > 0.05: Non significant; P-value < 0.05: Significant; P-value < 0.01: Highly significant
The used test for statistical analysis is Kruskal-Wallis test.
We compared the sensitivity and specificity of IL-10 in the moderate and severe cases to assess its predictive role in the severity of the disease, and found that the sensitivity of IL-10 was 65%, specificity was 80%, and AUC was 0.806, as shown in Fig. 2.
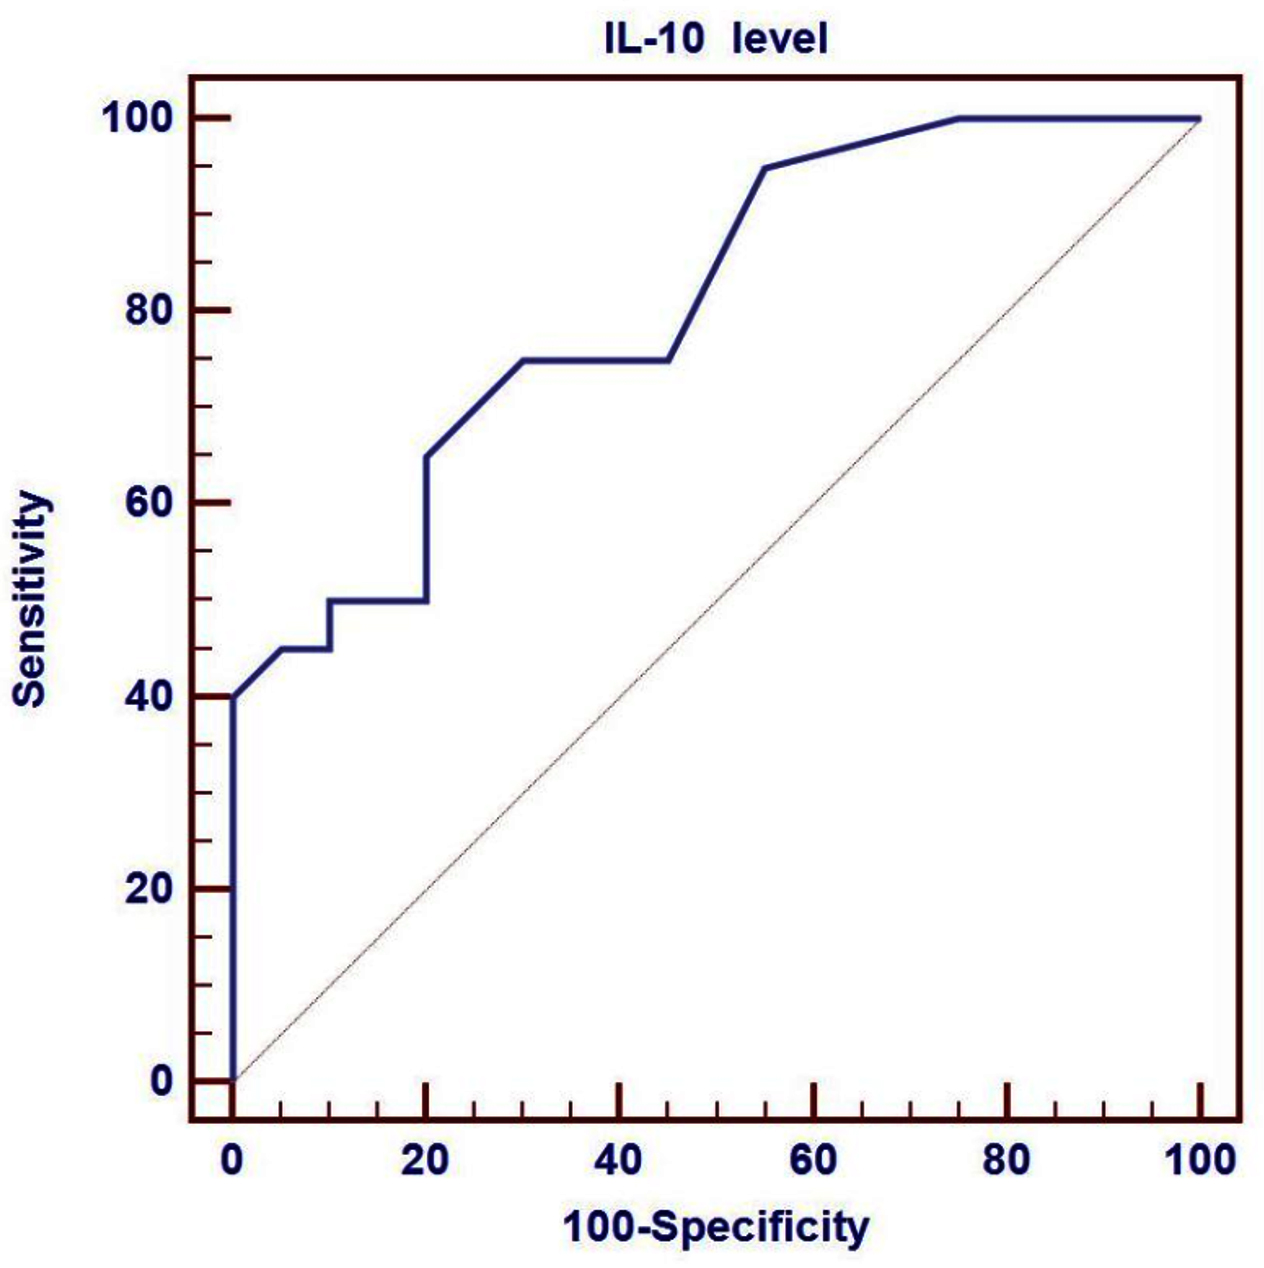
Fig. 2. ROC curve of plasma IL-10 levels to identify the severe COVID-19 patients from moderate patients. Performance of ROC curve of IL-10 for predicting severe COVID-19 patients. Receiver operating characteristic curve (ROC) was used to assess the best cut off point with its sensitivity, specificity, positive predictive value, negative predictive value and area under the curve (AUC) of IL-10.
To illustrate the pathological role of IL-10 in the exhaustion of T cells, which may affect the overall count and function of T lymphocytes, we correlated IL-10 serum levels with the percentage of PD-1 expression on total T cells, revealing a positive correlation between them (p = 0.000) (Fig. 3).
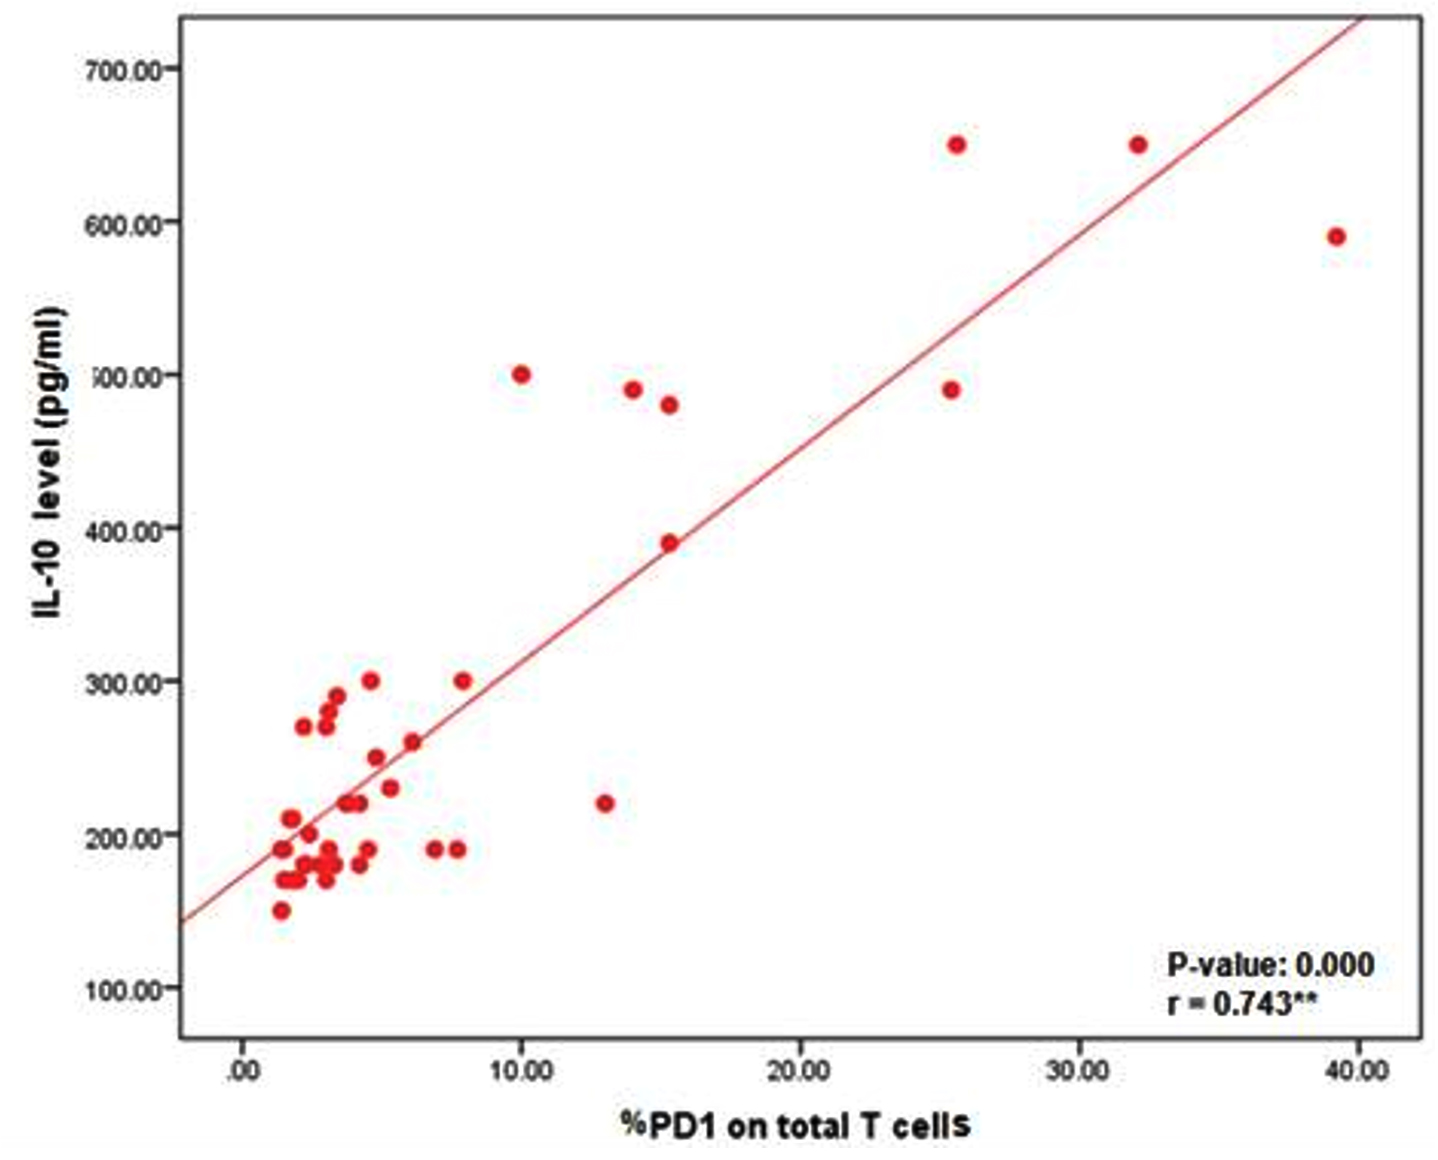
Fig. 3. Positive correlation between IL-10 serum level and % PD1 expression on total T cells. The used test for statistical analysis is the Spearman correlation coefficient.
As the cases of COVID-19 are increasing dramatically globally, and there is limited availability of intensive care units (ICU) for treatment, early detection of severe cases is critical for prompt patient triaging13.
In this study, we demonstrated that T cell exhaustion and inflammation reflected by a cytokine storm may have a significant effect on the progression of COVID-19.
Cytotoxic T cells (CTLs), which can secrete a number of molecules such as interferon-gamma, perforins, and granzymes, play a significant role in viral clearance during infections14. Simultaneously, helper T cells (Th) help CTLs to clear up any pathogens15. However, prolonged viral stimulation can exhaust T cells, resulting in the loss of cytokine production16.
The current study revealed that the patient groups had a significant decrease in CD4+, CD8+, and total T cell counts compared to the control group. These results were similar to those of Zhang et al.17, who found that patients with COVID-19 had significantly lower CD4+, CD8+, and total T cell counts, particularly in those suffering from severe disease. Furthermore, Henry18 reported that lymphopenia is related to disease severity, and lymphocyte counts were significantly lower in nonsurvivors than in survivors. Therefore, lymphocyte replenishment is crucial for recovery. Qin et al.19 stated that both The cells and CTLs were below average in patients with COVID-19, with Th cells being lower in severe cases.
Cytotoxic cells, including CTLs and natural killer (NK) cells, have a great effect on the limitation of viral infection, and their functional exhaustion is linked to disease progression20. During high-grade chronic viral infections causing CD8+ T cell exhaustion, there is high expression of inhibitory receptors, such as PD-1, in exhausted cells, which are important negative immune checkpoints in suppressing cell-mediated immune responses, as in COVID-19 and malignancies21. In the current study, % PD-1 expression was high in CD4+, CD8+, and total T cells, but both moderate and severe groups expressed higher PD-1 levels on CD8+ T cells. Diao et al.6 found that in COVID-19, the percentages of PD-1+CD4+ and PD-1+CD8+ cells were significantly higher in ICU patients than in healthy controls, suggesting the role of SARS-CoV-2 in T cell exhaustion, especially in those who need ICU treatment. In addition, Bellesi et al.22 also demonstrated that CD4+ and CD8+ T cells in 42 patients with COVID-19 had significantly higher PD-1 and CD95 (Fas) expression than the controls. PD-1 expression may increase to avoid uncontrolled inflammation. Consequently, anti-PD-1 therapy could have beneficial therapeutic effects, but should be used with caution. As a result, inhibition of the PD-1 pathway alters the strength and efficiency of cytotoxic cell attack, allowing viral clearance with limited collateral tissue damage23.
Patients with COVID-19 have high levels of C-reactive protein (CRP), which is higher in nonsurvivors than in survivors, suggesting that the severity and prognosis of the disease are strongly correlated with it24. Moreover, Tang et al.25 reported that significantly higher D-dimer plasma levels were found in nonsurvivors than in survivors. Since coagulopathy and disseminated intravascular coagulation seem to be linked to high mortality rates, D-dimer was found to be the most powerful independent predictor of mortality26. These results are consistent with our study as the severe group had a highly significant increase in CRP and D-dimer levels compared with the moderate group.
Cytokine storm is a known phenomenon that occurs during a severe inflammatory response to any microbial infection, in which large amounts of cytokines are released, which play a significant pathological role in multiple organ dysfunction syndromes and acute respiratory distress syndrome27. During sepsis, different types of cells at inflammation sites release IL-6 and IL-10 into the bloodstream, which is similar to acute organ injuries. Thus, these cytokines contribute to COVID-19 pathogenesis by inducing a strong inflammatory response11. In our study, the patient groups had significantly higher serum IL-10 levels than the control group. Furthermore, Huang et al.4 found that IL-10 and other markers, including IL2, IL7, IP-10, and TNF-a, were highly significantly different in patients with COVID-19.
Han et al.11 revealed that patients with COVID-19 had higher cytokine levels (IL-2, 4, 6, 10, and TNF-a) and CRP levels in their blood than healthy controls.
Additionally, our study showed that there were highly significantly different positive correlations among the serum levels of IL-10, CRP and D-dimer. This is similar to the results of Han et al.11 who demonstrated that the levels of IL-10 and CRP were positively correlated. The significantly different elevated IL-10 serum levels in the patient groups prompted us to assess the predictive role of IL-10 in disease severity. Therefore, we compared the sensitivity and specificity of IL-10 in moderate and severe cases, and our results revealed that the sensitivity of IL-10 was 65%, specificity was 80%, and AUC was 0.806. Inconsistent with our results, Dhar et al.28 found that the sensitivity of IL-10 was 61%, but the specificity was 100%. In addition, Liu et al.29 reported that the AUC for IL-10 between moderate and severe cases was 0.838, suggesting that this cytokine could be a biomarker for disease severity. The cost of measuring IL-10 levels in the blood is low, and it is crucial to identify patients who are more likely to progress to serious disease so that appropriate precautions can be taken28.
Regarding the role of IL-10 in the expression of PD-1, Diao et al.6 demonstrated that following infection with SARS-CoV-2, high serum IL-10 levels, together with high levels of TIM-3 and PD-1 exhaustion markers, may suggest that IL-10 is mechanically responsible. Similarly, Lu et al.10 reported findings similar to those reported by Diao et al.6 which revealed the role of IL-10 in the exhaustion of T cells, but his explanation of the role of IL-10 was different, as he proposed that after SARS-CoV-2 infection, there are three steps in the immunopathological process: initiation, expansion, and completion.
Early induction of IL-10 occurs in the lung during the initiation stage of infection with SARS-CoV-2, which is considered a negative feedback process to protect against inflammation induced by other pro-inflammatory mediators. Even so, increased endogenous IL-10 production could activate the immune system, cause inflammation, and pro-inflammatory cytokine that stimulate the release of other cytokine storm mediators.
New therapeutic lines for ICU patients with COVID-19 are required as soon as possible to prevent disease progression in patients with lymphopenia who are at higher risk6. Thus, IL-10 might represent an important target for lowering the mortality of COVID-19 by blocking its pathological pro-inflammatory function. Accordingly, it may be important to select the right time to block the activity of IL-10 in severe and critical cases10.
In patients with COVID-19, there is a marked decrease in lymphocytic counts, while PD-1 expression increases in surviving T cells. PD-1 expression is positively correlated with IL-10 serum levels, suggesting that IL-10 plays a pathological role in T cell exhaustion. Thus, blockade of the PD-1 pathway alone or in combination with IL-10 could be a key in the development of a new therapeutic approach for nullifying functional exhaustion in T cells, and restoring vigorous T cell cytotoxicity against the viral antigen.
ACKNOWLEDGMENTS
None.
CONFLICT OF INTEREST
The authors declare that there is no conflict of interest.
AUTHORS’ CONTRIBUTION
AH and DM assisted in the collection of samples and patients’ data. FM and DM contributed to laboratory work. All authors contributed significantly to the study’s conception, design, manuscript drafting, revision, and final approval of the manuscript.
FUNDING
None.
ETHICS STATEMENT
The Ethical Committee of Scientific Research of the Faculty of Medicine, Ain Shams University, Cairo, Egypt, gave its approval to this study (FWA 000017585 / MD 134 / 2020).
AVAILABILITY OF DATA
All datasets generated or analyzed during this study are included in the manuscript.
- Zhao Y, Qin L, Zhang P, et al. Longitudinal COVID-19 profiling associates IL-1RA and IL-10 with disease severity and RANTES with mild disease. JCI Insight. 2020;5(13):e139834.
Crossref - WHO Coronavirus Disease (COVID-19) Dashboard. available at: https://covid19.who.int/
- Su S, Wong G, Shi W, et al. Epidemiology, genetic recombination, and pathogenesis of coronaviruses. Trends Microbio. 2016;24(6):490-502.
Crossref - Huang C, Wang Y, Li X, et al. Clinical features of patients infected with 2019 novel coronavirus in Wuhan, China. Lancet. 2020;395:497-506.
Crossref - Kassirian S, Taneja R, Mehta S. Diagnosis and Management of Acute Respiratory Distress Syndrome in a Time of COVID-19. Diagnostics. 2020;10(12):1053.
Crossref - Diao B, Wang C, Tan Y, et al. Reduction and functional exhaustion of T cells in patients with coronavirus disease 2019 (COVID-19). Front Immunol. 2020;11:827.
Crossref - McLane LM, Abdel-Hakeem MS, Wherry E J. CD8 T cell exhaustion during chronic viral infection and cancer. Annu Rev Immunol. 2019;37: 457-495.
Crossref - Patsoukis N, Wang Q, Strauss L, Boussiotis VA. Revisiting the PD-1 pathway. Science Advances. 2020;6(38):eabd2712.
Crossref - Smith WM, Purvis IJ, Bomstad CN, et al. Therapeutic targeting of immune checkpoints with small molecule inhibitors. Am J Transl Res. 2019;11(2):529-541. PMID: 30899360; PMCID: PMC6413273.
- Lu L, Zhang H, Dauphars DJ, He Y-W. A Potential Role of Interleukin 10 in COVID-19 Pathogenesis. Trends Immunol. 2021;42(1):3-5.
Crossref - Han H, Ma Q, Li C, et al. profiling serum cytokines in COVID-19 patients reveals IL-6 and IL-10 are disease severity predictors. Emerg Microbes Infect. 2020;9(1):1123-1130.
Crossref - World health organization (WHO) (2020), “Clinical management of COVID-19”. https://www.who.int/publications/i/item/clinical-management-of-covid-19
- Velavan TP, Meyer CG. Mild versus severe COVID-19: Laboratory markers. Int J Infect Dis. 2020;95:304 -307.
Crossref - Mescher MF, Curtsinger JM, Agarwal P, et al. Signals required for programming effector and memory development by CD8+ T cells. Immunol Rev. 2006;211(1):81-92.
Crossref - Zhu J, Yamane H, Paul WE. Differentiation of effector CD4 T cell populations*. Annu Rev Immunol. 2010;28:445-489.
Crossref - Fenwick C, Joo V, Jacquier P, et al. T-cell exhaustion in HIV infection. Immunol Rev. 2019;292(1):149-163.
Crossref - Zhang W, Li L, Liu J, et al. The characteristics and predictive role of lymphocyte subsets in COVID-19 patients. Int J Infect Dis. 2020;99:92-99.
Crossref - Henry BM, COVID-19, ECMO, and lymphopenia: a word of caution. The Lancet Respir Med. 2020;8(4):e24.
Crossref - Qin C, Zhou L, Hu Z, et al. Dysregulation of immune response in patients with COVID-19 in Wuhan, China. Clin Infect Dis. 2020;71(15):762-768.
Crossref - Zhang C, Wang X, Li S, et al. NKG2A is a NK cell exhaustion checkpoint for HCV persistence. Nat Commun. 2019;10:1507.
Crossref - Winkler F, Bengsch B. Use of Mass Cytometry to Profile Human T Cell Exhaustion. Front Immunol. 2020;10:3039.
Crossref - Bellesi S, Metafuni E, Hohaus, et al. Increased CD95 (Fas) and PD-1 expression in peripheral blood T lymphocytes in COVID-19 patients. Br J Haematol. 2020;191(2):207-211.
Crossref - Di Cosimo S, Malfettone A, Perez-Garcia JM, et al. Immune checkpoint inhibitors: a physiology-driven approach to the treatment of coronavirus disease 2019. Eur J Cancer. 2020;135:62-65.
Crossref - Ruan Q, Yang K, Wang W, Jiang L, Song J. Clinical predictors of mortality due to COVID-19 based on an analysis of data of 150 patients from Wuhan, China. Intensive Care Med. 2020;46(5):846-848.
Crossref - Tang N, Li D, Wang X, Sun Z. Abnormal coagulation parameters are associated with poor prognosis in patients with novel coronavirus pneumonia. J Thromb Haemost. 2020;18(4): 844-847.
Crossref - Zhou F, Yu T, Du R, et al. Clinical course and risk factors for mortality of adult inpatients with COVID-19 in Wuhan, China: a retrospective cohort study. The Lancet. 2020;395(10229):1054-1062.
Crossref - Matthay MA, Ware LB, Zimmerman GA. The acute respiratory distress syndrome. J Clin Invest. 2012;122(8):2731-2740.
Crossref - Dhar SK, Vishnupriyan K, Damoda S, Gujar S, Das M. IL-6 and IL-10 as predictors of disease severity in COVID 19 patients: Results from Meta-analysis and Regression. medRxiv. 2020.
Crossref - Liu Y, Zhang C, Huang F, et al. Elevated plasma levels of selective cytokines in COVID-19 patients reflect viral load and lung injury. Natl Sci Rev. 2020;7(6):1003-1011.
Crossref
© The Author(s) 2021. Open Access. This article is distributed under the terms of the Creative Commons Attribution 4.0 International License which permits unrestricted use, sharing, distribution, and reproduction in any medium, provided you give appropriate credit to the original author(s) and the source, provide a link to the Creative Commons license, and indicate if changes were made.