First Quarter Chronicle of COVID-19: An Attempt to Measure Governments’ Responses

 ,
, 
 ,
,
Abstract
:
1. Introduction
2. Methodology
2.1. Three Measures of Severity
2.2. Distribution Fitting
3. Timeline of Events
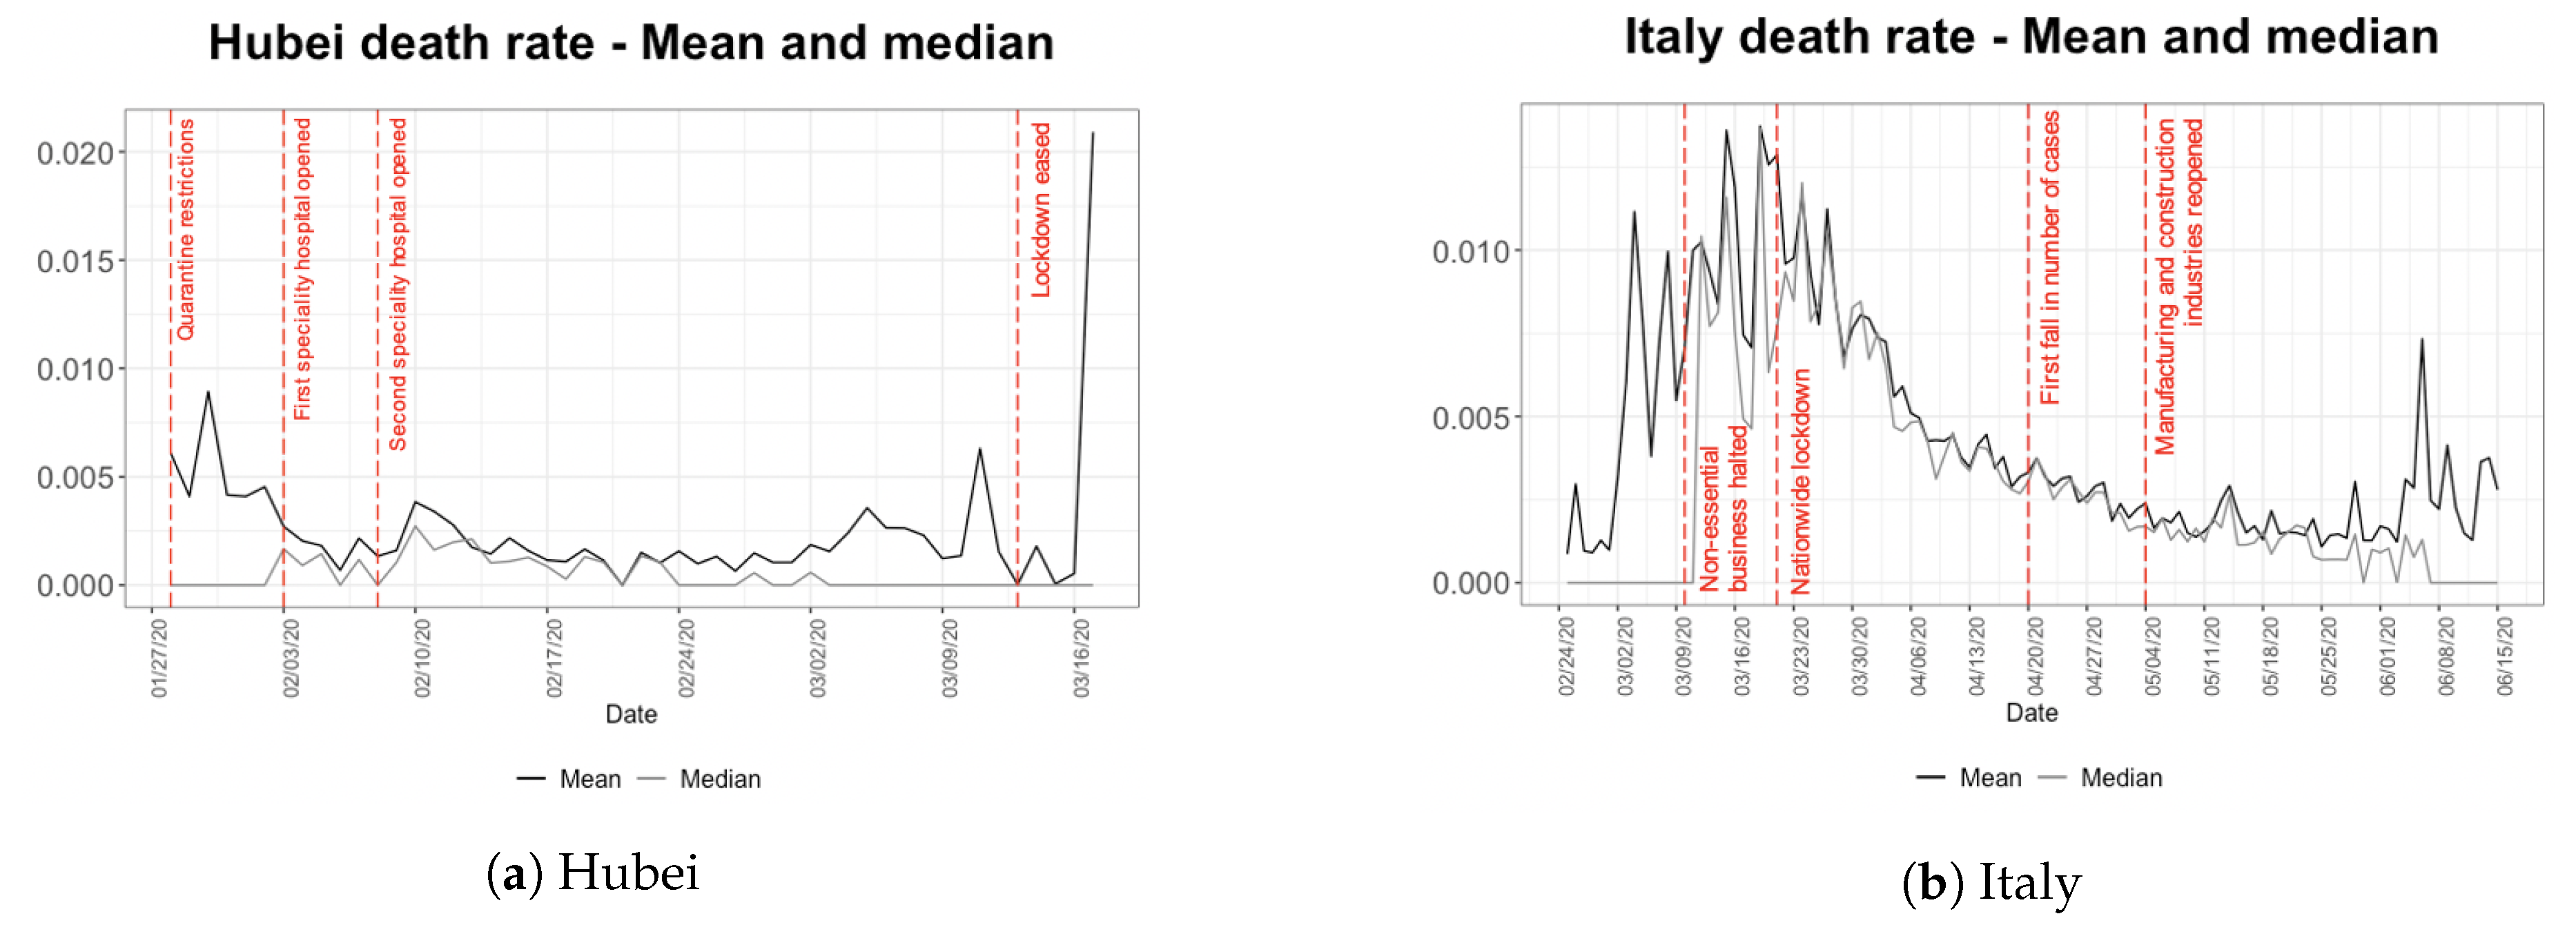
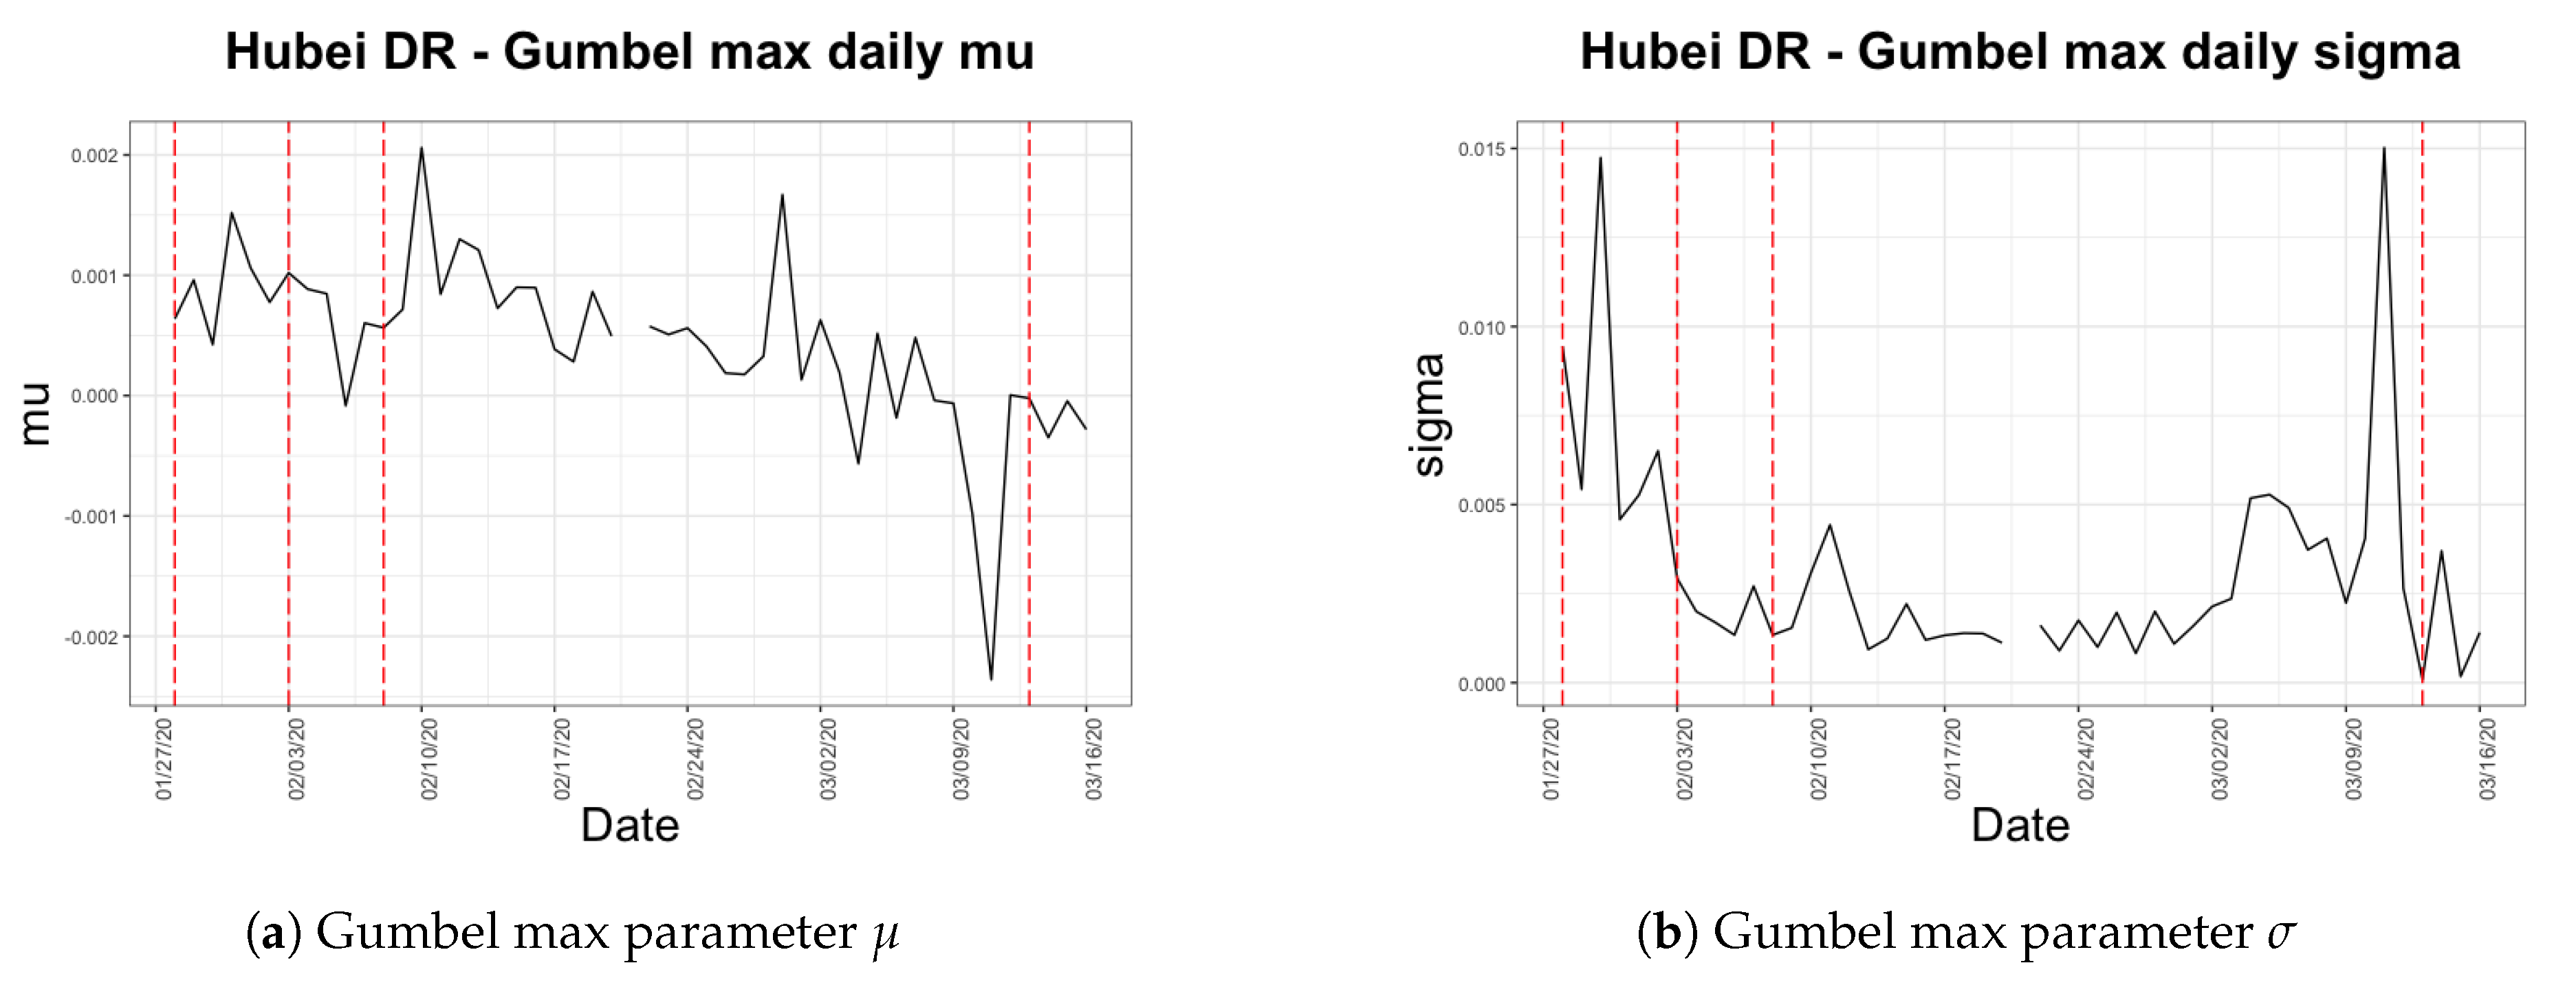
3.1. Hubei, China
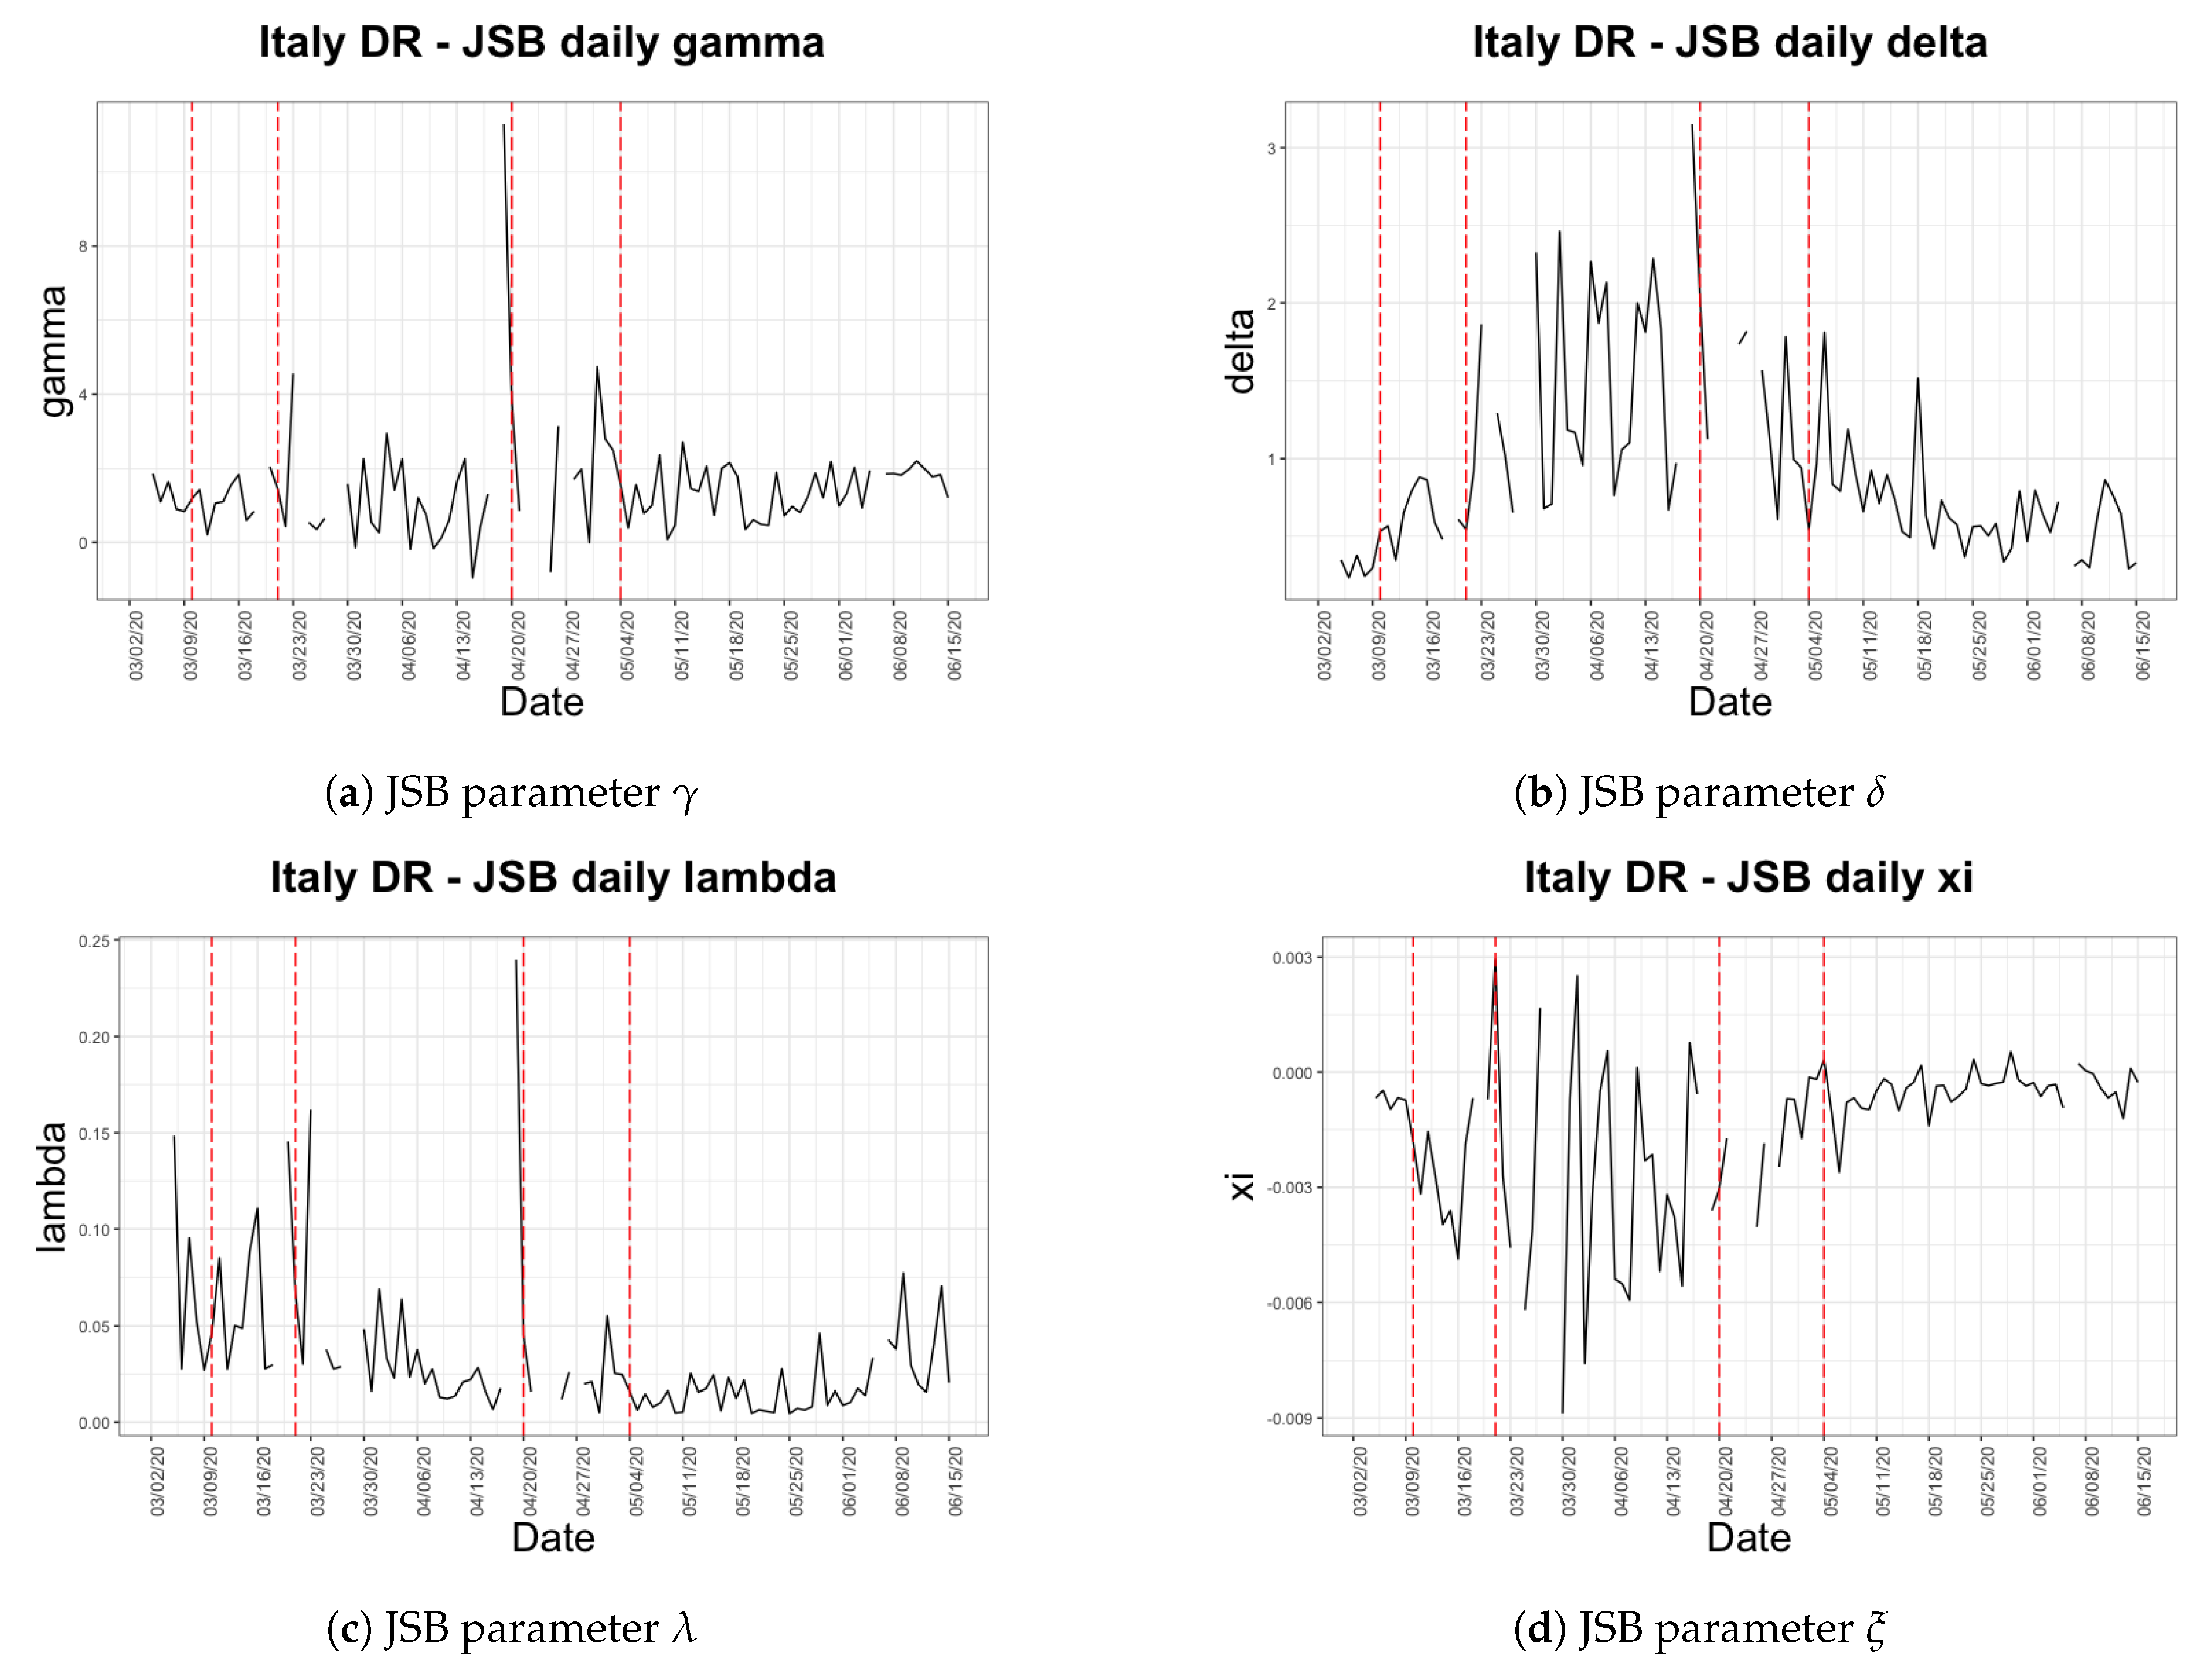
3.2. Italy
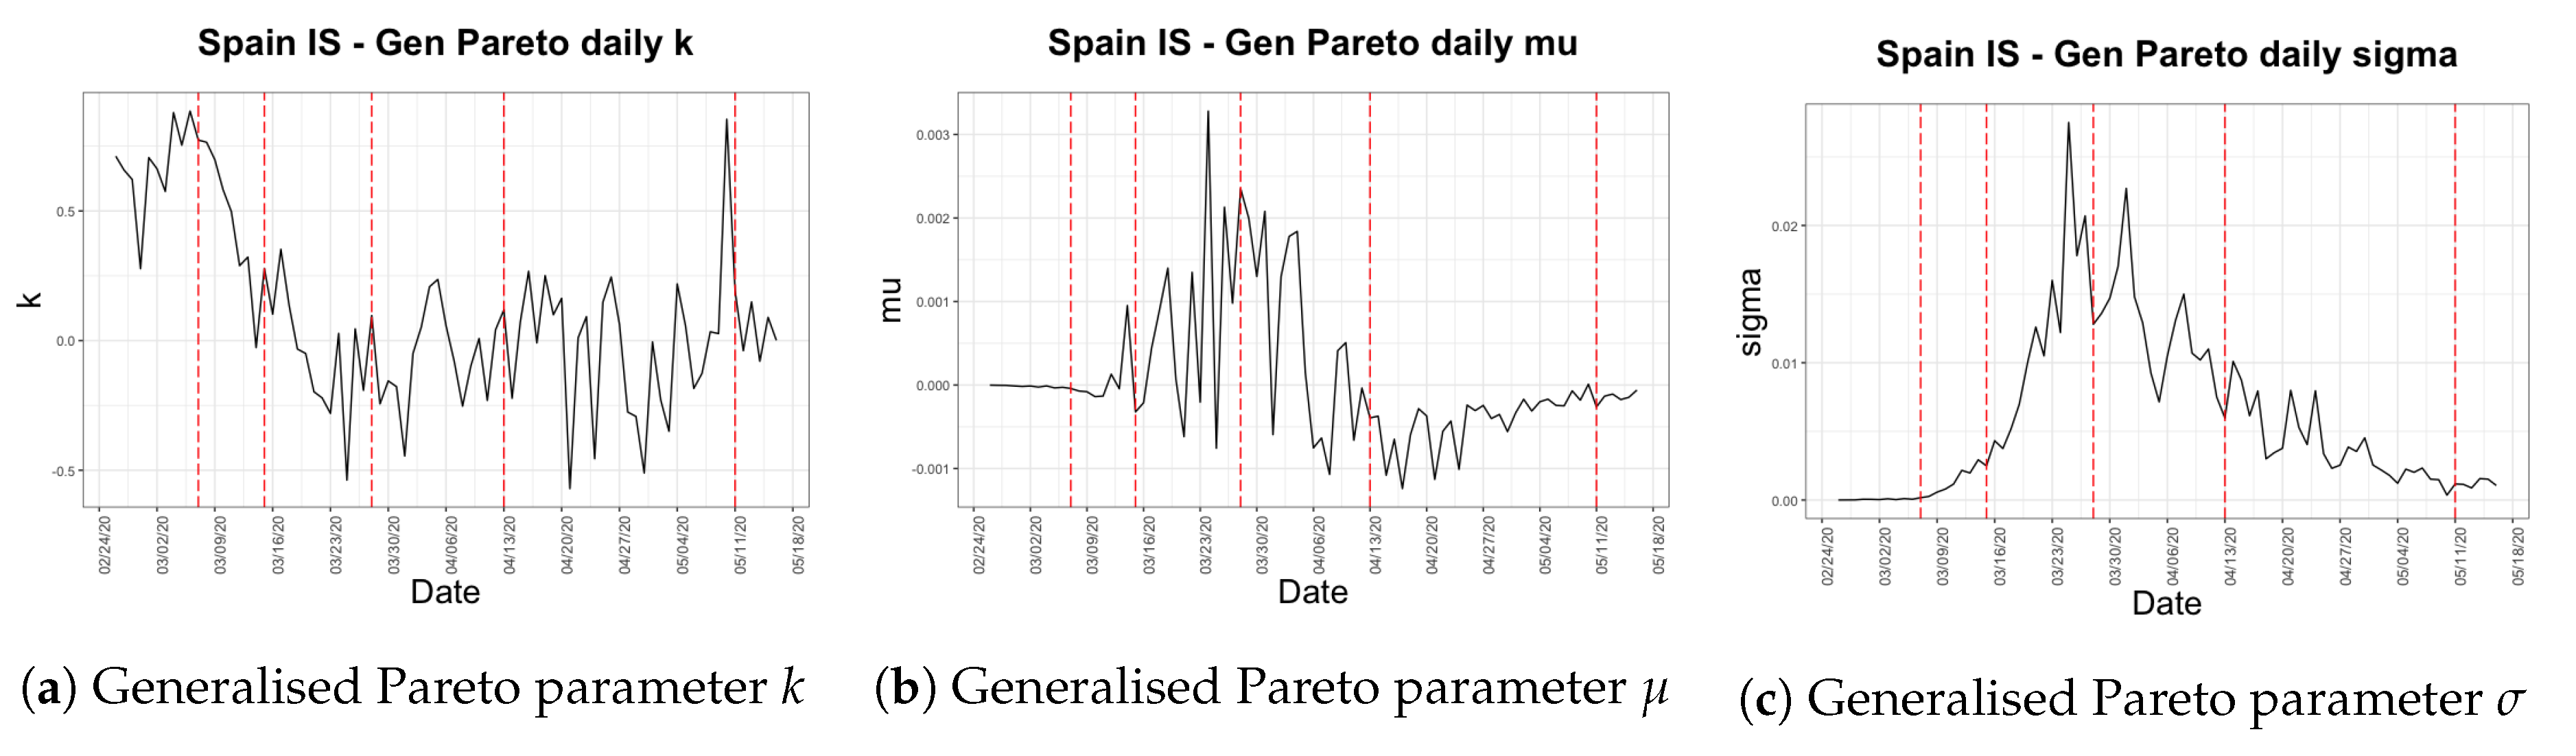
3.3. Spain
4. Data
4.1. Hubei, China
4.2. Italy
4.3. Spain
5. Infection Speed Analysis
5.1. Descriptive Analysis
5.2. Distribution Fitting
6. Death Rate Analysis
6.1. Descriptive Analysis
6.2. Distribution Fitting
7. Fatality Ratio Analysis
7.1. Descriptive Analysis
7.2. Distribution Fitting
8. Results and Remarks
Author Contributions
Funding
Conflicts of Interest
References
- Agosto, Arianna, and Paolo Giudici. 2020. A poisson autoregressive model to understand covid-19 contagion dynamics. Risks 8: 77. [Google Scholar] [CrossRef]
- Alvarez, Fernando E., David Argente, and Francesco Lippi. 2020. A Simple Planning Problem for COVID-19 Lockdown. Technical report. Cambridge: National Bureau of Economic Research. [Google Scholar]
- Caulkins, Jonathan, Dieter Grass, Gustav Feichtinger, Richard Hartl, Peter M. Kort, Alexia Prskawetz, Andrea Seidl, and Stefan Wrzaczek. 2020. How Long Should the COVID-19 Lockdown Continue? Research Report 2020-10. Wien: ORCOS, TU Wien, Submitted. [Google Scholar]
- Chen, Zezhun, Angelos Dassios, Valerie Kuan, Jia Wei Lim, Yan Qu, Budhi Surya, and Hongbiao Zhao. 2020. A Two-Phase Dynamic Contagion Model for COVID-19. London: Department of Statistics, London School of Economics and Political Science. [Google Scholar]
- Cheng, Cindy, Joan Barceló, Allison Spencer Hartnett, Robert Kubinec, and Luca Messerschmidt. 2020. Covid-19 government response event dataset (coronanet v. 1.0). Nature Human Behaviour 4: 756–68. [Google Scholar] [CrossRef] [PubMed]
- Chinazzi, Matteo, Jessica T. Davis, Marco Ajelli, Corrado Gioannini, Maria Litvinova, Stefano Merler, Ana Pastore Y. Piontti, Kunpeng Mu, Luca Rossi, Kaiyuan Sun, and et al. 2020. The effect of travel restrictions on the spread of the 2019 novel coronavirus (COVID-19) outbreak. Science 368: 395–400. [Google Scholar] [CrossRef] [PubMed] [Green Version]
- Coordination Center for Health Alerts and Emergencies. 2020. Enfermedad Por Nuevo Coronavirus, COVID-19. Barcelona: Coordination Center for Health Alerts and Emergencies. [Google Scholar]
- Deng, Sheng-Qun, and Hong-Juan Peng. 2020. Characteristics of and public health responses to the coronavirus disease 2019 outbreak in China. Journal of Clinical Medicine 9: 575. [Google Scholar] [CrossRef] [PubMed] [Green Version]
- Dingxiangyuan. 2020. Real-Time Data On the Novel Coronavirus. Hangzhou: Dingxiangyuan. [Google Scholar]
- Ferguson, Neil, Daniel Laydon, Gemma Nedjati Gilani, Natsuko Imai, Kylie Ainslie, Marc Baguelin, Sangeeta Bhatia, Adhiratha Boonyasiri, ZULMA Cucunuba Perez, Gina Cuomo-Dannenburg, and et al. 2020. Report 9: Impact of Non-Pharmaceutical Interventions (npis) to Reduce covid19 Mortality and Healthcare Demand. London: Imperial College COVID-19 Response Team. Imperial College London, UK. [Google Scholar]
- Flaxman, Seth, Swapnil Mishra, Axel Gandy, H Juliette T Unwin, Thomas A Mellan, Helen Coupland, Charles Whittaker, Harrison Zhu, Tresnia Berah, Jeffrey W Eaton, and et al. 2020. Estimating the effects of non-pharmaceutical interventions on covid-19 in europe. Nature 584: 257–61. [Google Scholar] [CrossRef] [PubMed]
- Hale, Thomas, Toby Phillips, Anna Petherick, Beatriz Kira, Noam Angrist, Katy Aymar, Sam Webster, Saptarshi Majumdar, Laura Hallas, Helen Tatlow, and et al. 2020. Risk of Openness Index: When Do Government Responses Need to Be Increased or Maintained? Oxford: Blavatnik School of Government. [Google Scholar]
- Huang, Chaolin, Yeming Wang, Xingwang Li, Lili Ren, Jianping Zhao, Yi Hu, Li Zhang, Guohui Fan, Jiuyang Xu, Xiaoying Gu, and et al. 2020. Clinical features of patients infected with 2019 novel coronavirus in Wuhan, China. The Lancet 395: 497–506. [Google Scholar] [CrossRef] [Green Version]
- Hubei Provincial Bureau of Statistics. 2019. Hubei Statistical Yearbook 2019; Wuhan: Hubei Provincial Bureau of Statistics.
- Italian Department of Civil Protection. 2020. Presidenza del Consiglio dei Ministri—Dipartimento della Protezione Civile. Rome: Italian Department of Civil Protection. [Google Scholar]
- Italian National Institute of Statistics. 2019. Resident Population on 1st January. Rome: Italian National Institute of Statistics. [Google Scholar]
- Kovacevic, Raimund, Nikolaos I. Stilianakis, and Vladimir M. Veliov. 2020. Distributed Optimal Control Epidemiological Model Applied to COVID-19 Pandemic. Research Report 2020-13. Wien: ORCOS, TU Wien, Submitted. [Google Scholar]
- Li, Qun, Xuhua Guan, Peng Wu, Xiaoye Wang, Lei Zhou, Yeqing Tong, Ruiqi Ren, Kathy Leung, Eric H. Y. Lau, Jessica Y. Wong, and et al. 2020. Early transmission dynamics in Wuhan, China, of novel coronavirus–infected pneumonia. New England Journal of Medicine 382: 1199–207. [Google Scholar] [CrossRef] [PubMed]
- Prem, Kiesha, Yang Liu, Timothy W. Russell, Adam J. Kucharski, Rosalind M. Eggo, Nicholas Davies, Stefan Flasche, Samuel Clifford, Carl AB Pearson, James D. Munday, and et al. 2020. The effect of control strategies to reduce social mixing on outcomes of the covid-19 epidemic in Wuhan, China: A Modelling study. The Lancet Public Health 5: e261–e270. [Google Scholar] [CrossRef] [Green Version]
- Sohrabi, Catrin, Zaid Alsafi, Niamh O’Neill, Mehdi Khan, Ahmed Kerwan, Ahmed Al-Jabir, Christos Iosifidis, and Riaz Agha. 2020. World Health Organization declares global emergency: A review of the 2019 novel coronavirus (COVID-19). International Journal of Surgery 76: 71–76. [Google Scholar] [CrossRef] [PubMed]
- Spanish Statistical Office. 2019. Official Population Figures Referring to Revision of Municipal Register 1 January (summary by provinces). Madrid: Spanish Statistical Office. [Google Scholar]
- Tencent. 2020. Real-Time Tracking of the Coronavirus Infection [In Chinese]. Shenzhen: Tencent. [Google Scholar]
- Wu, Tianzhi, Erqiang Hu, Patrick Tung, Xijin Ge, and Guangchuang Yu. 2020. nCov2019 for Studying COVID-19 Coronavirus Outbreak. Available online: https://guangchuangyu.github.io/nCov2019/ (accessed on 20 March 2020).
- Wuhan-2019-nCoV. 2020. Github Repo: Daily Statistics of 2019-nCov. Wuhan-2019-nCoV. Available online: https://github.com/canghailan/Wuhan-2019-nCoV (accessed on 6 May 2020).
- Wu, Tianzhi, Erqiang Hu, Xijin Ge, and Guangchuang Yu. 2020. Open-source analytics tools for studying the COVID-19 coronavirus outbreak. medRxiv, 20027433. [Google Scholar] [CrossRef] [Green Version]
- Yang, Zifeng, Zhiqi Zeng, Ke Wang, Sook-San Wong, Wenhua Liang, Mark Zanin, Peng Liu, Xudong Cao, Zhongqiang Gao, Zhitong Mai, and et al. 2020. Modified SEIR and AI prediction of the epidemics trend of COVID-19 in China under public health interventions. Journal of Thoracic Disease 12: 165–74. [Google Scholar] [CrossRef] [PubMed]
- Zhu, Na, Dingyu Zhang, Wenling Wang, Xingwang Li, Bo Yang, Jingdong Song, Xiang Zhao, Baoying Huang, Weifeng Shi, Roujian Lu, and et al. 2020. A novel coronavirus from patients with pneumonia in China, 2019. New England Journal of Medicine 382: 727–33. [Google Scholar] [CrossRef] [PubMed]
| 1. | After the initial reporting of the outbreak in Wuhan (Deng and Peng 2020; Yang et al. 2020; Sohrabi et al. 2020) China quickly entered a state of fighting against the new coronavirus based on their experience in the use of suppression policies during the SARS-CoV epidemic. Individual behaviour has been crucial in controlling the spread of COVID-19. As a result of the suppression measures taken by the government, on 23 January 2020 Wuhan was quarantined and movement was restricted across Hubei province, affecting 50 million people. All public transportation was sealed off within China, while outside of China aviation restrictions were applied and several countries initiated temperature and symptom screening protocols towards Chinese citizens. In Wuhan, two new hospitals were built in two weeks in early February to treat coronavirus patients. |
| 2. | “Coronavirus: China’s first confirmed Covid-19 case traced back to November 17”, Ma, J., South China Morning Post, March 2020, https://www.scmp.com/news/china/society/article/3074991/corona\virus-chinas-first-confirmed-covid-19-case-traced-back?onboard=true. |
| 3. | “Tracing the New Coronavirus gene sequencing: when did the alarm sound”, Gao, Y. and Peng, Y. and Yang, R. and Feng, Y. and Ma, D., Caixin Global, February 2020, https://web.archive.org/web/20200227094018/http://china.caixin.com/2020-02-26/101520972.html. |
| 4. | “Li Wenliang: Coronavirus kills Chinese whistleblower doctor”, McDonell, S., BBC News, February 2020, https://www.bbc.com/news/world-asia-china-51403795. |
| 5. | “Wuhan unexplained pneumonia has been isolated test results will be announced as soon as available”, Yang, X., Yicai Global, December 2019, https://m.yicai.com/news/100451932.html. |
| 6. | “Wuhan Municipal Health Commission’s message about our city’s present pneumonia situation”, Wuhan Municipal Health Commission, December 2019, https://web.archive.org/web/2020010921541\3/http://wjw.wuhan.gov.cn/front/web/showDetail/2019123108989. |
| 7. | “Pneumonia of unknown cause – China”, World Health Organization, January 2020, https://www.who.int/csr/don/05-january-2020-pneumonia-of-unkown-cause-china/en/. |
| 8. | “8 legally sanctioned for spreading false information on the ‘Wuhan viral pneumonia”’, Liao, J. and Feng, G., Xinhua Net, January 2020, http://www.xinhuanet.com/2020-01/01/c_1125412773.htm. |
| 9. | “China releases genetic data on new coronavirus, now deadly”, Schnirring, L., CIDRAP News, January 2020, https://www.cidrap.umn.edu/news-perspective/2020/01/china-releases-genetic-data-new-coronavirus-now-deadly. |
| 10. | “China reports first death from new virus”, Qin, A. and Hernández, J. C., The New York Times, January 2020, https://www.nytimes.com/2020/01/10/world/asia/china-virus-wuhan-death.html. |
| 11. | “China confirms human-to-human transmission of coronavirus”, Kuo, L, The Guardian, January 2020, https://www.theguardian.com/world/2020/jan/20/coronavirus-spreads-to-beijing-as-china-confirms-new-cases. |
| 12. | “Coronavirus hospital set to open in Wuhan with 1400 military medical staff”, Wu, W., South China Morning Post, February 2020, https://www.scmp.com/news/china/politics/article/3048592/corona\virus-hospital-set-open-wuhan-1400-military-medical-staff. |
| 13. | “How China built two coronavirus hospitals in just over a week”, Wang, J. and Zhu, E. and Umlauf, T., The Wall Street Journal, February 2020, https://www.wsj.com/articles/how-china-can-build-a-coronavirus-hospital-in-10-days-11580397751. |
| 14. | “Coronavirus: China reports 254 deaths in a day as cases surge after including clinically diagnosed patients”, Zhou, C. and Choy, G. and Zhuang, P., South China Morning Post, February 2020, https://www.scmp.com/news/china/society/article/3050354/coronavirus-hubei-province-reports-sharp-spike-new-confirmed. |
| 15. | “China to lift travel restrictions in Hubei after months of coronavirus lockdown”, Davidson, H., The Guardian, March 2020, https://www.theguardian.com/world/2020/mar/24/china-to-lift-travel-restrictions-in-hubei-after-months-of-coronavirus-lockdown. |
| 16. | “China will lift lockdown on Wuhan, the epicenter of coronavirus outbreak, on April 8”, O’Kane, C., CBS News, March 2020, https://www.cbsnews.com/news/coronavirus-update-china-lift-lockdown-wuhan-april-8-epicenter-quarantine/. |
| 17. | “China’s Wuhan raises Covid-19 death toll by 50%, citing early lapses”, Chen, Y. and Goh, B., Reuters, April 2020, https://www.thejakartapost.com/news/2020/04/17/chinas-wuhan-raises-coronavirus-death-toll-by-50-citing-early-lapses.html. |
| 18. | “Coronavirus: China outbreak city Wuhan raises death toll by 50%”, McDonell, S., BBC News, April 2020, https://www.bbc.com/news/world-asia-china-52321529. |
| 19. | “Spain daily coronavirus death toll lowest in weeks: Live updates”, Rasheed, Z. and Stepansky, J. and Allahoum, R., Al Jazeera, April 2020, https://web.archive.org/web/20200427041920/https://www.aljaze\era.com/news/2020/04/global-coronavirus-deaths-pass-200000-live-updates-200425232324631.html. |
| 20. | “Coronavirus, primi due casi in Italia”, Severgnini, C., Corriere della Sera, January 2020, https://www.corriere.it/cronache/20_gennaio_30/coronavirus-italia-corona-9d6dc436-4343-11ea-bdc8-faf1f56f19b7.shtml. |
| 21. | “Italy declares state of emergency”, Borghese, L., CNN, January 2020, https://edition.cnn.com/\asia/live-news/coronavirus-outbreak-01-31-20-intl-hnk/h_ed756d2007470c7fb4eeb4492bafabf5. |
| 22. | “Factbox: Latest on coronavirus spreading in China and beyond”, Daniel, A. C. and Nissi, M. and Kalluvila, S., Reuters, February 2020, https://uk.reuters.com/article/us-china-health-latest-factbox/factbox-latest-on-coronavirus-spreading-in-china-and-beyond-idUKKBN20E1BF. |
| 23. | “Italian towns on lockdown after 2 virus deaths, clusters”, Bruno, L. and Winfield, N., CTV News, February 2020, https://www.ctvnews.ca/world/italian-towns-on-lockdown-after-2-virus-deaths-clusters-1.4823230. |
| 24. | “What towns in Italy are on lockdown because of coronavirus?”, Paul, A., Metro, February 2020, https://metro.co.uk/2020/02/25/towns-italy-lockdown-coronavirus-12298246/. |
| 25. | “Italy under lockdown: ‘My town is shocked and scared”’, Johnson, M. and Ghiglione, D, Financial Times, February 2020, https://www.ft.com/content/8f34c332-5947-11ea-abe5-8e03987b7b20. |
| 26. | “Coronavirus, scuole chiuse in tutta Italia fino a metà marzo”, Guerzoni, M. and Santarpia, V., Corriere della Sera, March 2020, https://www.corriere.it/scuola/20_marzo_04/coronavirus-scuole-chiuse-tutta-italia-decisione-governo-entro-stasera-e7ba0614-5e12-11ea-8e26-25d9a5210d01.shtml. |
| 27. | “Italy orders closure of all schools and universities due to coronavirus”, Giuffrida, A. and Tondo, L. and Beaumont, P., The Guardian, March 2020, https://www.theguardian.com/world/2020/mar/04/\italy-orders-closure-of-schools-and-universities-due-to-coronavirus. |
| 28. | “Italy quarantines 16 million people over coronavirus fears”, Bertelli, M., Al Jazeera, March 2020, https://www.aljazeera.com/news/2020/03/italy-quarantines-quarter-population-fight-coronavirus-200308071832617.html. |
| 29. | “Italy extends emergency measures nationwide”, Archeta, K., COVID-19 World News, March 2020, https://covid19data.com/2020/03/10/italy-extends-emergency-measures-nationwide/. |
| 30. | “Coronavirus: Italy bans any movement inside country as toll nears 5500”, Giuffrida, A. and Safi, M. and Farrer, M., The Guardian, March 2020, https://www.theguardian.com/world/2020/mar/22/italian-pm-warns-of-worst-crisis-since-ww2-as-coronavirus-deaths-leap-by-almost-800. |
| 31. | “Italy records lowest coronavirus death toll for a week”, Henley, J., The Guardian, April 2020, https://www.theguardian.com/world/2020/apr/01/italy-extends-lockdown-amid-signs-coronavirus-infection-rate-is-easing. |
| 32. | “L’Italia chiude i porti”, Salvatori, P., HuffPost, April 2020, https://www.huffingtonpost.it/entry/litalia-chiude-i-porti_it_5e8d89f2c5b6e1d10a6c2671?yhj&utm_hp_ref=it-homepage. |
| 33. | “Italy Goverment Set to Extend Virus Lockdown to May 3: Ansa”, Follain, J., Bloomberg, April 2020, https://www.bloomberg.com/news/articles/2020-04-10/italy-goverment-set-to-extend-virus-lockdown-to-may-3-ansa. |
| 34. | “Italy PM extends virus lockdown, says euro zone rescue plan inadequate”, Jones, G. and Amante, A., Reuters, April 2020, https://www.reuters.com/article/us-health-coronavirus-italy-conte/italy-extends-coronavirus-lockdown-until-may-3-prime-minister-idUSKCN21S1YL. |
| 35. | “Italy sees first fall of active coronavirus cases”, Mayberry, K. and Stepansky, J. and Varshalomidze, T., Al Jazeera, April 2020, https://www.aljazeera.com/news/2020/04/coronavirus-deaths-exceed-40000-live-updates-200419233722851.html. |
| 36. | “Discorso di Conte in conferenza stampa, le riaperture dal 18 maggio: “Corriamo un rischio calcolato””, Severgnini, C., Corriere della Sera, May 2020, https://www.corriere.it/politica/20_maggio_\16/discorso-conte-conferenza-stampa-oggi-decreto-18-maggio-1e810142-9785-11ea-ba09-20ae073bed63.shtml. |
| 37. | “Spain confirms first case of Wuhan coronavirus”, Linde, P., El País, February 2020, https://english.elpais.com/international/2020-02-03/spain-confirms-first-case-of-wuhan-coron\virus.html?rel=listapoyo. |
| 38. | “First confirmed coronavirus case in Spain in La Gomera, Canary Islands”, Bilbatua, J., Outbreak News Today, February 2020, http://outbreaknewstoday.com/first-confirmed-coronavirus-case-in-spain-in-la-gomera-canary-islands-20628/. |
| 39. | “Spanish town faces police lockdown to contain coronavirus”, Jones, S., The Guardian, March 2020, https://www.theguardian.com/world/2020/mar/07/spanish-town-faces-police-lockdown-to-contain-coronavirus. |
| 40. | “España prohíbe todos los vuelos directos procedentes de Italia hasta el 25 de marzo”, Vega, M., El Español, March 2020, https://www.elespanol.com/invertia/empresas/20200310/espana-prohibe-vuelos-directos-italia-marzo/473703280_0.html. |
| 41. | “Spanish government declares state of alarm”, Cué, C. E. and Pérez, C., El País, March 2020, https://english.elpais.com/politics/2020-03-13/spanish-government-declares-state-of-alarm-in-bid-to-combat-coronavirus-spread.html?rel=listapoyo. |
| 42. | “El Gobierno informa de que es la única autoridad en toda. España, limita los desplazamientos y cierra comercios”, Cué, C. E., El País, March 2020, https://elpais.com/espana/2020-03-14/el-gobierno-prohibe-todos-los-viajes-que-no-sean-de-fuerza-mayor.html. |
| 43. | “Spain to impose nationwide lockdown - El Mundo”, Melander, I. and Jones, J., Reuters, March 2020, https://nationalpost.com/pmn/health-pmn/spain-to-impose-nationwide-lockdown-el-mundo. |
| 44. | “Spain may be a week ahead of the U.S. in its coronavirus quarantine: Here’s what you can learn from its experience”, Kollmeyer, B., MarketWatch, March 2020, https://www.marketwatch.com/story/spain-may-be-a-week-ahead-of-the-us-in-its-coronavirus-quarantine-heres-what-you-can-learn-from-its-experience-2020-03-13. |
| 45. | “Spain orders nationwide lockdown to battle coronavirus”, Jones, S., The Guardian, March 2020, https://www.theguardian.com/world/2020/mar/14/spain-government-set-to-order-nationwide-coronavirus-lockdown. |
| 46. | “Spanish government tightens lockdown to include all non-essential workers”, Marcos, J., El País, March 2020, https://english.elpais.com/politics/2020-03-28/spanish-government-tightens-lockdown-to-include-all-non-essential-workers.html?rel=listapoyo. |
| 47. | “Spain orders non-essential workers stay home for two weeks”, Jones, S., The Guardian, March 2020, https://www.theguardian.com/world/2020/mar/28/covid-19-may-be-peaking-in-parts-of-spain-says-official. |
| 48. | “Congress backs PM’s request to extend state of alarm in Spain until April 26, with a further 15 days likely”, Díez, A. and Casqueiro, J., El País, April 2020, https://english.elpais.com/politics/2020-04-10/congress-backs-pms-request-to-extend-confinement-measures-in-spain-until-april-26-with-a-further-15-days-likely.html?rel=listapoyo. |
| 49. | “Spain extends state of emergency until May 9, prolonging lockdown to 8 weeks”, Alberti, M. and Rebaza, C. and Formanek, I. and Goodman, A. and Tejera, I., CNN, April 2020, https://edition.cnn.com/world/live-news/coronavirus-pandemic-04-23-20-intl/h_5757522b8521fde\da9a5c6e914a7b7c6
. |
| 50. | “Spain’s Government approves territories that can move to Phase 1 of de-escalation lifting restrictions for 51% of its population—here’s the complete list”, Sappal, P., Euro Weekly News, May 2020, https://www.euroweeklynews.com/2020/05/08/breaking-news-spains-government-approves-territories-that-can-move-to-phase-1-of-deescalation-lifting-restrictions-for-51-of-its-population-heres-the-complete-list/. |
| 51. | “El mapa de la desescalada: las provincias y territorios que pasan de fase el lunes 25 de mayo”, Hernández, Q., La Sexta, May 2020, https://www.lasexta.com/noticias/nacional/mapa-desescalada-provincias-territorios-que-pasan-fase-lunes-mayo_202005225ec7cb0aea9d4700011bbed9.html. |
| 52. | “Toda España estará el lunes en Fase 3 menos Madrid, algunas provincias de Castilla y León y zonas de Barcelona y Lleida”, León, A., RTVE, June 2020, https://www.rtve.es/noticias/20200612/toda-espana-estara-lunes-fase-3-menos-madrid-algunas-provincias-castilla-leon-barcelona-lleida/2017322.shtml. |
| 53. | “As Spain enters the ‘new normality’ on Sunday, what will change?”, Hunter, S., El País, June 2020, https://english.elpais.com/society/2020-06-20/as-all-of-spain-enters-the-new-normality-on-sunday-what-will-change.html. |
| 54. | “Así es la nueva normalidad”, Villahizán, J., El Día de Valladolid, June 2020, https://www.eldiade\valladolid.com/Noticia/Z5EA0E550-C084-4FC6-AAB1B772D7539471/202006/As%C3%AD-es-la-nueva-normalidad. |
| 55. | The CNHC holds the historical statistics for the 34 provinces and special districts in China. |
| 56. | Dingxiangyuan continuously aggregates data from provincial and city health agencies and the CNHC Dingxiangyuan (2020). |
| 57. | This GitHub repository Wuhan-2019-nCoV (2020) derives data from the literature Huang et al. (2020) for 1 December 2019, to 10 January 2020, after which it relies on the Chinese news aggregator Toutiao API. |
| 58. | “Actualización no. 77. Enfermedad por el coronavirus (COVID-19). 16.04.2020”, Coordination Center for Health Alerts and Emergencies, April 2020, https://www.mscbs.gob.es/profesionales/saludPubli\ca/ccayes/alertasActual/nCov-China/documentos/Actualizacion_77_COVID-19.pdf. |


| City 1 | City 2 | City 3 | … | |
|---|---|---|---|---|
| Day 1 | ||||
| Day 2 | ||||
| … |
| 1 Dec (Day 1) | First case identified |
| 31 Dec (Day 31) | Unknown pneumonia outbreak announced |
| 1 Jan (Day 32) | Huanan Seafood Market closed |
| 9 Jan (Day 40) | First death occurred |
| 20 Jan (Day 51) | Human-to-human transmission confirmed |
| 23 Jan (Day 54) | Lockdown in Wuhan began |
| 28 Jan (Day 59) | Quarantine restrictions governed Hubei province entirely |
| 3 Feb (Day 65) | First speciality field hospital began accepting patients |
| 8 Feb (Day 70) | Second field hospital opened |
| 13 Feb (Day 75) | Hubei reported approximately 10 times more new cases than the previous day due to the new definition of confirmed cases |
| 13 Mar (Day 104) | Easing of restrictions began in Hubei, with the exception of Wuhan |
| 25 Mar (Day 116) | All lockdowns outside Wuhan lifted |
| 9 Apr (Day 131) | Lockdown in Wuhan lifted and all transportation resumed |
| 26 Apr (Day 148) | All coronavirus patients in Wuhan discharged |
| 31 Jan (Day 1) | First two cases confirmed; state of emergency declared |
| 22 Feb (Day 23) | First two deaths occurred; partial lockdowns imposed in two regions in Northern Italy |
| 25 Feb (Day 26) | Cases emerged in other regions |
| 4 Mar (Day 34) | Schools and universities closed nationwide; 100 deaths reached |
| 7 Mar (Day 37) | Lockdown extended to cover more areas |
| 10 Mar (Day 40) | Nationwide lockdown began |
| 21 Mar (Day 51) | All non-essential production, industry and business halted |
| 1 Apr (Day 62) | Lockdown extended until 13 April |
| 8 Apr (Day 69) | All Italian ports closed until 31 July |
| 10 Apr (Day 71) | Lockdown prolonged until 3 May; some businesses reopened |
| 20 Apr (Day 81) | First fall in the number of active cases observed |
| 4 May (Day 95) | Manufacturing industries and construction sites reopened |
| 18 May (Day 109) | Most businesses allowed to reopen; movement granted with each region |
| 25 May (Day 116) | Swimming pools and gyms reopened |
| 15 Jun (Day 137) | Theatres and cinemas reopened |
| 31 Jan (Day 1) | First case confirmed |
| 13 Feb (Day 14) | First death occurred |
| 26 Feb (Day 27) | First case of community transmission reported |
| 7 Mar (Day 37) | First lockdown imposed in Haro |
| 10 Mar (Day 40) | All flights from Italy cancelled until 25 March |
| 15 Mar (Day 45) | Nationwide state of emergency declared; nationwide lockdown imposed |
| 16 Mar (Day 46) | Spanish frontiers closed |
| 28 Mar (Day 58) | All non-essential activities banned |
| 9 Apr (Day 70) | State of emergency extended until 26 April |
| 13 Apr (Day 74) | Construction and industry workers allowed to return to work |
| 23 Apr (Day 84) | State of emergency extended until 9 May |
| 2 May (Day 93) | Short walks and individual sports allowed |
| 11 May (Day 102) | Small shops, terraces and places of worship reopened with restricted capacities |
| 18 May (Day 109) | Almost half of the territory of Spain entered phase 2 |
| 8 Jun (Day 130) | More than half of the territory of Spain entered phase 3, allowing the reopening of shops, hotels, bars and nightclubs |
| 15 Jun (Day 137) | Several provinces entered the "new normality” phase |
| 21 Jun (Day 143) | State of emergency expired; the whole of Spain entered the "new normality” phase; all internal borders among communities reopened; flights with other EU countries and the UK resumed |
Publisher’s Note: MDPI stays neutral with regard to jurisdictional claims in published maps and institutional affiliations. |
© 2020 by the authors. Licensee MDPI, Basel, Switzerland. This article is an open access article distributed under the terms and conditions of the Creative Commons Attribution (CC BY) license (http://creativecommons.org/licenses/by/4.0/).
Share and Cite
Şahin, Ş.; Boado-Penas, M.d.C.; Constantinescu, C.; Eisenberg, J.; Henshaw, K.; Hu, M.; Wang, J.; Zhu, W. First Quarter Chronicle of COVID-19: An Attempt to Measure Governments’ Responses. Risks 2020, 8, 115. https://doi.org/10.3390/risks8040115
Şahin Ş, Boado-Penas MdC, Constantinescu C, Eisenberg J, Henshaw K, Hu M, Wang J, Zhu W. First Quarter Chronicle of COVID-19: An Attempt to Measure Governments’ Responses. Risks. 2020; 8(4):115. https://doi.org/10.3390/risks8040115
Chicago/Turabian StyleŞahin, Şule, María del Carmen Boado-Penas, Corina Constantinescu, Julia Eisenberg, Kira Henshaw, Maoqi Hu, Jing Wang, and Wei Zhu. 2020. "First Quarter Chronicle of COVID-19: An Attempt to Measure Governments’ Responses" Risks 8, no. 4: 115. https://doi.org/10.3390/risks8040115