
Abstract
Characterizing the interactions that SARS-CoV-2 viral RNAs make with host cell proteins during infection can improve our understanding of viral RNA functions and the host innate immune response. Using RNA antisense purification and mass spectrometry, we identified up to 104 human proteins that directly and specifically bind to SARS-CoV-2 RNAs in infected human cells. We integrated the SARS-CoV-2 RNA interactome with changes in proteome abundance induced by viral infection and linked interactome proteins to cellular pathways relevant to SARS-CoV-2 infections. We demonstrated by genetic perturbation that cellular nucleic acid-binding protein (CNBP) and La-related protein 1 (LARP1), two of the most strongly enriched viral RNA binders, restrict SARS-CoV-2 replication in infected cells and provide a global map of their direct RNA contact sites. Pharmacological inhibition of three other RNA interactome members, PPIA, ATP1A1, and the ARP2/3 complex, reduced viral replication in two human cell lines. The identification of host dependency factors and defence strategies as presented in this work will improve the design of targeted therapeutics against SARS-CoV-2.
Main
The rapid spread of a new severe acute respiratory syndrome-related coronavirus (SARS-CoV-2) around the globe has led to a worldwide spike in a SARS-like respiratory illness termed coronavirus disease 2019 (COVID-19)1. To date, more than one million lives have been lost due to COVID-19. A detailed understanding of the molecular interactions and perturbations occurring during SARS-CoV-2 infection is required to understand the biology of SARS-CoV-2 and design therapeutic strategies.
SARS-CoV-2 is an enveloped, positive-sense, single-stranded RNA virus that, upon infection of a host cell, deploys a ‘translation-ready’ RNA molecule, which uses the protein synthesis machinery of the host to express a set of viral proteins crucial for replication2. Replication of the full-length viral genome and transcription of subgenomic RNAs both involve the synthesis of negative-strand RNA intermediates3. In common with other RNA viruses, SARS-CoV-2 is dependent on effectively engaging host cell factors such as regulators of RNA stability, processing, localization and translation to facilitate replication and production of progeny. The host cell, on the other hand, must detect the pathogen and activate appropriate innate immune response pathways to restrict virus infection4.
Studies on SARS-CoV-2-infected human cells to date have focused on characterizing expression or modification changes in the host cell transcriptome5,6 or proteome7,8,9. Further, interactions between recombinant viral proteins and host proteins have been identified in uninfected cells10,11. Mapping of the interactions between viral and host proteins has revealed cellular pathways relevant to productive infection12. However, these studies cannot reveal how viral RNA is regulated during infection or how host cell RNA metabolism is remodelled to enable virus replication13.
We sought to obtain an unbiased and quantitative picture of the cellular proteins that directly bind to SARS-CoV-2 RNAs in infected human cells. Recent RNA capture and quantitative mass spectrometry (MS) approaches14,15,16,17 applied ultraviolet (UV) crosslinking to create covalent bonds between RNA molecules and the proteins they directly interact with. Unlike chemical crosslinking, UV irradiation does not stabilize protein–protein or RNA–RNA interactions, making it a preferable choice for dissecting direct RNA–protein interactions18,19. RNA antisense purification and quantitative mass spectrometry (RAP–MS) combines UV crosslinking with a highly denaturing purification procedure and is ideally suited to capture and identify only those proteins that bind directly to SARS-CoV-2 RNAs14,15.
Results
Capturing SARS-CoV-2 RNAs in infected human cells
To purify SARS-CoV-2 RNAs and the complement of directly crosslinked cellular proteins from infected human cells, we designed a pool of biotinylated DNA oligonucleotides antisense to the positive-sense SARS-CoV-2 RNA and its subgenomic messenger RNAs. As a cellular system, we selected the human liver cell line Huh7, which is naturally permissive to both SARS-CoV-1 and SARS-CoV-2 replication20,21. SARS-CoV-2 preferentially infects cells in the respiratory tract, but infection of multiple organs, including the liver, has been reported22.
To test if our pool of antisense capture probes was suitable for the purification of SARS-CoV-2 RNAs from infected Huh7 cells, we performed RAP–MS 24 h after infection when viral replication levels were high21. We implemented a covalent protein capture step after the release of SARS-CoV-2 RNA-bound proteins, which enabled us to identify RNA sequences crosslinked to purified proteins (Fig. 1a and Methods). Protein-crosslinked RNA fragments mapped to the entire length of the viral genome with near-complete sequence coverage, indicating that interactions across all viral RNA regions were captured (Extended Data Fig. 1a). Sequencing reads originating from SARS-CoV-2 RNA made up 93 and 92% of all mapped reads in 2 highly correlated replicate experiments (r = 0.994; Extended Data Fig. 1b,c).
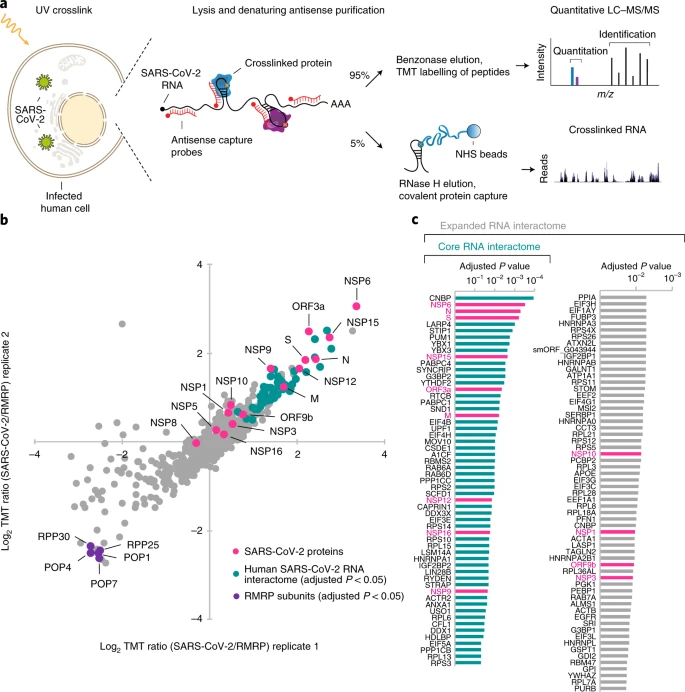
a, Outline of the RAP–MS method to identify proteins bound to SARS-CoV-2 RNA and their crosslinked RNA sequences. b, Quantification of SARS-CoV-2 RNA-interacting proteins relative to RMRP-interacting proteins. The scatter plot of log2-transformed TMT ratios from two biological replicates is shown. The grey dots represent all proteins detected with two or more unique peptides. c, Proteins enriched in SARS-CoV-2 RNA purifications (Supplementary Table 1). Left: core SARS-CoV-2 RNA interactome (adjusted P < 0.05). Left and right: expanded SARS-CoV-2 RNA interactome. Significantly enriched proteins are highlighted in teal; SARS-CoV-2-encoded proteins are highlighted in magenta. Adjusted P value: two-tailed moderated t-test.
To identify proteins that specifically interact with SARS-CoV-2 RNAs as opposed to non-specific background proteins, we compared the protein content of SARS-CoV-2 RNA purifications to that of an unrelated control ribonucleoprotein complex of known composition. As the control, we used the endogenously expressed human ribonuclease mitochondrial RNA processing (RMRP) RNA and purified both SARS-CoV-2 RNA and RMRP from infected Huh7 cells. RMRP was selected for several reasons: (1) RMRP interacts with approximately ten well-known proteins that serve as an internal control15,23; (2) RMRP is not translated; and (3) RMRP does not globally bind to mRNA. Hence, RMRP-binding proteins are distinct from the group of proteins expected to bind to SARS-CoV-2 RNAs, making it an ideal control for the discovery of unknown interactors. Further, the purification of SARS-CoV-2 RNA and RMRP from infected cells avoids biases resulting from widespread changes in the host cell proteome induced by viral infection.
On average, approximately 90% of all crosslinked RNA fragments originated from the SARS-CoV-2 genome in SARS-CoV-2 RNA purifications, while more than 99% of crosslinked RNA fragments from RMRP purifications mapped to the human genome (Extended Data Fig. 1d). Western blot analysis confirmed the specific capture of SARS-CoV-2 nucleocapsid protein only in SARS-CoV-2-purified samples (Extended Data Fig. 1e). The RMRP component POP1 was detected only in RMRP purifications. Together, these experiments verify the high specificity of our approach for capturing the desired RNAs and the proteins that directly bind to them.
An atlas of SARS-CoV-2 RNA–protein interactions in human cells
Next, we subjected proteins purified with RMRP and SARS-CoV-2 RNAs to tandem mass tag (TMT) labelling and relative quantification by liquid chromatography coupled with tandem mass spectrometry (LC–MS/MS). In two replicate experiments, we identified 699 proteins, of which 583 were detected with 2 or more unique peptides (Supplementary Table 1 and Methods). As shown in Fig. 1b, we found five known RMRP components among the ten most significantly enriched proteins in RMRP purifications.
Next, we analysed proteins enriched in SARS-CoV-2 RNA purifications and found 15 SARS-CoV-2 proteins, 6 of which were among the 20 most significantly enriched proteins (Fig. 1b,c). In addition to 5 viral proteins translated from distinct open reading frames (ORFs), 10 of the 16 non-structural proteins (NSPs), which are derived from a precursor polyprotein24, were detected by RAP–MS.
As expected, the SARS-CoV-2 nucleocapsid protein, which binds the viral RNA, was one of the two most significantly enriched viral proteins, followed by several known viral RNA binders, such as the endoribonuclease NSP15 (ref. 25), the RNA-dependent RNA polymerase (RdRP) NSP12 (ref. 26), the methyltransferase NSP16 (ref. 27), the RNA-binding protein NSP9 (ref. 28), the capping factor NSP10 (ref. 27), the primase NSP8 (ref. 26), the 5′-UTR binder NSP1 (ref. 29) and the multifunctional protein NSP3 (ref. 30). Remarkably, NSP3 and the most strongly enriched protein in our data, NSP6, were required for the formation of double-membrane vesicles31 and both proteins are candidate constituents of a molecular pore complex involved in the export of RNA from coronavirus double-membrane vesicles32. We also found ORF3a, which binds the 5′-end of the SARS-CoV-1 genome33, as well as ORF9b and the S and M proteins among strongly enriched candidates. While M is known to interact with the nucleocapsid protein, a model for genomic RNA packaging further suggests a possible RNA-binding function for M34. An RNA-binding activity of S was not previously reported. While S covers the surface of the viral envelope, it has a transmembrane domain and an intracellular tail35, making it conceivable that S may indeed contact viral RNA.
Discovery of 104 human proteins that bind SARS-CoV-2 RNA
We next focused on the human proteins enriched in SARS-CoV-2 RNA purifications. We identified 276 proteins with a positive log2 fold change. Of these, 57 were significantly enriched (adjusted P < 0.05, two-tailed t-test), which we subsequently defined as the set of core SARS-CoV-2 RNA interacting proteins (Fig. 1c). Additionally, we also defined an expanded SARS-CoV-2 RNA interactome using a relaxed false discovery rate (FDR) of less than 20% (Fig. 1c).
The expanded SARS-CoV-2 RNA interactome encompassed 104 human proteins and included 13 SARS-CoV-2-encoded proteins. The vast majority of the human RNA interactome proteins (100 proteins, 96%) have been identified previously in system-wide studies aimed at capturing proteins that crosslink to RNA36 (Supplementary Table 2). Comparing this expanded SARS-CoV-2 RNA interactome with the poly(A)-RNA interactome in Huh7 cells37, revealed high overlap between both datasets (69 proteins, 66%) (Fig. 2a). Next, we compared our direct SARS-CoV-2 RNA interactome with proteins that directly or indirectly associate with the RNA genomes of Dengue and Zika viruses in Huh7.5 cells38. Sixty-six proteins (63%) of the expanded SARS-CoV-2 RNA interactome also associated with the Dengue and Zika virus RNAs, while 38 proteins (36.5%) were unique SARS-CoV-2 RNA binders (Fig. 2a). Since coronaviruses form replication/transcription complexes (RTCs), we also compared the expanded SARS-CoV-2 RNA interactome to the protein content of murine coronavirus RTCs39 and found 64 shared proteins (Supplementary Table 2).

a, Intersection of the expanded SARS-CoV-2 RNA interactome with the poly(A)-RNA interactome and the Dengue/Zika virus interactome in Huh7 cells (Supplementary Table 2). b, GO enrichment analysis of SARS-CoV-2 RNA interactome proteins. Circle sizes scale to the number of detected proteins. SRP, signal recognition particle. Statistical test: Fisher’s exact test with Benjamini–Hochberg adjustment. c, Protein–protein association network of the expanded SARS-CoV-2 RNA interactome. Published virus-associated proteins are highlighted. Proteins without connections are not shown. d, As in c but proteins undergoing dynamic phosphorylation upon SARS-CoV-2 infection7 are highlighted. e, As in c but proteins that overlap known drug target genes (Drug Gene Interaction Database) are highlighted.
Finally, only 10 of the 332 human proteins that bound recombinant SARS-CoV-2 proteins in uninfected cells10 also bound directly to viral RNA in infected cells (Supplementary Table 2). These results highlight the importance of discriminating between protein–protein and RNA–protein interactions when dissecting the biology of SARS-CoV-2.
Biological functions of SARS-CoV-2 RNA-binding proteins
To analyse the biological functions of SARS-CoV-2 RNA binders, we performed a hypergeometric gene ontology (GO) enrichment analysis on the expanded SARS-CoV-2 RNA interactome. We observed strong enrichment for GO terms linked to translational initiation (GO:0006413), nonsense-mediated decay (GO:0000184), signal-recognition particle-dependent cotranslational protein targeting to the membrane (GO:0006614) and viral transcription (GO:0019083) (Fig. 2b and Supplementary Table 3). Consistent with the enrichment of these GO terms, the importance of subgenomic mRNA translation at the endoplasmic reticulum membrane is well established for coronaviruses40. Further, nonsense-mediated mRNA decay was recently described as an antiviral mechanism targeting coronavirus RNAs41.
In agreement with the crucial role of mRNA translation, the expanded SARS-CoV-2 RNA interactome included 19 ribosomal proteins and 12 translation factors. Among the translation factors, the eukaryotic translation initiation factor 4F (EIF4F) components EIF4G1 and EIF4B are regulated by mammalian target of rapamycin (mTOR) signalling42,43. EIF4B is important for recruiting the 40S subunit to mRNA and both the phosphatidylinositol-3-kinase (PI3K)/mTOR and mitogen-activated protein kinase (MAPK) pathways target EIF4B to control its activity43. Inhibition of PI3K/Akt/mTOR signalling has been demonstrated to suppress SARS-CoV-2 replication in Caco2 cells8.
To examine the connectivity of the identified SARS-CoV-2 RNA-binding proteins and their relationship to virus-associated biological processes systematically, we constructed a protein–protein association network using our expanded RNA interactome (Fig. 2c and Supplementary Table 4). We observed a striking enrichment for physical interactions when comparing the total connectivity among RNA interactome proteins to the connectivity of equally sized networks sampled from expressed proteins (Extended Data Fig. 2 and Methods; permutation test P < 2.2 × 10⁻¹⁶). In addition to ribosomal proteins and translation factors, many virus-associated RNA-binding proteins are prominently represented in this network (Fig. 2c). Since RNA-binding proteins can be regulated by phosphorylation, we intersected our expanded SARS-CoV-2 RNA interactome with a recent phosphoproteomic dissection of SARS-CoV-2-infected cells7, highlighting 30 proteins that might be dynamically phosphorylated in response to SARS-CoV-2 infection (Fig. 2d).
We next integrated known drug–target interactions44 within this network and identified 23 SARS-CoV-2 RNA interactome proteins that can be targeted with existing compounds, including peptidyl-prolyl cis-trans isomerase A (PPIA), actin-related protein 2 (ACTR2; henceforth ARP2), sodium/potassium-transporting ATPase subunit alpha-1 (ATP1A1), annexin A1 (ANXA1), cofilin-1 (CFL1) and epidermal growth factor receptor (EGFR) (Fig. 2e). Notably, EGFR is a known target of compounds that inhibit SARS-CoV-2 replication7,8,10.
Identification of activated host response pathways
To gain deeper insight into host response pathways activated upon SARS-CoV-2 infection, we globally measured protein abundance changes in infected cells. We performed triplicate MS experiments on SARS-CoV-2-infected and uninfected Huh7 cells and identified 10,956 proteins with 2 or more unique peptides (Fig. 3a and Supplementary Table 5). Among the detected proteins, 4,578 proteins were regulated (adjusted P < 0.05, two-tailed t-test) after 24 h of SARS-CoV-2 infection, which is consistent with widespread proteome regulation and agrees well with previously published data (Extended Data Fig. 3a)8,9. As expected, proteome samples clustered according to their infection status in a principal component analysis (Extended Data Fig. 3b). Among differentially expressed proteins, we detected 13 viral proteins and 56 proteins from our expanded SARS-CoV-2 RNA interactome (Fig. 3a).

a, Volcano plot of proteome abundance measurements in SARS-CoV-2-infected and uninfected Huh7 cells 24 h post-infection (n = 3) (Supplementary Table 5). Adjusted P value: two-tailed moderated t-test. SARS-CoV-2-encoded proteins are shown in magenta; human SARS-CoV-2 RNA interactome proteins are shown in teal; interferon response-related proteins are shown in purple. b, GSEA for the global proteome abundance measurements shown in a. Selected gene sets are shown; the full table displaying additional enriched gene sets is provided in Extended Data Fig. 3c. Statistical test: Kolmogorov–Smirnov test with Benjamini–Hochberg adjustment. NES, normalized enrichment score. c, Protein–protein association network of core SARS-CoV-2 RNA interactome proteins and their connections to differentially regulated proteins in SARS-CoV-2-infected cells based on curated interactions in STRING v.11 (ref. 96). Upregulated proteins are shown in light grey; downregulated proteins are shown in dark grey. Circle sizes scale to the number of connections of each interactome protein. Selected GO enrichments for network communities are shown in the transparent circles (Methods). Full GO term analysis is provided in Supplementary Table 8.
We next performed gene set enrichment analysis (GSEA) using our proteome abundance measurements. Among the most significantly enriched hallmark gene sets were ‘TGF-β signalling’, ‘TNF-α signalling via NF-κB’, ‘interferon (IFN)-γ response’ and ‘IL-6 JAK STAT3 signalling’ (Fig. 3b and Extended Data Fig. 3c), which is consistent with the induction of broad pro-inflammatory and antiviral responses in infected cells. Further, we observed significant enrichment of the gene sets ‘GO regulation of MAPK cascade’, ‘GO positive regulation of MAPK activity’ and ‘GO response to type I interferon’ (Supplementary Table 6). Recent evidence indicates that these pathways are indeed highly relevant in the context of SARS-CoV-2 infections5,7,8. Inhibition of growth factor signalling through the MAPK pathway, which responds to and controls the production of pro-inflammatory cytokines, including TNFα and IL-6, was shown to modulate SARS-CoV-2 replication7,8.
In agreement with recent transcriptome studies5,6, our proteome data suggest activation of interferon signalling upon SARS-CoV-2 infection. Among interferon-related genes, we observed significant upregulation of several major components of IFN signalling pathways, including STAT1 and IRF9, which together with STAT2 make up the interferon stimulated gene factor 3 (ISGF3) complex, their upstream components TYK2 and JAK1, as well as their downstream targets IFIT1, IFIT3, IFITM3, OAS2 and ISG15 (Fig. 3a). Other strongly upregulated IFN-related genes include BST2, SP110, UBE2L6, ADAR and TGIF1 (Supplementary Table 5). Notably, many SARS-CoV-2 RNA interactome members are linked to the IFN response. These include the strongly enriched PUM1 (ref. 45), YBX1 (ref. 46), SYNCRIP47, G3BP1 (refs. 48,49), G3BP2 (refs. 48,49), EIF4B50, MOV10 (ref. 51), CAPRIN1 (ref. 49), DDX3X52, LSM14A53, RyDEN54,55, STRAP56, ANXA1 (ref. 57), DDX1 (ref. 58), PCBP2 (ref. 59), HNRNPA2B1 (ref. 60) and YWHAZ61. In conclusion, our proteome analysis verifies the induction of an appropriate host response in SARS-CoV-2-infected Huh7 cells and further supports an important role for IFN and MAPK signalling in SARS-CoV-2 infection.
Interplay between SARS-CoV-2 RNA binders and host cell proteins
As an RNA-based obligate intracellular parasite, SARS-CoV-2 must effectively interface with the host cell and rewire RNA metabolism and RNA-associated regulatory processes. In addition to controlling the RNA life cycle62, host RNA-binding proteins are an integral part of regulatory circuits that participate in host defence mechanisms63,64. To examine the interplay and connectivity between direct SARS-CoV-2 RNA binders and the host cell proteome, we used curated protein–protein interaction data to build a network that visualizes interactions between SARS-CoV-2 RNA binders and regulated host proteins (Fig. 3c, Extended Data Fig. 3d and Supplementary Table 7). We considered the connectivity among all differentially expressed host proteins and those that were detected in our core RNA interactome. Interactome proteins had a greater than twofold enrichment for network connections (mean 108) when compared to proteins not detected by RAP–MS (mean 45), indicating a significant enrichment in connectivity (Wilcoxon test, P = 8.92 × 10−08). To further contextualize this network, we overlaid biological processes that were enriched among regulated protein communities that associate with SARS-CoV-2 RNA binders (Fig. 3c and Supplementary Table 8). This analysis highlighted several cellular pathways and processes emerging as highly relevant in the context of SARS-CoV-2 infections, including myeloid-mediated immunity65, receptor signalling8, protein phosphorylation7,8, vesicle transport8,10, protein folding6,7 and translational regulation8,66.
Taken together, our network analysis connects RNA interactome proteins to emerging SARS-CoV-2 biology and provides a map of putative regulatory hubs in SARS-CoV-2 infections.
Genetic screens identify functional SARS-CoV-2 RNA binders
To functionally stratify our direct RNA binders, we intersected the SARS-CoV-2 RNA interactome with a recent genome-wide CRISPR perturbation screen designed to identify host factors that affect cell survival after SARS-CoV-2 infection67. Out of 104 human proteins in our expanded RNA interactome, we obtained CRISPR z-scores for 94 proteins67; depletion of 11 of these proteins had a statistically significant effect on SARS-CoV-2-induced cell death (Fig. 4a). Strikingly, cellular nucleic acid-binding protein (CNBP), the human protein most significantly enriched in RAP–MS, also had the most significant effect on virus-induced cell death among all SARS-CoV-2 RNA interactome members (Fig. 4a). In addition to the 11 aforementioned proteins, the direct SARS-CoV-2 RNA binders cold shock domain-containing protein E1 (CSDE1)68, polyadenylate-binding protein 1 (PABPC1) (refs. 11,68) and Ras-related protein Rab-7a (RAB7A)11 were also identified as host factors with functional relevance in SARS-CoV-2 infections by genetic screening approaches.

a, SARS-CoV-2 RNA interactome proteins overlaid on genome-wide CRISPR perturbation data from SARS-CoV-2-infected Vero E6 cells67. Members of the expanded RNA interactome with significant (adjusted P < 0.05, two-sided z-test with Benjamini–Hochberg correction) changes in CRISPR z-scores are highlighted in magenta. The y axis is capped at 1 × 10⁻¹⁹, excluding 4 genes. b, Western blot of Huh7 CNBP knockout and control cell lines (top). RT–qPCR measurements of intracellular SARS-CoV-2 RNA (RdRP gene) at 48 h post-infection in Huh7 CNBP knockout and control cells (bottom). Quantification relative to 18S rRNA and control cells is shown. Values are the mean ± s.d. (n = 3 independent infections). P values were determined using an unpaired two-tailed t-test. ****P < 0.0001. c, Distribution of CNBP eCLIP peaks to different RNA types and transcript regions. d, Meta-gene analysis of CNBP eCLIP signal across mature mRNAs. e, CNBP eCLIP data aligned to the SARS-CoV-2 RNA genome. The fold change relative to the size-matched input is shown. MACS2-enriched peaks are shown below the fold change track.
CNBP functions as an antiviral regulator
CNBP is required to activate the innate immune response and has been linked to regulating the expression of pro-inflammatory cytokines in response to foreign nucleic acid sensing69,70. Notably, CNBP-deficient animals were highly susceptible to infections with different pathogens69,70. These findings are consistent with CNBP-depleted cells being sensitized to virus-induced cell death, which suggests that CNBP may act as an antiviral regulator. To corroborate the functional importance of CNBP in SARS-CoV-2 infections, we generated polyclonal Huh7 CNBP knockout cell lines using CRISPR–Cas9 (Fig. 4b). We infected CNBP knockout cells with SARS-CoV-2 and noted significantly elevated levels of intracellular viral RNA compared to matched Huh7 control cells (Fig. 4b). Thus, CNBP is indeed a functionally important SARS-CoV-2 RNA interactor.
To confirm the direct physical engagement of SARS-CoV-2 RNAs by CNBP, we performed enhanced crosslinking and immunoprecipitation (eCLIP) in SARS-CoV-2-infected Huh7 cells and quantified the enrichment of CNBP peaks relative to size-matched input libraries71. First, we analysed CNBP binding to the human transcriptome. Consistent with earlier reports72, CNBP bound to protein-coding transcripts and displayed a preference for binding within the coding sequence (CDS) of mRNAs (Fig. 4c,d). A large number of transcripts bound by CNBP in SARS-CoV-2-infected cells were previously reported as CNBP targets (approximately 46%; Supplementary Table 9). We next analysed CNBP binding to SARS-CoV-2 RNA and observed several strongly enriched binding sites in the viral genome (Fig. 4e). These data provide strong evidence for a direct interaction between CNBP and SARS-CoV-2 RNAs in infected cells and validate that RAP–MS indeed identifies direct RNA binders. Further, the finding that CNBP preferentially associates with the CDS of mature mRNAs lends credibility to its previously proposed role as a translational regulator72 in addition to its function in regulating pro-inflammatory cytokines.
LARP1 binds genomic and subgenomic SARS-CoV-2 RNAs
Other than CNBP, two members of the La-related protein (LARP) family, namely LARP1 and LARP4, were strongly enriched in SARS-CoV-2 RNA purifications. While LARP1 did not quite meet our significance cut-off, both LARP1 and LARP4 were among the 15 host proteins with the strongest enrichment based on overall effect size, indicating that LARP1 is very likely a SARS-CoV-2 RNA binder. Additionally, LARP1 was detected among protein–protein interactors of the nucleocapsid protein in uninfected cells10.
Given that LARP1 is a major downstream target of mammalian target of rapamycin complex 1 (mTORC1) (refs. 73,74) and inhibition of PI3K/Akt/mTOR was recently shown to inhibit SARS-CoV-2 replication in Caco2 cells8, we sought to characterize the LARP1-SARS-CoV-2 axis in greater detail. We performed eCLIP71 to map direct physical interactions between LARP1 and its RNA targets. LARP1 predominantly bound protein-coding transcripts and we observed most of the enriched peaks in the CDS, followed by 5′-UTR and 3′-UTR sequences (Fig. 5a). Previous work suggested that LARP1 binds the 7-methylguanosine triphosphate (m7Gppp) moiety of the cap and the adjacent 5′-terminal oligopyrimidine (5′TOP) motif of mRNAs to regulate their translation75. Consistent with this finding, our eCLIP data revealed a strong enrichment of 5′-proximal nucleotides in 5′-UTR sequences and we recovered an oligopyrimidine motif reminiscent of TOP-like sequences in approximately 30% of all bound 5′-UTRs (Fig. 5b,c). Out of 112 mRNAs that are regulated by LARP1 downstream of mTOR76, we observed LARP1 binding to 84 mRNAs (75%; Supplementary Table 10). In line with the known regulatory functions of LARP1 (ref. 76), LARP1 target transcripts were most strongly enriched for GO terms linked to translational regulation (Supplementary Table 11). Together, these data demonstrate that our eCLIP experiments recovered known regulatory interactions of LARP1.

a, Distribution of LARP1 eCLIP peaks to different RNA types and transcript regions. b, Meta-gene analysis of LARP1 eCLIP signal across mature mRNAs. c, Oligopyrimidine-rich sequence motif discovered de novo in LARP1 peaks mapping to 5′-UTRs (Methods). d, LARP1 eCLIP data aligned to the SARS-CoV-2 RNA genome. The fold change relative to the size-matched input is shown. MACS2-enriched peaks are shown above the fold change track. Oligopyrimidine-rich sequences that coincide with strongly enriched LARP1 peaks are highlighted. A zoom-in to the SARS-CoV-2 5′-leader sequence is shown below the genomic alignment. e, Left: RT–qPCR measurements of intracellular SARS-CoV-2 RNA at 24 h post-infection in WT HEK293 cells or 4 different LARP1 knockout cell lines. Quantification relative to 18S rRNA and WT cells is shown. Right: Infectious viral titres in the supernatants of infected cells quantified by plaque assays at 24 h post-infection. P values were determined using an unpaired two-tailed t-test. f, Left: RT–qPCR measurements of intracellular SARS-CoV-2 RNA at 24 h post-infection in HEK293 cells transiently overexpressing GFP or LARP1–GFP proteins. Quantification relative to 18S rRNA and GFP-overexpressing cells is shown. Right: Infectious viral titres in the supernatants of infected cells quantified by plaque assays at 24 h post-infection. P values were determined using an unpaired one-tailed t-test. g, RT–qPCR measurements of intracellular SARS-CoV-2 RNA at 24 h post-infection in LARP1 knockout cells complemented with either GFP or LARP1–GFP plasmids. Quantification relative to 18S rRNA and GFP-transfected WT cells is shown. P values were determined using an unpaired two-tailed t-test. e–g, All values are the mean ± s.d. (n = 3 independent infections) h, Quantification of ribosomal frameshifting efficiency using a dual-fluorescence translation reporter (Extended Data Fig. 4d) in HEK293 cells is shown. Data were normalized to cells transfected with eCFP (n = 6 independent transfections, except for control RNA n = 4). Values are the mean ± s.d. ****P < 0.0001, ***P < 0.001, **P < 0.01, *P < 0.05; NS, not significant; FSE, frameshift element.
Having confirmed the quality of our eCLIP experiment on host RNAs, we next characterized LARP1 binding to SARS-CoV-2 RNAs and found several regions of enrichment that coincided with oligopyrimidine sequences (Fig. 5d). Notably, we observed LARP1 binding to the first 70 nucleotides at the 5′-end of the SARS-CoV-2 genome, which corresponds to the viral 5′-leader sequence77 and contains a TOP-like motif instance (Fig. 5d). Binding to the 5′-leader, which is present in all viral subgenomic mRNAs, suggests a direct association of LARP1 with subgenomic mRNAs.
LARP1 represses SARS-CoV-2 replication
To determine the impact of LARP1 depletion on SARS-CoV-2 replication, we generated four clonal LARP1 knockout cell lines using CRISPR–Cas9 in HEK293 cells (Extended Data Fig. 4a). We infected cells with SARS-CoV-2 and measured intracellular viral RNA levels and the production of infectious virus. Compared to wild-type (WT) cells, LARP1 knockout cells displayed approximately fivefold higher levels of intracellular viral RNA and a similar increase in the production of infectious virus (Fig. 5e). Conversely, transient overexpression of LARP1 fused to green fluorescent protein (GFP) in WT cells led to a significant reduction of viral RNA and infectious virus when compared to GFP expression alone (Fig. 5f and Extended Data Fig. 4b). Next, we complemented LARP1 knockout cells with transiently expressed LARP1–GFP proteins (Fig. 5g, Extended Data Fig. 4c). In all knockout cell lines, we observed a clear reduction in intracellular viral RNA that approached WT levels when compared to cells transfected with GFP alone. These experiments established that LARP1 functions as a repressor of SARS-CoV-2 replication in infected human cells.
RyDEN suppresses ribosomal frameshifting during SARS-CoV-2 RNA translation
LARP1 interacts with PABPC1 and both LARP1 and PABPC1 have been proposed to reside in the same ribonucleoprotein complex with RyDEN54, all of which were enriched in RAP–MS experiments. In addition to being an IFN-induced protein, RyDEN suppresses Dengue virus production in infected cells54 and inhibits programmed -1 ribosomal frameshifting (-1FS) in human immunodeficiency virus type 1 (HIV-1) infections55.
In coronaviruses, production of RdRP requires translation of the ORF1b gene, which is controlled by -1FS. For SARS-CoV-2, it is presently unknown if the efficiency of -1FS is important for the viral life cycle78. To dissect if RyDEN can modulate the frequency of -1FS in SARS-CoV-2, we generated a dual-colour fluorescence reporter system to quantify frameshifting efficiency in response to RyDEN induction, as seen upon SARS-CoV-2 infection (Extended Data Fig. 4d and Methods). Using a reporter containing the HIV-1 frameshift element as a positive control, we confirmed that overexpression of RyDEN fused to enhanced cyan fluorescent protein (eCFP) suppressed -1FS when compared to eCFP expression alone (Fig. 5h). Importantly, overexpression of RyDEN also led to a significant reduction of -1FS during translation of the SARS-CoV-2 frameshift element (Fig. 5h). Together, our results show that RyDEN is induced upon SARS-CoV-2 infection, associates with the SARS-CoV-2 RNA in infected cells and modulates the efficiency of SARS-CoV-2 -1FS.
Pharmacological inhibition of interactome proteins restricts viral replication
Next, we tested if targeting the SARS-CoV-2 RNA interactome and its associated pathways with known inhibitors is effective in restricting viral replication. We selected four inhibitors that target components of our expanded RNA interactome: PPIA; ARP2; ATP1A1; and DDX3X. While DDX3X is a DEAD-box RNA helicase and canonical RNA-binding protein, PPIA, ARP2 and ATP1A1 are non-classical RNA binders that are nonetheless robustly detected among RNA-binding proteins in Huh7 cells36,37,79. In addition to Huh7 cells, we evaluated all inhibitors in Calu3 cells, a human lung epithelial cell line that is naturally susceptible to SARS-CoV-2 infection.
We observed a dose-dependent inhibition of intracellular viral RNA expression accompanied by a reduction in the production of infectious virus for the PPIA inhibitor cyclosporin A (Extended Data Fig. 5a,b), the ARP2/3 complex inhibitor CK-548 and the ATP1A1 inhibitor ouabain (Fig. 6a,b). The observed effect was highly consistent between Calu3 and Huh7 cells (Fig. 6a,b). While CK-548 treatment reduced cell viability at the highest concentration in Huh7 cells, we did not observe such effects at identical concentrations in Calu3 cells. All other efficacious inhibitors had no apparent effect on cell viability (Extended Data Fig. 5c,d). Unlike the three aforementioned compounds, inhibition of DDX3X only led to a moderate reduction of intracellular viral RNA and infectious virus in Calu3 cells at the highest concentration (Fig. 6a,b).

a, Top: RT–qPCR measurements of intracellular SARS-CoV-2 RNA at 24 h post-infection in Calu3 cells after inhibitor treatment. Inhibitors were used at the indicated concentrations (left to right). Values were normalized to 18S rRNA measurements and compared to DMSO-treated cells. Bottom: Infectious viral titres in the supernatants of infected Calu3 cells quantified by plaque assays at 24 h post-infection. b, As in a but for Huh7 cells and at 48 h post-infection. All values are the mean ± s.d. (n = 3 independent infections). P values were determined using an unpaired two-tailed t-test. ***P < 0.001, **P < 0.01, *P < 0.05.
Beyond inhibiting direct RNA binders, we also targeted mTORC1, the upstream regulatory complex that controls LARP1 activity. Consistent with LARP1 restricting SARS-CoV-2 replication, we observed that inhibiting mTORC1/2 resulted in reduced viral replication in Huh7 and Calu3 cells (Fig. 6a,b). These findings agree well with previous results showing that mTORC1 phosphorylates LARP1, which leads to a translational de-repression of LARP1 target mRNAs76. Indeed, recent phosphoproteomic surveys demonstrate that LARP1 undergoes dynamic phosphorylation in response to SARS-CoV-2 infection7,8.
Inhibition of another upstream regulator, TANK-binding kinase 1, which interacts with the SARS-CoV-2 RNA binders DDX3X52 and ANXA1 (ref. 57), increased the levels of viral RNA and infectious virus in A549-ACE2 cells, but did not show a consistent effect in Huh7 or Calu3 cells (Extended Data Fig. 5a,b). Together, our experiments demonstrate that RNA interactome proteins represent viable targets for inhibiting SARS-CoV-2 replication. The SARS-CoV-2 RNA interactome provides valuable starting points for future mechanistic studies and may help developing new antiviral approaches for COVID-19.
Discussion
Decoding how the RNA genomes of pathogenic RNA viruses interface with the host cell proteome has been a long-standing challenge. In this study, we provide detailed molecular insights into the identity of host factors and cellular machinery that directly and specifically bind SARS-CoV-2 RNAs during infection of human cells. We integrate CRISPR perturbation data and perform genetic and pharmacological validation experiments that together suggest functional roles for 18 RNA interactome proteins in SARS-CoV-2 infections.
Beyond identifying proteins that bind SARS-CoV-2 RNAs, we globally mapped where CNBP and LARP1 contact viral and human RNA and report binding preferences that are consistent with previously described regulatory functions of both proteins. While we show that CNBP acts as an antiviral factor, it remains to be determined if its role as a regulator of mRNA translation or its effect on cytokine expression is critical for this function. We provide strong genetic evidence for a functional role of LARP1 in restricting SARS-CoV-2 replication. Remarkably, the SARS-CoV-2 5′-leader contains a TOP-like sequence motif that is bound by LARP1 in infected cells. While the TOP-like sequence is still several nucleotides away from the 5′-end of the SARS-CoV-2 leader, it is tempting to speculate that binding of LARP1 would negatively influence translation of SARS-CoV-2 RNAs similar to LARP1-mediated translational repression of host-encoded 5′TOP mRNAs.
In addition to genetic perturbation, we inhibited SARS-CoV-2 RNA binders pharmacologically. Notably, all host proteins and complexes that are effectively targeted by these inhibitors have previously been linked to viral diseases: (1) PPIA is involved in protein folding and has a well-documented impact on the replication of viruses80,81. Its direct interaction with SARS-CoV-2 RNA expands these previously described functions. While the PPIA inhibitor cyclosporin A has immunosuppressive properties, the non-immunosuppressive cyclosporin A analogue alisporivir may offer greater translational potential82; (2) a role for the RNA-binding metabolic enzyme ATP1A137 in coronavirus and respiratory syncytial virus infections has been reported previously83,84. ATP1A1 had a significant effect on virus-induced cell death in a SARS-CoV-2 CRISPR perturbation screen67. Hence, both genetic and pharmacological evidence point to ATP1A1 as an important SARS-CoV-2 host factor; (3) ARP2 is part of the actin-related protein 2/3 complex and contributes to regulating cell shape and motility, which can affect intracellular pathogens82. ARP2 has been identified as a respiratory syncytial virus host factor and is involved in filopodia formation85. Recent work demonstrated that SARS-CoV-2 infection induced a dramatic increase in filopodia and viral particles localized to these actin-rich protrusions7.
In addition to the aforementioned factors, we observed various other notable proteins among SARS-CoV-2 RNA binders. These include vesicle trafficking proteins (SCFD1, USO1, RAB1A, RAB6D, RAB6A, RAB7A, GDI2), cytoskeleton regulators (ARP2, CFL1, PFN1, ACTA1), RNA editing cofactors (RBM47, A1CF) and subunits of a transfer RNA-splicing ligase complex (DDX1, RTCB).
Our work highlights opportunities for targeting proteins or pathways linked to the SARS-CoV-2 RNA interactome to interfere with viral infection. We believe that our approach provides a general roadmap for dissecting the biology of RNA viruses and the interactions between hosts and pathogens at the molecular level.
Methods
Tissue culture
We maintained Huh7, Calu3, HEK293, ACE2-A549 (a generous gift from A. Pichlmair) and TMPRSS2-Vero E6 cells (a generous gift from S. Pöhlmann) in DMEM medium (Thermo Fisher Scientific) supplemented with 10% heat-inactivated FCS (Thermo Fisher Scientific) and 100 U ml−1 streptomycin and 100 mg ml−1 penicillin. Cells were grown at 37 °C and 5% CO2.
Generation of LARP1 knockout cell lines using CRISPR–Cas9
To generate the LARP1 CRISPR knockout cells, we used the pX335-U6-chimeric-BB-CBh-hSpCas9n(D10A) nickase (a generous gift from F. Zhang) together with GTTGGGTGGCAGTTTACGGGT and GCCACCCAAGAAGGACATGA as guide sequences. HEK293 cells were transfected with TransIT-X2 (Mirus Bio) and selected with 2 µg ml−1 of puromycin in DMEM for 48 h and with 1 µg ml−1 for another 48 h. We picked single colonies and screened for LARP1 deletion by western blotting.
Plasmids for LARP1 overexpression were generated using C-terminal Myc-DDK-tagged human LARP1 (NM_015315), which was purchased from OriGene and subcloned into pEGFP-C1 retaining the C-terminal Myc-DDK tag.
Generation of CNBP knockout cell lines using CRISPR–Cas9
A total of 2.5 × 10⁵ Huh7 cells per well were seeded in a 6-well plate and transfected the next day with 2.5 µg of a commercially available CNBP CRISPR–Cas9 knockout plasmid (catalogue no. sc-404090; Santa Cruz Biotechnology) using 2 µl of Lipofectamine 2000 (Thermo Fisher Scientific) per 1 µg of DNA. A plasmid containing a puromycin resistance gene was cotransfected as the selection marker. Control cells were transfected only with the puromycin resistance plasmid. Successfully transfected cells were selected with puromycin (5 µg ml−1) starting at 24 h post-transfection for 2 d. CNBP expression in polyclonal cell populations was analysed by western blot.
Virus production
We used previously described patient-derived SARS-CoV-2 isolates86,87 propagated on Vero cells. To make high-titre viral stocks, we used TMPRSS2-Vero E6 cells, which were infected at a multiplicity of infection (MOI) of 0.005 plaque-forming units (p.f.u.) per cell for virus propagation. After 1 h of incubation at 37 °C, the inoculum was removed, cells were washed with PBS and OptiMEM (Gibco) containing 1% FCS was added. At 48 h post-infection, the cell culture supernatant was cleared by centrifugation (500g for 5 min) and aliquoted. Viral titres were determined by plaque assay on TMPRSS2-Vero E6 cells and by crystal violet staining.
Virus infections
In general, the virus inoculum was prepared in DMEM containing 5% FCS and 100 U ml−1 of streptomycin and 100 mg ml−1 of penicillin. Cells were washed with PBS and incubated with the inoculum for 1 h at 37 °C. The inoculum was removed and fresh DMEM supplemented with 5% FCS; 100 U ml−1 of streptomycin and 100 mg ml−1 of penicillin were added to the cells.
RAP–MS
RAP–MS was carried out as described previously15 with the following modifications: to capture endogenous SARS-CoV-2 RNAs, we designed and synthesized 5′ biotinylated 90-mer DNA oligonucleotides (Integrated DNA Technologies) antisense to the complementary target RNA sequence. We used 67 probes such that one probe binding site occurred roughly every 400 bases in the approximately 30-kilobase (kb) SARS-CoV-2 genome and excluded regions that matched to human transcripts or genomic regions as described previously88,89. For the SARS-CoV-2 RNA and RMRP antisense purifications, we grew ten 10-cm tissue culture plates of Huh7 cells per replicate. We prepared two replicates for SARS-CoV-2 RNA and RMRP purifications and included two non-crosslinked control samples that were used for RMRP purifications. SARS-CoV-2 infection was carried out with a previously described isolate87 at an MOI of 10 for 24 h. Cells were washed once with PBS and then crosslinked on ice using 0.8 J cm−2 of 254 nm UV light in a GS Gene Linker (Bio-Rad Laboratories). Cells were then lysed on the tissue culture plate by adding 1 ml of RAP lysis buffer (10 mM of Tris pH 7.5, 500 mM of LiCl, 0.5% dodecyl maltoside, 0.2% SDS, 0.1% sodium deoxycholate, EDTA-free protease inhibitor cocktail (Thermo Fisher Scientific) and murine RNase inhibitor (New England Biolabs)). Lysates were then collected and flash-frozen in liquid nitrogen for storage at −80 °C. All subsequent steps were carried out as described previously15.
RAP–MS protein digestion and TMT labelling
RAP-captured proteins were resuspended in 40 μl of 8 M of urea in 50 mM of Tris-HCl, followed by reduction with 4 mM of dithiothreitol (DTT) for 30 min at room temperature and alkylation with 10 mM of iodoacetamide for 45 min at room temperature in the dark. All six samples were then digested with 0.1 μg of Lys-C for 2 h, followed by a reduction of the urea concentration to <2 M and continued digestion with 0.5 μg of trypsin overnight. Reactions were quenched with formic acid at a final concentration of 5% and then desalted by reverse-phase C18 stage tips as described previously90 and dried down. Peptides were then resuspended in 50 μl of 50 mM of HEPES buffer and isobarically labelled using 400 μg of TMT 6-plex (TMT6) isobaric labelling reagent (Thermo Fisher Scientific). The labelling reactions were then quenched with 4 μl of 5% hydroxylamine; samples were mixed together and dried. The sample was fractionated by SCX stage tip strategy using three pH cuts at 5.15, 8.25 and 10.3 as described previously90.
Proteome analyses of SARS-CoV-2-infected cells
For the proteome measurements, we expanded the Huh7 cells to two 10-cm tissue culture plates per replicate. Cells were infected with a previously described SARS-CoV-2 isolate87 at an MOI of 10 and incubated for 24 h before being collected. Three process replicates of infected and non-infected cell line samples were generated. Cells were lysed in 8 M of urea, 75 mM of NaCl, 50 mM of Tris pH 8.0, 1 mM of EDTA, 2 µg ml−1 aprotinin, 10 μg ml−1 of leupeptin, 1 mM of phenylmethylsulfonyl fluoride, 10 mM of NaF, phosphatase inhibitor cocktail 2 (PIC2) (Sigma-Aldrich), PIC3 (Sigma-Aldrich) and 10 mM of sodium butyrate. Benzonase was added to digest nucleic acids and DNA was sheared using a probe sonicator (10% amplitude, 0.7 s on, 2.3 s off, 6 min 15 s total). Cell debris was removed by centrifugation and lysates were flash-frozen for storage. All samples were prepared for MS analysis using an optimized workflow as described previously91. Briefly, lysed samples were reduced, alkylated and digested by LysC for 2 h, followed by overnight digestion with trypsin. Digestions were quenched with formic acid and all peptide samples were desalted using reverse-phase C18 Sep-Pak cartridges. Samples were then quantified using the Pierce bicinchoninic acid protein assay and measured into 500-μg aliquots for isobaric labelling. Peptides were isobarically labelled with TMT6 following the reduced TMT protocol92. After confirming 98% or greater label incorporation, samples were mixed together and desalted. The resulting sample was then fractionated by offline high pH reversed-phase chromatography and concatenated into 24 fractions for analysis using online LC–MS/MS91.
LC–MS/MS analysis (RAP–MS and proteome)
All the samples were analysed either on an Orbitrap Exploris 480 (RAP–MS fractions) or a Q Exactive Plus (proteome fractions) mass spectrometer coupled with an Easy nLC 1200 ultra-high pressure liquid chromatography system (Thermo Fisher Scientific) with solvent A of 0.1% formic acid/3% acetonitrile and solvent B of 0.1% formic acid/90% acetonitrile. One microgram of each of the proteome fractions and half of each of the RAP–MS fractions were injected on a 75-μm ID PicoFrit column packed in-house to approximately 28-cm length with ReproSil-Pur C18-AQ 1.9-μn beads (Dr. Maisch). Samples were separated at a 200 nl min−1 flow rate with a gradient of 2–6% solvent B for 1 min, 6–30% B for 84 min, 30–60% B for 9 min, 60–90% B for 1 min, followed by a hold at 90% B for 5 min. Both mass spectrometers were operated in data-dependent acquisition mode. An Exploris 480 MS1 scan (r = 50,000) was followed by MS2 scans (r = 15,000) for the top 20 most abundant ions using normalized automatic gain control (AGC) of 100% for MS1 and 200% for MS2, MS2 maximum injection time of 150 ms, normalized collision energy of 34 and fit filter of 50%. The Q Exative Plus MS parameters were set as follows: MS1, r = 70,000; MS2, r = 17,500; MS1 AGC target of 3e6; MS2 for the 12 most abundant ions using an AGC target of 5e4 and maximum injection time of 120 ms; and normalized collision energy of 29.
Quantification and identification of peptides and proteins (RAP–MS and proteome)
MS/MS spectra were searched on the Spectrum Mill MS Proteomics Workbench against a Reference Sequence (RefSeq)-based sequence database containing 41,457 proteins mapped to the human reference genome (hg38) obtained via the University of California, Santa Cruz Table Browser (https://genome.ucsc.edu/cgi-bin/hgTables) on 29 June 2018, with the addition of 13 proteins encoded in the human mitochondrial genome, 264 common laboratory contaminant proteins, 553 human non-canonical small ORFs, 28 SARS-CoV-2 proteins obtained from RefSeq derived from the original Wuhan-Hu-1 China isolate (NC_045512.2) (ref. 93) and 23 new unannotated SARS-CoV-2 ORFs whose translation is supported by ribosome profiling94, yielding a total of 42,337 proteins. Among the 28 annotated SARS-CoV-2 proteins, we opted to omit the full-length ORF1ab to simplify peptide-to-protein assignment, and instead represented ORF1a and ORF1ab as the mature 16 individual NSPs that resulted from proteolytic processing of the 1a and 1ab polyprotein. Finally, we added to the database the UniProt entry for ORF9b. We further added the D614G variant of the SARS-CoV-2 spike protein that is commonly observed in European and American virus isolates. Spectrum Mill search parameters included: instrument setting of ESI-QEXACTIVE-HCD-v4-35-20; parent and fragment mass tolerance of 20 parts per million; trypsin allow P enzyme setting; and up to 4 missed cleavages. Carbamidomethylation and TMT labelling at lysine (with and without labelling at the N terminus) were set as fixed modifications, while variable modifications included acetylation of protein N termini, oxidized methionine, deamidation of asparagine and pyroglutamic acid at the peptide N-terminal glutamine. Peptide spectrum match score thresholding was optimized to achieve a target–decoy FDR of 1.2% for the validation of spectra. Peptide-level auto-validation was followed by protein polishing with an FDR of 0% at the protein level and a minimum score of 13.
The Spectrum Mill generated proteome-level export from the RAP–MS and proteome datasets, which were filtered for human proteins identified by two or more distinct peptides, SARS-CoV-2 proteins and unannotated virus ORFs, were used for further statistical analyses. Five of the SARS-CoV-2 NSPs (NSP6, NSP15, NSP16, NSP9 and NSP1) identified by a single, highly scoring distinct peptide were kept in the dataset. Keratins were excluded from the RAP–MS data. Protein quantification was achieved by taking the ratio of TMT reporter ion for each sample/channel over the median of all six channels. A moderated two-sample t-test was applied to compare SARS-CoV-2 RNA and RMRP samples after mean normalization and SARS-CoV-2-infected and non-infected samples after median-median absolute deviation (MAD) normalization of RAP–MS and proteome datasets, respectively. A Benjamini–Hochberg-corrected P value threshold of 0.05 was used to assess significantly regulated proteins in each of the datasets.
Covalent protein capture and sequencing of crosslinked RNA
To capture RNA sequences covalently crosslinked to proteins purified with RAP–MS, we carried out RAP as described above. After our pilot RAP–MS experiment (Extended Data Fig. 1a,b), SARS-CoV-2-bound proteins were eluted from streptavidin beads by heat fragmentation of RNA (3 min at 91 °C in 100 mM of HEPES pH 7.5, 5 mM of MgCl2, 100 mM of KCl, 0.02% Triton X-100). For subsequent RAP–MS experiments, we replaced heat fragmentation with ribonuclease (RNase) H digestion, using 7.5 μl of RNase H (New England Biolabs), 2 μl of TURBO DNase (Thermo Fisher Scientific) in 55.5 μl of RNase H buffer (100 mM of HEPES pH 7.5, 75 mM of NaCl, 3 mM of MgCl2, 0.125% N-lauroylsarcosine (NLS), 0.025% sodium deoxycholate, 2.5 mM of tris(2-carboxyethyl)phosphine (TCEP)) and incubating for 30 min at 37 °C. Following the elution of proteins, supernatants were transferred into new tubes and beads were washed once with RNase H buffer. Wash fractions were pooled with eluates and stored on ice. The next steps were described previously in similar form by Quinodoz et al.95. We separated 100 μl of NHS magnetic beads (Thermo Fischer Scientific) on a magnet and discarded the supernatant. We then washed them with 1 ml of 1 mM of ice-cold HCl, followed by a quick rinse in 1 ml of ice-cold PBS. After removing the PBS, we immediately added the stored eluates to the prepared beads. Binding was carried out overnight at 4 °C on a rotating wheel. The next day, we quenched the NHS beads by adding 1 ml of 0.5 M Tris pH 8.0 and incubating for 1 h at 4 °C. We then washed the beads 4 times in 1 ml of modified RLT buffer (RLT buffer supplied by QIAGEN with added 10 mM of Tris pH 7.5, 1 mM of EDTA, 1 mM of EGTA, 0.2% NLS, 0.1% Triton X-100 and 0.1% NP-40). Next, we washed the beads twice more in 1 ml of 1× PBS, 5 mM of EDTA, 5 mM of EGTA, 5 mM of DTT, 0.2% Triton X-100, 0.2% NP-40, 0.2% sodium deoxycholate and incubated each washing step for 5 min at 55 °C. These heated washing steps were followed by two additional washes in the same buffer at room temperature. Subsequently, beads were rinsed on the magnet in 1× FastAP buffer (10 mM of Tris pH 7.5, 5 mM of MgCl2, 100 mM of KCl, 0.02% Triton X-100). Next, end repair was carried out by resuspending the beads in 50 μl of FastAP mix (39 μl of H2O, 5 μl of 10× FastAP buffer (Thermo Fisher Scientific), 1 μl of murine RNase inhibitor, 5 μl of FastAP enzyme (Thermo Fisher Scientific) and incubating for 20 min at 37 °C. In the meantime, we prepared 150 μl of T4 polynucleotide kinase (PNK) mix (120 μl of H2O, 20 μl of 10× T4 PNK buffer (New England Biolabs), 1 μl of murine RNase inhibitor, 7 μl of T4 PNK, 1 μl of TURBO DNase), which was added to the FastAP reaction and incubated for another 20 min at 37 °C. After end repair, we washed the beads once in modified RLT buffer and twice in detergent wash buffer (20 mM of Tris pH 7.5, 50 mM of NaCl, 0.2% Triton X-100, 0.2% NP-40, 0.2% sodium deoxycholate). We then rinsed the beads on the magnet twice with 1× T4 RNA ligase buffer (50 mM of Tris-HCl pH 7.5, 10 mM of MgCl2), before resuspending the beads in 25 μl of RNA ligation mix (9 μl of H2O, 3 μl of 10× T4 RNA ligase buffer (New England Biolabs), 0.3 μl of 0.1 M of ATP, 0.8 μl of dimethylsulfoxide (DMSO), 0.4 μl of murine RNase inhibitor, 9 μl of polyethylene glycol 8000 and 2.5 μl of T4 RNA ligase I High Concentration (New England Biolabs). Next, we added 5 μl of 20 nM of RiL19 (/5phos/rArGrArUrCrGrGrArArGrArGrCrGrUrCrGrUrG/3SpC3/; Integrated DNA Technologies) and incubated the samples for 75 min at 23 °C. After 3′-ligation, we washed the beads once in 1 ml of modified RLT buffer, followed by two washes in detergent wash buffer. Next, we resuspended the beads in 250 μl of proteinase K (New England Biolabs) mix containing 200 μl of NLS RNA elution buffer (20 mM of Tris pH 8.0, 10 mM of EDTA, 2% NLS, 2.5 mM of TCEP), 12.5 μl of 5 M of NaCl, 1 μl of 500 mM of TCEP, 12.5 μl of proteinase K and 24 μl of H2O and incubated the samples for 1.5 h at 55 °C. After proteinase K digestion, we separated beads on a magnet, transferred the supernatant into a new tube and extracted RNA using phenol-chloroform extraction. All subsequent manipulation steps were carried out as described in the eCLIP library preparation protocol71, starting with the reverse transcription of recovered RNA fragments.
eCLIP
For the eCLIP experiments, we grew approximately 24 × 106 Huh7 cells and infected them with SARS-CoV-2 at an MOI of 5 PFU per cell; 24 h after infection, culture medium was removed, cells were briefly rinsed with PBS and subjected to UV irradiation with a total dose of 0.8 J cm−2. Cells were scraped in PBS using a flexible rubber scraper, pelleted at 200g for 5 min and lysed by adding 2× CLIP lysis buffer (100 mM of Tris-HCl pH 7.4, 300 mM of NaCl, 2 mM of EDTA, 2% (v/v) NP40, 1% sodium deoxycholate, 0.5 mM of DTT). After a 30-min incubation at room temperature, lysates were stored at −80 °C.
Frozen lysates were combined with an equal amount of nuclease-free water to adjust the lysis buffer to a 1× concentration. Subsequent steps were performed as described in the eCLIP protocol71 with the following modifications. Immunoprecipitates were washed twice in 1 ml of CLIP lysis buffer, twice in immunoprecipitation wash buffer (50 mM of Tris-HCl pH 7.4, 300 mM of NaCl, 1 mM of EDTA, 1% (v/v) NP40, 0.5% sodium deoxycholate, 0.25 mM of DTT), followed by two washes in 50 mM of Tris-HCl pH 7.4, 1 mM of EDTA and 0.5% (v/v) NP40. All other steps were carried out as described in the eCLIP method71. We used the following antibodies for the immunoprecipitation reactions: CNBP antibody (catalogue no. 67109-1-Ig; Proteintech) and LARP1 (catalogue no. A302-087A; Bethyl Laboratories).
Inhibitor treatment and infection
A total of 1 × 10⁵ Huh7 or A549-ACE2 cells or 3 × 10⁵ Calu3 cells were seeded per well of a 24-well plate. After 24 h (for Huh7 and A549-ACE2 cells) or 48 h (for Calu3 cells), the growth medium was replaced by DMEM with 5% FCS containing cyclosporin A (catalogue no. SML1018; Sigma-Aldrich), BX-795 hydrochloride (catalogue no. SML0694; Sigma-Aldrich), Ouabain octahydrate (catalogue no. O3125; Sigma-Aldrich), CK-548 (catalogue no. ALX-270-504-M002; Enzo Life Sciences), sapanisertib (catalogue no. HY-13328; Hölzel Diagnostika) or RK-33 (catalogue no. TMO-T6970; Hölzel Diagnostika) at the indicated concentrations (Fig. 6) 2 h before infection. Cells were infected with SARS-CoV-2 at an MOI of 0.5 PFU per cell (Huh7 and A549-ACE2 cells) or an MOI of 0.1 PFU per cell (Calu3 cells). After incubating the cells for 1 h with the virus inoculum, the medium was replaced with inhibitor-containing DMEM with 5% FCS. At the indicated time points post-infection, the supernatants were collected for plaque assay analyses and cells were lysed for quantitative PCR with reverse transcription (RT–qPCR) analyses.
Infection of Huh7 CNBP knockout cells
A total of 1 × 10⁵ cells were seeded per well of a 24-well plate. The next day, cells were infected with SARS-CoV-2 at an MOI of 0.5 PFU per cell as described above. At the indicated time points post-infection, supernatants were collected for plaque assay analyses and cells were lysed for RT–qPCR analyses.
Infection of HEK293 LARP1 knockout cells
A total of 1.5 × 10⁵cells were seeded per well of a poly-L-lysine-coated 24-well plate. For the rescue experiments, cells were transfected the next day with 500 ng per well LARP1-GFP overexpression plasmid or pEGFP-C1 as the control using 3 µl of TransIT-X2 transfection reagent per 1 µg of DNA. At 24 h post-transfection, cells were infected with SARS-CoV-2 at an MOI of 0.5 PFU per cell as described above. At the indicated time points post-infection, supernatants were collected for the plaque assay analyses and cells were lysed for the RT–qPCR analyses.
RNA extraction and RT–qPCR
Cells were lysed in 300 µl of TRIzol per well and RNA was extracted using the Direct-zol RNA Microprep Kit (Zymo Research). RNA was reverse-transcribed into complementary DNA using the AffinityScript Multiple Temperature Reverse Transcriptase system (Agilent Technologies) according to the manufacturer’s instructions. Viral RNA was quantified by qPCR using the PowerUp SYBR Green Master Mix (Thermo Fisher Scientific) and primers specific to the SARS-CoV-2 RdRP gene (forward: GTGARATGGTCATGTGTGGCGG, reverse: CARATGTTAAASACACTATTAGCATA) and 18S ribosomal RNA (forward: ATGGCCGTTCTTAGTTGGTG, reverse: GAACGCCACTTGTCCCTCTA). We calculated the differences in RNA expression using the \(\Delta\Delta^{C_T}\) method versus 18S. To achieve power to detect small effects in gene expression, we performed four technical qPCR replicates from the same cDNA and took the median value for further analysis.
Western blot
In general, we added NuPAGE LDS Sample Buffer (Thermo Fisher Scientific) to a 1× concentration and incubated samples for 3 min at 95 °C. Proteins were resolved by SDS–polyacrylamide gel electrophoresis using NuPAGE 4 to 12% Bis-Tris-HCl Gels (Thermo Fisher Scientific) at 200 V for 1 h, followed by transfer to a nitrocellulose membrane using the iBlot dry blotting system (Thermo Fisher Scientific). Western blots were performed using the iBind Automated Western System (Thermo Fisher Scientific). For protein detection, we used the following primary antibodies: nucleocapsid protein (catalogue no. ab272852; Abcam); POP1 (catalogue no. 12029-1-AP; Proteintech); LARP1; CNBP; α-Tubulin (catalogue no. 2144; Cell Signaling Technology); β-Actin (catalogue no. sc-47778; Santa Cruz Biotechnology). We used the following secondary antibodies: IRDye 800CW goat anti-rabbit IgG (LI-COR); IRDye 800CW goat anti-mouse IgG (LI-COR). For the visualization of bands, we used the Odyssey Clx Infrared Imager System (LI-COR).
Plaque assay
TMPRSS2-Vero E6 cells were infected with 10-fold serial dilutions of the virus-containing sample in DMEM with 1% FCS. After a 1-h incubation, the inoculum was removed and cells were overlayed with 0.6% (w/v) methylcellulose (Carl Roth) in MEM (Gibco) supplemented with 25 mM of HEPES, 0.44% NaHCO3, 2 mM of GlutaMAX (Gibco), 100 U ml−1 of streptomycin, 100 mg ml−1 of penicillin and 5% FCS. At 4 d post-infection, cells were fixed and stained by adding 2× staining solution (0.23% crystal violet, 8% formaldehyde, 10% ethanol) directly to the medium for 2 h. Cells were washed with H20 and plaques were counted to determine viral titres.
Cell viability assay
For the cell viability assays, cells were seeded in 96-well plates (2 × 10⁴ cells per well for Huh7 and A549-ACE2 cells, 6 × 10⁴ cells per well for Calu3 cells) and treated with inhibitors as described for the infection assays. After 24 h (Calu3 cells) or 48 h (Huh7 and A549-ACE2 cells) of treatment, cell viability was assessed using the CellTiter-Glo reagent (Promega Corporation) according to the manufacturer’s instructions.
Quantification of ribosomal frameshifting
HEK293 cells were transiently transfected with either the control or frameshifting construct of our dual-colour enhanced GFP (eGFP)–mCherry translation reporter outlined in Extended Data Fig. 4d. Briefly, cells transfected with this reporter express a single fluorescent protein (eGFP) when the 0 reading frame is translated (Extended Data Fig. 4d). Expression of a second fluorescent protein (mCherry) downstream of eGFP is dependent on -1FS, which prevents translation of an inframe stop codon. Thus, the ratio between mCherry and eGFP directly correlates to -1FS efficiency. As a normalization control, we used a construct lacking a stop codon in the 0 reading frame, leading to the expression of eGFP and mCherry in equal ratios.
RyDEN was expressed as fusion protein with eCFP. In the control experiments, a plasmid only carrying eCFP was used. Using flow cytometry (Novocyte Quanteon), eCFP+ cells were analysed for the ratio between mCherry and eGFP, providing a direct readout of ribosomal frameshifting efficiency. Accordingly, frameshifting efficiency was calculated using the ratio of mCherry to eGFP observed with the frameshifting reporter construct relative to the mCherry/eGFP ratio observed with the control construct (Extended Data Fig. 4d).
Computational analyses
Protein–protein interaction network
To establish protein–protein interactions for the proteins identified from the MS experiments, we utilized STRING v.11 (ref. 96). For all network and interaction inferences, we used the ‘combined score’ from STRING, which utilizes both physical and functional interactions. Specifically, for the RAP–MS network (Fig. 2), we seeded all proteins detected with an adjusted P < 0.2 and positive log fold change from the moderated t-test between SARS-CoV-2 RNA and RMRP purifications. The edges between interacting proteins were included for those above a combined interaction score of 550. To generate the combined RAP–MS and proteome MS network, we seeded nodes where the adjusted P < 0.05 for either of the assays. Edges between RAP–MS and proteome MS nodes were included for combined interaction scores exceeding 700.
Gene set and pathway enrichment analysis
First, we performed a hypergeometric GO enrichment analysis for the expanded SARS-CoV-2 RNA interactome proteins using the DAVID tool (v.6.8, https://david.ncifcrf.gov/tools.jsp) and applying default settings (Fig. 2b). Additionally, we performed GSEA for the proteome experiments with the clusterProfiler R package (v.3.18)97 utilizing the Hallmark and C5 biological processes gene sets available through Molecular Signatures Database (v.7.2)98 (Fig. 3b). Genes were ranked based on the product of the log2 fold change and the log10 moderated t-test P value between SARS-CoV-2 and mock treatments. To establish enriched terms for communities within the interactome network (Fig. 3c), we considered all regulated genes in the proteome measurements interacting with a specific direct binder and computed enrichments using the C5 biological processes gene sets.
eCLIP and RNA sequencing analysis
Paired-end sequencing reads from (1) eCLIP experiments or (2) sequencing of crosslinked RNA fragments after RAP–MS, were trimmed using a custom Python script that simultaneously identified the unique molecular identifier associated with each read. These trimmed reads were then aligned to the SARS-CoV-2 reference genome (NC_045512.2 contig) using the Burrows–Wheeler Aligner (v.0.7.17)99. Next, we removed PCR duplicates using the unique molecular identifier-aware deduplication functionality in Picard’s MarkDuplicates (v.2.22.0). Finally, enriched regions of protein binding were identified using model-based analysis of ChIP–seq 2 (MACS2 v.2.2.7)100 to model the fold change between per-million fragment normalized counts (signal per million mapped reads) of the treated and control samples. Visualizations of the region were rendered from the PCR-deduplicated .bam files using the Integrative Genomics Viewer. CLIP peak annotations and overlaps were determined using custom functions and the GenomicRanges package (v.1.40.0)101. Meta-gene enrichment plots were computed using deepTools (v.3.4.3)102. To establish the binding motif of the LARP1 CLIP peaks, we performed a de novo motif enrichment using MEME (v.5.2).103 via a strand-aware sequence enrichment for peaks that overlapped a single 5′-UTR in our hg38 reference.
Reporting Summary
Further information on research design is available in the Nature Research Reporting Summary linked to this article.
Data availability
The original mass spectra for all experiments and the protein sequence databases used for the searches have been deposited with the MassIVE repository (https://massive.ucsd.edu) and can be accessed at ftp://massive.ucsd.edu/MSV000085734/.
The high-throughput sequencing data have been deposited with the Gene Expression Omnibus under the accession no. GSE154430. Source data are provided with this paper.
Code availability
The computer code for the custom analyses is publicly available at https://munschauerlab.github.io/SCoV2-proteome-atlas/.
References
Guan, W.-J. et al. Clinical characteristics of coronavirus disease 2019 in China. N. Engl. J. Med. 382, 1708–1720 (2020).
Tay, M. Z., Poh, C. M., Rénia, L., MacAry, P. A. & Ng, L. F. P. The trinity of COVID-19: immunity, inflammation and intervention. Nat. Rev. Immunol. 20, 363–374 (2020).
Sola, I., Almazán, F., Zúñiga, S. & Enjuanes, L. Continuous and discontinuous RNA synthesis in coronaviruses. Ann. Rev. Virol. 2, 265–288 (2015).
Chan, Y. K. & Gack, M. U. Viral evasion of intracellular DNA and RNA sensing. Nat. Rev. Microbiol. 14, 360–373 (2016).
Blanco-Melo, D. et al. Imbalanced host response to SARS-CoV-2 drives development of COVID-19. Cell 181, 1036–1045 (2020).
Emanuel, W. et al. Bulk and single-cell gene expression profiling of SARS-CoV-2 infected human cell lines identifies molecular targets for therapeutic intervention. Preprint at bioRxiv https://www.biorxiv.org/content/10.1101/2020.05.05.079194v1 (2020).
Bouhaddou, M. et al. The global phosphorylation landscape of SARS-CoV-2 infection. Cell 182, 685–712 (2020).
Klann, K. et al. Growth factor receptor signaling inhibition prevents SARS-CoV-2 replication. Mol. Cell 80, 164–174 (2020).
Bojkova, D. et al. Proteomics of SARS-CoV-2-infected host cells reveals therapy targets. Nature 583, 469–472 (2020).
Gordon, D. E. et al. A SARS-CoV-2 protein interaction map reveals targets for drug repurposing. Nature 583, 459–468 (2020).
Gordon, D. E. et al. Comparative host–coronavirus protein interaction networks reveal pan-viral disease mechanisms. Science 370, eabe9403 (2020).
Eckhardt, M., Hultquist, J. F., Kaake, R. M., Hüttenhain, R. & Krogan, N. J. A systems approach to infectious disease. Nat. Rev. Genet. 21, 339–354 (2020).
Maranon, D. G., Anderson, J. R., Maranon, A. G. & Wilusz, J. The interface between coronaviruses and host cell RNA biology: novel potential insights for future therapeutic intervention. Wiley Interdiscip. Rev. RNA 11, e1614 (2020).
McHugh, C. A. et al. The Xist lncRNA interacts directly with SHARP to silence transcription through HDAC3. Nature 521, 232–236 (2015).
Munschauer, M. et al. The NORAD lncRNA assembles a topoisomerase complex critical for genome stability. Nature 561, 132–136 (2018).
Chu, C. et al. Systematic discovery of Xist RNA binding proteins. Cell 161, 404–416 (2015).
Minajigi, A. et al. A comprehensive Xist interactome reveals cohesin repulsion and an RNA-directed chromosome conformation. Science 349, aab2276 (2015).
Ramanathan, M., Porter, D. F. & Khavari, P. A. Methods to study RNA–protein interactions. Nat. Methods 16, 225–234 (2019).
Lee, F. C. Y. & Ule, J. Advances in CLIP technologies for studies of protein–RNA interactions. Mol. Cell 69, 354–369 (2018).
Nie, Y. et al. Highly infectious SARS-CoV pseudotyped virus reveals the cell tropism and its correlation with receptor expression. Biochem. Biophys. Res. Commun. 321, 994–1000 (2004).
Harcourt, J. et al. Severe acute respiratory syndrome coronavirus 2 from patient with coronavirus disease, United States. Emerg. Infect. Dis. 26, 1266–1273 (2020).
Wang, Y. et al. SARS-CoV-2 infection of the liver directly contributes to hepatic impairment in patients with COVID-19. J. Hepatol. 73, 807–816 (2020).
Perederina, A. et al. Cryo-EM structure of catalytic ribonucleoprotein complex RNase MRP. Nat. Commun. 11, 3474 (2020).
Snijder, E. J., Decroly, E. & Ziebuhr, J. The nonstructural proteins directing coronavirus RNA synthesis and processing. Adv. Virus Res. 96, 59–126 (2016).
Kim, Y. et al. Crystal structure of Nsp15 endoribonuclease NendoU from SARS-CoV-2. Protein Sci. 29, 1596–1605 (2020).
Hillen, H. S. et al. Structure of replicating SARS-CoV-2 polymerase. Nature 584, 154–156 (2020).
Viswanathan, T. et al. Structural basis of RNA cap modification by SARS-CoV-2. Nat. Commun. 11, 3718 (2020).
Sutton, G. et al. The nsp9 replicase protein of SARS-coronavirus, structure and functional insights. Structure 12, 341–353 (2004).
Tanaka, T., Kamitani, W., DeDiego, M. L., Enjuanes, L. & Matsuura, Y. Severe acute respiratory syndrome coronavirus nsp1 facilitates efficient propagation in cells through a specific translational shutoff of host mRNA. J. Virol. 86, 11128–11137 (2012).
Neuman, B. W. et al. Proteomics analysis unravels the functional repertoire of coronavirus nonstructural protein 3. J. Virol. 82, 5279–5294 (2008).
Angelini, M. M., Akhlaghpour, M., Neuman, B. W. & Buchmeier, M. J. Severe acute respiratory syndrome coronavirus nonstructural proteins 3, 4, and 6 induce double-membrane vesicles. mBio 4, e00524-13 (2013).
Wolff, G. et al. A molecular pore spans the double membrane of the coronavirus replication organelle. Science 369, 1395–1398 (2020).
Sharma, K. et al. The 3a accessory protein of SARS coronavirus specifically interacts with the 5′UTR of its genomic RNA, using a unique 75 amino acid interaction domain. Biochemistry 46, 6488–6499 (2007).
Masters, P. S. Coronavirus genomic RNA packaging. Virology 537, 198–207 (2019).
Shang, J. et al. Cell entry mechanisms of SARS-CoV-2. Proc. Natl Acad. Sci. USA 117, 11727–11734 (2020).
Caudron-Herger, M. & Jansen, R. E. & Wassmer, E. & Diederichs, S. RBP2GO: a comprehensive pan-species database on RNA-binding proteins, their interactions and functions. Nucleic Acids Res. https://doi.org/10.1093/nar/gkaa1040 (2020).
Beckmann, B. M. et al. The RNA-binding proteomes from yeast to man harbour conserved enigmRBPs. Nat. Commun. 6, 10127 (2015).
Ooi, Y. S. et al. An RNA-centric dissection of host complexes controlling flavivirus infection. Nat. Microbiol. 4, 2369–2382 (2019).
V’kovski, P. et al. Determination of host proteins composing the microenvironment of coronavirus replicase complexes by proximity-labeling. eLife 8, e42037 (2019).
Miller, S. & Krijnse-Locker, J. Modification of intracellular membrane structures for virus replication. Nat. Rev. Microbiol. 6, 363–374 (2008).
Wada, M., Lokugamage, K. G., Nakagawa, K., Narayanan, K. & Makino, S. Interplay between coronavirus, a cytoplasmic RNA virus, and nonsense-mediated mRNA decay pathway. Proc. Natl Acad. Sci. USA 115, E10157–E10166 (2018).
Ramírez-Valle, F., Braunstein, S., Zavadil, J., Formenti, S. C. & Schneider, R. J. eIF4GI links nutrient sensing by mTOR to cell proliferation and inhibition of autophagy. J. Cell Biol. 181, 293–307 (2008).
Shahbazian, D. et al. The mTOR/PI3K and MAPK pathways converge on eIF4B to control its phosphorylation and activity. EMBO J. 25, 2781–2791 (2006).
Cotto, K. C. et al. DGIdb 3.0: a redesign and expansion of the drug–gene interaction database. Nucleic Acids Res. 46, D1068–D1073 (2018).
Narita, R. et al. A novel function of human Pumilio proteins in cytoplasmic sensing of viral infection. PLoS Pathog. 10, e1004417 (2014).
Takeuchi, A. et al. YB-1 suppression induces STAT3 proteolysis and sensitizes renal cancer to interferon-α. Cancer Immunol. Immunother. 62, 517–527 (2013).
Arif, A., Chatterjee, P., Moodt, R. A. & Fox, P. L. Heterotrimeric GAIT complex drives transcript-selective translation inhibition in murine macrophages. Mol. Cell. Biol. 32, 5046–5055 (2012).
Alam, U. & Kennedy, D. G3BP1 and G3BP2 regulate translation of interferon-stimulated genes: IFITM1, IFITM2 and IFITM3 in the cancer cell line MCF7. Mol. Cell. Biochem. 459, 189–204 (2019).
Bidet, K., Dadlani, D. & Garcia-Blanco, M. A. G3BP1, G3BP2 and CAPRIN1 are required for translation of interferon stimulated mRNAs and are targeted by a dengue virus non-coding RNA. PLoS Pathog. 10, e1004242 (2014).
Kroczynska, B. et al. Interferon-dependent engagement of eukaryotic initiation factor 4B via S6 kinase (S6K)- and ribosomal protein S6K-mediated signals. Mol. Cell. Biol. 29, 2865–2875 (2009).
Cuevas, R. A. et al. MOV10 provides antiviral activity against RNA viruses by enhancing RIG-I-MAVS-independent IFN induction. J. Immunol. 196, 3877–3886 (2016).
Soulat, D. et al. The DEAD-box helicase DDX3X is a critical component of the TANK-binding kinase 1-dependent innate immune response. EMBO J. 27, 2135–2146 (2008).
Li, Y. et al. LSm14A is a processing body-associated sensor of viral nucleic acids that initiates cellular antiviral response in the early phase of viral infection. Proc. Natl Acad. Sci. USA 109, 11770–11775 (2012).
Suzuki, Y. et al. Characterization of RyDEN (C19orf66) as an interferon-stimulated cellular inhibitor against Dengue virus replication. PLoS Pathog. 12, e1005357 (2016).
Wang, X. et al. Regulation of HIV-1 Gag-Pol expression by Shiftless, an inhibitor of programmed-1 ribosomal frameshifting. Cell 176, 625–635 (2019).
Huh, H. D., Lee, E., Shin, J., Park, B. & Lee, S. STRAP positively regulates TLR3-triggered signaling pathway. Cell Immunol. 318, 55–60 (2017).
Bist, P. et al. Annexin-A1 regulates TLR-mediated IFN-β production through an interaction with TANK-binding kinase 1. J. Immunol. 191, 4375–4382 (2013).
Zhou, Y. et al. Cellular RNA helicase DDX1 is involved in transmissible gastroenteritis virus nsp14-induced interferon-beta production. Front. Immunol. 8, 940 (2017).
Xin, Z. et al. PCBP2 enhances the antiviral activity of IFN-α against HCV by stabilizing the mRNA of STAT1 and STAT2. PLoS ONE 6, e25419 (2011).
Wang, L., Wen, M. & Cao, X. Nuclear hnRNPA2B1 initiates and amplifies the innate immune response to DNA viruses. Science 365, eaav0758 (2019).
Han, X., Han, Y., Jiao, H. & Jie, Y. 14-3-3ζ regulates immune response through Stat3 signaling in oral squamous cell carcinoma. Mol. Cells 38, 112–121 (2015).
Moore, M. J. From birth to death: the complex lives of eukaryotic mRNAs. Science 309, 1514–1518 (2005).
Díaz-Muñoz, M. D. & Turner, M. Uncovering the role of RNA-binding proteins in gene expression in the immune system. Front. Immunol. 9, 1094 (2018).
Garcia-Moreno, M., Järvelin, A. I. & Castello, A. Unconventional RNA-binding proteins step into the virus–host battlefront. Wiley Interdiscip. Rev. RNA 9, e1498 (2018).
Schulte-Schrepping, J. et al. Severe COVID-19 is marked by a dysregulated myeloid cell compartment. Cell 182, 1419–1440 (2020).
Banerjee, A. K. et al. SARS-CoV-2 disrupts splicing, translation, and protein trafficking to suppress host defenses. Cell 183, 1325–1339 (2020).
Wei, J. et al. Genome-wide CRISPR screens reveal host factors critical for SARS-CoV-2 infection. Cell https://doi.org/10.1016/j.cell.2020.10.028 (2020).
Hoffmann, H.-H. et al. Functional interrogation of a SARS-CoV-2 host protein interactome identifies unique and shared coronavirus host factors. Preprint at bioRxiv https://www.biorxiv.org/content/10.1101/2020.09.11.291716v1 (2020).
Chen, Y. et al. CNBP controls IL-12 gene transcription and Th1 immunity. J. Exp. Med. 215, 3136–3150 (2018).
Lee, E. et al. CNBP acts as a key transcriptional regulator of sustained expression of interleukin-6. Nucleic Acids Res. 45, 3280–3296 (2017).
Van Nostrand, E. L. et al. Robust transcriptome-wide discovery of RNA-binding protein binding sites with enhanced CLIP (eCLIP). Nat. Methods 13, 508–514 (2016).
Benhalevy, D. et al. The Human CCHC-type zinc finger nucleic acid-binding protein binds G-rich elements in target mRNA coding sequences and promotes translation. Cell Rep. 18, 2979–2990 (2017).
Hong, S. et al. LARP1 functions as a molecular switch for mTORC1-mediated translation of an essential class of mRNAs. eLife 6, e25237 (2017).
Fonseca, B. D. et al. La-related protein 1 (LARP1) represses terminal oligopyrimidine (TOP) mRNA translation downstream of mTOR complex 1 (mTORC1). J. Biol. Chem. 290, 15996–16020 (2015).
Lahr, R. M. et al. La-related protein 1 (LARP1) binds the mRNA cap, blocking eIF4F assembly on TOP mRNAs. eLife 6, e24146 (2017).
Philippe, L., van den Elzen, A. M. G., Watson, M. J. & Thoreen, C. C. Global analysis of LARP1 translation targets reveals tunable and dynamic features of 5′ TOP motifs. Proc. Natl Acad. Sci. USA 117, 5319–5328 (2020).
Kim, D. et al. The architecture of SARS-CoV-2 transcriptome. Cell 181, 914–921 (2020).
Plant, E. P. & Dinman, J. D. The role of programmed-1 ribosomal frameshifting in coronavirus propagation. Front. Biosci. 13, 4873–4881 (2008).
Backlund, M. et al. Plasticity of nuclear and cytoplasmic stress responses of RNA-binding proteins. Nucleic Acids Res. 48, 4725–4740 (2020).
Zhou, D., Mei, Q., Li, J. & He, H. Cyclophilin A and viral infections. Biochem. Biophys. Res. Commun. 424, 647–650 (2012).
Pfefferle, S. et al. The SARS-coronavirus-host interactome: identification of cyclophilins as target for pan-coronavirus inhibitors. PLoS Pathog. 7, e1002331 (2011).
Pawlotsky, J. M. COVID-19 pandemic: time to revive the cyclophilin inhibitor alisporivir. Clin. Infect. Dis. 71, 2191–2194 (2020).
Lingemann, M. et al. The alpha-1 subunit of the Na+,K+-ATPase (ATP1A1) is required for macropinocytic entry of respiratory syncytial virus (RSV) in human respiratory epithelial cells. PLoS Pathog. 15, e1007963 (2019).
Burkard, C. et al. ATP1A1-mediated Src signaling inhibits coronavirus entry into host cells. J. Virol. 89, 4434–4448 (2015).
Mehedi, M. et al. Actin-related protein 2 (ARP2) and virus-induced filopodia facilitate human respiratory syncytial virus spread. PLoS Pathog. 12, e1006062 (2016).
Peterhoff, D. et al. A highly specific and sensitive serological assay detects SARS-CoV-2 antibody levels in COVID-19 patients that correlate with neutralization. Infection https://doi.org/10.1007/s15010-020-01503-7 (2020).
Zimniak, M., Kirschner, L., Hilpert, H., Seibel, J. & Bodem, J. The serotonin reuptake inhibitor fluoxetine inhibits SARS-CoV-2. Preprint at bioRxiv https://www.biorxiv.org/content/10.1101/2020.06.14.150490v2 (2020).
Engreitz, J. M. et al. RNA-RNA interactions enable specific targeting of noncoding RNAs to nascent pre-mRNAs and chromatin sites. Cell 159, 188–199 (2014).
Engreitz, J. M. et al. The Xist lncRNA exploits three-dimensional genome architecture to spread across the X chromosome. Science 341, 1237973 (2013).
Li, J. et al. Cell-surface proteomic profiling in the fly brain uncovers wiring regulators. Cell 180, 373–386 (2020).
Mertins, P. et al. Reproducible workflow for multiplexed deep-scale proteome and phosphoproteome analysis of tumor tissues by liquid chromatography–mass spectrometry. Nat. Protoc. 13, 1632–1661 (2018).
Zecha, J. et al. TMT labeling for the masses: a robust and cost-efficient, in-solution labeling approach. Mol. Cell. Proteomics 18, 1468–1478 (2019).
Wu, F. et al. A new coronavirus associated with human respiratory disease in China. Nature 579, 265–269 (2020).
Finkel, Y. et al. The coding capacity of SARS-CoV-2. Nature https://doi.org/10.1038/s41586-020-2739-1 (2020).
Quinodoz, S. A. et al. Higher-order inter-chromosomal hubs shape 3D genome organization in the nucleus. Cell 174, 744–757 (2018).
Szklarczyk, D. et al. STRING v11: protein–protein association networks with increased coverage, supporting functional discovery in genome-wide experimental datasets. Nucleic Acids Res. 47, D607–D613 (2019).
Yu, G., Wang, L.-G., Han, Y. & He, Q.-Y. clusterProfiler: an R package for comparing biological themes among gene clusters. OMICS 16, 284–287 (2012).
Liberzon, A. et al. Molecular signatures database (MSigDB) 3.0. Bioinformatics 27, 1739–1740 (2011).
Li, H. & Durbin, R. Fast and accurate short read alignment with Burrows–Wheeler transform. Bioinformatics 25, 1754–1760 (2009).
Zhang, Y. et al. Model-based analysis of ChIP–Seq (MACS). Genome Biol. 9, R137 (2008).
Lawrence, M. et al. Software for computing and annotating genomic ranges. PLoS Comput. Biol. 9, e1003118 (2013).
Ramírez, F., Dündar, F., Diehl, S., Grüning, B. A. & Manke, T. deepTools: a flexible platform for exploring deep-sequencing data. Nucleic Acids Res. 42, W187–W191 (2014).
Bailey, T. L. et al. MEME SUITE: tools for motif discovery and searching. Nucleic Acids Res. 37, W202–W208 (2009).
Acknowledgements
We thank C. Krempl for help with virus work, S. Pöhlmann for sharing the Vero-E6-TMPRSS2 cells, A. Pichlmair for sharing the A549-ACE2 cells, D. R. Mani for help with statistical analysis, F. Imdahl for help with cell sorting, the Core Unit Systems Medicine in Würzburg for sequencing, K. Clauser for help with the mass spectrometry database and data searches, S. Juranek and K. Paeschke for discussions and sharing cell lines, C. Vockley, R. Smyth, A. E. Saliba, L. Barquist, V. Subramanian, S. Myers and the Munschauer group for helpful discussions and critical comments on the manuscript, and L. Gaffney for help with the artwork. Work in the Fischer laboratory is supported by German Research Foundation grant nos. Fi-573/15-2 and 12-1. This work was supported by the Helmholtz Young Investigator Group program (M.M.), the Bavarian FOR-COVID Research Network (M.M. and J.V.), the Bavarian Ministry of Economic Affairs, Regional Development and Energy (allocation no. 0703/68674/6/20 20), and the Bavarian State Ministry of Science and the Arts (allocation no.1528 20012).
Author information
Authors and Affiliations
Contributions
M.M. conceived, designed and supervised the study. J.B. supervised the virus work and performed the infection experiments with assistance from L.K. N.S. performed most of the experiments, analysed the data and provided analytical ideas. C.A.L. performed all computational analyses and developed the analytical concepts and ideas. S.A.C. and H.K. supervised the mass spectrometry work executed by R.M., helped with experimental design and performed the data analyses. S.G. performed the CLIP experiments. C.S. generated the knockout cell lines under the supervision of U.F. and provided analytical ideas. T.H. established the protocols, helped with the infection experiments and generated the cell lines under the supervision of L.D. S.W. performed the qPCR and western blot experiments with help from J.A. and S.Z. Y.W. performed additional computational analyses. M.Z. performed the frameshifting assay and analysis under the supervision of N.C. E.S.L. and J.V. provided support and contributed to study design. M.M. wrote the manuscript with input from all authors.
Corresponding authors
Ethics declarations
Competing interests
The authors declare no competing interests.
Additional information
Peer review information Nature Microbiology thanks the anonymous reviewers for their contribution to the peer review of this work.
Publisher’s note Springer Nature remains neutral with regard to jurisdictional claims in published maps and institutional affiliations.
Extended data
Extended Data Fig. 1 Capturing SARS-CoV-2 RNAs and bound proteins with RAP-MS.
a, Alignment of protein-crosslinked RNA fragments to the SARS-CoV-2 genome following RNA antisense purification of SARS-CoV-2 RNAs from infected Huh7 cells. Two replicate experiments are shown. b, Fraction of crosslinked RNA fragments mapping to the human or SARS-CoV-2 genomes in pilot RAP-MS experiments. c, Correlation plot for two replicate RAP experiments. CPM values for SARS-CoV-2 genes are shown. CPM: counts per million. d, As in b, but for full-scale SARS-CoV-2 RNA RAP-MS and RMRP RAP-MS experiments. e, Western blot of two replicate SARS-CoV-2 RNA and RMRP RAP-MS experiments. Indicated antibodies were used for protein detection.
Extended Data Fig. 2 Connectivity in RAP-MS protein-protein association network.
Total number of connections observed in protein-protein association network constructed based on expanded SARS-CoV-2 RNA interactome (red bar, 1,534 connections), compared to number of connections observed in random networks of equal size (grey bars, mean 60 connections, z-score 76) using random sampling of proteins detected in proteome measurements.
Extended Data Fig. 3 Proteome abundance changes in SARS-CoV-2 infected cells.
a, Correlation of protein abundance measurements reported in Klann et al. and this study (r = 0.411). Proteins displayed are significant at an adjusted P value threshold of 0.01 in both studies (n = 712). b, Principle component analysis for proteome measurements of SARS-CoV-2 (SCoV2) infected or mock infected Huh7 cells. c, GSEA for proteins significantly regulated in global proteome measurements. Gene sets enriched in addition to those shown in Figure 3b are presented. Statistical test: Kolmogorov-Smirnov test with Benjamini-Hochberg adjustment. d, Protein-protein association network of expanded SARS-CoV-2 RNA interactome proteins (blue: interactome protein, not regulated; red: interactome protein, regulated) and their connections to differentially regulated proteins upon SARS-CoV-2 infection. Upregulated proteins are shown in light grey; downregulated proteins are shown in dark grey. Circle sizes scale to the number of connections of each interactome protein.
Extended Data Fig. 4 Functional validation of SARS-CoV-2 RNA binders.
a, Western blot of WT HEK293 cells and four different HEK293 LARP1 knockout (KO) cell lines generated with CRISPR-Cas9 (see Methods). Expression of LARP1 was evaluated relative to Tubulin. b, Western blot of HEK293 cells transiently overexpressing (OE) GFP or LARP1-GFP proteins at 48 h post transfection. Arrows indicate endogenous LARP1 proteins and GFP-tagged LARP1. c, Western blot of four different HEK293 LARP1 knockout cell lines transiently transfected with plasmids encoding GFP or LARP1-GFP proteins at 48 h post transfection. Experiments were repeated at least two times. d, Schematic of dual-fluorescence translation reporter to quantify ribosomal frameshifting efficiency. The depicted control construct contains enhanced GFP (eGFP) and mCherry in an in-frame orientation, leading to the production of both fluorescent proteins separated by a self-cleaving 2A peptide when the 0 reading frame is translated. In the frameshift construct depicted below, eGFP and mCherry are separated by an in-frame stop codon, preventing the production of mCherry when the 0 reading frame is translated. −1FS leads to the production of eGFP and mCherry and the ratio between both fluorescent proteins is a direct measure of frameshifting efficacy. −1FS: –1 ribosomal frameshifting.
Extended Data Fig. 5 Pharmacological inhibition of SARS-CoV-2 RNA interactome proteins.
a, RT-qPCR measurements of intracellular SARS-CoV-2 RNA (RdRP gene) in infected Calu3, Huh7 and A549-ACE2 cells after inhibitor treatment. Inhibitors were used at indicated concentration (left to right). Calu3 cells were assayed 24 h post-infection, Huh7 and A549-ACE2 cells were assayed 48 h post-infection. Values are normalized to 18S rRNA measurements and compared to untreated or DMSO treated cells. b, Infectious viral titers in the supernatants of infected Calu3, Huh7 and A549-ACE2 cells after inhibitor treatment. Inhibitors were used at indicated concentration (left to right). Calu3 cells were assayed 24 h post-infection, Huh7 and A549-ACE2 cells were assayed 48 h post-infection. All values in a-b are mean ± s.d. (n = 3 independent infections) c-d, Cell viability assay in inhibitor-treated and untreated cells. Values are the mean ± s.d. (n = 3 independent treatments). P values determined in unpaired two-tailed t-test. ***P < 0.001; **P < 0.01; *P < 0.05; ns, not significant.
Supplementary information
Supplementary Table 1
Proteins detected by quantitative mass spectrometry in SARS-CoV-2 RNA and RMRP RNA antisense purifications in infected human cells.
Supplementary Table 2
Intersection of the expanded SARS-CoV-2 RNA interactome with published work.
Supplementary Table 3
Gene Ontology enrichment analysis for the expanded SARS-CoV-2 RNA interactome. Statistical test: Fisher’s exact test with Benjamini–Hochberg adjustment.
Supplementary Table 4
Protein–protein association network based on STRING v.11 interactions between human proteins in the expanded SARS-CoV-2 RNA interactome.
Supplementary Table 5
Proteome abundance measurements in SARS-CoV-2 infected and uninfected Huh7 cells.
Supplementary Table 6
Gene set enrichment analysis for proteome abundance measurements in SARS-CoV-2 infected Huh7 cells (Hallmark and MSigDB C5 gene sets). Statistical test: Kolmogorov–Smirnov test with Benjamini–Hochberg adjustment.
Supplementary Table 7
Protein–protein association network based on STRING v.11 interactions between human proteins in the core SARS-CoV-2 RNA interactome and proteins regulated upon SARS-CoV-2 infection in Huh7 cells.
Supplementary Table 8
Gene Ontology enrichment analysis for protein–protein association network of core SARS-CoV-2 RNA interactome and proteins regulated upon SARS-CoV-2 infection in Huh7 cells. Statistical test: Fisher’s exact test with Benjamini–Hochberg adjustment.
Supplementary Table 9
CNBP eCLIP peaks and target transcript information (human).
Supplementary Table 10
LARP1 eCLIP peaks and target transcript information (human).
Supplementary Table 11
Gene Ontology enrichment analysis for LARP1 target transcripts (human). Statistical test: Fisher’s exact test with Benjamini–Hochberg adjustment.
Source data
Source Data Fig. 4
Unprocessed western blots for Fig. 4.
Source Data Extended Data Fig. 1
Unprocessed western blots for Extended Data Fig. 1.
Source Data Extended Data Fig. 4
Unprocessed western blots for Extended Data Fig. 4.
Rights and permissions
Open Access This article is licensed under a Creative Commons Attribution 4.0 International License, which permits use, sharing, adaptation, distribution and reproduction in any medium or format, as long as you give appropriate credit to the original author(s) and the source, provide a link to the Creative Commons license, and indicate if changes were made. The images or other third party material in this article are included in the article’s Creative Commons license, unless indicated otherwise in a credit line to the material. If material is not included in the article’s Creative Commons license and your intended use is not permitted by statutory regulation or exceeds the permitted use, you will need to obtain permission directly from the copyright holder. To view a copy of this license, visit http://creativecommons.org/licenses/by/4.0/.
About this article

Cite this article
Schmidt, N., Lareau, C.A., Keshishian, H. et al. The SARS-CoV-2 RNA–protein interactome in infected human cells. Nat Microbiol 6, 339–353 (2021). https://doi.org/10.1038/s41564-020-00846-z
Received:
Accepted:
Published:
Issue Date:
DOI: https://doi.org/10.1038/s41564-020-00846-z
This article is cited by
-
Non-mutational neoantigens in disease
Nature Immunology (2024)
-
Integrated multi-omics analyses identify anti-viral host factors and pathways controlling SARS-CoV-2 infection
Nature Communications (2024)
-
Coronavirus takeover of host cell translation and intracellular antiviral response: a molecular perspective
The EMBO Journal (2024)
-
SARS-CoV-2 biology and host interactions
Nature Reviews Microbiology (2024)
-
Proteomic analysis of SARS-CoV-2 particles unveils a key role of G3BP proteins in viral assembly
Nature Communications (2024)
