
2dCNN-BiCuDNNLSTM: Hybrid Deep-Learning-Based Approach for Classification of COVID-19 X-ray Images


Department of Computing Technologies, Swinburne University of Technology, Melbourne, VIC 3122, Australia
*
Authors to whom correspondence should be addressed.
Sustainability 2022, 14(11), 6785; https://doi.org/10.3390/su14116785
Submission received: 22 March 2022
/
Revised: 14 April 2022
/
Accepted: 20 May 2022
/
Published: 1 June 2022
(This article belongs to the Special Issue Innovative Practices of Digital Transformation: Technological Evolution and Digitalization in Modern Era)
Abstract
:The coronavirus (COVID-19) is a major global disaster of humankind, in the 21st century. COVID-19 initiates breathing infection, including pneumonia, common cold, sneezing, and coughing. Initial detection becomes crucial, to classify the virus and limit its spread. COVID-19 infection is similar to other types of pneumonia, and it may result in severe pneumonia, with bundles of illness onsets. This research is focused on identifying people affected by COVID-19 at a very early stage, through chest X-ray images. Chest X-ray classification is a beneficial method in the identification, follow up, and evaluation of treatment efficiency, for people with pneumonia. This research, also, considered chest X-ray classification as a basic method to evaluate the existence of lung irregularities in symptomatic patients, alleged for COVID-19 disease. The aim of this research is to classify COVID-19 samples from normal chest X-ray images and pneumonia-affected chest X-ray images of people, for early identification of the disease. This research will help people in diagnosing individuals for viruses and insisting that people receive proper treatment as well as preventive action, to stop the spread of the virus. To provide accurate classification of disease in patients’ chest X-ray images, this research proposed a novel classification model, named 2dCNN-BiCuDNNLSTM, which combines two-dimensional Convolutional Neural Network (CNN) and a Bidirectional CUDA Deep Neural Network Long Short-Term Memory (BiCuDNNLSTM). Deep learning is known for identifying the patterns in available data that will be helpful in accurate classification of disease. The proposed model (2dCNN and BiCuDNNLSTM layers, with proper hyperparameters) can differentiate normal chest X-rays from viral pneumonia and COVID-19 ones, with high accuracy. A total of 6863 X-ray images (JPEG) (1000 COVID-19 patients, 3863 normal cases, and 2000 pneumonia patients) have been engaged, to examine the achievement of the suggested neural network; 80% of the images dataset for every group is received for proposed model training, 10% is accepted for validation, and 10% is accepted for testing. It is observed that the proposed model acquires the towering classification accuracy of 93%. The proposed network is used for predictive analysis, to prompt people regarding the risk of early detection of COVID-19. X-ray images help to classify people with COVID-19 variants and to indicate the severity of disease in the future. This study demonstrates the effectiveness of the proposed CUDA-enabled hybrid deep learning models, to classify the X-ray image data, with a high accuracy of detecting COVID-19. It reveals that the proposed model can be applicable in numerous virus classifications. The chest X-ray classification is a commonly available and reasonable approach, for diagnosing people with lower respiratory signs or suspected COVID-19. Therefore, it is demonstrated that the proposed model has an efficient and promising accomplishment for classifying COVID-19 through X-ray images. The proposed hybrid model can, efficiently, preserve the comprehensive characteristic facts of the image data, for more exceptional concluding classification results than an individual neural network.
1. Introduction
Coronavirus disease 2019 (COVID-19) is caused by critical respiratory syndrome SARS-CoV-2, and spread worldwide in less than three months, since it was first announced, reaching 323 million confirmed cases and 5.5 million deaths [Coronavirus disease (COVID-2019) situation reports: https://www.who.int/publications/m/item/weekly-epidemiological-update-on-covid-19—18-january-2022 (accessed on 16 January 2022)]. Due to its extremely infectious nature and the absence of suitable treatment, quick identification of COVID-19 has become, increasingly, essential to prohibit further spreading and to straighten the curve for actual distribution of bounded medical supplies. COVID-19 can affect the lung tissue that can be detected by chest X-ray images. There have been numerous established deep learning (DL) methods in the literature, which have used chest X-ray images for illness identification and classification [1].
Image detection and classification is a dominating area in the field of computer vision. In the last few years, deep learning models have played an outstanding role in image classification and recognition. DL has validated a growing research focus and outperformed many traditional networks. DL is similar to the pattern of the human brain, which resembles a deep structure. It is an effective way to resolve complex and analytic issues, happening in COVID-19 diagnosis. Many researchers have shown several models, to detect and classify COVID-19 by using X-ray images. Long Short-Term Memory (LSTM) and Convolutional Neural Network (CNN) are the most popular methods in DL, in recent years. Medical image analysis has been done, successfully, by CNN, such as MRI [2], X-ray [3], CT scans [4], etc. Hybrid LSTM has very promising results for image classification [5,6]. The sequential pattern information of the training set is captured by LSTM, using specified features. Furthermore, a deep neural network is a sequence of approaches that identify the valuable pattern’s relationships from the available data, through a neural process that is highly homogeneous to human brain processes. These DL algorithms are very effectual for pattern recognition and image processing. The image dataset is used as input for DL approaches, after that, a network is built that operates the image datasets, to take out the valuable attributes from those images [7] and identify the patterns [6]. CNN recognizes the resemblance of new inputs from valuable patterns, as accurately as possible, and BiCuDNNLSTM can compute the dependency and output of the sequential features of the intermediate layer. These DL approaches are very desirable because of their flexibility, minimum complexity, minimum training hyper-parameters, and simple network organization.
COVID-19 detection and classification, using CNN and CuDNNLSTM, have become well-organized research techniques after it has become widespread around the world. The literature showed that CNN- and CuDNNLSTM-based research work performs excellently, in utilising X-ray pictures for the identification and classification of COVID-19 cases. These approaches are very useful, in alliance with genuine testing techniques, but there is a lot of room for research and enhancement, for achieving highly accurate results. A huge number of scholars are endeavouring for a highly accurate and reliable DL-based classification method for COVID-19. Researchers are engaging in DL approaches to identify features for X-ray images of COVID-19 cases. Ioannis et al. [8] used VGG19 for classification of COVID-19 positive, COVID-19 negative, and healthy cases, accomplishing 93.48% accuracy by using X-ray images. In another study, Wang and Wong [9] proposed a technique, COVID-Net, for homogeneous three-class classification, which accomplished 92.4% accuracy, by using X-ray images.
In this research, a 2dCNN-BiCuDNNLSTM network is proposed, which performs better classification using X-ray images. The proposed hybrid model (2dCNN-BiCuDNNLSTM) is based on two-dimensional CNN (which consists of convolutional, max-pooling, and dense layers), bidirectional CUDA-based LSTM, and two activation functions, namely Sigmoid and ReLU. A joint approach was implemented, to classify COVID-19 cases, using three types of X-ray images. The structure of the proposed architecture was designed by combining two-dimensional CNN and BiCuDNNLSTM models, where the 2dCNN is used to extract complex features from images, and BiCuDNNLSTM is used as a classifier. This research has assessed the achievement of the proposed model, in terms of accuracy, precision, recall, and F1 score. It can be very obliging to aid in the classification of COVID-19. The main goal of this research is to develop an accurate COVID-19 classification model. The main contributions of the paper are as follows:
- By analyzing the association of image data, a new deep learning method, 2dCNN-BiCuDNNLSTM, is proposed for COVID-19 and viral pneumonia classification.
- By comparing with the other deep learning methods, such as stacked 2dCNN, for COVID-19 and viral pneumonia detection and classification, it is established that the 2dCNN-BiCuDNNLSTM network is the most precise and effective, which shows that it is more suitable for COVID-19 and viral pneumonia classification.
Good health is necessary to the sustainable development of the society and our community. The global health description will be constituent to accomplish the Sustainable Development Goal (SDG). Accomplishing the SDGs will put us on a strong path to treating universal well-being instability and arising contagious diseases. It is crucial to find the best classification model, to accomplish high accuracy in the classification of COVID-19 cases, which is a more sustainable way of finding, treating, and preventing the disease. Big organizations like Google or Microsoft are already enforcing deep learning applications, to frame their usage as more sustainable. The DL plays a vital role to identify the valuable characteristics from X-ray images that can be used to make identification and classification decisions more sustainable. DL plays a significant role in gaining not only the best classification model, it also helps to achieve the SDG 3 goal of “Good Health and Well-Being”. DL applications for sustainability demonstrate that they can bring significant benefits to the identification and classification process, with valuable data features. For example, the early diagnosis of lung disease uses the DL model, to consistently analyze, learn from, and improve diagnose predictions as well as provide sustainable opportunities in disease identification and classification. The proposed 2dCNN-BiCuDNNLSTM model is focusing on early diagnosis of COVID-19 symptoms from chest X-ray images, to achieve a sustainable classification model, as a step forward to the future diagnosis of pandemic diseases in medical science.
2. Literature Review
DL plays an essential role in the medical industry, due to its remarkable fulfilment in image classification. There have been various DL-based networks in the literature that use chest X-ray pictures for COVID-19 detection and classification. Afshar et al. [10] proposed the model, COVID-CAPS, based on Capsule Networks. COVID-CAPS accomplished 95.7% accuracy, 90% sensitivity and 95.8% specificity. According to [10], their proposed model is capable of handling small datasets. Apostolopoulos et al. [11] used the CNN-based mobile-net approach for COVID-19 classification. In their research, 3905 X-ray pictures have been used to evolve an extremely efficient technique for detecting respiratory illness. The authors reported a 87.66% classification accuracy for the seven classes of dataset. The authors used a pre-trained model for COVID-19 classification, which can produce an unstable dataset consequence on training. Zhao et al. [12] used a convolutional neural network with a rich set of hyper-parameters for COVID-19 detection. In their approach, they used CT images for experiments. According to the author [12], the proposed model achieved 99.2% accuracy, while classifying the COVID-19 cases. Their experiments showed that the network is significant with a bounded data limit. Al-Waisy et al. [13] introduced the COVID-DeepNet model, to help medical staff in rapid and accurate image classification. They used chest X-ray pictures for COVID-19 classification. The COVID-DeepNet model can, accurately, classify patients with COVID-19 with MSE value 0.021%, RMSE value 0.016%, 99.93% accuracy, 99.90% sensitivity, 100% specificity, 100% precision, and 99.93% F1 score, on a large dataset. Khuzani et al. [14] introduced the COVID-Classifier, to differentiate chest X-ray pictures of COVID-19 cases from other strains of pneumonia. In their research, the experiments are based on 140 pictures of normal cases, COVID-19 cases, and pneumonia cases. The authors claimed that a comparison between chest X-ray images of COVID-19 cases with pneumonia showed that the COVID-Classifier has 100% sensitivity and 96% precision, against the test set of 84 chest X-ray images. Hu et al. [15] proposed a weakly supervised DL-based CNN approach, for detecting and classifying COVID-19 disease from CT images. The authors used 150 3D chest CT scans of COVID-19, community-acquired pneumonia, and non-pneumonia patients, respectively, for their experiments. In total, 450 images were used from two hospitals between September 2016 and March 2020. An 89.2% classification accuracy was noted by the researchers. Ozturk et al. [16] used the DarkNet model as a classifier for real-time image detection, and 17 convolutional layers have been used, with different filtering on each layer. Their classification model achieved the classification accuracy of 98.08% for binary classes and 87.02% for multi-class cases. Muthumayi et al. [17] proposed a Multi-objective Black Widow Optimization (MBWO)-based CNN (MBWO-CNN) model, for the detection and classification of COVID-19. Their model achieved 96.43% accuracy for the classification of COVID-19. Xue et al. [18] proposed the CNN-based approach, to improve the classification accuracy of COVID-19 from chest X-ray images.
The interest in hybrid classification models is, mainly, motivated by the large variety of practical situations for COVID-19 data analysis. Ismael et al. [19] used the CNN network to classify COVID-19 and normal chest X-ray images. In their approach, valuable pattern extraction is done by pre-trained CNN networks (ResNet18, ResNet50, ResNet101, VGG16, and VGG19) from chest X-ray images. Support Vector Machines (SVM) were used for classification of the valuable patterns. The researchers noted a 94.7% accuracy, applied to their established network and 180 COVID-19 and 200 normal chest X-ray pictures, which were utilized for their experiment. Oh et al. [20] introduced a neural network technique based on a segmentation and classification network. The segmentation network extracted lung and heart figures from the chest radiography images. The authors used the extended fully convolutional (FC)-DenseNet103 approach, for semantic segmentation. The classification network used to classify the chest X-ray images of COVID-19, tuberculosis, bacteria, viral, and healthy persons. The authors used ResNet-18 for classification of chest X-ray images. Oh et al. [20] achieved a 91.9% accuracy score with 200 chest X-ray images. Biswas et al. [21] used Twitter data for a proposed LSTM-CNN hybrid model based on the single-window model for real-time COVID-19 case prediction. The LSTM-CNN model has achieved the accuracy of 75.72%. According to the author [21], bidirectional LSTM can be used for achieving more accurate prediction result in the future. Jain et al. [22] proposed an approach based on four steps, such as image pre-processing, image augmentation, training based on the ResNet50 model for differentiation among all datasets, and training based on another model, the ResNet-101 technique, to identify the existence of COVID-19 cases from all other available X-ray images. The authors reported a 97.77% classification accuracy, 97.14% recall, and 97.14% precision, in case of COVID-19 detection. This research used open source images from Cohen and Kaggle.
Although substantial research has been used to determine COVID-19, there are still problems with fewer image data and ineffective outputs. This research is direct at helping in the efficient detection and classification of COVID-19 cases. The contribution of this paper is to develop a hybrid DL classification technique, 2dCNN-BiCuDNNLSTM, for COVID-19 and viral pneumonia, based on chest X-ray images.
3. Methodology
In this paper, a two-dimensional CNN (Convolutional Neural Networks) and Bidirectional CuDNNLSTM (Long Short-Term Memory) mixed model has been proposed for image classification; the proposed network is called the 2dCNN-BiCuDNNLSTM model. The chest X-ray image dataset can be viewed as 2D data, and the filtering process is used as convolution calculation. The non-crucial features in an image can be filtered out, leaving behind valuable features of the image dataset. Figure 1 demonstrates the research flow of the proposed network.
The 2dCNN-BiCuDNNLSTM model can use BiCuDNNLSTM to compute the reliance and sequential features of the intermediate layer of the CNN network and equate the attributes of this middle layer to the final full-connection model for classification, which will lead to better classification accuracy. At the same time, the BiCuDNNLSTM model will satisfy the restriction of the input sequence’s length and prevent the gradient explosion in the proposed model. The research study will test the proposed 2dCNN-BiCuDNNLSTM model, by being immensely used on COVID-19. The evaluation proved that the proposed model has better classification results than the actual 2dCNN model. 2dCNN captures abrupt changes from valuable patterns, while BiCuDNNLSTM possesses the property of memorizing long-term sequences, to examine the valuable patterns. BiCuDNNLSTM, also, deals with vanishing gradient problems. In the following sub-sections, the research study briefly describes the BiCuDNNLSTM and 2d CNN layers, which are the core parts of our proposed model.
3.1. BiCuDNNLSTM (Bidirectional Cuda Based Long Short Term Memory)
Hochreiter and Schmidhuber [23] proposed the Long Short-Term Memory, LSTM, network, in [23]. LSTM consists of a memory cell and three gates, such as an input gate, an output gate, and a forget gate. The memory cell memorizes the valuable sequence over time, and the three gates supervise the information flow in and out of the cell.
where W showed the weight of inputs to the gates, is the input vector, is the forget gate, is the input gate, is the output gates, t is the time, and denote the distorted input and content to the memory cell, denotes the value of the hidden node, and ⊙ denotes the element-wise product operation. The desired values over random time intervals could be remembered through gates, by controlling the information flow.
Hyper-parameters can be used to enhance the performance of the LSTM model, such as the number of epochs, learning rates, neurons, activation functions, hidden layers, and batch size [24]. LSTM performance can be improved by a special architecture, called Bidirectional LSTM. Bidirectional architecture can extract meaningful features, by running the input series in both directions and increasing the performance of the relevant classification model. The long-term dependency issues can be resolved by LSTM.
The CuDNNLSTM network is an efficient LSTM implementation of cuDNN, which is a GPU-accelerated library for deep neural networks [25]. cuDNN contributes robust and simple multi-threading for LSTM models, with a highly progressive modeling power. CuDNNLSTM resolved the basic LSTM’s cell-chronological-dependency issue [26]. This research utilizes the benefits of Bidirectional Cuda-enabled LSTM.
3.2. 2D CNN (2-Dimensional Convolution Neural Network)
The Convolutional Neural Network (CNN) is vastly used for image datasets, to obtain all local valuable patterns from different dimensions. The CNN network has different layers, such as the convolutional layer, max-pooling layer, and fully connected layer [27]. First, the conv2D layer receives input data from image streams and extracts the features from the input data, by applying the filters and kernel. Second, the 2D max-pooling layer is employed, to organize the received patterns and modify them into a more intellectual shape, between its hidden layers and memory cells. Finally, the fully connected layer determines the output of the network. There are weights, biases, and neurons, in many different layers. At the end of the neural model, the optimizer is employed to achieve the results of the 2D CNN network. The CNN model uses the look-back procedure, for the learning of the model. CNN models have different hyper-parameters that need to be optimized, for achieving the best classification accuracy, such as hidden layers, neurons, activation functions, learning rate, the number of epochs, the batch size, the dropout rate, the kernel size, and the filter size.
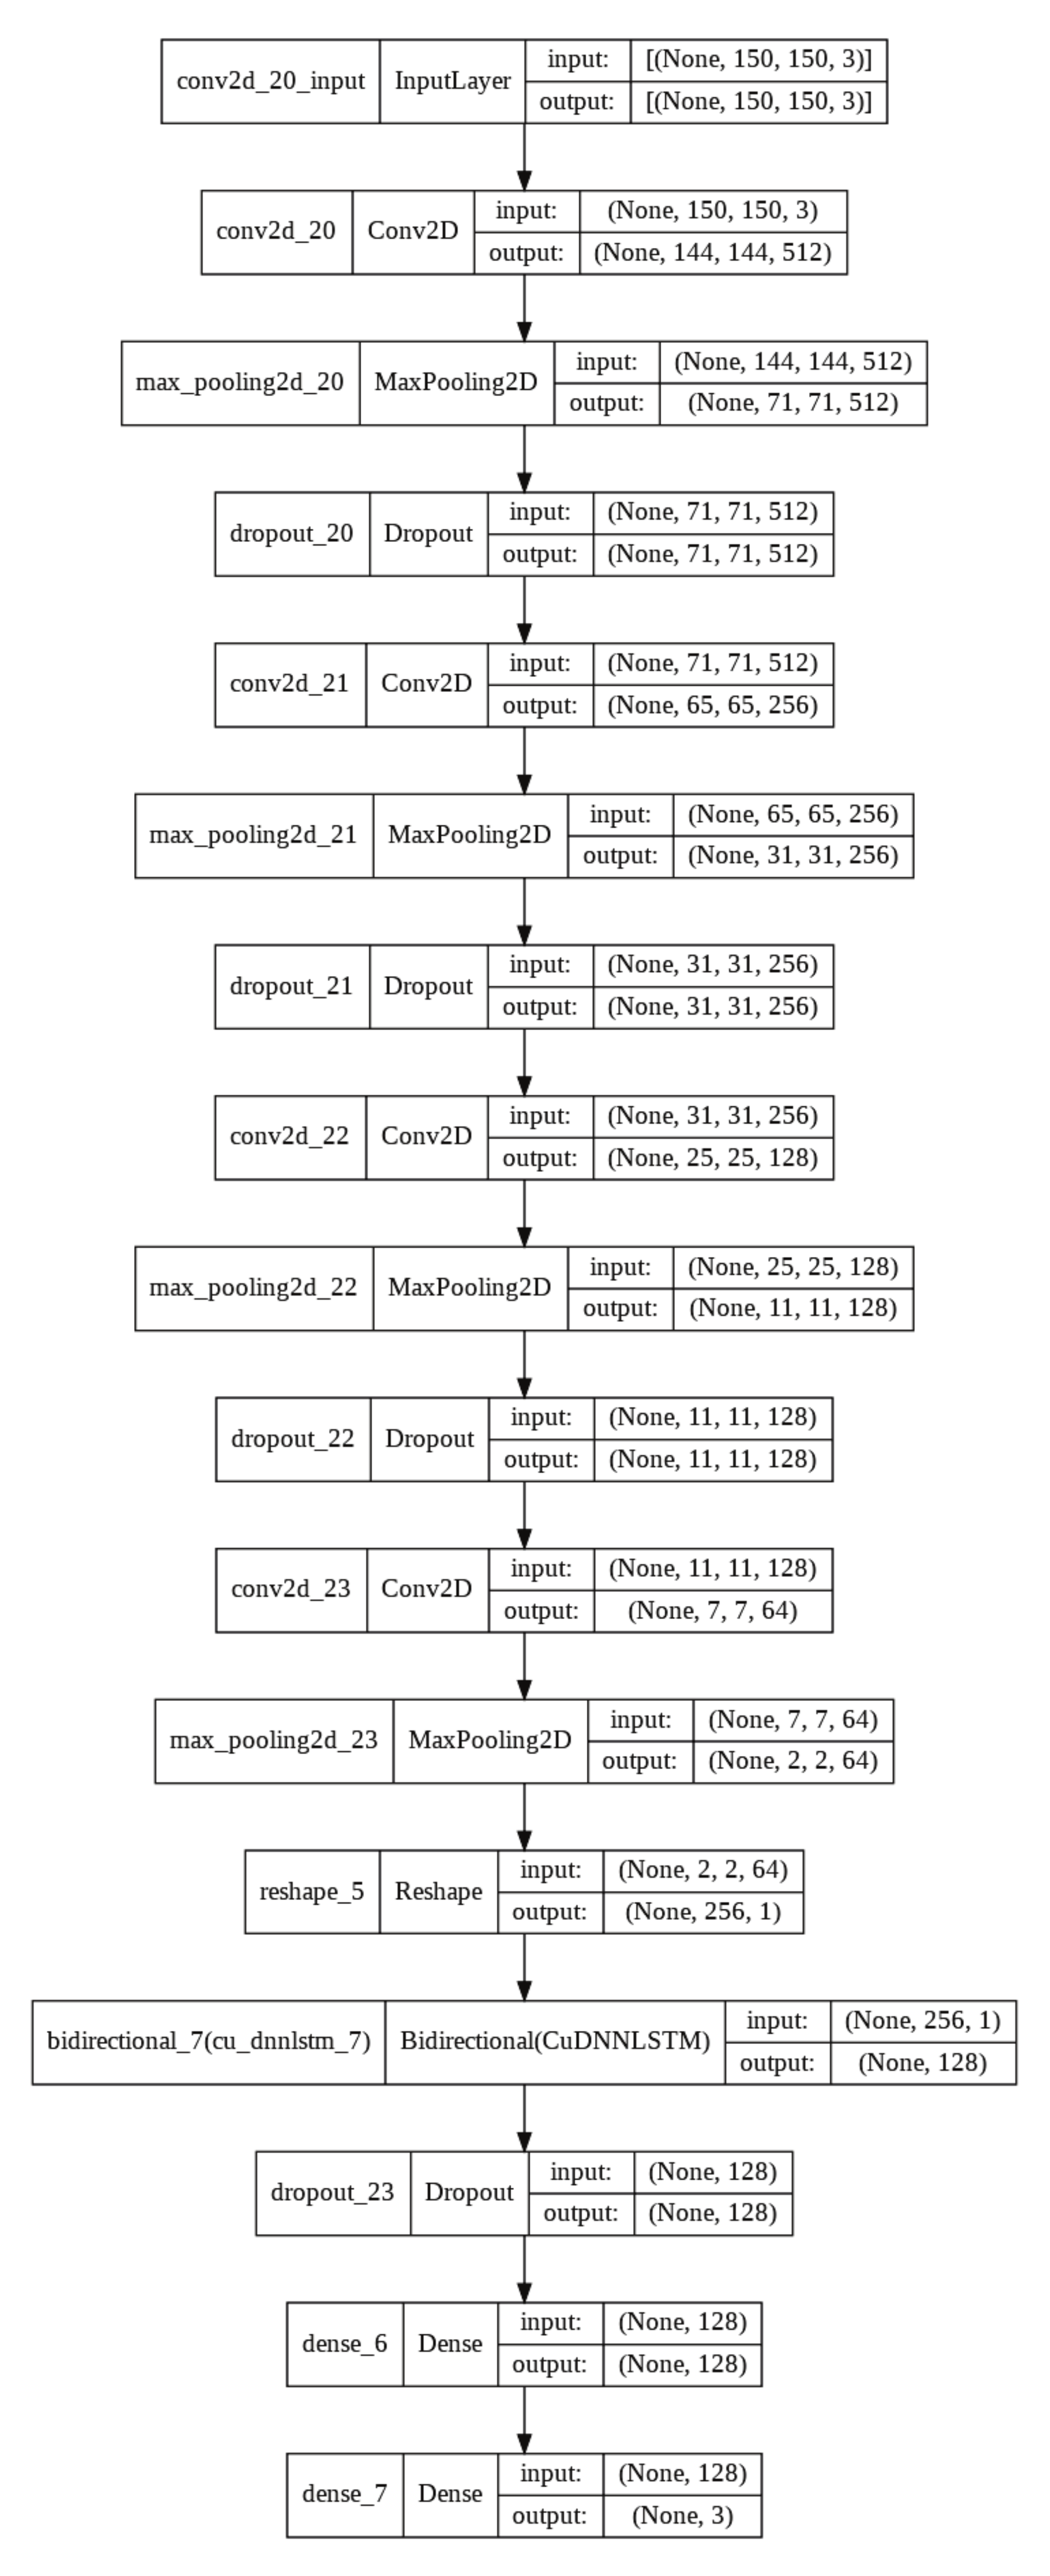
3.3. 2dCNN-BiCuDNNLSTM Model Architecture
The model architecture is shown in Figure 2. For example, for our 2dCNN-BiCuDNNLSTM model, the settings of the relevant parameters are: (1) three Conv2D and max- pooling 2D layers have been used for feature extractions from the image dataset; (2) the dropout rate of 0.2 is used in all dropout layers, to avoid overfitting in the proposed network; (3) the Bidirectional CuDNNLSTM layer is used after the CNN layer, to avoid the vanishing gradient problem and to memorize the long sequence for better classification results; (4) the reshape layer is used when BiCuDNNLSTM was receiving data from the CNN layer, to give a new shape to an array without changing its data; (5) the two dense layers are used in the proposed model, to keep one-to-one relations between input and output.
The parameters of the proposed method are kernel size, activation, strides, pool size, optimizer, loss, metrics, batch size, and epochs (refer to Algorithm 1).
| Algorithm 1 Hybrid 2dCNN-BiCuDNNLSTM Classification Model. |
| Input: Image Dataset of Covid Cases, Viral Pneumonia and Healthy Cases Image Augmentation: ImageDataGenerator while do while batch-size = 1 : b do Sequential() Conv2D MaxPool2D Dropout(0.2) Conv2D MaxPool2D Dropout(0.2) Conv2D MaxPool2D Dropout(0.2) Conv2D MaxPool2D Reshape Bidirectional(CuDNNLSTM Dropout(0.2) Dense Dense Compile end while end while |
- Kernel size: The Kernel size refers to the width and height of the filter cover.
- Activation: This function is used to decide which neuron should be activated or not, by evaluating the weighted sum and, further, adding bias with it.
- Strides: Stride is the number of pixel transfers over the input matrix.
- Optimizer: An optimizer is a function used to reshape the features of the model, such as weights and learning rate. It supports in decreasing loss and improving model accuracy.
- Pool size: A pooling function is used to choose the maximum segment from the region of the attribute map masked by the filter.
- Loss: The loss function is used to calculate the difference between the current output of the model and the expected output.
- Metrics: Metrics are used to evaluate the performance of proposed model.
- Batch size: Batch size defines the number of training examples that will be trained through the model in one iteration.
- Epoch: The number of epochs are the number of entire passes through the training dataset, for one cycle.
3.4. Evaluation Metric
The proposed model performance is evaluated by computing the accuracy, precision, recall, F1 score, macro average, and weighted average. The classification phase used an accuracy measure for evaluation. Different statistical measures, such as accuracy, precision, recall, and F1 score are utilized to measure the accomplishment of the introduced model, for COVID-19 detection and classification. The explanation and equations of the statistical measures are as follows:
- Accuracy: Acuracy is used to judge the potential of a network, by calculating a proportion of the accurately predicted cases from the total number of cases. Accuracy is demonstrated as:where
- True Positive (TP): Portion of correctly predicted +ive cases
- True Negative (TN): Portion of correctly predicted -ive cases
- False Positive (FP): Portion of incorrectly predicted +ive cases
- True Negative (TN): Portion of incorrectly predicted -ive cases
- Precision: Precision is the proportion of accurately predicted +ive observations, from the total predicted +ive cases. It is demonstrated as:
- Recall: Recall is the proportion of accurately predicted +ive cases, from all cases in the original class.
- F1 score: F1 score contributes to the balance among Precision and Recall.
4. Experiments
The two-dimensional CNN and Bidirectional CuDNNLSTM were implemented in Python 3 under “Google Colab”, which is a machine learning research project for prototyping the model on intense hardware, such as GPUs and TPUs. In this research, the research study used GPUs for powerful computation, which is highly suitable for 2dCNN and BiCuDNNLSTM. The Keras library was used to develop the network, with a Tensorflow backend.
4.1. Dataset
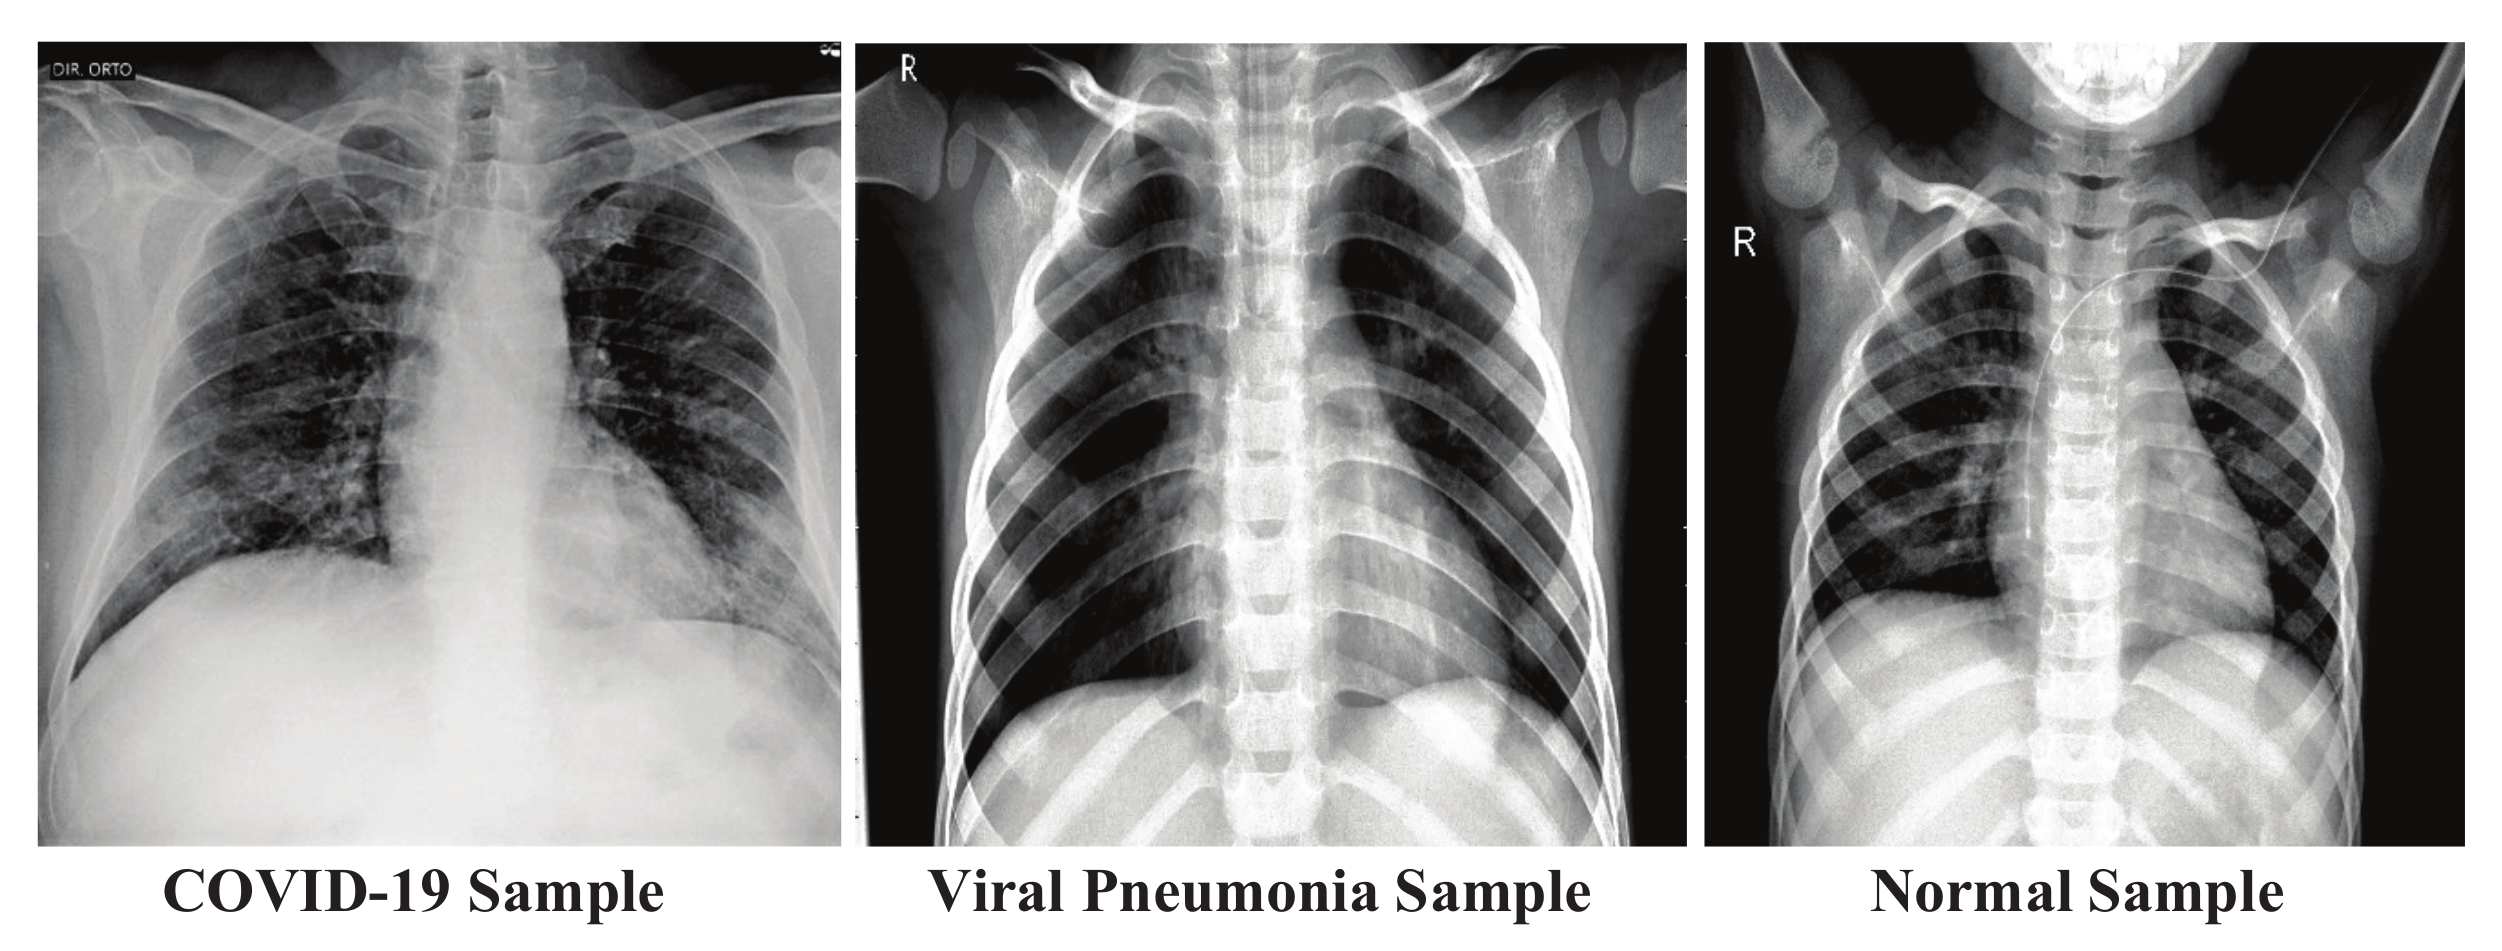
In this paper, the chest X-ray image datasets of COVID-19, viral pneumonia, and healthy cases are used for experiments. The dataset was collected from the chest X-ray dataset published by Kaggle. The whole dataset contains a total of 6863 X-ray images (JPEG) (1000 COVID-19 positive images, 3863 healthy images, and 2000 viral pneumonia images). The chest X-ray images dataset sample looks like Figure 3.
The collected datasets consist of the frontal view of hundreds of chest X-rays, and the scrutinized comprehensive public resource for COVID-19, viral pneumonia, and normal image data. The dataset is, manually, collected from various public source repositories into a DL-friendly format. The dataset consists of a small number of positive COVID-19 images, with respect to viral pneumonia and normal cases.
4.2. Dataset Augmentation
Pre-processing is a very common step in classification problems, for eliminating undesired noise, focusing on aspects of the image that can help with the identification task, or even be supportive in the DL-training phase. In this research, a simple pixel-intensity normalization is applied. The input images are, frequently, rescaled to sustain harmony with the CNN-network design. The research study, also, used image augmentation [28] for our image dataset. Image augmentation is an approach for creating modified versions of images, by artificially enhancing the standardization, rotation, size, shift, flip, brightness, and zoom of a training dataset.
In our experiments, we used the Keras ImageDataGenerator class for a quick and easy way to augment our dataset. The Keras ImageDataGenerator class provides real-time data augmentation, such as generating augmented images on the fly, while the model is still in the training stage. The new variations of the images at each epoch are provided to the model in the ImageDataGenerator class. However, it only returns the transformed images and does not add them to the original corpus of images. If this was, in fact, the case, then the model would be seeing the original images multiple times, which would definitely overfit our model. In our experiments, we used a fill-mode argument with the value “nearest”, which simply replaces the empty area with the nearest pixel values, with horizontal flip for flipping along the horizontal axis, rotation range = 20 for random rotations, rescale = 1./255, as we multiply the data by the value provided (after applying all other transformations), and shear range = 0.2, which demonstrates a counter-clockwise direction in degrees.
4.3. Training and Classification Processes
The 2dCNN-BiCuDNNLSTM classification process is shown in Figure 4.
The X-ray image dataset is input to the proposed model 2dCNN-BiCuDNNLSTM for training. Image data augmentation and pre-processing have been performed after acquiring the input. The 2dCNN-BiCuDNNLSTM layer’s weights and biases are initialized. In the CNN layer, X-ray images are successively passed through a 2D stacked convolution layer and a 2D max-pooling layer. The valuable pattern extraction from the input data is carried out, and the output value is obtained. The 2dCNN layer output is used as input in the BiCuDNNLSTM layer, and the output value is obtained. After that, the dense layer is used to evaluate the best classification features, based on the output from the BiCuDNNLSTM layers. The output value of the dense layer is computed, to achieve the output of the network. The obtained image class from the output layer is compared with the actual image class, and the corresponding error is calculated. The conditions for a successful end are based on whether the error rate of the classification is lower than a certain loss threshold. If the end condition is met, the training will be stopped. Otherwise, the training will continue again.
The pre-condition for 2dCNN-BiCuDNNLSTM classification is that 2dCNN-BiCuDNNLSTM has completed its training process. The 2dCNN-BiCuDNNLSTM classification procedure is shown in Figure 5.
The chest X-ray image dataset is used as the input for the classification. The input data are preprocessed, and image augmentation has been performed. The data are populated into the 2dCNN-BiCuDNNLSTM trained network, to get the output value after preprocessing. The output value obtained through the 2dCNN-BiCuDNNLSTM is restored to the original representation. The Accuracy, Precision, Recall, and F1 score evaluation metrics have been used for the classification results and plotting of loss and accuracy improvements, along with the number of epochs, for an insightful view of the proposed classification model.
4.4. Model’s Parameters
The optimized hyper-parameter values used in the proposed training model are (i) loss function: categorical cross entropy, (ii) epochs: 256, (iii) learning rate: 0.001, (iv) optimizer: adam, (v) batch size: 32, and (vi) activation function of the last classification layer: softmax. The plot in Figure 6, Figure 7, Figure 8, Figure 9, Figure 10 and Figure 11 demonstrates the variation in curve of loss and accuracy, with different epochs, during the training of the proposed model. There is a huge decreasing curve for loss and a high increasing slope for accuracy, from 64 to 256 epochs. The 90% dataset is passed, bidirectionally through the model. If the network is sustained to be trained additionally, to decrease the training loss, then over-fitting can occur. Over-fitting means that the trained model has not been generic to the hidden data, and has assimilated the data itself. The research study used dropout layers with a 0.2 drop out rate, to avoid over-fitting.
5. Results and Discussion
This research used three different epoch sizes (64, 128, 256), for achieving better accuracy of the model and to minimize the loss. Figure 6, Figure 7, Figure 8, Figure 9, Figure 10 and Figure 11 showed the accuracy improvement and loss minimization with the number of epochs. Figure 6 and Figure 7 showed that with 64 epochs, the proposed model is. still. improving its accuracy and minimizing its loss.
Figure 8 and Figure 9 showed that with 128 epochs, the proposed model is, still, improving its accuracy and minimizing its loss. The curve continues to increase with the passage of time for accuracy. The curve continues to decrease with the passage of time for loss.
Figure 10 and Figure 11 showed that with 256 epochs, the proposed model had improved its accuracy and minimized its loss. The obtained accuracy is 93%, with 256 epochs. Therefore, finally, the research study trained our model with 256 epochs. The curve continues to increase with the passage of time for accuracy. The curve continues to decrease, with passage of time for loss.
Table 1 demonstrates the classification performances of the proposed model. These are a performance evaluation metric in deep learning, which is used to show the precision, recall, F1 score, and accuracy of the trained classification network. Table 1 demonstrates the statistical values of the test dataset. It can be seen that the proposed model has the classification of (i) viral pneumonia with 95% recall, 83% precision, and 88% F1 score; (ii) COVID-19 with 100% recall, 100% precision, and 100% F1 score; and (iii) normal cases with 80% recall, 94% precision, and 86% F1 score.
Table 2 demonstrates the accuracy of the model on the basis of training, validation, and the test dataset.
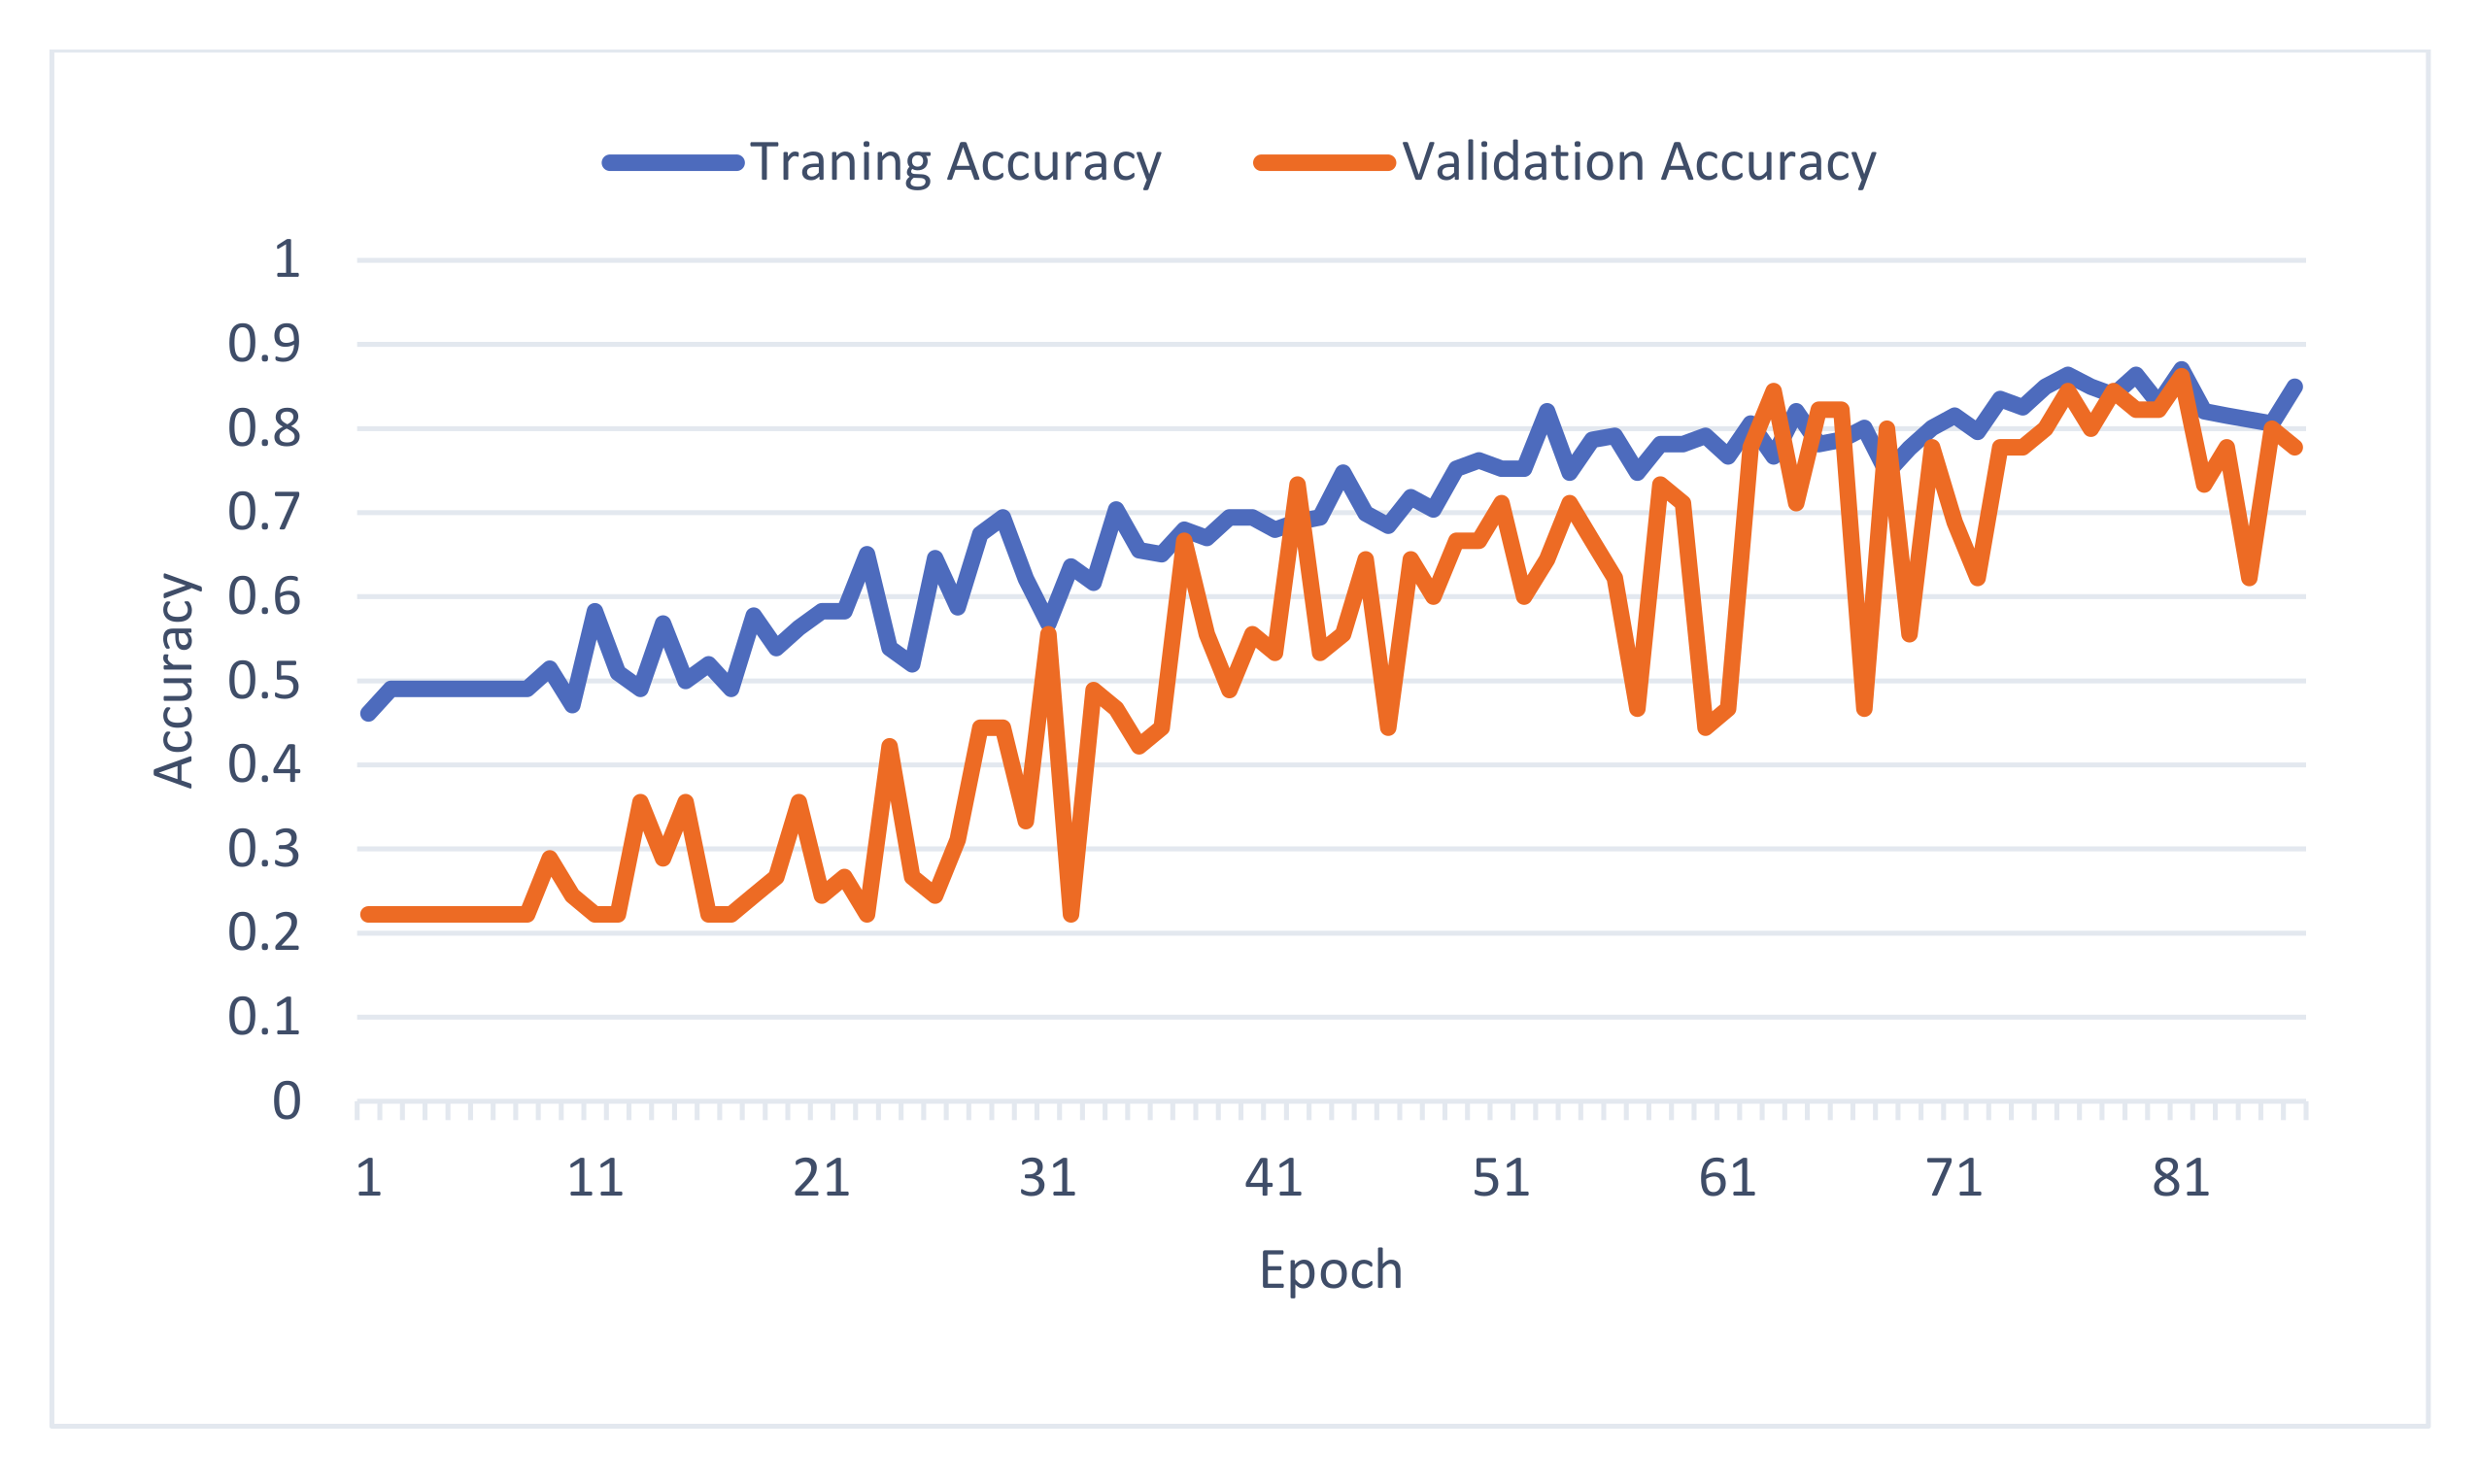
Figure 12 demonstrates the comparison of the training accuracy and validation accuracy of the proposed model.
Comparison with Other CNN and BiCuDNNLSTM Architectures
Table 3 depicted the proposed network’s accuracy of 93% for COVID-19 and viral pneumonia, which are outstanding performances as a classification method. It can be seen that the proposed model and stacked CNN model have the same hyper-parameter setting for the classification of COVID-19, viral pneumonia, and normal patients. The classification results of the proposed model for COVID-19 cases are 100% recall, 100% precision, and 100% F1 score. The classification results for the CNN model for COVID-19 are 96% recall, 58% precision, and 72% F1 score. The CNN model achieved 38% accuracy for the COVID-19 classification. The proposed model achieved very good results, as compared to stacked CNN model with the same hyper-parameter setting.
In Table 4, the proposed method showed 93% accuracy for viral pneumonia. The classification results for the proposed model for viral pneumonia are 95% recall, 83% precision, and 88% F1 score. The classification results for the stacked CNN model for viral pneumonia are 93% recall, 37% precision, and 53% F1 score. The stacked 2dCNN model achieved 38% accuracy for the viral pneumonia classification. The proposed model achieved very good results, as compared to the stacked CNN model with the same hyper-parameter setting.
In Table 5, the proposed method showed 93% accuracy for normal cases, which is, also, an outstanding performance as a classification method.
Table 6 shows the comparison results of our proposed model and the model proposed by Tulin et al. [16] based their multi-class classification dataset on three classes, such as COVID-19, no findings, and pneumonia. The dataset is publicly available at this link https://github.com/muhammedtalo/COVID-19/tree/master/X-Ray%20Image%20DataSet (accessed on 21 March 2022). The classification results obtained using our proposed model give the best accuracy, of 88.06%, as compared to the DarkCovidNet model [16] that has achieved 87.02% accuracy for multi-class on the same dataset.
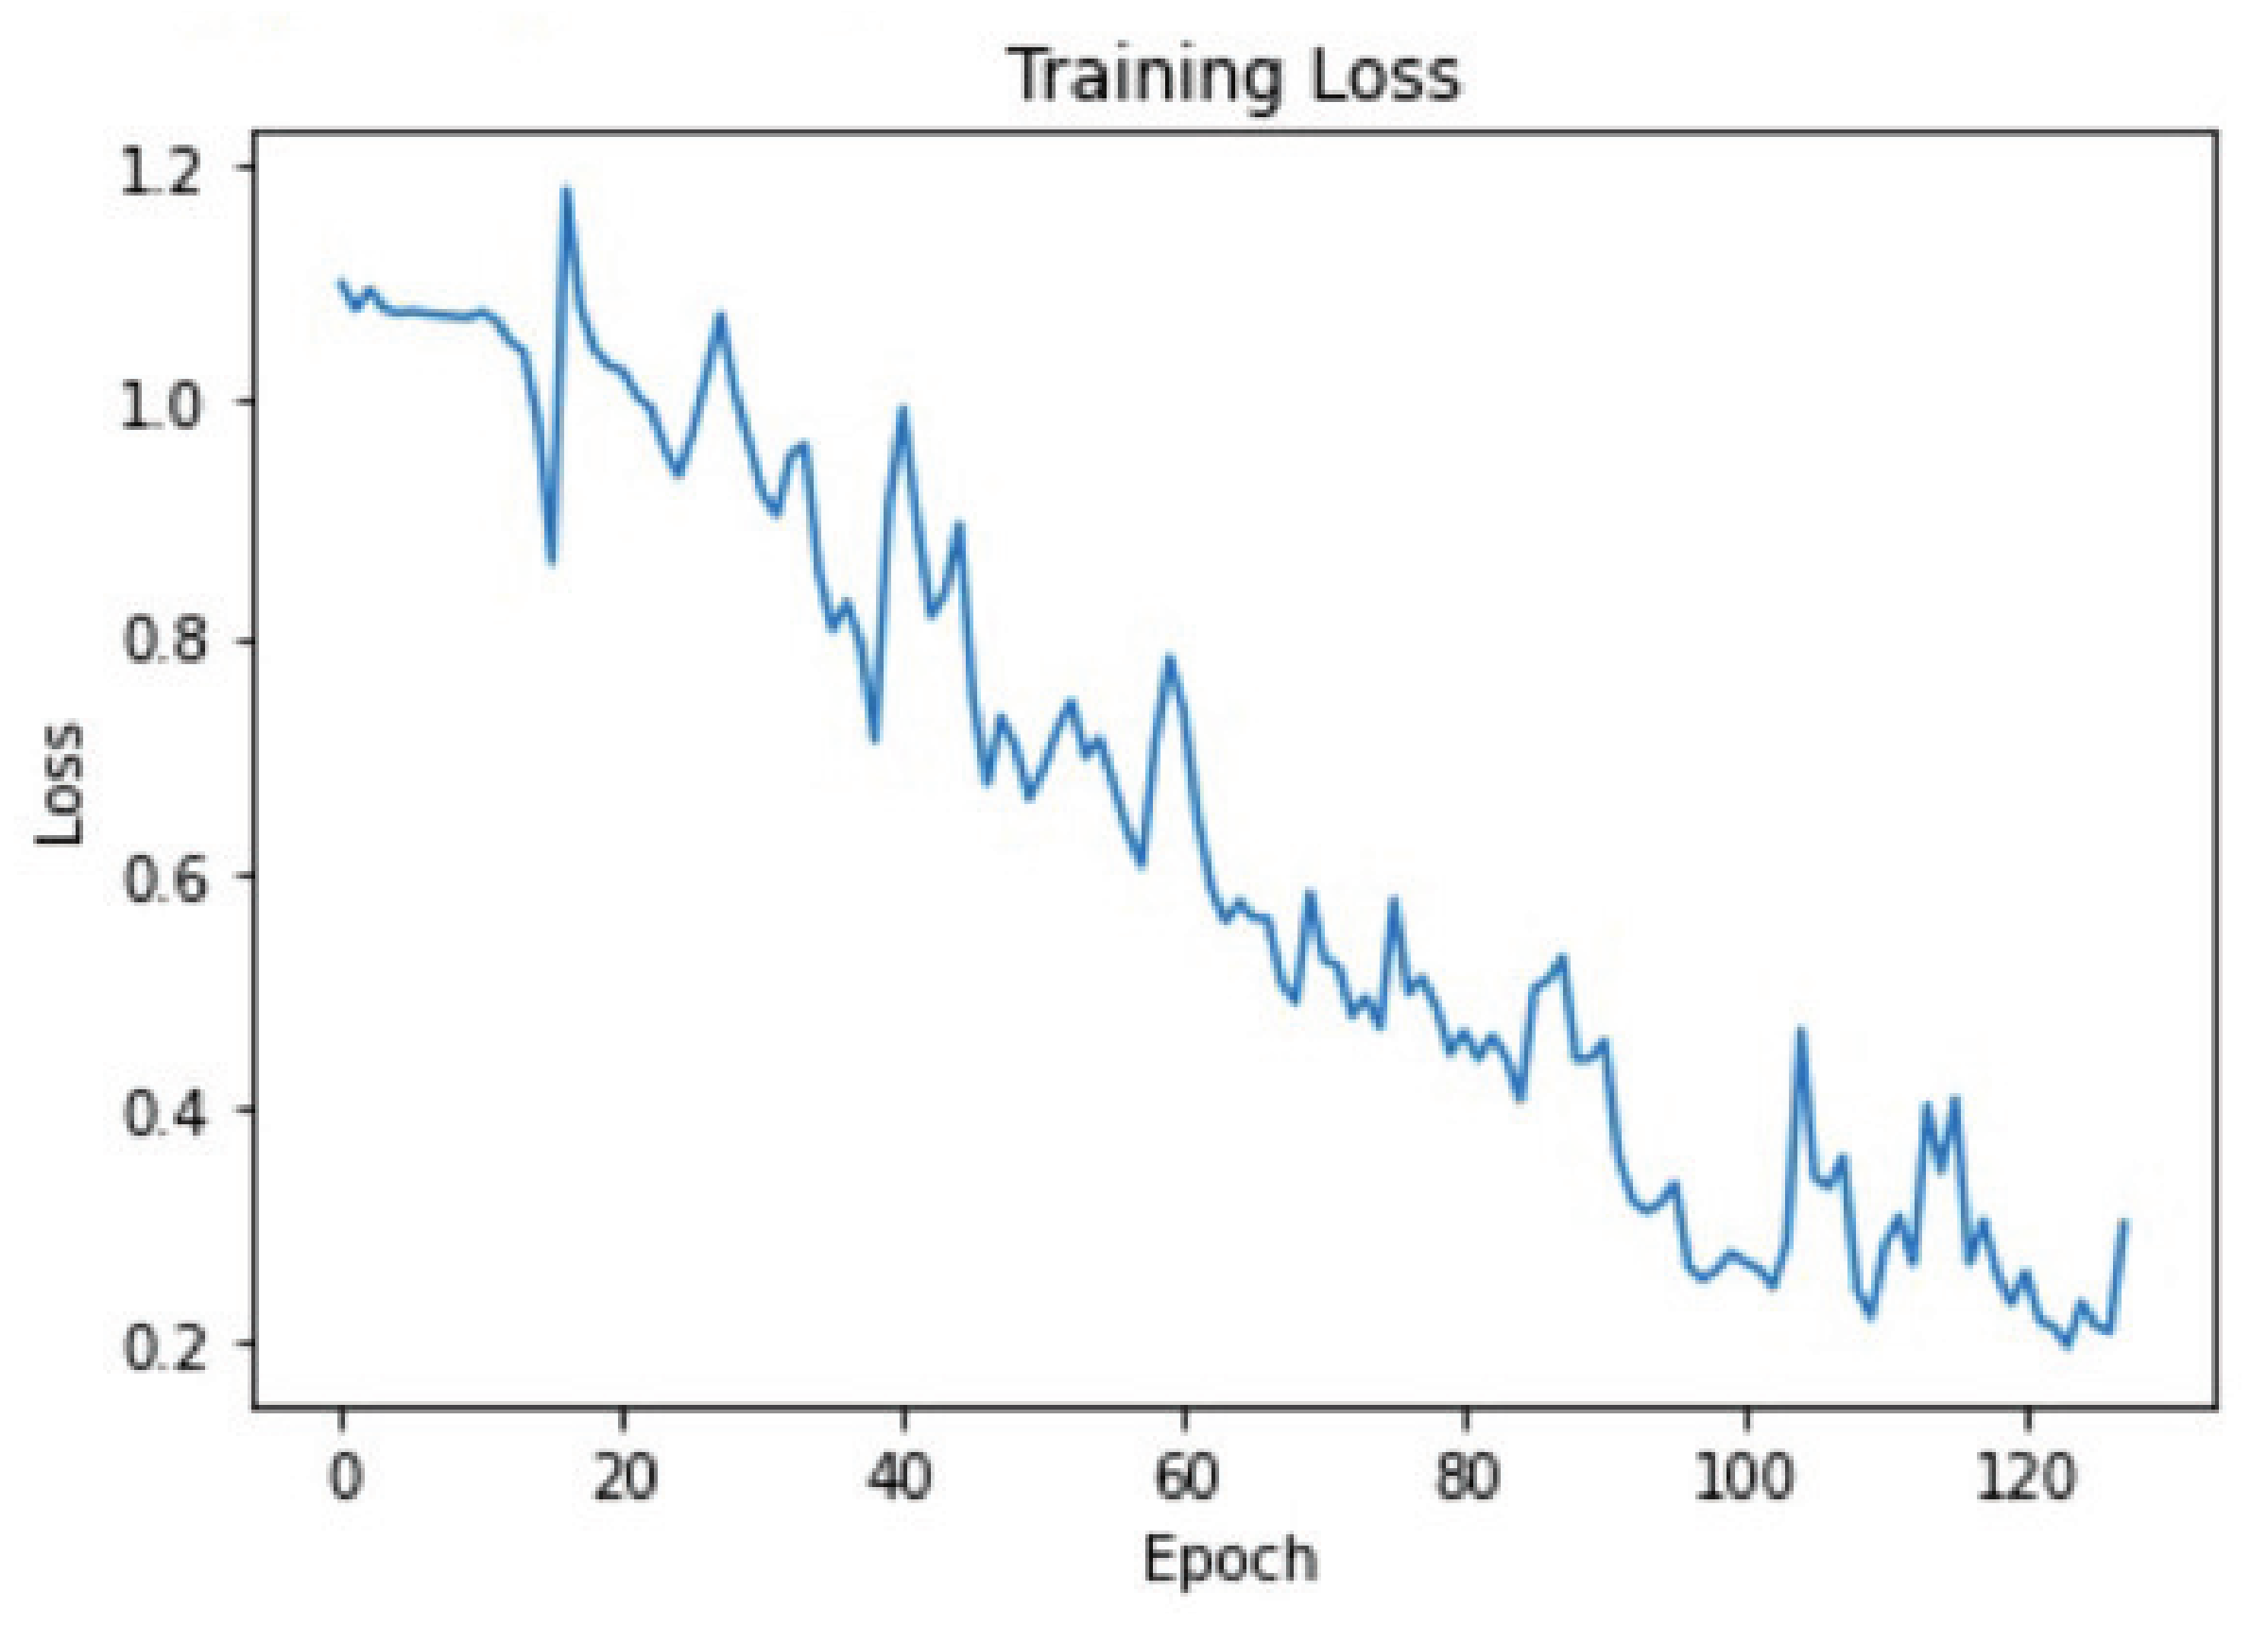
The training accuracy of the proposed model on their dataset is demonstrated in Figure 13, and the training loss is demonstrated in Figure 14.
With this analysis, we conclude that our proposed classification model is the best model, compared to the 2dCNN and DarkCovidNet models [16], in terms of accuracy.
6. Conclusions
Chest X-ray image analysis approaches play a crucial role in COVID-19 detection and classification. Deep learning approaches could be applied for diagnosing and controlling the current spread of COVID-19. Therefore, this research study proposed a hybrid DL-classification approach for COVID-19 and viral pneumonia. The proposed classification model is based on deep learning networks, such as 2dCNN, for extracting valuable features from COVID-19 and viral pneumonia images and, then, refining the resulting sequential features using BiCuDNNLSTM. The proposed hybrid approach 2dCNN-BiCuDNNLSTM is used to select only relevant patterns and get rid of unimportant patterns. Experiments had been done with publicly available X-ray image datasets, to compare with the widely used DL algorithm, stacked 2dCNN. The results shows that the proposed approach attains better performances in classification accuracy, precision, and recall. The results of proposed model are highly accurate, as compared to the stacked CNN model, on the same datasets. The proposed model achieved the high accuracy score of 93% for the overall model, with 100% recall and 100% precision, in the case of COVID-19 classification. In the future, the proposed model will be developed to identify other known strains of viruses belonging to the COVID-19 family. The current results indicate that a deep learning model applied to chest X-rays with more data will be prominent in diagnosing COVID-19.
Author Contributions
Conceptualization, A.K. and S.C.; methodology, A.K.; software, A.K.; validation, A.K. and S.C.; formal analysis, A.K. and S.C.; investigation, A.K.; resources, A.K. and S.C.; data curation, A.K.; original draft writing, A.K.; writing—review and editing, A.K. and S.C.; visualization, A.K.; supervision, S.C.; project administration, S.C. All authors have read and agreed to the published version of the manuscript.
Funding
This research received Australian Academy of Science Regional Collaborations Programme grant funding (Grant No. 11285136981).
Institutional Review Board Statement
Not applicable.
Informed Consent Statement
Not applicable.
Data Availability Statement
The dataset of this research is publicly available on the website https://www.kaggle.com/datasets (accessed on 6 November 2021).
Conflicts of Interest
The authors declare no conflict of interest.
Abbreviations
The following abbreviations are used in this manuscript:
| DL | Deep Learning |
| 2dCNN | Two-Dimensional Convolutional Neural Network |
| BiCuDNNLSTM | Bidirectional CUDA Deep Neural Network Long Short Term Memory |
| RMSE | Root Mean Square Error |
| TP | True Positive |
| TN | True Negative |
| FP | False Positive |
| TN | True Negative |
| GPUs | Graphics Processor Unit |
| TPUs | Tensor Processing Units |
References
- Kesim, E.; Dokur, Z.; Olmez, T. X-ray Chest Image Classification by A Small-Sized Convolutional Neural Network. In Proceedings of the 2019 Scientific Meeting on Electrical-Electronics & Biomedical Engineering and Computer Science (EBBT), Istanbul, Turkey, 24–26 April 2019. [Google Scholar] [CrossRef]
- Zou, L.; Zheng, J.; Miao, C.; Mckeown, M.J.; Wang, Z.J. 3D CNN Based Automatic Diagnosis of Attention Deficit Hyperactivity Disorder Using Functional and Structural MRI. IEEE Access 2017, 5, 23626–23636. [Google Scholar] [CrossRef]
- Liu, C.; Cao, Y.; Alcantara, M.; Liu, B.; Brunette, M.; Peinado, J. TX-CNN: Detecting tuberculosis in chest X-ray images using convolutional neural network. In Proceedings of the 2017 IEEE International Conference on Image Processing (ICIP), Beijing, China, 17–20 September 2017. [Google Scholar] [CrossRef]
- Zhao, X.; Liu, L.; Qi, S.; Teng, Y.; Li, J.; Qian, W. Agile convolutional neural network for pulmonary nodule classification using CT images. Int. J. Comput. Assist. Radiol. Surg. 2018, 13, 585–595. [Google Scholar] [CrossRef] [PubMed]
- Chen, J.; Wang, Y.; Wu, Y.; Cai, C. An Ensemble of Convolutional Neural Networks for Image Classification Based on LSTM. In Proceedings of the 2017 International Conference on Green Informatics (ICGI), Fuzhou, China, 15–17 August 2017. [Google Scholar] [CrossRef]
- Li, P.; Tang, H.; Yu, J.; Song, W. LSTM and multiple CNNs based event image classification. Multimed. Tools Appl. 2021, 80, 30743–30760. [Google Scholar] [CrossRef]
- Chen, Y.; Jiang, H.; Li, C.; Jia, X.; Ghamisi, P. Deep Feature Extraction and Classification of Hyperspectral Images Based on Convolutional Neural Networks. IEEE Trans. Geosci. Remote Sens. 2016, 54, 6232–6251. [Google Scholar] [CrossRef] [Green Version]
- Apostolopoulos, I.D.; Bessiana, T.A. Covid-19: Automatic detection from X-ray images utilizing Transfer Learning with Convolutional Neural Networks. Phys. Eng. Sci. Med. 2020, 43, 635–640. [Google Scholar] [CrossRef] [Green Version]
- Wang, L.; Lin, Z.Q.; Wong, A. COVID-Net: A tailored deep convolutional neural network design for detection of COVID-19 cases from chest X-ray images. Sci. Rep. 2020, 10, 19549. [Google Scholar] [CrossRef]
- Afshar, P.; Heidarian, S.; Naderkhani, F.; Oikonomou, A.; Plataniotis, K.N.; Mohammadi, A. COVID-CAPS: A capsule network-based framework for identification of COVID-19 cases from X-ray images. Pattern Recognit. Lett. 2020, 138, 638–643. [Google Scholar] [CrossRef]
- Apostolopoulos, I.D.; Aznaouridis, S.I.; Tzani, M. Extracting Possibly Representative COVID-19 Biomarkers from X-ray Images with Deep Learning Approach and Image Data Related to Pulmonary Diseases. J. Med. Biol. Eng. 2020, 40, 462–469. [Google Scholar] [CrossRef]
- Zhao, W.; Jiang, W.; Qiu, X. Deep learning for COVID-19 detection based on CT images. Sci. Rep. 2021, 11, 14353. [Google Scholar] [CrossRef]
- Al-Waisy, A.S.; Mohammed, M.A.; Mohammed, M.A.; Al-Fahdawi, S.; Al-Fahdawi, S.; Maashi, M.; Zapirain, B.G.; Abdulkareem, K.H.; Mostafa, S.; Kumar, N.M.; et al. COVID-DeepNet Hybrid Multimodal Deep Learning System for Improving COVID-19 Pneumonia Detection in Chest X-ray Images. Comput. Mater. Contin. 2021, 67, 2409–2429. [Google Scholar] [CrossRef]
- Khuzani, A.Z.; Heidari, M.; Shariati, S.A. A comprehensive investigation of machine learning feature extraction and classification methods for automated diagnosis of COVID-19 based on X-ray images. Sci. Rep. 2021, 11, 9887. [Google Scholar] [CrossRef] [PubMed]
- Hu, S.; Gao, Y.; Niu, Z.; Jiang, Y.; Li, L.; Xiao, X.; Wang, M.; Fang, E.F.; Menpes-Smith, W.; Xia, J.; et al. Weakly Supervised Deep Learning for COVID-19 Infection Detection and Classification From CT Images. IEEE Access 2020, 8, 118869–118883. [Google Scholar] [CrossRef]
- Ozturk, T.; Talo, M.; Yildirim, E.A.; Baloglu, U.B.; Yildirim, O.; Acharya, U. Automated detection of COVID-19 cases using deep neural networks with X-ray images. Comput. Biol. Med. 2020, 121, 103792. [Google Scholar] [CrossRef]
- Muthumayil, K.; Buvana, M.; Sekar, K.R.; Amraoui, A.E.; Nouaouri, I.; Mansour, R.F. Optimized convolutional neural network for automatic detection of COVID-19. Comput. Mater. Contin. 2021, 70, 1159–1175. [Google Scholar] [CrossRef]
- Xue, Y.; Onzo, B.M.; Mansour, R.F.; Su, S. Deep Convolutional Neural Network Approach for COVID-19 Detection. Comput. Syst. Sci. Eng. 2022, 42, 201–211. [Google Scholar] [CrossRef]
- Ismael, A.M.; Kadir Şengür, A. Deep learning approaches for COVID-19 detection based on chest X-ray images. Expert Syst. Appl. 2021, 164, 114054. [Google Scholar] [CrossRef] [PubMed]
- Oh, Y.; Park, S.; Ye, J.C. Deep Learning COVID-19 Features on CXR Using Limited Training Data Sets. IEEE Trans. Med. Imaging 2020, 39, 2688–2700. [Google Scholar] [CrossRef]
- Biswas, S.; Dash, S. LSTM-CNN Deep Learning–Based Hybrid System for Real-Time COVID-19 Data Analysis and Prediction Using Twitter Data; Springer: Berlin/Heidelberg, Germany, 2021. [Google Scholar] [CrossRef]
- Jain, G.; Mittal, D.; Thakur, D.; Mittal, M.K. A deep learning approach to detect Covid-19 coronavirus with X-ray images. Biocybern. Biomed. Eng. 2020, 40, 1391–1405. [Google Scholar] [CrossRef]
- Hochreiter, S.; Schmidhuber, J. Long Short-Term Memory. Neural Comput. 1997, 9, 1735–1780. [Google Scholar] [CrossRef]
- Yadav, A.; Jhaa, C.K.; Sharanb, A. Optimizing LSTM for time series prediction in Indian stock market. Procedia Comput. Sci. 2019, 167, 2091–2100. [Google Scholar] [CrossRef]
- Aveleira-Mata, J.; Ondicol-Garcia, J.; Munoz-Castaneda, A.L.; Garcia, I.; Benavides, C. Multiclass Classification Procedure for Detecting Attacks on MQTT-IoT Protocol. Adv. Complex Syst. Their Appl. Cybersecur. 2019, 2019, 6516253. [Google Scholar] [CrossRef] [Green Version]
- Appleyard, J.; Kocisky, T.; Blunsom, P. Optimizing Performance of Recurrent Neural Networks on GPUs. 2016. Available online: http://xxx.lanl.gov/abs/1604.01946 (accessed on 31 December 2021).
- Sezer, O.B.; Gudelek, M.U.; Ozbayoglu, A.M. Financial time series forecasting with deep learning: A systematic literature review: 2005–2019. Appl. Soft Comput. 2020, 90, 106181. [Google Scholar] [CrossRef] [Green Version]
- Silva, P.; Luz, E.; Silva, G.; Moreira, G.; Silva, R.; Lucio, D.; Menotti, D. COVID-19 detection in CT images with deep learning: A voting-based scheme and cross-datasets analysis. Biocybern. Biomed. Eng. 2020, 20, 100427. [Google Scholar] [CrossRef] [PubMed]
Figure 1.
Research flow.

Figure 2.
2dCNN-BiCuDNNLSTM architecture.

Figure 3.
Dataset Sample.

Figure 4.
Training Process of 2dCNN-BiCuDNNLSTM.

Figure 5.
Classification Process of 2dCNN-BiCuDNNLSTM.

Figure 6.
Model’s training accuracy, with 64 epochs.

Figure 7.
Model’s training loss, with 64 epochs.

Figure 8.
Model’s training accuracy, with 128 epochs.

Figure 9.
Model’s training loss, with 128 epochs.

Figure 10.
Model’s training accuracy, with 256 epochs.

Figure 11.
Model’s training loss, with 256 epochs.

Figure 12.
Training accuracy versus validation accuracy of the proposed model.

Figure 13.
Model’s training accuracy, with 256 epochs.

Figure 14.
Model’s training loss, with 256 epochs.


Table 1.
Classification results of the proposed model.
| Precision | Recall | F1 Score | |
|---|---|---|---|
| COVID-19 | 100 | 100 | 100 |
| Normal | 94 | 80 | 86 |
| Viral Pneumonia | 83 | 95 | 88 |
| Accuracy | 93 | ||
| Macro Average | 92 | 92 | 92 |
| Weighted Average | 93 | 92 | 92 |
Table 2.
Training accuracy, validation accuracy, and test accuracy.
| Approach | Training Accuracy | Validation Accuracy | Test Accuracy |
|---|---|---|---|
| 2dCNN-BiCuDNNLSTM | 87 | 86 | 93 |
Table 3.
Classification results of proposed model and stacked 2dCNN model for COVID-19 cases.
| Approach | Accuracy | Precision | Recall | F1 Score |
|---|---|---|---|---|
| 2dCNN-BiCuDNNLSTM | 93 | 100 | 100 | 100 |
| 2dCNN | 38 | 58 | 96 | 72 |
Table 4.
Classification results of proposed model and stacked 2dCNN model for viral pneumonia cases.
Table 4.
Classification results of proposed model and stacked 2dCNN model for viral pneumonia cases.
| Approach | Accuracy | Precision | Recall | F1 Score |
|---|---|---|---|---|
| 2dCNN-BiCuDNNLSTM | 93 | 83 | 95 | 88 |
| 2dCNN | 38 | 37 | 93 | 53 |
Table 5.
Classification results of proposed model and stacked 2dCNN model for normal cases.
| Approach | Accuracy | Precision | Recall | F1 Score |
|---|---|---|---|---|
| 2dCNN-BiCuDNNLSTM | 93 | 94 | 80 | 86 |
| 2dCNN | 38 | 37 | 93 | 53 |
Table 6.
Classification results of proposed model and DarkCovidNet model [16].
Publisher’s Note: MDPI stays neutral with regard to jurisdictional claims in published maps and institutional affiliations. |
© 2022 by the authors. Licensee MDPI, Basel, Switzerland. This article is an open access article distributed under the terms and conditions of the Creative Commons Attribution (CC BY) license (https://creativecommons.org/licenses/by/4.0/).
Share and Cite
MDPI and ACS Style
Kanwal, A.; Chandrasekaran, S. 2dCNN-BiCuDNNLSTM: Hybrid Deep-Learning-Based Approach for Classification of COVID-19 X-ray Images. Sustainability 2022, 14, 6785. https://doi.org/10.3390/su14116785
AMA Style
Kanwal A, Chandrasekaran S. 2dCNN-BiCuDNNLSTM: Hybrid Deep-Learning-Based Approach for Classification of COVID-19 X-ray Images. Sustainability. 2022; 14(11):6785. https://doi.org/10.3390/su14116785
Chicago/Turabian StyleKanwal, Anika, and Siva Chandrasekaran. 2022. "2dCNN-BiCuDNNLSTM: Hybrid Deep-Learning-Based Approach for Classification of COVID-19 X-ray Images" Sustainability 14, no. 11: 6785. https://doi.org/10.3390/su14116785
Note that from the first issue of 2016, this journal uses article numbers instead of page numbers. See further details here.