
Impact of the Number of Hours Spent at Home on the Volume of Municipal Waste Generated: Evidence from Tokyo during the COVID-19 Pandemic


Graduate School of Humanities and Social Sciences, Saitama University, 255 Shimo-Okubo, Sakura-ku, Saitama 338-8570, Japan
Sustainability 2022, 14(10), 6165; https://doi.org/10.3390/su14106165
Submission received: 25 April 2022
/
Revised: 12 May 2022
/
Accepted: 18 May 2022
/
Published: 19 May 2022
(This article belongs to the Special Issue Effects of the COVID-19 Pandemic on Natural Resource Markets)
Abstract
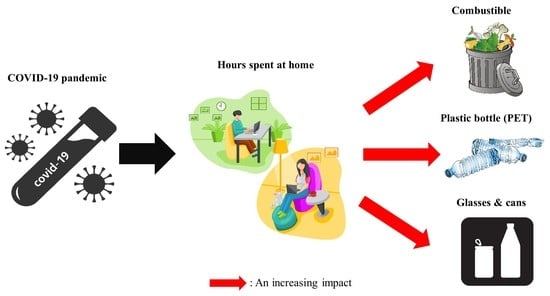
:This study explores how changes in hours spent at home during the COVID-19 pandemic (February 2020–February 2022) affected the volume of municipal waste generated by households. Applying autoregressive distributed lag (ARDL) to a time series model created to measure the volume of combustible waste, recyclable plastic, plastic bottles, glasses and cans, and used paper, this study finds that an increase in the number of hours spent at home elevated the amount of combustible waste, recyclable plastic bottles, and glass bottles and cans generated. The increase in the volume of waste during the pandemic tended to be related to increased demand for delivery and take-out containers, and the increase in combustible waste was likely caused by a surge in the use of unrecyclable plastic containers. Thus, the results of the study suggest the importance of enhancing the use of recyclable containers and the need for support to develop ways to spread the use of such containers.
1. Introduction
Following the initial outbreak of the COVID-19 pandemic, social distancing has been used as one of the major nonpharmacological measures for controlling the spread of the virus [1]. Among the social distancing measures implemented, studies suggest the effectiveness of stay-at-home policies for reducing human mobility [2,3,4]. Although stay-at-home measures have demonstrated their effectiveness in controlling the viral transmission of COVID-19, they may have adverse effects—at least in the short term—on supply chains, employment, and the consumption of goods and services [5].
A study based on US consumers has shown that, during the COVID-19 pandemic, many perceived food from grocery stores and homes as being safer than food from restaurants [6]. More consumers began to eat at home due to fear of getting infected when eating outside the home, not only because of restaurant closures. Another study investigating changes in food consumption patterns using an online survey has found that the number of households using grocery delivery and take-out services increased during the pandemic [7].
As lockdown measures during the pandemic led to a surge in demand for home delivery and take-out services, studies indicate an increase in the amount of plastic packaging waste generated [8,9]. An increase in the use of glass bottles and cans generated from households can be expected during the pandemic since people will begin to drink at home instead of at bars and restaurants when stay-at-home orders are announced. Thus, it is expected that changes in human mobility amid COVID-19 prevention measures will cause a tremendous impact on the volume of household waste disposal. Although there are studies investigating the effect of the COVID-19 pandemic on waste, most of them apply qualitative methods due to data limitations [10,11,12] or rely on the survey method [7,9]. Little research with non-survey data has been carried out on the way in which changes in the level of human mobility during the COVID-19 pandemic impacted the level of household waste.
Although there are studies investigating the effects of stay-at-home orders during the COVID-19 pandemic on food [13], gasoline [14], psychological outcomes [15], CO2 emissions [16], and other variables, none have examined how changes in the time spent at home due to human mobility restriction measures impacted the volume of waste generated. The current study fills this research gap by investigating how levels of different types of municipal waste were affected by changes in the number of hours spent at home during the COVID-19 pandemic. For this purpose, the study used monthly data on five types of waste generated by households in Minato City, one of the three central wards of Tokyo. The study examines the effect of changes in time spent at home on combustible wastes (which include burnable waste such as kitchen waste), uncleanable plastics, and unrecyclable paper, as well as recyclable waste collected by municipal services, such as bottles, cans, and paper. Thus, the study results provide vital information for understanding which types of waste are likely to surge when the number of hours spent at home increases. Furthermore, this study can offer insights to help local governments conduct effective waste management during a pandemic.
2. Volume of Municipal Waste and the Stay-At-Home Index
Minato City was selected as the site for testing the effects of the COVID-19 pandemic on waste volume because other municipals of Tokyo only had annual data available. As most of the severe restriction measures in Tokyo during the pandemic only lasted a few months, it would have been difficult to capture frequent changes in waste volume using annual data. Hence, the study focused on the case of Minato City, where monthly data were available. The study used monthly data from February 2020 to February 2021, which include the periods when Tokyo was under a state of emergency (SOE) or quasi-SOE. Table 1 summarizes the terms when Tokyo was under the SOE and quasi-SOE. Restaurants were required to shorten their business hours under both the SOE and quasi-SOE, while bars and restaurants were prohibited from serving alcohol. Data on municipal waste volumes were obtained from the homepage of Minato City [17], which only provides information on wastes generated from households. Business waste was excluded, as waste from companies is considered industrial waste and is not collected by the city.
Because an increase in waste from food and beverage containers used for delivery and take-out services was expected during the COVID-19 pandemic, this study investigated the effects of changes in human mobility on the volume generated in the five waste categories most likely to be affected: combustible waste, recyclable plastic, plastic bottles, glass bottles and cans, and recyclable used paper. Another reason for focusing on these five items is that according to the latest report by Minato City [18], these items consisted on average of over 97% of all municipal waste generated by the households in the city in 2018 (72% was combustible waste, 9% recyclable plastic and plastic bottles, 0.4% glass bottles and cans, and 16% recyclable used paper). For each of these categories, Minato City provides data for the volume of household waste collected by the city each month in tonnes. These five waste categories are further explained in Table 2. On 29 May 2020, Minato City requested its residents to reduce waste, as the amount of waste generated by households increased during the first SOE period [19].
It should be noted that in most of the municipals of Japan plastics with stains are categorized as combustible waste; only plastics without stains are collected as recyclable plastic. Furthermore, recyclable plastic bottles are collected separately. In Japan, these plastic bottles are made of polyethylene terephthalate (PET) and are widely used for holding non-alcoholic beverages and other liquids. The use of this type of waste likely increased during the pandemic as people consumed more beverages at home.
For data regarding changes in the hours people spent at home during the pandemic, the residential index provided by Google LLC [20] was used. As shown in Table 2, this index presents changes in the number of hours spent at home by the residents of Tokyo relative to a baseline day, which is the median value between 3 January and 6 February 2020.
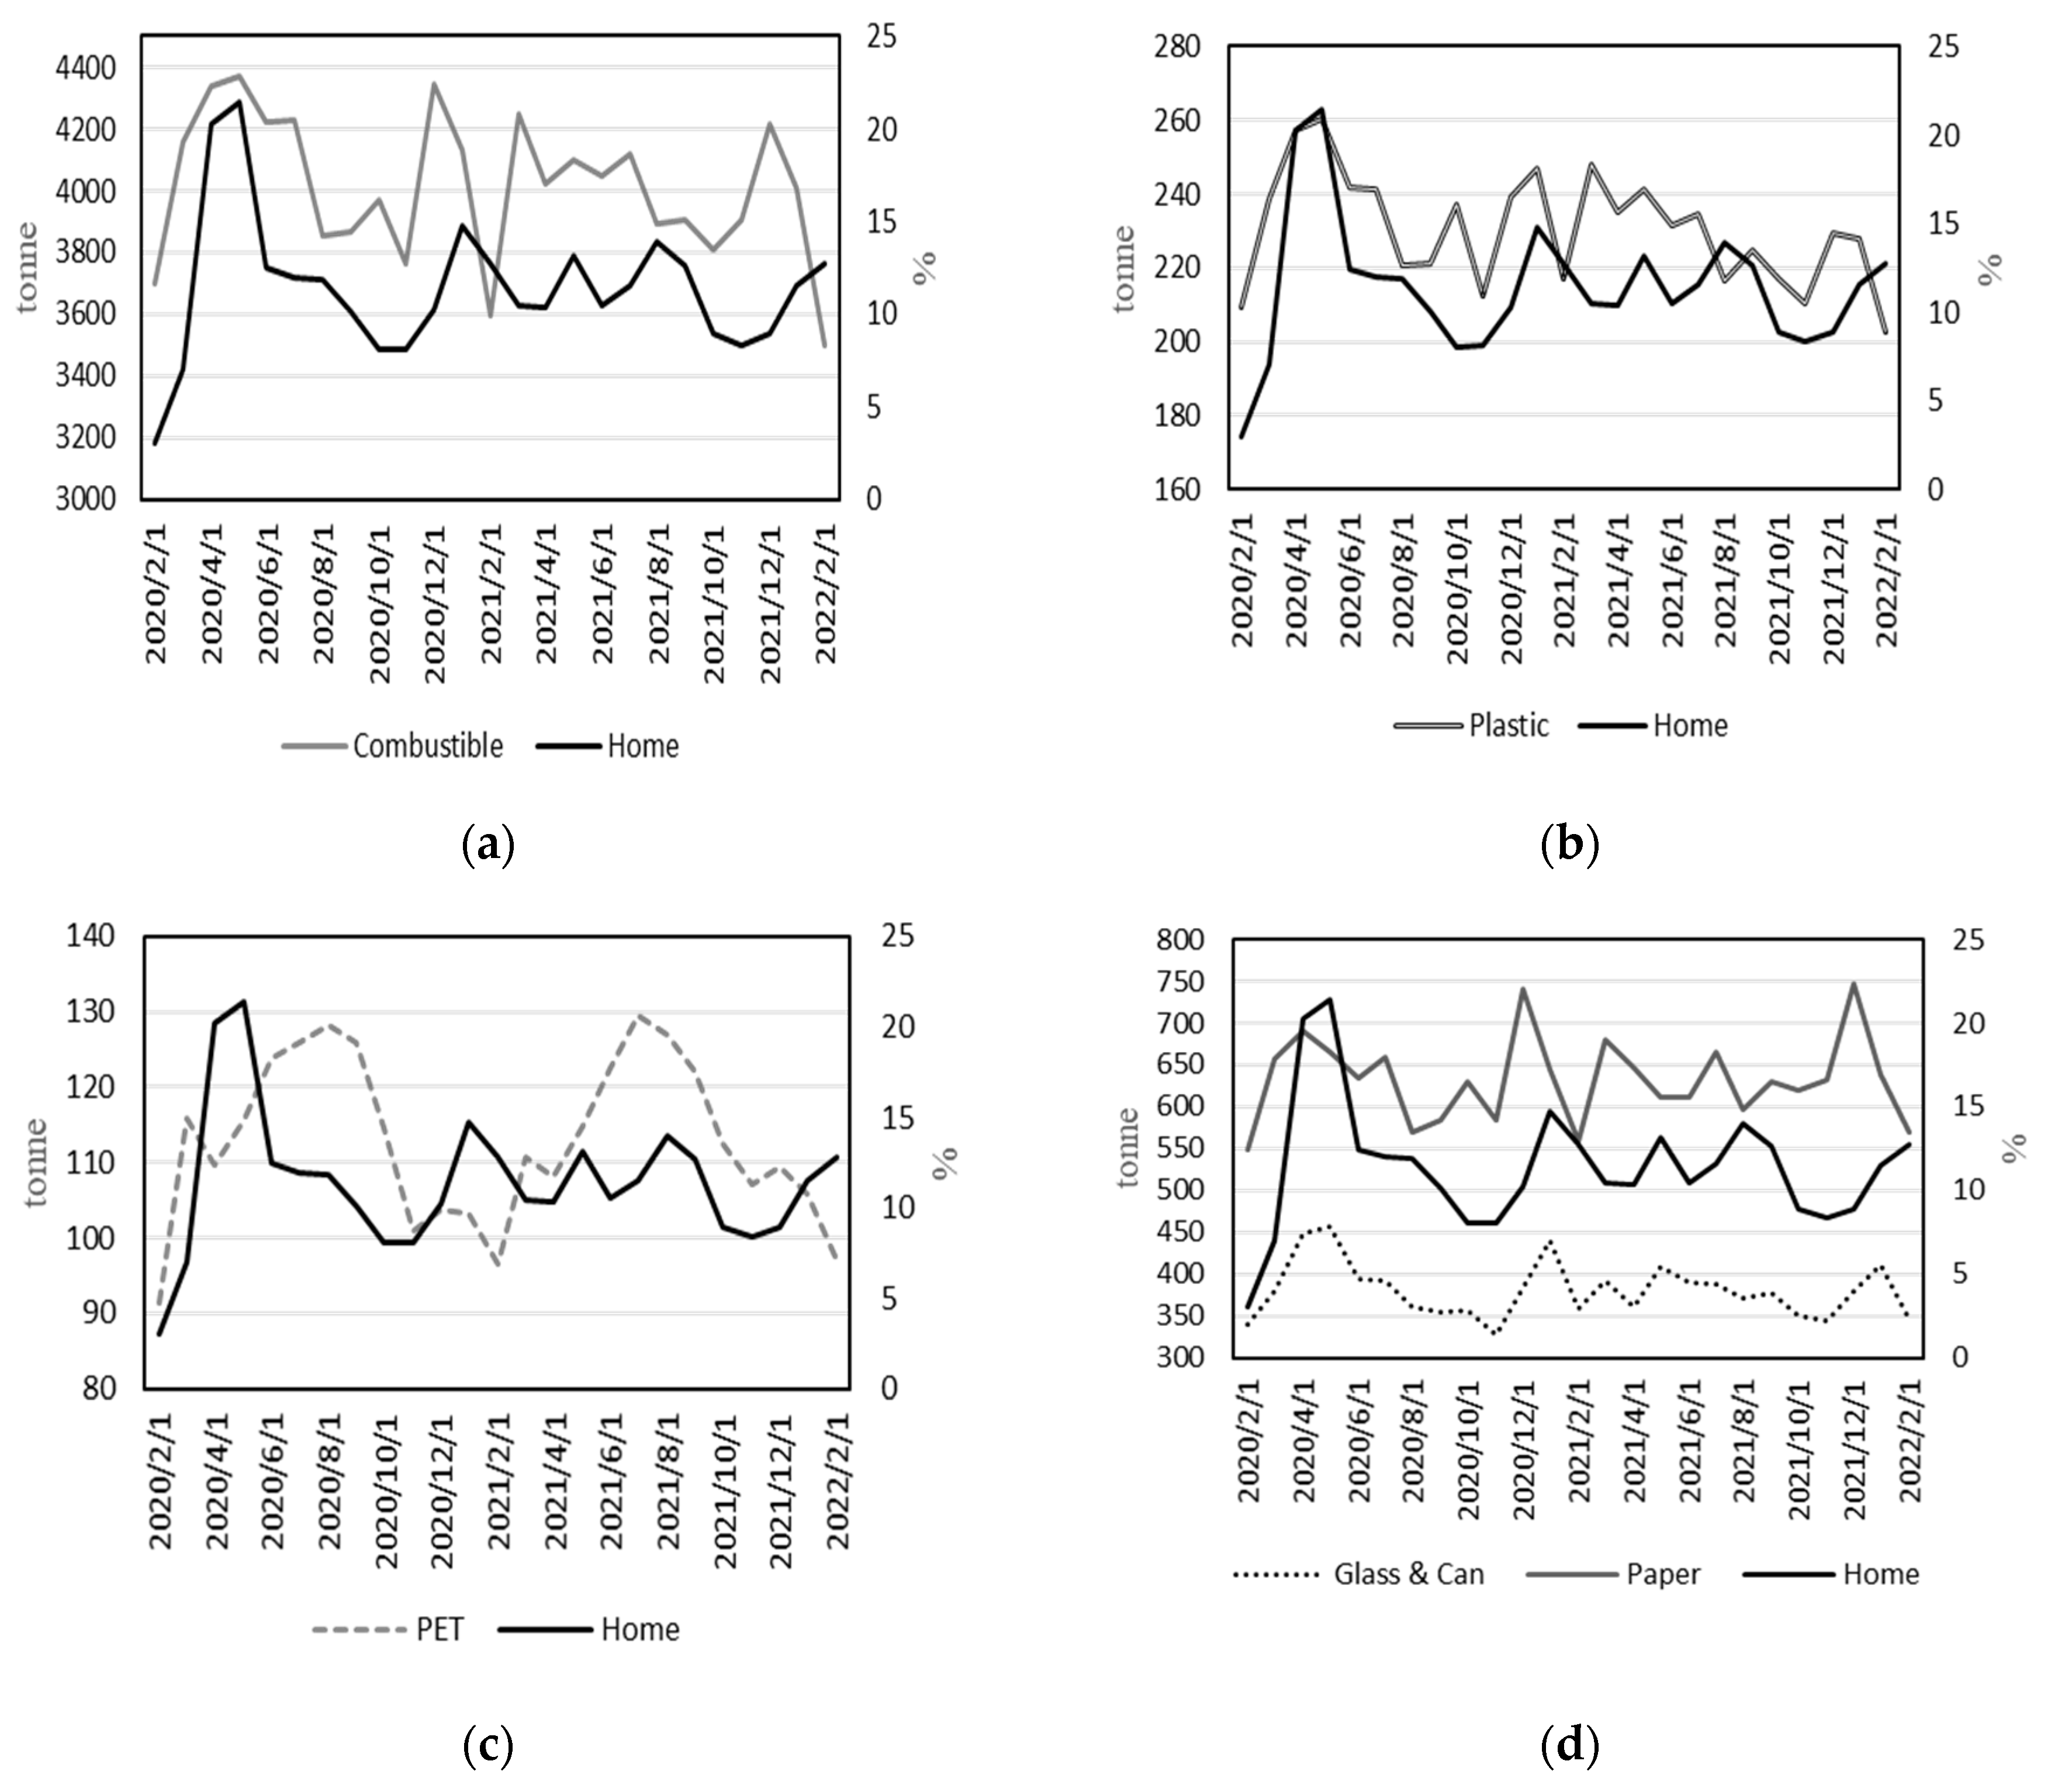
Figure 1 illustrates the data analyzed in the study presented separately by the five waste categories. It is evident from the figure that the number of stay-at-home hours increased the most during the first SOE period (7 April–25 May 2020), and the volume of waste increased for all categories accordingly.
Finally, in order to determine whether the volume of waste changed after the COVID-19 pandemic, Table 3 illustrates the summary statistics for the volume of waste for the periods before and after the pandemic. The table compares the descriptive statistics for the sample data 25 months before the study period with those for the sample period. It is discernible from the table that, except for combustible waste, the means for all waste types are higher for the period after the pandemic. Furthermore, the volatilities of the sample period are higher in all wastes except for PET. These increases in both the mean level and volatility of the volume of waste imply that the volume of waste in Minato City was likely affected by the COVID-19 pandemic.
3. Methods
The following model was built to test the impact of changes in the number of hours spent at home during the COVID-19 pandemic on municipal waste volume:
where waste is one of the total volumes of the types of monthly municipal disposals investigated in the study, home is the percentage change in the hours spent at home, and SOE is a dummy variable capturing the period when Tokyo was under the SOE. As not all periods covered in the study fell under the SOE, the SOE dummy variable captures the direct impact, if any, from the periods under the SOE; and are the coefficient parameters of the independent variables, and is the error term of the model. Equation (1) is based on the model developed by Aruga et al. [16] for analyzing the influence of human mobility indices on CO2 emissions.
Due to the lack of high-frequency data for the volume of waste, this study used monthly data; the analyses therefore had to be performed on a relatively small sample. As the autoregressive distributed lag (ARDL) model is known to provide reliable estimations for a small sample size, the model presented in Equation (1) was estimated with this model. The ARDL model can help lessen omitted variables and auto-correlation problems [21]. It is a useful method for testing both the short-run and long-run influence of the independent variable on the dependent variable.
Based on Equation (1), the ARDL (m, n) unrestricted error correction model can be expressed as
where m is the lag order for electricity demand and n is the lag order for the stay-at-home index. For each of the five waste categories, the model presented in Equation (2) was estimated in order to examine the short-run and long-run impacts of the stay-at-home index on the volume of waste.
The order of integration, (I(d)), of the time series variables examined the need for processes to be either I(0) or I(1) in order for the ARDL model to be applied. To confirm this, the Augmented Dickey–Fuller (ADF) and Kwiatkowski–Phillips–Schmidt–Shin (KPSS) tests were initially conducted as conventional unit root tests. These tests were performed by including both the intercept and trend in the test models. In addition to these stationarity tests, the Zivot–Andrews (ZA) unit root test with a trend break was applied in order to investigate the order of integration of the variables when the effect of a structural break in the time series data was being considered. The results of the unit root tests are depicted in Table 4. The study confirmed that all the test variables were either I(0) or I(1), satisfying the precondition for performing the ARDL model.
Before finalizing the estimation models, the residuals and stability of the models were checked. The Breusch–Godfrey (BG) and Breusch–Pagan–Godfrey (BPG) tests were applied to check for autocorrelation and heteroskedasticity in the residuals for the five waste models. The test results are illustrated in Table 5, which show that none of the test statistics became significant. This indicates that all of our waste models were free from autocorrelation and heteroskedasticity issues.
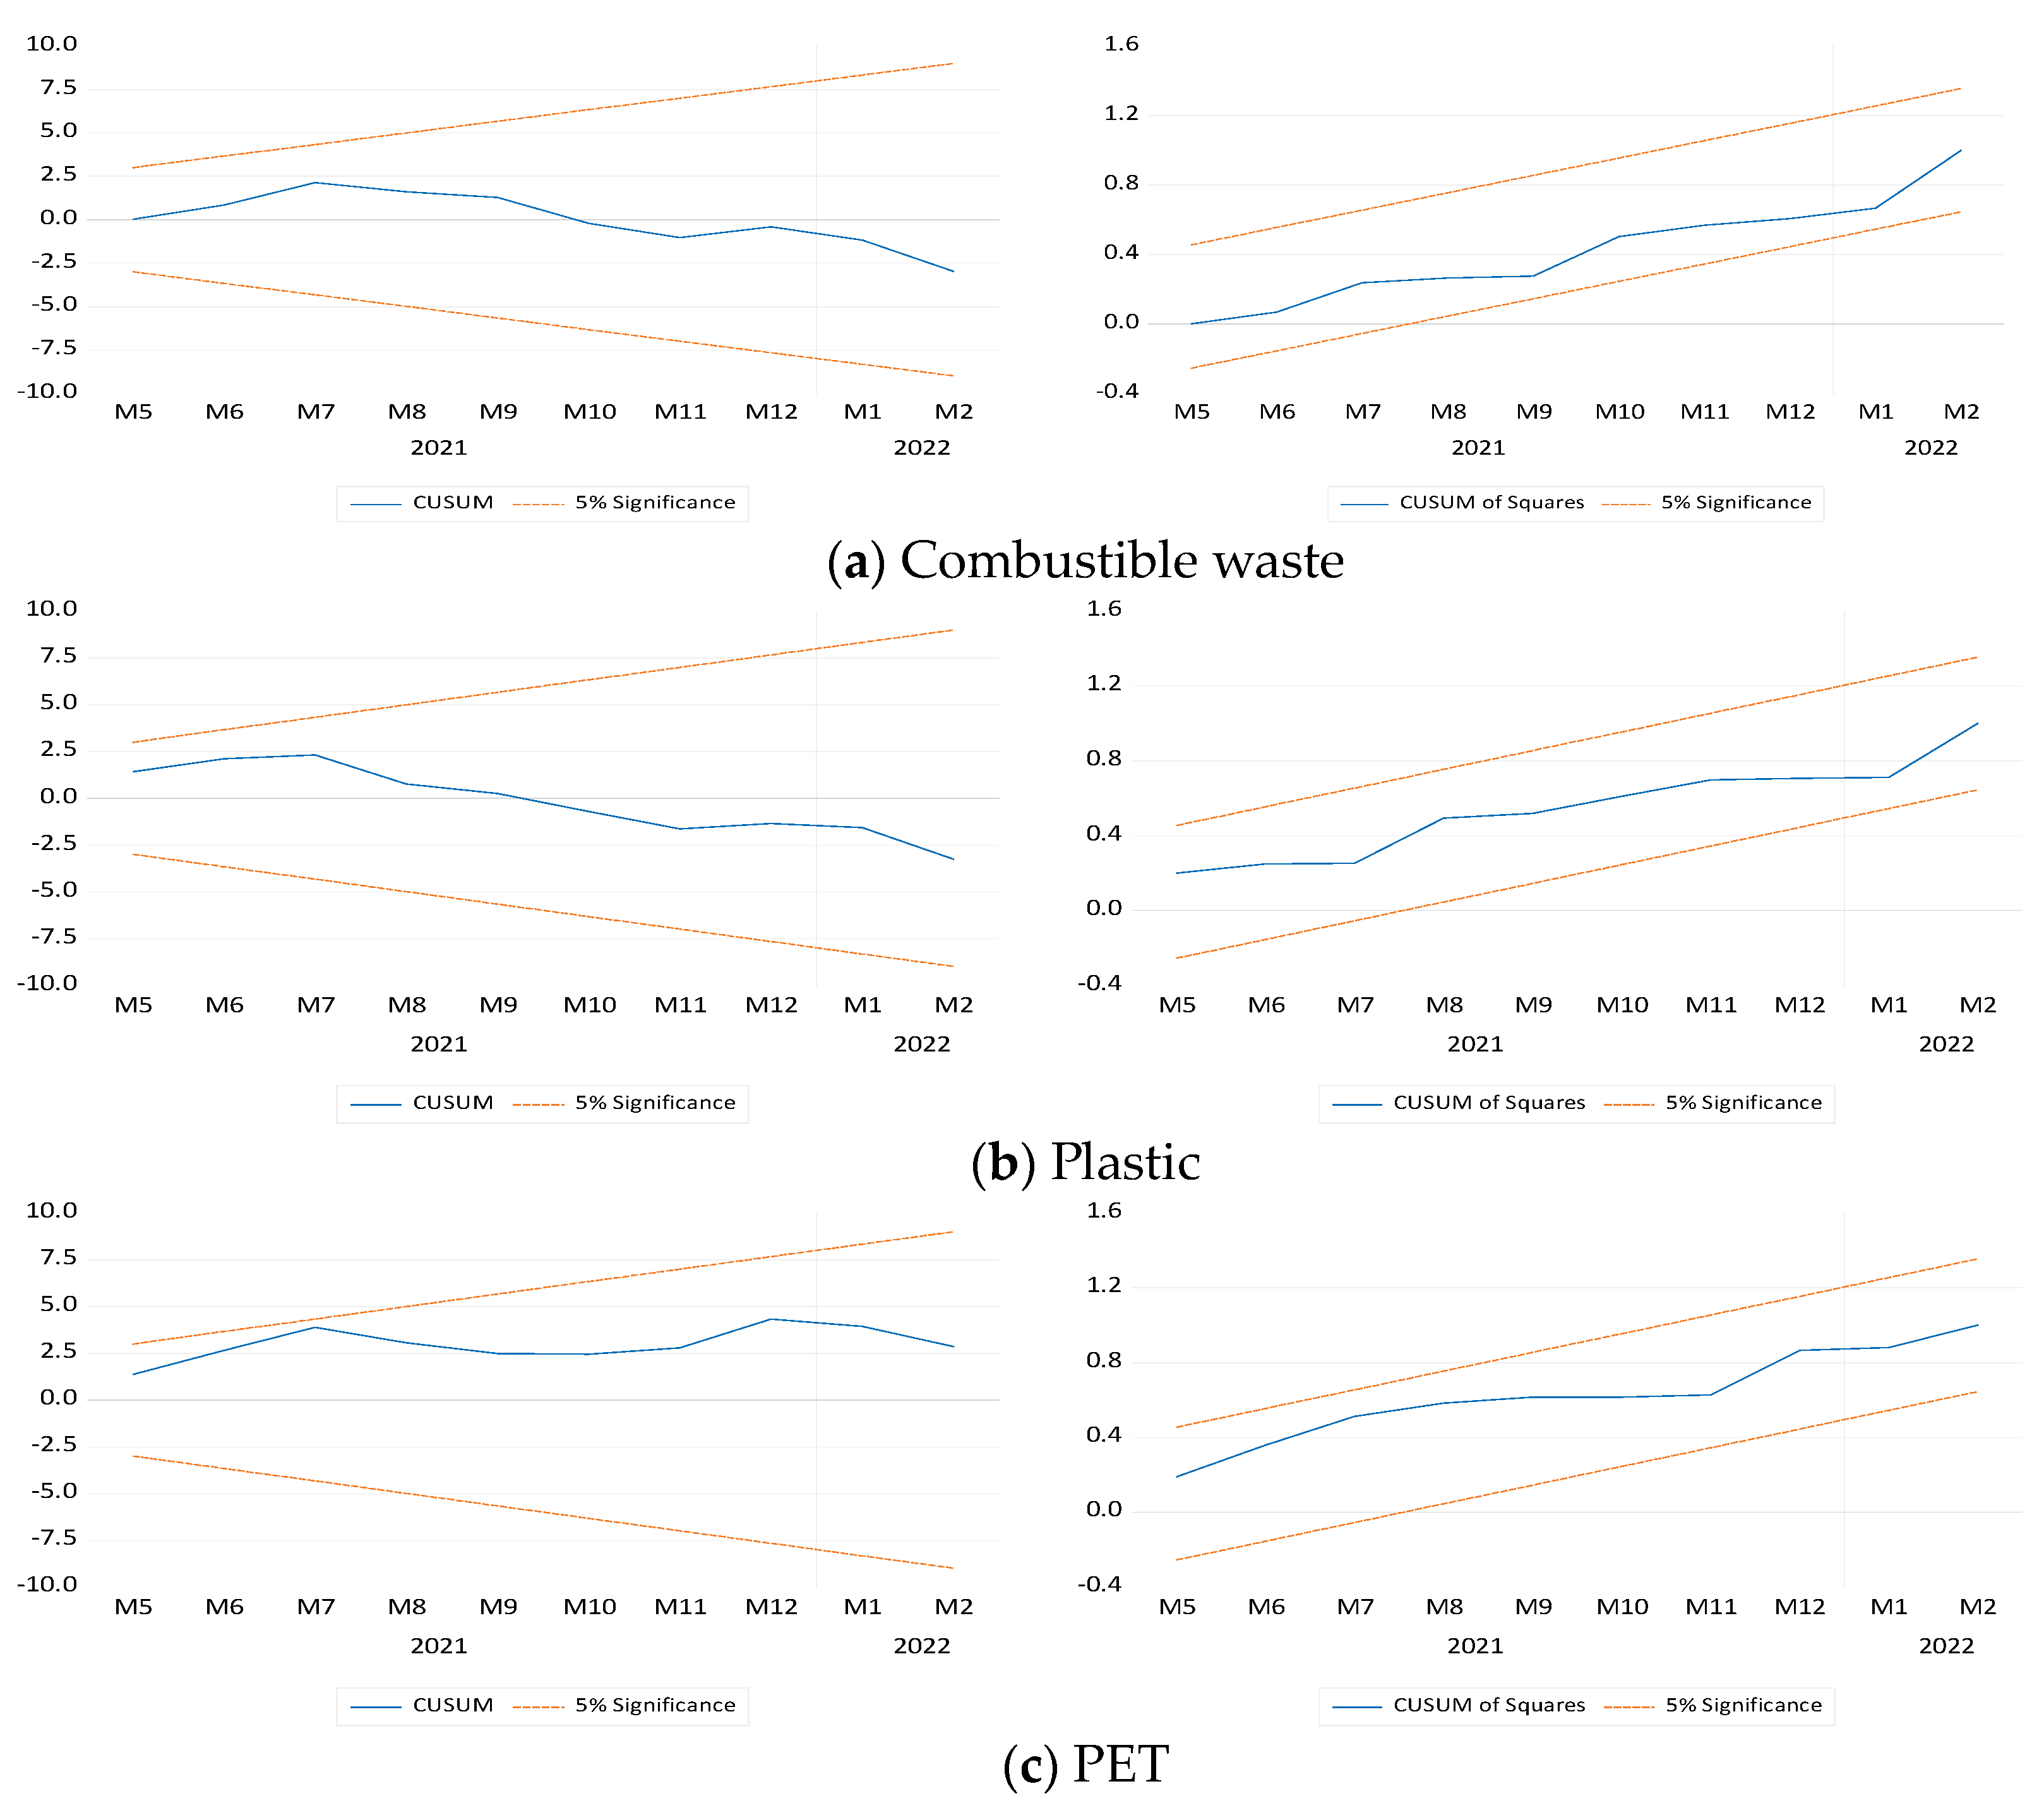
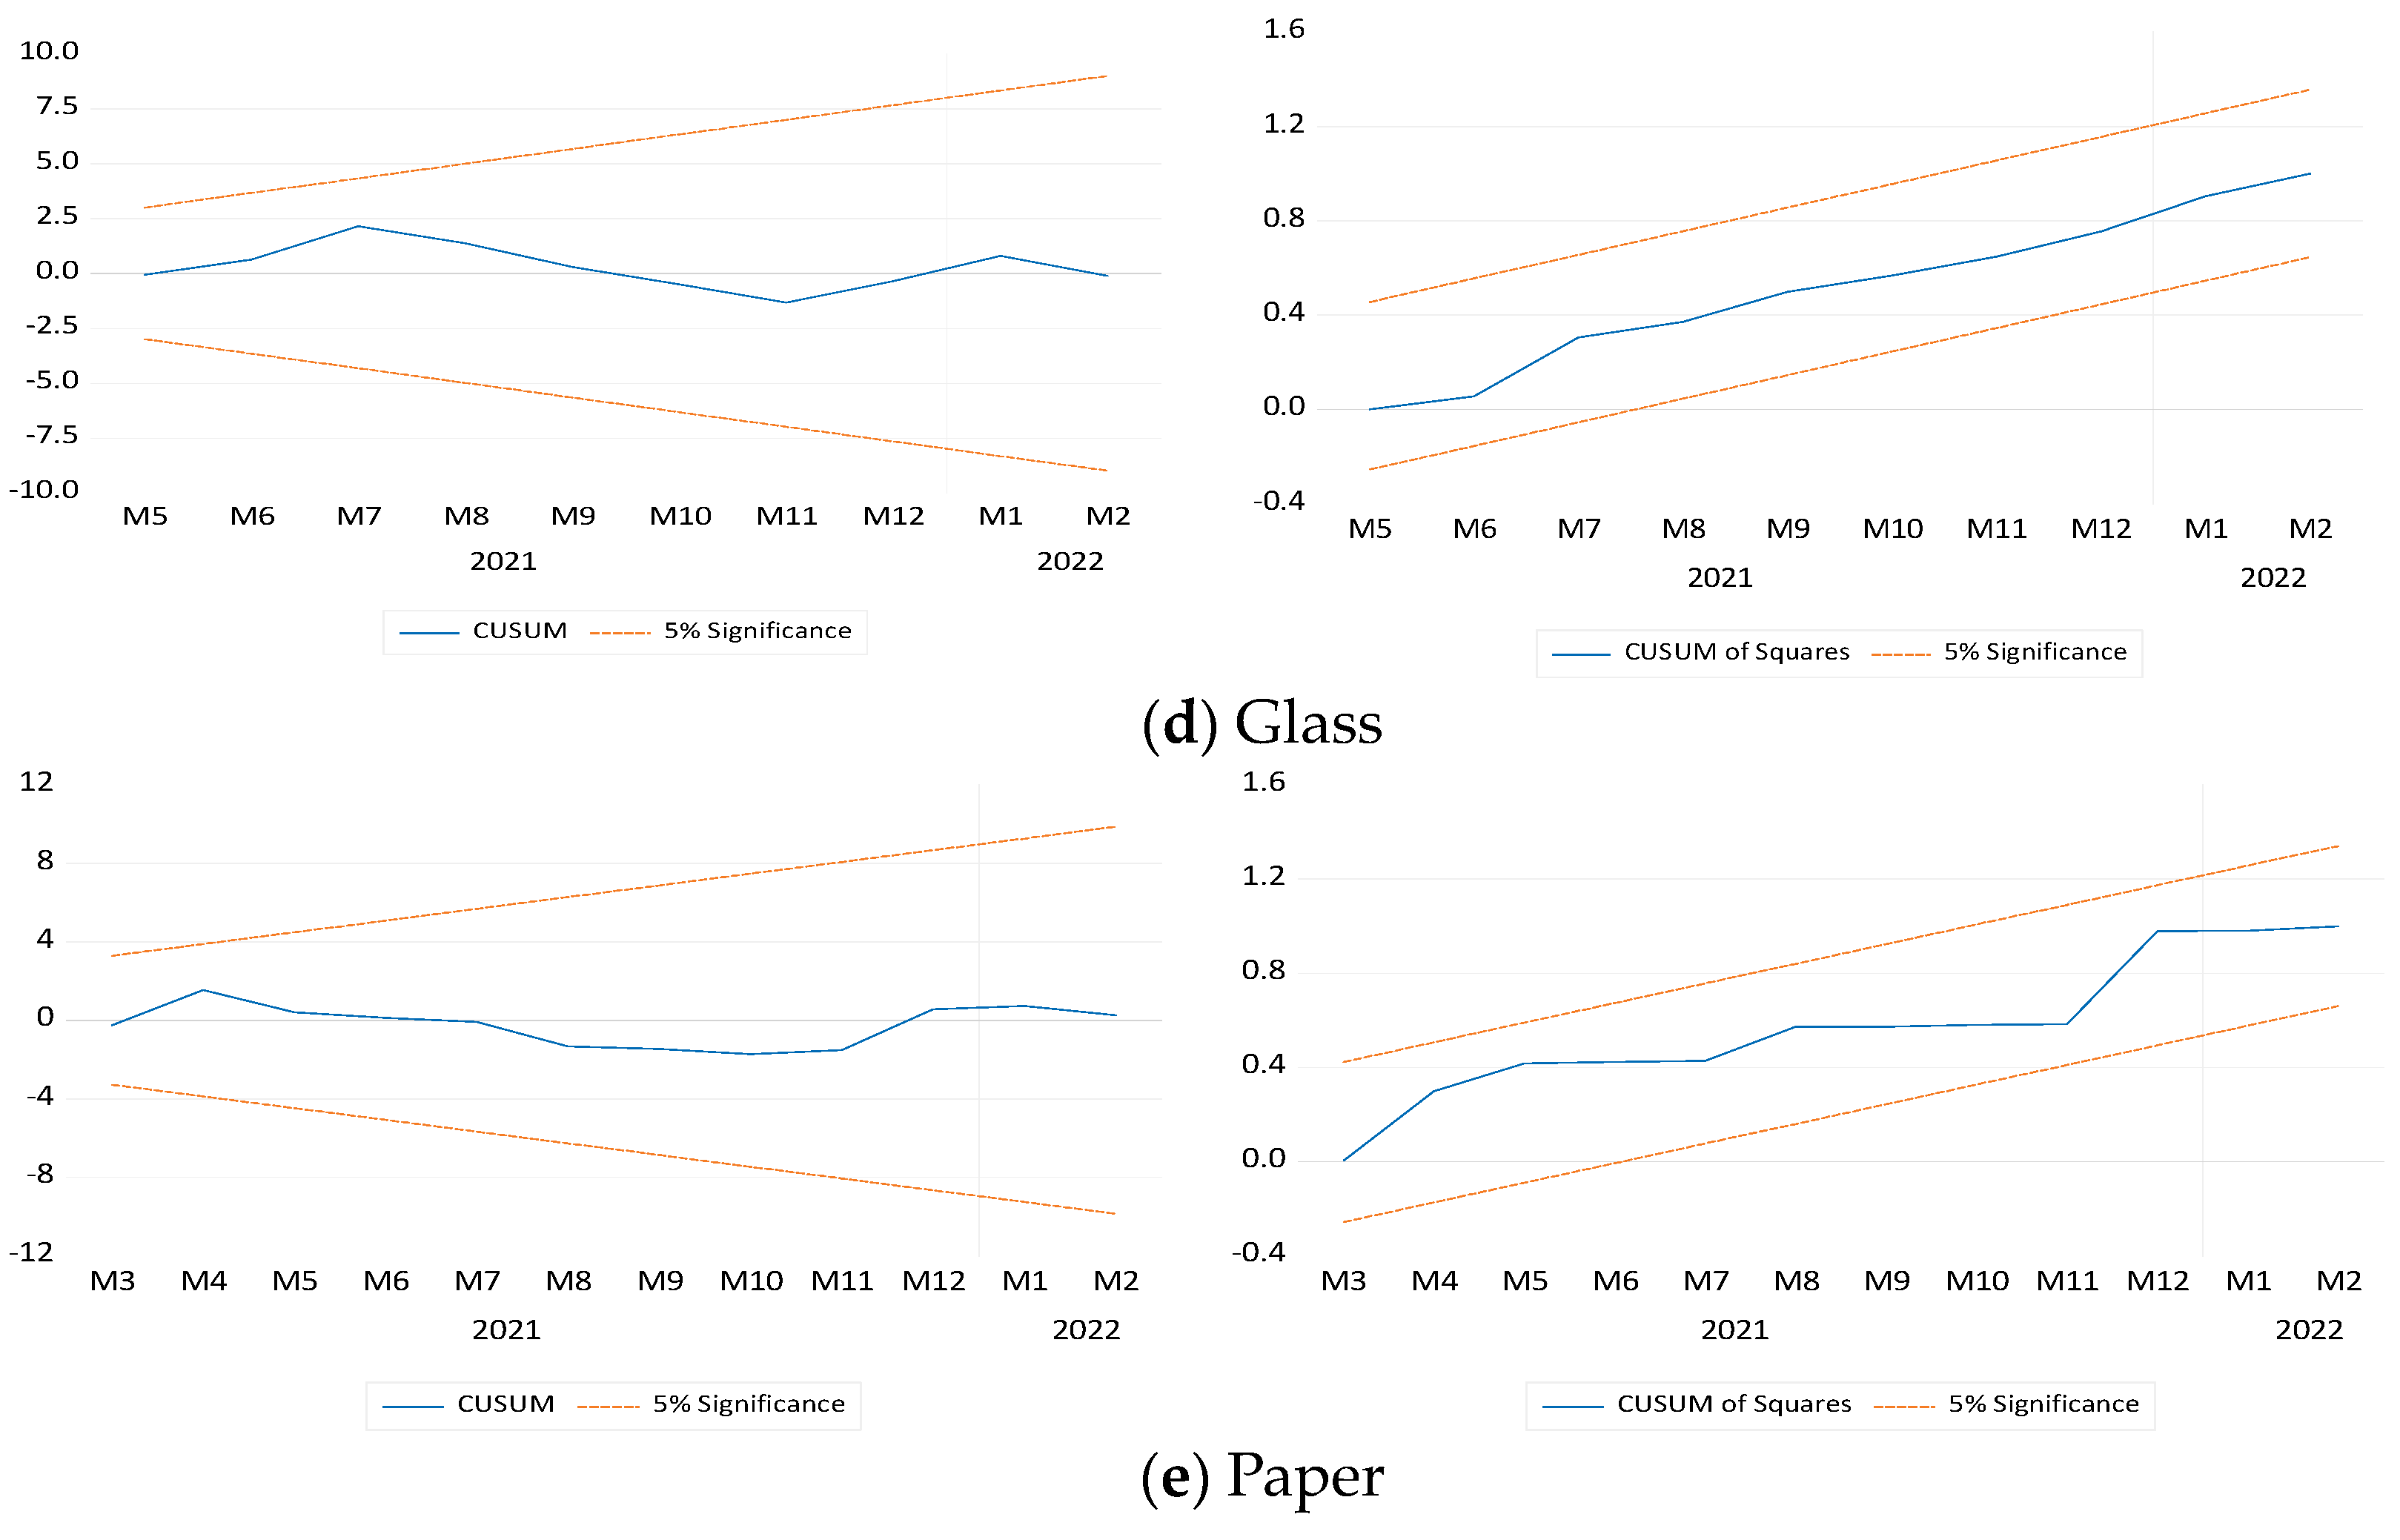
In order to assess the stability of the model coefficients, the cumulative sum (CUSUM) and cumulative sum of squares (CUSUM-square) tests were performed. Figure 2 illustrates these results for the five waste models. It was confirmed that all of the estimated models fell within a 5% significance threshold, indicating that all test models satisfied the stability condition.
4. Results and Discussion
To examine the existence of a cointegration relationship between waste volume and the stay-at-home index, the ARDL bound test was performed. The results presented in Table 6 suggest that except for recyclable plastic waste, all waste types investigated in the study had a cointegration relationship with the stay-at-home index.
The ARDL unrestricted error correction model was then estimated to determine the effects of the short-run and long-run impacts of the stay-at-home index on waste volumes. Table 7 depicts the results of the ARDL short-run and long-run estimations, which show that the stay-at-home index did not have a statistically significant impact on recyclable plastic and used paper. As the plastic model did not have a cointegration relationship, the result for the long-run coefficient of the stay-at-home index for the plastic model is consistent with the results in Table 6. However, the long-run coefficient for the stay-at-home index did not become significant in the paper model, suggesting that the cointegration relationship in this model only held for factors other than changes in the number of hours spent at home. Because recyclable plastic waste includes only plastic without stains, a fair amount of the plastic containers for food packaging fall under the combustible waste category. Thus, the increase in the use of plastic as the demand for delivery and take-out plastic containers rose might have only added to the amount of combustible waste. It could be that changes in stay-at-home hours did not have much impact on the volume of recyclable plastic. A similar reason might apply to the amount of recycled paper not being affected by the changes in the hours spent at home. As paper with food residue is not recycled, it could be that paper packages used for food delivery and take-out services only added to the amount of combustible waste and did not have much effect on recycled paper waste.
Meanwhile, the volume of combustible waste, recyclable plastic bottles, and glass bottles and cans increased as the stay-at-home index rose. A 1% increase in the stay-at-home index increased combustible waste to 46 tonnes during the period of investigation, suggesting that more combustible waste was generated as time spent at home increased. The positive influence of the stay-at-home index on combustible waste might imply that more people used delivery and take-out services instead of eating at restaurants during the SOE periods, which contributed to an increase in non-recycled plastic and paper waste.
The stay-at-home index had a statistically positive effect on the volume of recyclable plastic bottles as well as on that of glass bottles and cans. A report on changes in drinking style during the COVID-19 pandemic suggests that consumer demand shifted from drinking at bars and restaurants to drinking at home [22]. Hence, it is probable that the SOE led to a surge in home drinking demand and that the amount of recyclable plastic bottles, and of glass bottles and cans generated from households increased during the COVID-19 pandemic.
Finally, Table 7 presents the short-run impacts, depicting the effects of changes in stay-at-home hours on the volume of waste generated monthly. It is apparent from the result that the stay-at-home index only had a short-run effect on recyclable glass bottles and cans, based on the 5% significance level. Although only significant at the 10% level, the percentage increase in the stay-at-home index had a positive influence on the volume of recyclable plastic bottles generated as waste. These results imply that as the number of people leaving their homes declined during the COVID-19 pandemic, more consumers ate and drank in their homes, which led to more recyclable glass bottles and cans being disposed of.
5. Conclusions
After the outbreak of the COVID-19 pandemic, many countries implemented confinement measures to enforce social distancing and restrict human mobility. Such restrictive measures can be expected to have caused changes in consumption behaviors; the dramatic decline in eating and drinking at restaurants and bars, for instance, affected the volume of municipal waste generated during the COVID-19 pandemic. Assuming that changes in human mobility affect the volume of waste generated during the pandemic, this study investigated the impact of the increase in the number of hours spent at home on the volume of waste generated based on a case study of Minato City, Tokyo, Japan.
The study reveals that an increase in time spent at home during the pandemic likely led to an increase in the volume of combustible waste, PET, and recyclable glass bottles and cans generated by the households of Minato City. The reason that the amount of combustible waste grew when time spent at home increased is likely because the use of food delivery and take-out services increased as people stayed at home more. This result can be related to a previous study suggesting that plastic and paper packaging increased along with demand for food delivery services during the COVID-19 pandemic [23]. As Minato City does not accept soiled plastic as a recyclable material, plastic packages and containers with food residue are disposed of as combustible waste. Similarly, it is believable that the increase in PET and recyclable glass bottles and cans found in this study is related to increased beverage consumption at home; as the number of hours spent at home rose, people preferred to drink at home rather than outside.
An increase in recycled glass bottles and cans during the pandemic will not have a major environmental impact compared to the increase in non-recyclable plastic waste contributing to combustible waste, as the recycling ratio for glass bottles and cans has long been relatively high in Japan. The main issue with the increase in demand for plastic containers with the number of stay-at-home hours is the reduction in the use of non-recyclable plastic containers. Thus, this study highlights the importance of increasing the number of commercial establishments that allow customers to bring their own reusable containers. In addition, it is important for stores to find ways to promote the use of recyclable food containers that do not add to combustible waste. It is thus imperative that consumers support establishments that decide to shift to using more reusable and recyclable materials.
Funding
This research received no external funding.
Informed Consent Statement
Not applicable.
Data Availability Statement
The data on the volume of waste generated from Minato City were obtained from https://www.city.minato.tokyo.jp/unei/kurashi/gomi/seso/toke/seso/index.html (accessed 14 April 2022). The residential change index for Tokyo is available at https://www.google.com/covid19/mobility (accessed on 6 February 2022).
Conflicts of Interest
The authors declare no conflict of interest.
References
- Fu, X.; Zhai, W. Examining the spatial and temporal relationship between social vulnerability and stay-at-home behaviors in New York City during the COVID-19 pandemic. Sustain. Cities Soc. 2021, 67, 102757. [Google Scholar] [CrossRef] [PubMed]
- Abouk, R.; Heydari, B. The Immediate Effect of COVID-19 Policies on Social-Distancing Behavior in the United States. Public Health Rep. 2021, 136, 245–252. [Google Scholar] [CrossRef] [PubMed]
- Sen-Crowe, B.; McKenney, M.; Elkbuli, A. Social distancing during the COVID-19 pandemic: Staying home save lives. Am. J. Emerg. Med. 2020, 38, 1519–1520. [Google Scholar] [CrossRef] [PubMed]
- Vokó, Z.; Pitter, J.G. The effect of social distance measures on COVID-19 epidemics in Europe: An interrupted time series analysis. GeroScience 2020, 42, 1075–1082. [Google Scholar] [CrossRef] [PubMed]
- Brodeur, A.; Gray, D.; Islam, A.; Bhuiyan, S. A literature review of the economics of COVID-19. J. Econ. Surv. 2021, 35, 1007–1044. [Google Scholar] [CrossRef] [PubMed]
- Byrd, K.; Her, E.; Fan, A.; Almanza, B.; Liu, Y.; Leitch, S. Restaurants and COVID-19: What are consumers’ risk perceptions about restaurant food and its packaging during the pandemic? Int. J. Hosp. Manag. 2021, 94, 102821. [Google Scholar] [CrossRef] [PubMed]
- Chenarides, L.; Grebitus, C.; Lusk, J.L.; Printezis, I. Food consumption behavior during the COVID-19 pandemic. Agribusiness 2021, 37, 44–81. [Google Scholar] [CrossRef] [PubMed]
- Sharma, H.B.; Vanapalli, K.R.; Cheela, V.R.S.; Ranjan, V.P.; Jaglan, A.K.; Dubey, B.; Goel, S.; Bhattacharya, J. Challenges, opportunities, and innovations for effective solid waste management during and post COVID-19 pandemic. Resour. Conserv. Recycl. 2020, 162, 105052. [Google Scholar] [CrossRef] [PubMed]
- Leal Filho, W.; Voronova, V.; Kloga, M.; Paço, A.; Minhas, A.; Salvia, A.L.; Ferreira, C.D.; Sivapalan, S. COVID-19 and waste production in households: A trend analysis. Sci. Total Environ. 2021, 777, 145997. [Google Scholar] [CrossRef] [PubMed]
- Penteado, C.S.G.; de Castro, M.A.S. COVID-19 effects on municipal solid waste management: What can effectively be done in the Brazilian scenario? Resour. Conserv. Recycl. 2021, 164, 105152. [Google Scholar] [CrossRef] [PubMed]
- Sarkodie, S.A.; Owusu, P.A. Impact of COVID-19 pandemic on waste management. Environ. Dev. Sustain. 2021, 23, 7951–7960. [Google Scholar] [CrossRef] [PubMed]
- Yousefi, M.; Oskoei, V.; Jonidi-Jafari, A.; Farzadkia, M.M.; Hasham-Firooz, M.; Abdollahinejad, M.; Torkashvand, J. Municipal solid waste management during COVID-19 pandemic: Effects and repercussions. Environ. Sci. Pollut. Res. Int. 2021, 28, 32200–32209. [Google Scholar] [CrossRef] [PubMed]
- Akter, S. The impact of COVID-19 related ‘stay-at-home’ restrictions on food prices in Europe: Findings from a preliminary analysis. Food Secur. 2020, 1, 719–725. [Google Scholar] [CrossRef] [PubMed]
- Aruga, K. Changes in human mobility under the COVID-19 pandemic and the Tokyo fuel market. J. Risk Financ. Manag. 2021, 14, 163. [Google Scholar] [CrossRef]
- Tull, M.T.; Edmonds, K.A.; Scamaldo, K.M.; Richmond, J.R.; Rose, J.P.; Gratz, K.L. Psychological outcomes associated with stay-at-home orders and the perceived impact of COVID-19 on daily life. Psychiat. Res. 2020, 289, 113098. [Google Scholar] [CrossRef] [PubMed]
- Aruga, K.; Islam, M.M.; Jannat, A. Does staying at home during the COVID-19 pandemic help reduce CO2 emissions? Sustainability 2021, 13, 8534. [Google Scholar] [CrossRef]
- Minato City. Getsubetsu Seiso Data (Monthly Cleaning Data). Available online: https://www.city.minato.tokyo.jp/unei/kurashi/gomi/seso/toke/seso/index.html (accessed on 14 April 2022).
- Minato City. Heisei 30 Nendo Minatoku Gomi Haishutsu Jittaichousahoukokusho (2018 Report on the Conditions of the Waste Disposal in Minato City). Available online: https://www.city.minato.tokyo.jp/unei/documents/houkokusyo_1.pdf (accessed on 10 May 2022).
- Minato City. Shingata Coronavirus no Kansenkakudai ni Tomonau Gomi no Dashikata ni Kansuru Onegai (Requests Regarding Garbage Disposal Following the Spread of COVID-19). Available online: https://www.city.minato.tokyo.jp/gomigenryoushigenka/gominodashikata.html (accessed on 10 May 2022).
- Google LLC. Google COVID-19 Community Mobility Reports. Available online: https://www.google.com/covid19/mobility (accessed on 6 February 2022).
- Pesaran, M.H.; Sin, Y.; Richard, S.J. Bounds testing approaches to the analysis of level relationships. J. Appl. Econ. 2001, 16, 289–326. [Google Scholar] [CrossRef]
- Kuga, N. Koronaka de Masu Ienomi Jyuyo (Increased Demand on Drinking at Home during the COVID-19 Pandemic). Kisoken Letter 2021, 1–9. Available online: https://www.nli-research.co.jp/files/topics/67668_ext_18_0.pdf?site=nl (accessed on 14 April 2022).
- Hantoko, D.; Li, X.; Pariatamby, A.; Yoshikawa, K.; Horttanainen, M.; Yan, M. Challenges and practices on waste management and disposal during COVID-19 pandemic. J. Environ. Manag. 2021, 286, 112140. [Google Scholar] [CrossRef] [PubMed]
Figure 1.
Plots of the volume of waste in Minato City, Tokyo, with changes in stay-at-home hours: (a) Combustible waste; (b) Recyclable plastic; (c) PET; (d) Glass Bottles, Cans, and Paper. Source: Minato City homepage.
Figure 1.
Plots of the volume of waste in Minato City, Tokyo, with changes in stay-at-home hours: (a) Combustible waste; (b) Recyclable plastic; (c) PET; (d) Glass Bottles, Cans, and Paper. Source: Minato City homepage.

Figure 2.
CUSUM and CUSUM-square stability tests.


Table 1.
State of emergency and quasi-state of emergency periods for Tokyo during 2020–2021.
| SOEs | Start | End |
| 1st | 7 April 2020 | 25 May 2020 |
| 2nd | 8 January 2021 | 21 March 2021 |
| 3rd | 25 April 2021 | 20 June 2021 |
| 4th | 12 July 2021 | 30 September 2021 |
| Quasi-SOE | Start | End |
| 1st | 12 April 2021 | 24 April 2021 |
| 2nd | 21 June 2021 | 11 July 2021 |
| 3rd | 9 January 2022 | 21 March 2022 |
Table 2.
Variable descriptions.
| Mobility Indices | Abbreviation | Unit | Description |
|---|---|---|---|
| Combustible waste | combustible | tonne | The volume of burnable wastes such as kitchen waste, uncleanable plastics, unrecyclable paper, rubber, leather products, CDs, clothes, disposable diapers, etc. |
| Recyclable plastic | plastic | tonne | The volume of recyclable plastic containers for food and other products without stains, plastic bottle caps, plastic trays, etc. |
| Recyclable plastic bottles | PET | tonne | The volume of polyethylene terephthalate (PET) bottle wastes such as plastic bottles of beverages, liquors, sauces, etc. |
| Recyclable glass and cans | glass | tonne | The volume of recyclable glass such as bottles for liquids, glass jars for food, etc., and that for recyclable tin cans such as drink and spray cans, metalware, etc. |
| Recyclable used paper | paper | tonne | The volume of recyclable papers such as newspapers, cardboard boxes, cartons, magazines, other recyclable papers, etc. |
| Residential | home | Percentage | Changes in the hours spent at home compared to the baseline period before the COVID-19 outbreak. |
Table 3.
Summary statistics of the volume of waste (tonnes) for the periods before and after the COVID-19 pandemic.
Table 3.
Summary statistics of the volume of waste (tonnes) for the periods before and after the COVID-19 pandemic.
| Combustible | Plastic | PET | Glass | Paper | ||||||
|---|---|---|---|---|---|---|---|---|---|---|
| Sample | Before | After | Before | After | Before | After | Before | After | Before | D After |
| Mean | 4018.15 | 4013.27 | 217.79 | 230.58 | 101.23 | 112.86 | 353.47 | 380.60 | 581.51 | 632.64 |
| Median | 4067.98 | 4019.47 | 216.60 | 231.67 | 97.44 | 112.43 | 351.74 | 379.12 | 581.71 | 631.22 |
| Maximum | 4308.82 | 4371.24 | 237.28 | 260.61 | 122.38 | 129.55 | 417.43 | 456.93 | 669.08 | 746.01 |
| Minimum | 3483.84 | 3498.75 | 187.15 | 202.79 | 81.80 | 91.36 | 320.99 | 327.60 | 502.74 | 549.52 |
| Std. Dev. | 226.14 | 233.98 | 11.25 | 15.16 | 11.24 | 10.81 | 22.09 | 33.47 | 42.02 | 50.60 |
| Skewness | −0.77 | −0.36 | −0.54 | 0.09 | 0.30 | −0.13 | 1.05 | 0.72 | 0.03 | 0.45 |
| Kurtosis | 2.79 | 2.42 | 3.47 | 2.25 | 2.34 | 2.06 | 4.50 | 2.97 | 2.68 | 2.95 |
| No. Obs. | 25 | 25 | 25 | 25 | 25 | |||||
Note: Before covers the January 2018–January 2020 period, while After contains data for the February 2020–February 2022 period.
Table 4.
Unit root tests.
| Variables | Levels | First Differences | ||||||||||
|---|---|---|---|---|---|---|---|---|---|---|---|---|
| ADF | ZA | KPSS | ADF | ZA | KPSS | |||||||
| combustible | −3.13 | ** | −4.93 | ** | 0.27 | −5.21 | *** | −6.22 | *** | 0.44 | * | |
| plastic | −3.46 | ** | −4.81 | ** | 0.37 | * | −5.40 | *** | −7.77 | *** | 0.30 | |
| PET | −3.24 | ** | −3.74 | 0.07 | −5.26 | *** | −5.39 | *** | 0.27 | |||
| glass | −3.62 | ** | −4.23 | 0.16 | −5.43 | *** | −6.57 | *** | 0.19 | |||
| paper | −4.87 | *** | −5.35 | *** | 0.44 | * | −6.45 | *** | −6.54 | *** | 0.50 | ** |
| home | −5.82 | *** | −9.02 | *** | 0.06 | −3.82 | *** | −7.91 | *** | 0.16 | ||
Note: ***, **, and * denote significance at the 1%, 5%, and 10% levels, respectively. ADF and KPSS tests were performed with a constant only and the ZA test was conducted with a trend break.
Table 5.
Breusch–Godfrey (BG) and Breusch–Pagan–Godfrey (BPG) tests.
| Models | BG F-Stat. | BPG F-Stat. |
|---|---|---|
| combustible | 0.34 | 1.10 |
| plastic | 0.39 | 0.53 |
| PET | 0.30 | 0.76 |
| glass | 0.04 | 1.12 |
| paper | 2.91 | 1.04 |
Table 6.
ARDL bound tests for cointegration.
| Models | F-Stat. | Signif. | I(0) | I(1) | |
|---|---|---|---|---|---|
| combustible | 4.72 | ** | 10% | 3.30 | 3.80 |
| plastic | 1.76 | 5% | 4.09 | 4.66 | |
| PET | 7.09 | *** | 1% | 6.03 | 6.76 |
| glass | 5.26 | ** | |||
| paper | 5.70 | ** | |||
Note: *** and ** denote significance at the 1% and 5% levels, respectively. The critical values for I(0) and I(1) present the values for a finite sample size of 30.
Table 7.
ARDL long-run and short-run coefficient estimations.
| Variables | Combustible | Plastic | PET | Glass | Paper | ||||||||||
|---|---|---|---|---|---|---|---|---|---|---|---|---|---|---|---|
| Long-Run | Coef. | T-Stat. | Coef. | T-Stat. | Coef. | T-Stat. | Coef. | T-Stat. | Coef. | T-Stat. | |||||
| home | 46.07 | *** | 4.46 | −1.19 | −0.13 | 4.16 | ** | 2.36 | 10.88 | *** | 11.89 | −2.62 | −0.73 | ||
| Intercept | 3464.68 | *** | 27.19 | 233.83 | ** | 2.43 | 62.68 | ** | 2.88 | 252.88 | *** | 24.48 | 655.79 | *** | 16.27 |
| Short-run | |||||||||||||||
| Δhome | 46.66 | 1.01 | 1.34 | 0.70 | 1.87 | * | 1.85 | 15.99 | *** | 4.92 | 0.06 | 0.01 | |||
| SOE | 93.81 | 0.80 | 7.75 | 1.10 | 3.44 | 1.00 | 16.44 | 1.55 | 17.94 | 0.65 | |||||
Note: ***, **, and * denote significance at the 1%, 5%, and 10% levels, respectively. Only the coefficients of the short-run influence from the residential change and the SOE dummy variable are presented for the short-run estimation.
Publisher’s Note: MDPI stays neutral with regard to jurisdictional claims in published maps and institutional affiliations. |
© 2022 by the author. Licensee MDPI, Basel, Switzerland. This article is an open access article distributed under the terms and conditions of the Creative Commons Attribution (CC BY) license (https://creativecommons.org/licenses/by/4.0/).
Share and Cite
MDPI and ACS Style
Aruga, K. Impact of the Number of Hours Spent at Home on the Volume of Municipal Waste Generated: Evidence from Tokyo during the COVID-19 Pandemic. Sustainability 2022, 14, 6165. https://doi.org/10.3390/su14106165
AMA Style
Aruga K. Impact of the Number of Hours Spent at Home on the Volume of Municipal Waste Generated: Evidence from Tokyo during the COVID-19 Pandemic. Sustainability. 2022; 14(10):6165. https://doi.org/10.3390/su14106165
Chicago/Turabian StyleAruga, Kentaka. 2022. "Impact of the Number of Hours Spent at Home on the Volume of Municipal Waste Generated: Evidence from Tokyo during the COVID-19 Pandemic" Sustainability 14, no. 10: 6165. https://doi.org/10.3390/su14106165
Note that from the first issue of 2016, this journal uses article numbers instead of page numbers. See further details here.