Mohan Mahanty* | K. Swathi | K. Sasi Teja | P. Hemanth Kumar | A. Sravani
© 2021 IIETA. This article is published by IIETA and is licensed under the CC BY 4.0 license (http://creativecommons.org/licenses/by/4.0/).
OPEN ACCESS
COVID-19 pandemic shook the whole world with its brutality, and the spread has been still rising on a daily basis, causing many nations to suffer seriously. This paper presents a medical stance on research studies of COVID-19, wherein we estimated a time-series data-based statistical model using prophet to comprehend the trend of the current pandemic in the coming future after July 29, 2020 by using data at a global level. Prophet is an open-source framework discovered by the Data Science team at Facebook for carrying out forecasting based operations. It aids to automate the procedure of developing accurate forecasts and can be customized according to the use case we are solving. The Prophet model is easy to work because the official repository of prophet is live on GitHub and is open for contributions and can be fitted effortlessly. The statistical data presented on the paper refers to the number of daily confirmed cases officially for the period January 22, 2020, to July 29, 2020. The estimated data produced by the forecast models can then be used by Governments and medical care departments of various countries to manage the existing situation, thus trying to flatten the curve in various nations as we believe that there is minimal time to do this. The inferences made using the model can be clearly comprehended without much effort. Furthermore, it tries to give an understanding of the past, present, and future trends by showing graphical forecasts and statistics. Compared to other models, prophet specifically holds its own importance and innovativeness as the model is fully automated and generates quick and precise forecasts that can be tunable additionally.
COVID-19, Fbprophet, time series analysis, machine learning
Asia was the centre of the initial outbreak that spread from China in early 2020. To date, around 2.48 million deaths have been reported. It has proved far more fatal than other coronavirus family members, with a fatality ratio of 1.4%. Coronaviruses are, in general, a family of viruses [1] that end up triggering sickness in both animals as well as humans. There are specific severe diseases that were brought on by coronaviruses in the mid-1960s. A couple of them are Middle East Respiratory Syndrome (MERS) [2] and Severe Acute Respiratory Syndrome (SARS) [3]. COVID-19 is again a brutal illness disease triggered by the most lately identified coronavirus. The outbreak of this illness took Place in Wuhan, a city in China, in December 2019 [4].
COVID-19 has now turned into a pandemic, thus affecting countless individuals around the globe. Although most people with COVID-19 have mild to moderate symptoms like body temperature, coughing, and fatigue. The disease can cause severe medical complications like Pneumonia, Organ failure, Heart problems, lung infections, Blood clots, Acute kidney injury, viral and bacterial infections.
Whenever an infection or a microbial illness emerges, it experiences local transmission and thus Coronavirus too. Information has actually revealed that it spreads out primarily from one person to another amongst those in a range of 6 feet or 2 meters. In some circumstances, the virus can be spread by an individual being subjected to tiny drops of coughing, sneezes, exhales, physical chats that remain in the air for a good amount of time thus airborne transmission. The tiny droplets can be breathed in through mouth, nose and can get in contact of eye of an individual. It can likewise spread out if an individual comes in contact with the surface of any object that is exposed to the Infection droplets.
According to the sources, the majority of people (about 80%) tend to recuperate from the disease without needing to take hospital treatment. Sources even claim that 1 out of every five individuals who meet the virus becomes seriously ill and develops issues like difficulty in breathing. Currently, governments are taking preventive measures such as social distancing, sanitization, carrying out lockdowns, etc. Early recognition of symptomatology, prompt diagnostic measures, effective home and hospice management, and appropriate preventive steps.
In India, there was no exponential growth observed in the initial state as compared to other countries due to stringent implementations of lockdown. However, now the cases have been increasing at a high rate, and the government is trying to carry out various approaches of safety while opening the lockdown in certain areas as things ultimately need to be like before to handle the Indian economic situation in this pandemic. While the government is doing its job, forecasts like this will be extremely beneficial to comprehend the future. Thus the government can make even more rigorous regulations to handle the issue. For achieving the forecasts, we chose to work with time-series data-based statistical models, and the "Prophet" model [5] has shown us good results in predicting both short term and long term forecasts.
Time series models enable us to evaluate significant trends, cyclicity, seasonality as well as abnormality. In clinical applications, time series models have actually been effectively put on to anticipate the progression of the illness, approximate the death rate as well as examine the time reliant threat. Thus, it holds a critical value in order to bring an impact in the society.
The primary objective of the paper is to present one week (7days) ahead to two months (60 days) ahead forecasts for confirmed cases, recovered cases, and death cases. This paper presents the trends of 5 countries, including India, that are the US, Brazil, Italy, and the UK.
Anastassopoulou et al. proposed their analysis [6] on the COVID-19 pandemic, depend on the Susceptible-Infectious-Recovered-Dead (SIDR) model. They provide estimations and evaluations of the fundamental reproduction number (R0) and per day mortality rates and recovery rates. They attempt to forecast the growth rate for up to 3 weeks. Based on the reports from various health agencies, the cumulative of infected people is greater than 180,000 by the end of February 2020. Alsaeedy et al. proposed their work on detections of regions, which are at higher risk of spreading COVID-19 using wireless networks [7]. They worked on the end-user equipment (UE) connected to a wireless cellular network functionality for the estimation of regions that may further .be subjected to monitoring and mitigation. M. B. Jamshidi et al. proposed a deep learning approach for the medical diagnosis of COVID-19. They worked on AI-based methods for the diagnosis [8] of COVID-19 illness, by using GAN, LSTM, and ELM.
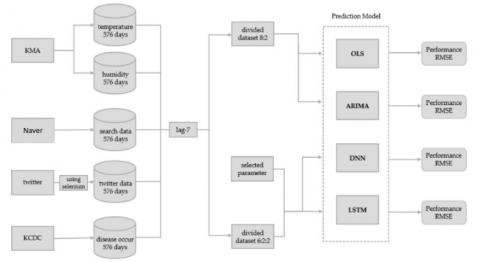
AL-Rousan et al. represented their analysis of COVID-19, indicates the rapid growth of COVID-19 in South Korea [9]. They did the statistical analysis by considering various factors like sex, province, infectivity factors, year of birth, and released or death date on the reported numbers of deceased and recovered cases. Lutz et al. proposed their work on forecasting of infectious diseases [10], by using the Mathematical models. They did their research on humans, pathogens, and how they are interacting with infectious diseases and the ways to control them. Guo et al. proposed a prediction model using Fbprophet [11] for Maximum Power Demand with Adaptive Kalman Filtering for excellent performance in time series prediction. They used fused ML (Machine learning Algorithms to predict the MPD (Maximum Power Demand) of the customers. Chae et al. proposed a prediction system of infectious diseases based on deep learning and Big Data [12]. By considering the Big Data and available social media data. They applied Deep learning algorithms to forecast the infectious diseases. As shown in Figure 1, the model predicts the diseases in less time.
Figure 1. Deep learning-based Infectious disease prediction model [12]
The prophet is a procedure for forecasting time series data [5] based upon the idea of additive modelling where non-linear trends fit with annual, week-to-week, and day-to-day seasonality. The data here is expected to have good seasonal effects and should have various seasons (or) periods of past historical data. Prophet can deal with missing data and changes in the trend. It can also manage outliers well. It is precise and fast, and its various applications for generating reliable forecasts. The prophet is fully automated, which helps in getting a sensible forecast on messy data without manual effort. It additionally includes methods in which users can tweak and adjust forecasts. By using Human –Interpretable parameters, the forecast can be improved [13]. The prophet is available in Python and R, and they use the same Stan code for fitting the model. The prophet is an additive regression model with significant elements such as a piecewise linear or logistic growth curve trend. It instantaneously finds changes in patterns by selecting change points from the data. An annual seasonal component modeled using the Fourier series [14]. Figure 2 shows the Prophet components plot, which tells about the model it has fit.
Figure 2. Prophet components plot of the model which is fit
The above Figure 2 shows the Prophet components plot, which tells about the model it has fit. The components plot comprises a weekly component and the monthly component of the model, shown using the curves in the plot. Prophet offers unpredictability intervals for the trend component by mimicking future trend changes to the time series. Prophet uses Stan's probabilistic programming language to execute the core of the procedure. Stan carries out the MAP optimization for parameters very swiftly in less than one second and also gives us a choice to approximate parameter uncertainty by making use of the Hamiltonian Monte Carlo algorithm, and enables us to re-use the fitting procedure throughout numerous interface languages. Prophet is an additive regression model y(t) and the equation for the prediction model goes like this y(t)=g(t)+s(t)+h(t)+ϵt. Prophet uses the g(t) function to model or fit non-periodic adjustments in the data we possess. s(t) stands for periodic changes. h(t) represents the impact of holiday effects. ϵ is the error term showing the unusual changes in the model [11]. A good thing about the prophet, when compared to other forecasting procedures like ARIMA, SARIMAX, and LSTMs, is that it does not call for much anticipation or experience of forecasting time series data or running predictive and statistical models because it automatically discovers seasonal trends underneath the data and provides a collection of easily understandable parameters. For this reason, it allows non-statisticians to use it and obtain sensibly good results.
To be more precise, we have extracted and collected COVID-19 cases related data from many sources and carried out pre-processing over the accumulated data to get good results with high precision while applying a model to fit the data. Generally the data we procure is sometimes in its most raw form i.e. irregular, imprecise and typically does not have particular characteristics. Feeding raw data to a model will cause the model to fail catastrophically (or) raise a good number of errors. This is where pre-processing gets in. Preprocessing helps to transform raw data to an organized and a tidy manner consequently making the data usable.
The modelling we proposed is to obtain the prediction of the number of cases in the coming future. The data we dealt with is time-series, which means data that keeps changing with time, and our research matches this fact as COVID-19 cases keep changing with time. There are many models to fit time-series data, and we opted "Prophet" as it is recognized to be accurate and quick and can handle outliers in data too. The working model of the prophet, mentioned in the above sections. In our research, we fit the prophet model on the existing data we have, which includes the dates and the number of cases on those days, respectively, and predicted the future cases for the next week, next month, and even the month after that. We plotted the time-series forecast curve to see how the cases will increase (or) decreased with time in the coming days and months.
We plotted graphs for the confirmed cases, death cases, and the recovered cases from the data we chose and compared the conditions in the US, India, Brazil, and the UK using these graphical images and examined them and made statistical and visual inferences. The results which we generated are quite interesting and might help the government bodies to take the present and future actions. In the following curves:
------ indicates Confirmed Cases
------ indicates Recovered Cases
------ indicates Death Cases
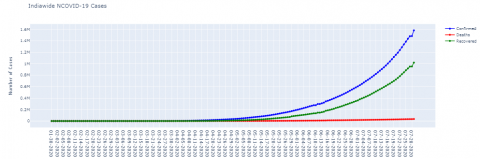
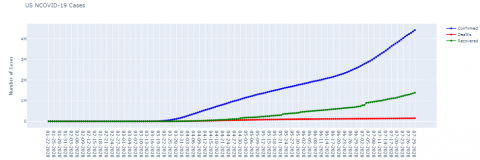
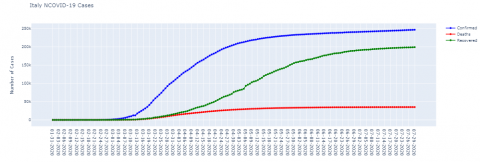
Figure 3 represents the graph of the confirmed, recovered, and death curve plots in India. Here X-axis shows dates Y-axis shows Number of Cases where 1 Unit=0.2 Million= 2,00,000 cases. Figure 4 describes the confirmed, recovered, and death curve plots in the US. Here X-axis shows dates Y-axis shows Number of Cases where 1 Unit= 1 Million=10,00,000 cases. Where Figure 5 shows the confirmed, recovered, and death curve plots in Brazil. Here X-axis shows dates Y-axis shows Number of Cases where 1 Unit=0.5 Million=5,00,000 cases. And the Figure 6 represents the confirmed, recovered, and death curve plots in Italy. Here X-axis shows dates Y-axis shows Number of Cases where 1 Unit=50,000 cases.
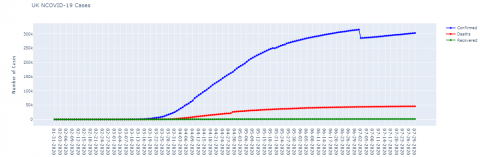
Figure 7 shows the confirmed, recovered, and death cases in the UK. Here X-axis show dates Y-axis shows Number of Cases where 1 Unit=50,000 cases. From the graphs, the confirmed cases in the US, Italy, and the UK have been on a drastic hike since February 2020, but Italy managed to control the situation, and as noticed above, the curve is nearing flat. The graphs also show that in countries like India and Brazil, even if the COVID-19 spread late in March 2020, we observe exponential growth in the confirmed no. of cases. The graph for the UK shows that the number of deaths is more than the number of recovered cases. Italy has done an excellent job of recovering people, as we can see in the graph. All other countries, apart from Italy, need to implement strict measures for flattening the curve. The US has the highest number of confirmed and death cases to date, followed by Brazil. India stands in the 3rd Place. The UK stands in 11th Place and has done well in a month as it stood on 5th position a month back and Italy stands in the 15th Place.
Figure 3. The confirmed, recovered and death cases in India
Figure 4. The confirmed, recovered, and death cases in the United States
Figure 5. The confirmed, recovered, and death cases in Brazil
Figure 6. The confirmed, recovered, and death cases in Italy
Figure 7. The confirmed, recovered, and death cases in the United Kingdom
5.1 Forecasting and comparing the trend of confirmed cases in different countries
The following graphs indicate the trend of cases from Jan to July and thus predicting the trend for the next two months (August and September) and also showing prophet components that tell about the weekly trend in different countries.
5.1.1 India
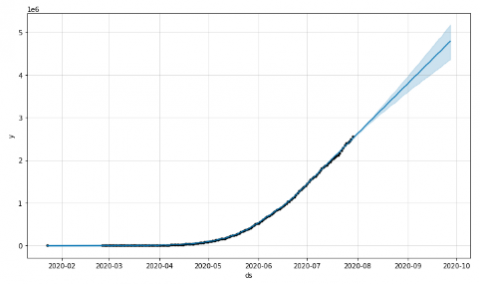
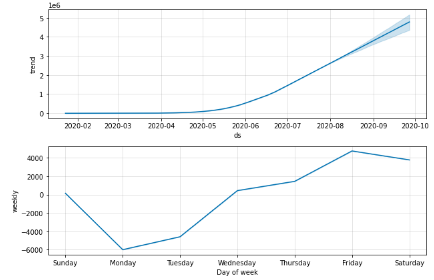
Figure 8 tells about the curve of the confirmed case from Feb 2020 to July 2020 and shows the time series prediction curve for the next two months (August and September) in India. Here X-axis shows months and Y-axis shows cases where 1 Unit=5,00,000 cases.
Figure 8. Time series forecast plot of confirmed cases in India
Figure 9. Weekly component of confirmed cases in India
Figure 9 represents the weekly trend in the number of covid cases every day in India. According to the forecasts, the cases in India will increase exponentially in the coming months of August and September, and we also notice that these cases have been increasing since May. The week component tells us that many COVID-19 cases are coming up on Wednesdays and the least on Thursdays in India.
5.1.2 USA
Figure 10. Time series forecast plot of confirmed cases in the USA
Figure 11. Weekly component of confirmed cases in the USA
Figure 10 tells about the curve of the confirmed case from Feb 2020 to July 2020 and shows the time series prediction curve for the next two months (August and September) in the USA. Here X-axis shows months, and Y-axis shows cases where 1 Unit=20,00,000 cases.
Figure 11 represents the statistical information about the weekly trend in the number of cases every day in the USA. According to the forecasts, the cases in the US have started showing growth since the mid of march, and the curve looks skewed and indicates that the US is going to have time in the coming months, and currently, it tops the table of cases. In the United States, the maximum number of cases noted on Saturday and the least on Thursday.
5.1.3 Brazil
Figure 12 tells about the curve of the confirmed case from Feb 2020 to July 2020 and shows the time series prediction curve for the next two months (August and September) in Brazil. Here X-axis shows months, and Y-axis shows cases where 1 Unit=10,00,000 cases.
Figure 13 Displays the weekly trend in the number of Covid cases every day in Brazil. The forecast curve of Brazil resembles the curve of India, and the growth rate is exponential, and Brazil is ahead of India. The weekly component of Brazil shows that the maximum cases noted on Friday and the least on Monday.
Figure 12. Time series forecast plot of confirmed cases in Brazil
Figure 13. Weekly component of confirmed cases in Brazil
5.1.4 Italy
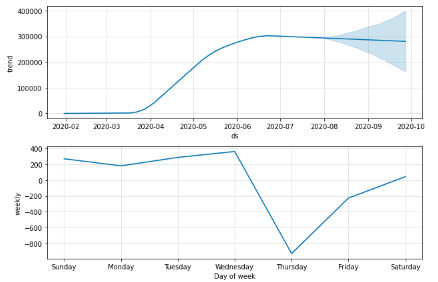
Figure 14 represents the curve of the confirmed case from Feb 2020 to July 2020 and shows the time series prediction curve for the next two months (August and September) in Italy. Here X-axis shows months, and Y-axis shows cases where 1 Unit=50,000 cases.
Figure 15 represents the weekly trend in the number of COVID cases every day in Italy. Italy has shown the best curve till now, even if cases in Italy started in March, Italy managed to control the situation, and as shown in the graph, the curve is flattening with time. The weekly component of Italy shows that the maximum cases noted on Sunday and the least on Thursday.
Figure 14. Time series forecast plot of confirmed cases in Italy
Figure 15. Weekly component of confirmed cases in Italy
5.1.5 United Kingdom
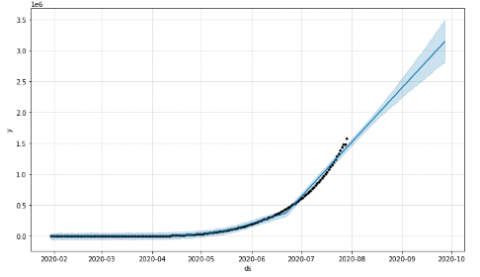
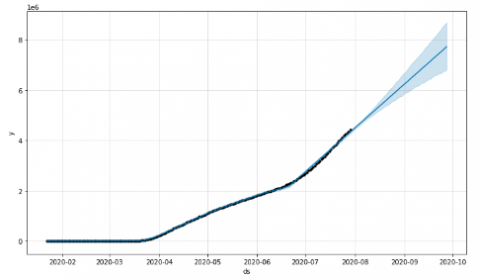
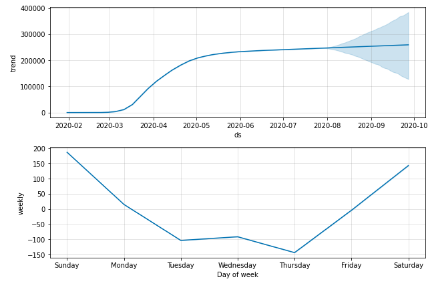
Figure 16 tells about the curve of the confirmed case from Feb 2020 to July 2020 and shows the time series prediction curve for the next two months (August and September) in The UK. Here X-axis shows months and Y-axis shows cases where 1 Unit=1,00,000 cases.
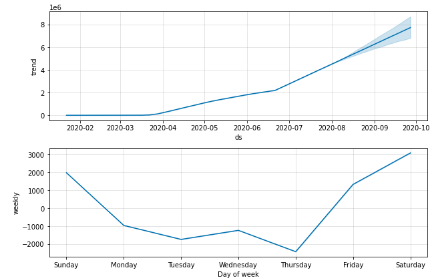
Figure 17 represents the weekly trend in the number of covid cases every day in the UK. UK has done a better job as compared to the US, India, and Brazil, as can see the curve it has at a point showing a better curve and doing comparatively better compared to US, India, and Brazil. The curve as you can see is going down which is a very beautiful sign for the UK. The weekly component of Italy shows that the maximum cases noted on Wednesday and the least on Thursday.
Figure 16. Time series forecast plot of confirmed cases in the United Kingdom
Figure 17. Weekly component of confirmed cases in the United Kingdom
5.2 Prophet prediction for the next week after 3rd August
Predictions show the last five days of the next week and the number of predicted cases on that particular day. The confirmed cases in India on June 20 are 4,10,461, and as per the prediction, we can see that on 23rd, it is 4,12,599, which indicates that there will be rise by at least 2000 cases in the next three days after June 20, 2020. Similarly, we can predict and forecast for the next week (or) the next two weeks(or) 30 days (or) 60 Days. The trend can be forecasted based on data in all countries, and updates and predictions can be shared with respective governments. Table 1 represents the current dates and the number of covid cases in different nations, in the month of July and in the prediction table (Table 2), yhat is the forecast that shows us the actual prediction, yhat_lower, and yhat_upper represent the uncertainty interval where yhat_lower showshow low the cases can go on a particular day, and yhat_upper shows how high the cases can go on a particular day.
From the Table 1, Table 2 we can analyse that, in India, on July 29, the cases are 15,81,963 and from the predictions made, the cases on August.05 are 16,32,035 which tells us that there will be a rise of 50,072 cases or more in the coming week. Where in USA on July 29, the cases are 44,26,982 and from the predictions made, the cases on August 05 are 47,22,843 which tells us that there will be a rise of 2,95,861 cases or more in the coming week which shows the severity of COVID-19 in the USA as the cases have now reached to 7-digit and has topped the list. Coming to Brazil on July 29, the cases are 25,52,265 and from the predictions made, the cases on August 05 are 27,75,495 which tells us that there will be a rise of more than 2,50,230 cases or more in the coming week, which shows that cases in Brazil are also increasing drastically, like the United States.
Table 1. Existed COVID-19 cases in different nations
|
COUNTRY |
Existing Dates & COVID-19 Cases on Respective Dates |
|
|
INDIA |
26-07-2020 |
14,35,616 |
|
27-07-2020 |
14,80,073 |
|
|
28-07-2020 |
14,83,156 |
|
|
29-07-2020 |
15,81,963 |
|
|
USA |
26-07-2020 |
42,33,923 |
|
27-07-2020 |
42,90,337 |
|
|
28-07-2020 |
43,56,206 |
|
|
29-07-2020 |
44,26,982 |
|
|
BRAZIL |
26-07-2020 |
24,19,091 |
|
27-07-2020 |
24,42,375 |
|
|
28-07-2020 |
24,83,191 |
|
|
29-07-2020 |
25,52,265 |
|
|
ITALY |
26-07-2020 |
2,46,118 |
|
27-07-2020 |
2,46,286 |
|
|
28-07-2020 |
2,46,488 |
|
|
29-07-2020 |
2,46,776 |
|
|
UK |
26-07-2020 |
3,01,020 |
|
27-07-2020 |
3,01,708 |
|
|
28-07-2020 |
3,02,295 |
|
|
29-07-2020 |
3,03,063 |
|
Table 2. Predicted COVID-19 cases in different nations
|
Country |
Predicted Dates & COVID-19 Cases on Respective Dates |
yhat (Cases) |
yhat_lower (Cases) |
yhat_upper (Cases) |
|
INDIA |
04-08-2020 |
16,01,069 |
15,47,837 |
16,51,093 |
|
05-08-2020 |
16,32,035 |
15,79,682 |
16,85,548 |
|
|
USA |
04-08-2020 |
46,65,949 |
46,01,188 |
47,36,590 |
|
05-08-2020 |
47,22,843 |
46,52,966 |
47,89,362 |
|
|
BRAZIL |
04-08-2020 |
27,32,561 |
27,12,016 |
27,53,429 |
|
05-08-2020 |
27,75,495 |
27,52,245 |
27,99,122 |
|
|
ITALY |
04-08-2020 |
2,47,755 |
2,43,465 |
2,52,566 |
|
05-08-2020 |
2,47,976 |
2,42,635 |
2,54,323 |
|
|
UK |
04-08-2020 |
2,93,130 |
2,85,093 |
3,01,468 |
|
05-08-2020 |
2,92,973 |
2,83,996 |
3,02,417 |
Whereas in Italy, on July 29, the cases are 2,46,776 and from the predictions made, the cases on August 05 are 2,47,976 which tells us that there will be a rise of 1,200 cases or more in the coming week which shows that Italy is the best-performing country in handling the cases and reaching the point of flattening the curve. And in UK, on July 29, the cases are 3,03,063 and from the predictions made, the cases on August 05 are 2,92,973 which tells us that there will be a drop of 10,090 cases or more in the coming week which shows that UK as country is doing well in controlling the cases and helping people recover from the cases.
The escalation of COVID-19 infections was slow in India initially as compared to other countries like Italy and the USA. However, according to our results, we prove that the cases are growing exponentially. The USA is still in a fatal situation, and regrettably, the statistics say that the condition will be the same if they do not follow any measures. Brazil has a similar situation as the USA. India which started slowly initially has now placed itself in the 3rd position and the condition is brutal. India as a country was doing well during the lockdown, but after the lift up, cases have been increasing in thousands every day. The UK is performing well in reducing the cases day by day and Italy has been the best performing country according the statistics performed above.
In the current pandemic of COVID-19, all countries are looking in the direction of mitigation strategies to control the spread with the help of future stats, and our research work aims to do the same using Predictive analytics. The use of a suitable and precise model is of utmost importance when we are approaching a forecasting based use case. Prophet model is a highly advantageous method to forecast the future and is the best for our use case of covid cases forecast because of its swift and high end accurate results. The model is even automated to identify points of inflection where the trend changes significantly and handles outliers implicitly. These stats and forecasts will be of exceptional support to the government, health sector, and pharmaceutical companies to manufacture drugs at a quicker rate and precisely. Our research can be considered as straightforward as well as an instant response to track the public health system in this pandemic at an international level hence providing numerous statistics revealing the conditions of different major nations. The paper additionally discusses how Italy has managed to control the cases and how it is approaching a flat curve in the future. Lastly, our paper shows the impact of lockdowns, social distancing, lifting of lockdown by various governments, which has now led to an extremely dangerous situation, and countries have to do a great deal to flatten the curve. When we look into disadvantages of this method we notice that if the data possess both biweekly and quarterly seasonality time-series models then the model will have hard time forecasting. To overcome that every parameter is to be tuned manually. Thus this method of forecasting is highly useful in order to foresee the future and take actions and preventive measures according to it.
[1] Coronavirus | Human Coronavirus Types | CDC. (2020). https://www.cdc.gov/coronavirus/types.html, accessed on 2 June 2020.
[2] WHO | Middle East respiratory syndrome coronavirus (MERS-CoV). (2020). http://www.who.int/emergencies/mers-cov/en, accessed on 2 June 2020.
[3] WHO | Severe Acute Respiratory Syndrome (SARS). (2020). https://www.who.int/csr/sars/en, accessed on 2 June 2020.
[4] WHO | Pneumonia of unknown cause – China. (2020). https://www.who.int/csr/don/05-january-2020-pneumonia-of-unkown-cause-china/en, accessed on 2 June 2020.
[5] Taylor, S.J., Letham, B. (2018). Forecasting at scale. The American Statistician, 72(1): 37-45. https://doi.org/10.7287/peerj.preprints.3190v2
[6] Anastassopoulou, C., Russo, L., Tsakris, A., Siettos, C. (2020). Data-based analysis, modelling and forecasting of the COVID-19 outbreak. PloS One, 15(3): e0230405. https://doi.org/10.1371/journal.pone.0230405
[7] Alsaeedy, A.A., Chong, E.K. (2020). Detecting regions at risk for spreading COVID-19 using existing cellular wireless network functionalities. IEEE Open Journal of Engineering in Medicine and Biology, 1: 187-189. https://doi.org/10.1109/OJEMB.2020.3002447
[8] Jamshidi, M., Lalbakhsh, A., Talla, J., Peroutka, Z., Hadjilooei, F., Lalbakhsh, P. (2020). Artificial intelligence and COVID-19: Deep learning approaches for diagnosis and treatment. IEEE Access, 8: 109581-109595. https://doi.org/10.1109/access.2020.3001973
[9] Al-Rousan, N., Al-Najjar, H. (2020). Data analysis of coronavirus COVID-19 epidemic in South Korea based on recovered and death cases. Journal of Medical Virology, 92(9): 1603-1608. https://doi.org/10.1002/jmv.25850
[10] Lutz, C.S., Huynh, M.P., Schroeder, M., Anyatonwu, S., Dahlgren, F.S., Danyluk, G. (2019). Applying infectious disease forecasting to public health: A path forward using influenza forecasting examples. BMC Public Health, 19(1): 1-12. https://doi.org/10.1186/s12889-019-7966-8
[11] Guo, C., Ge, Q., Jiang, H., Yao, G., Hua, Q. (2020). Maximum power demand prediction using fbprophet with adaptive Kalman filtering. IEEE Access, 8: 19236-19247. https://doi.org/10.1109/ACCESS.2020.2968101
[12] Chae, S., Kwon, S., Lee, D. (2018). Predicting infectious disease using deep learning and big data. International Journal of Environmental Research and Public Health, 15(8): 1596. https://doi.org/10.3390/ijerph15081596
[13] GitHub - facebook/prophet: Tool for producing high quality forecasts for time series data that has multiple seasonality with linear or non-linear growth. (2020). https://github.com/facebook/prophet, accessed on 2 June 2020.
[14] Prophet: forecasting at scale - Facebook Research. (2020). https://research.fb.com/blog/2017/02/prophet-forecasting-at-scale, accessed on 2 June 2020.