Article

The COVID-19 Pandemic Lockdowns and Changes in Body Weight among Polish Women. A Cross-Sectional Online Survey PLifeCOVID-19 Study

by
Małgorzata Ewa Drywień
,
Jadwiga Hamulka
,
Monika A. Zielinska-Pukos
,
Marta Jeruszka-Bielak
and
Magdalena Górnicka
*
Institute of Human Nutrition Sciences, Warsaw University of Life Sciences (SGGW-WULS), 159C Nowoursynowska Street, 02-787 Warsaw, Poland
*
Author to whom correspondence should be addressed.
Sustainability 2020, 12(18), 7768; https://doi.org/10.3390/su12187768
Submission received: 2 September 2020 / Revised: 17 September 2020 / Accepted: 18 September 2020 / Published: 20 September 2020
(This article belongs to the Special Issue Global Environmental Health and Safety)

Abstract

:
There is limited information on the relationships between restrictions linked to COVID-19 and changes in body weight. The aim of the study was to identify the body weight changes and their determinants in the nutritional and socio-demographic context during the COVID-19 pandemic in Polish women. During lockdown in Poland, 34% of women gained weight, while 18% of women reduced weight. As many as 44% of women with obesity before the pandemic increased their body weight, and 74% of women that were underweight reduced their body weight. In a group with weight gain, women increased their body weight by 2.8 kg on average and around 65% of them increased their total food intake. Unhealthy dietary changes and the negative lifestyle changes that comprised of an increase in screen time and a decrease in physical activity were found as key factors associated with weight gain. A higher risk of weight gain was associated with being obese before the pandemic or living in a macroeconomic region >50% of EU-28 GDP, while those younger in age and carrying out remote work had a higher chance of weight loss. Concluding, the specific conditions during lockdown worsened the nutritional status, which may increase the risk of complicatedness and mortality from COVID-19. It seems advisable to create dietary and lifestyle recommendations tailored to the individual needs of women who are underweight or have excessive body weight. More attention should be paid also to environmental impacts. Both, the reduction of excessive body weight and the maintenance of a normal weight should be based on the principle to eat and live sustainably and healthily.

1. Introduction

Good health and wellbeing as well as responsible consumption and production are 2 of the 17 Sustainable Development Goals [1]. In most countries, also in Poland, diets before the COVID-19 pandemic were characterized as unhealthy, as they contained too much of the food products and nutrients that should be limited, and too little of the essential ones, mainly vegetables and fruit [2]. Such diets are unsustainable from the production, consumption, and also public health perspectives. In consequence, an unhealthy and unsuitable diet causes different forms of malnutrition.
From the human health point of view, and also from the perspective of sustainability issues, the greatest attention is paid to excessive body weight. According to the WHO Global Health Observatory data, in 2016, the percentage of women with excessive body weight (BMI ≥ 25 kg/m2) accounted for 39.2% in the world, 54.3% in Europe, and 51.1% in Poland, which was comparable with other European countries, like Italy (51.5%) and Spain (54.1%) [3]. The results of the last Polish study (Autumn 2018) indicated that excessive body weight characterized 52.4% of women, and among them, 11.3% had obesity [4]. The growing pandemic of obesity, not only in women, is observed in most of the world and also in Poland, which causes a serious public health problem. A common health consequence of obesity in women is the raised risk for diet-related diseases, that is, diabetes, cardiovascular diseases, and some cancers [5,6]. Obesity has also a negative impact on the reproductive function in women [7,8,9]. In addition, obesity may be associated with increased susceptibility to different kinds of infections [10,11,12]. The main reason for the obesity pandemic is the change in people’s lifestyles due to obesogenic factors, namely, increased intake of foods rich in fat and sugars; and/or an increase in sedentarism resulted from urbanization and changes in work and transport forms [13]. Recently, attention has been also paid to the important contribution of obesity to humankind’s footprint and the benefits of reducing excess body weight for the environment [14].
Besides being overweight and obesity, undernutrition is a different problem for the global population. All those forms of malnutrition coexist in many countries [2]. According to WHO data, 9.4% of the global population has BMI below 18.5 kg/m2. In Europe, it concerns 2.3% of the population, and in Poland—2.6%, while, for example, in Italy and Spain it is 1.8% and 1.6%, respectively. The female population in Poland is at a greater risk of being underweight than in some European countries [15]. Therefore, this requires special attention, specifically during a pandemic. Lower BMI predisposes to higher risks of mortality [16,17,18,19], poor cognition [20], poor self-assessed health, and quality of life [21,22]. In women with very low weight, fertility rates are lower than in women with normal body weight, in parallel with adverse pregnancy results [23,24]. Being underweight, like obesity, predisposes to a greater susceptibility to infections [25]. Weight changes generally result from various conditions like physical activity [26], natural environment [27,28], food environment [29], worksite settings [30], sleep duration [31], pregnancy [32], and genetics [33]. Moreover, some social and psychological determinants like financial stress [34], posttraumatic stress [35], marriage [36], and health literacy [37] may be also involved in the weight change.
The restrictions associated with COVID-19 in Poland were in force from March to May 2020 and included keeping physical distance, staying at home for isolation, remote work, as well as closed educational and sports facilities. Similar restrictions were introduced in other European countries [38,39,40]. The COVID-19 lockdown could have caused strong environmental and social changes in people’s lives, which in turn could have an impact on weight changes as mentioned above. Due to radical demands to stay at home, there was a sudden and dramatic change in the lifestyle of the population, specifically in dietary habits and daily activities [41]. Sedentary behavior was expected to occur, namely a decrease in outdoor activity and an increase in screen time. Such behaviors may negatively affect mental and physical health [42], including body weight changes. Therefore, the time of the pandemic had a two-way effect. Changes in lifestyle behavior were observed, both favorable and unfavorable [43], some respondents increased the incidence of physical activity (PA) [38], but there were groups in which PA decreased [41].
There is limited information on the relationships between restrictions linked to COVID-19 and changes in body weight [40,43]. Existing evidence showed that 29.9% of Polish respondents, both women and men, reported an increase of weight during quarantine, and 18.6% reported a decrease [43]. In our previous paper [44], we concentrated on dietary and lifestyle change patterns in Polish women and men and their associations with sociodemographic factors. We found out that opposite dietary change patterns occurred with the prevalence of the Prohealthy (28%) over the Unhealthy (19%). In the next step, we wanted to examine if those changes were associated with body weight changes. Due to the low number of male participants, we decided to focus on women only. Therefore, the aim of the study was to identify the body weight changes and their determinants in the nutritional and socio-demographic context during the COVID-19 pandemic among women in Poland.

2. Materials and Methods

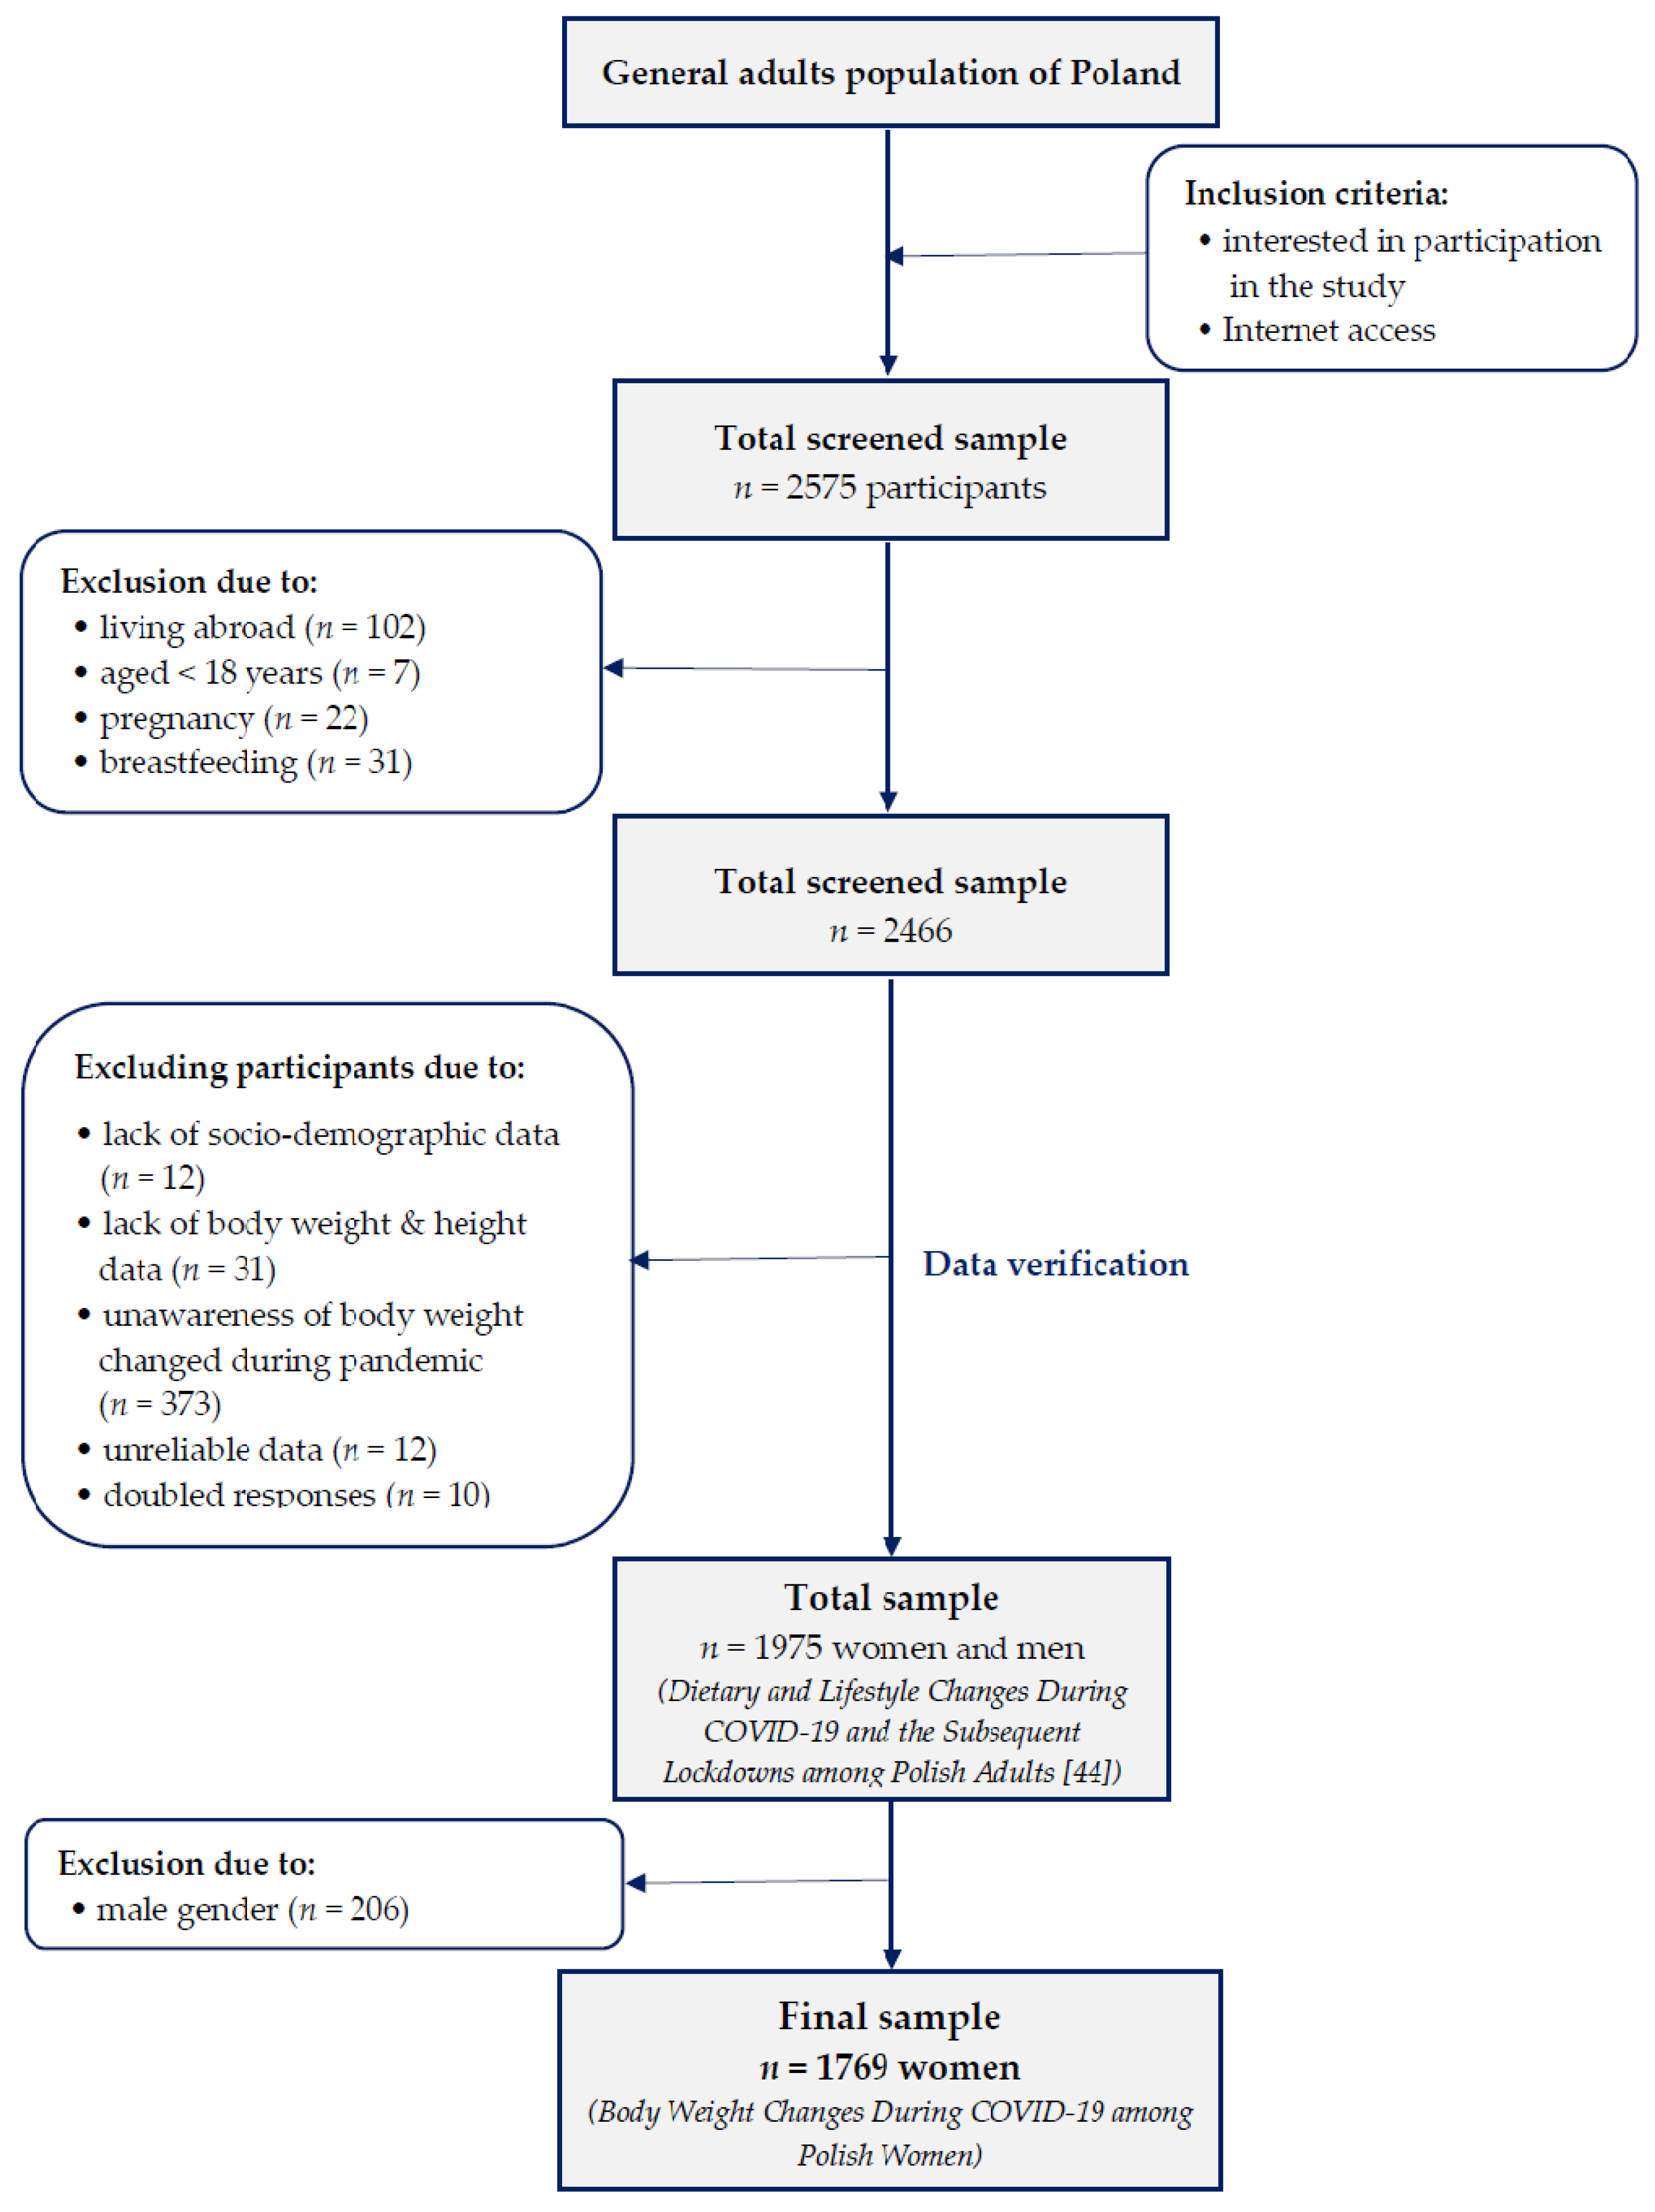
2.1. Study Design and Sample Collection

The PLifeCOVID-19 Study has been described in detail in a previous paper [44]. Briefly, it was a large cross-sectional survey conducted among adults in Poland. The data were collected with the CAWI (Computer Assisted Web Interviewing) technique in April and May 2020 during the quarantine due to the COVID-19 in Poland. Participants were recruited via social media. The survey was uploaded and shared on the Google Forms web survey platform. A link to the electronic survey was distributed by researchers via a range of methods: invitation via e-mails, shared in official pages, Facebook, Instagram, and WhatsApp. Additionally, we asked the participants to share the study link to increase the number of persons who receive the invitation to the study and thus increase study participants.
This survey included an introduction describing the background and the aims of the study and providing ethics information to participants. Respondents received information on the anonymity of the study, the voluntariness, and the possibility to stop their participation at any study stage.
The study was carried out in accordance with the Declaration of Helsinki (2000). Respondents did not provide their names or contact information (including the IP address) and could finish the survey at any stage, according to the General Data Protection Regulation of the European Parliament (GDPR 679/2016). Considering the anonymous nature of the online survey and the inability to track the sensitive personal data of respondents, the survey did not require the consent of the ethics committee.
A questionnaire was completed by 2575 individuals. Participants were excluded due to living abroad, inappropriate age (below 18 years), pregnancy, breastfeeding, as well as missing data (especially of body weight) or unreliable data, and doubled responses (Figure 1). Moreover, taking into account the small percentage of men who completed the questionnaire and the fact that women are more prone to changes in body weight, the present study was focused on Polish women and their changes in body weight due to the isolation during a pandemic.

2.2. Applied Questionnaire

More Details on this PLifeCOVID-19 questionnaire were given previously [44]. It consisted of questions on multidimensional changes in dietary lifestyle including diet, that is, in food group intake, physical activity, and screen and sleeping time durations. The reliability of the questionnaire was tested through piloting, prior to survey administration.

2.2.1. Dietary Data

We used data from respondents asked to answer questions about their diet during the pandemic and on the dietary changes that occurred in comparison to the pre-pandemic period. The food groups were as follow: vegetables, fruit, wholegrain cereal products, milk and milk products, pulses, fish and seafood, low-fat meat and/or eggs, processed meats, fast foods, salty snacks, confectionery, sweetened spreads, commercial pastry, homemade pastry, ice-cream and puddings, sweetened cereals and/or cereal bars, sugar-sweetened beverages, energy drinks, alcohol, water, coffee and tea, as well as homemade meals. Answers were categorized into four groups. Respondents could choose one of four categories meaning: increased intake (“I eat more”), decreased intake (“I eat less”), or no changes (answers: “I eat the same”; or “I didn’t eat before and during the pandemic”).
Additionally, respondents were asked to report their data on dietary habits during the pandemic that included the portions of selected food groups consumed per day or per week. We included vegetables, fruit, fish and seafood, sugar-sweetened beverages, water, and alcohol. Questions about the above mentioned foods were the following: How many vegetable portions do you consume per day? (1 portion = 100 g); How many fruit (including juices) portions do you consume per day? (1 portion = 100 g); How many fish and seafood (fresh and/or smoked) portions do you consume per week? (1 portion = 100–150 g); How many portions of sugar-sweetened beverages do you drink per day? (1 portion = 1 glass = 250 mL); How many portions of water do you drink per day? (1 portion = 1 glass = 250 mL); and How much alcohol do you drink per day? For vegetable or fruit consumption, respondents could choose one of four categories given: “more than 3 portions per day/1–3 portions per day/less than 1 portion per day/I do not eat at all”; for fish and seafood: “more than 2 portions per week/1–2 portions per week/less than 1 portion per week/I do not eat at all”. For sugar-sweetened beverages or water, respondents could choose one of four categories were available: “more than 2 glasses (>500 mL) per day/1–2 glasses (250–500 mL) per day/less than 1 glass (<250 mL) per day/I do not drink at all”. For alcohol respondents could choose also select one of four categories: “more than 2 drinks per day/ 1–2 drink per day/ less than 1 drink per day/I do not drink at all”.

2.2.2. Diet Quality

To assess the diet quality with regard to foods, based on Polish dietary guidelines [45], the Diet Quality Score (DQS) was established (a priori approach). The Diet Quality Score was calculated using the above-mentioned data on the portions of three food items (vegetables, fruit, and fish and seafood) and three types of drinks (sugar-sweetened beverages, water, and alcohol). Variables were re-categorized and the following scores were given: “1” (intake in accordance with the guidelines); “−1” (intake against the guidelines), or “0” (intake slightly different from the guidelines). Finally, all the numbers were summed up. The maximum and minimum possible scores were “6” and “−6”, respectively.

2.2.3. Lifestyle Data

The lifestyle predictors of changes in body weight included physical activity, and screen and sleep time. The respondents were asked to assess the time spent on a particular activity as well as changes that occurred during the pandemic. More details on this questionnaire part have been provided previously [44].

2.2.4. Socioeconomic Data

The socioeconomic predictors of changes in body weight included age; education level (lower, higher “university”); family composition during the pandemic (“living alone”, “homesharing”, “living with partner”, “living with partner and/or children”, “living with parents or other relatives”); place of residence (size of the place of residence, voivodship, “macroeconomic region”, “<50% of EU-28 GDP”, “50–100% of EU-28 GDP”, “>100% of EU-28 GDP”); as well as employment forms during pandemic (“did not work or considerable work time reduction”, “began remote work and/or study”, “work in the same form as earlier”). More details on this questionnaire part were provided previously [44].

2.3. Anthropometric Data

Data on the weight and height (last known before and during the pandemic) were self-reported by women. Data about body weight before and during the pandemic were used to calculate body weight changes. Body Mass Index (BMI, kg/m2) was calculated by adapting the Quetelet equation (body mass (kg)/height (m2)) and interpretation according to WHO was applied [46]. We categorized respondents into four groups: underweight (BMI < 18.5 kg/m2), normal weight (18.5 kg/m2 ≤ BMI < 25.0 kg/m2), overweight (25.0 kg/m2 ≤ BMI < 30.0 kg/m2), and obesity (BMI ≥ 30.0 kg/m2) [47].

2.4. Statistical Analysis

In the present study, a principal components factor analysis (PCA) was used to distinguish factors of dietary or lifestyle changes in women during the pandemic. The analysis was conducted separately for dietary and lifestyle changes after confirming the factorability and sphericity of data using Kaiser-Meyer-Olkin (KMO) and Barlett’s tests. One factor of dietary changes (DC) was derived as “positive dietary change” and two factors of lifestyle changes: negative—increased screen time and decreased physical activity (NLC) and positive—increased sleep time and increased physical activity (PLC). The factor-loading matrix identified by PCA, as well as explained variances is presented in detail in Table 1.
We reported data qualitatively as a percentage (%) and numbers (n) or quantitatively as a mean ± standard deviation (SD), median, and quartiles. For the differences between the qualitative variables, a chi−square test was used, while for quantitative variables U-MannWhitney or Kruskal–Wallis tests were used after checking the normality of distribution by Shapiro–Wilk test.
Firstly, for the investigated socio-demographic factors associated with odds of weight loss (1), stable weight (2), and weight gain (3) we conducted univariate and multivariate logistic regression analysis. We included the following variables in the analysis: Age, education level, place of living, macroeconomic region, employment forms during the pandemic, as well as the BMI category before the pandemic. The results of the logistic regression were reported as unadjusted (OR) and adjusted (aOR) odds ratios, and 95% confidence intervals (95% CI).
Secondly, to investigate the association between body mass changes and distinguished patterns of dietary and lifestyle changes as well as DQS, we conducted a linear regression analysis. We created three models: (1) univariate which analyzed all four variables separately; (2) multivariable model 1 which included all four variables simultaneously; (3) multivariable model 2 which was model 1 adjusted for age, BMI before the pandemic, changes in total food intake during the pandemic and macroeconomic region. Results of the linear regression were reported as regression coefficients β and 95% CI. Additionally, the R2 parameters and the p-value of each model were reported. Statistical analysis was performed with Statistica 13.3 software (TIBCO Software Inc., Palo Alto, CA, USA) and the statistical significance was set at p ≤ 0.05.

3. Results

Table 2 shows the socio-demography, self-assessment of difficulties with food ability during the pandemic, changes in total food intake, values of DQS, and BMI before and during the pandemic in respondents. Most of them were aged ≤40 years old (75%), had a higher level of education (79%), living with a partner and/or children (58%), in the macroeconomic region 50–100% of EU-28 GDP (61%). Difficulties with food ability during the pandemic occurred for 33% of the women, and 36% assessed that they ate more in this period. Over half of the women had a normal weight before and during the pandemic (61%), over one-third had excessive body weight, and about 6% were underweight. Weight gain during the pandemic was found in 34% of women, while a loss in weight was found in 18%. In the group of respondents with weight loss, more women were aged <30 years, living in the urban agglomeration, in the macroeconomic region with the highest GDP, and began remote work and/or study. Body mass during the pandemic in 68% of women in this group was classified as normal weight. In this group, over 40% declared that they ate less during a pandemic or did not change their total food intake. Average DQS was statistically significantly higher in women with weight loss in comparison to those with weight gain.
Details for food portions by weight changes during the pandemic are presented in the supplementary material (Table S1). Generally, women with weight loss compared to those with weight gain declared more frequently the intake per day of more than three portions of vegetables (24.4% vs. 14.6%), more than 500 mL of water (79.1% vs. 70.1%), and tended not to drink alcohol (47.5% vs. 38.0%) (Table S1). Moreover, a higher percentage of women with weight loss than with weight gain declared the increase in the consumption of vegetables (32.3% vs. 16.0%), fruit (23.8% vs. 14.3%), pulses (19.4% vs. 14.3%), as well as fish and seafood (9.1% vs. 6.2%) during the COVID-19 pandemic (Table S2). On the contrary, more women with weight gain than with weight loss declared unhealthy dietary changes, mainly the increase in the consumption of sweetened spreads (8.1% vs. 0.9%), commercial pastry (21.3% vs. 4.7%), confectionery (52.6% vs. 17.5%), salty snacks (30.4% vs. 11.3%), fast food (14.1% vs. 4.4%), sugar-sweetened beverages (8.1% vs. 2.8%), processed meat (16.3% vs. 7.8%), ice-cream and pudding (16.8% vs. 8.4%), and alcohol (25.4% vs. 4.1%) (Table S2). Considering the lifestyle changes, a higher percentage of women with weight gain during pandemic decreased their physical activity (60.7% vs. 31.6%), and increased screen time (61.5% vs. 49.1%) (Table S2).

3.1. Body Weight and BMI Changes

On average, in the study period, women gained 0.4 kg (Figure 2). The body weight changes differed significantly between the groups (Figure 2).
Considering the BMI category during the pandemic, the majority of women with obesity (95%) before the pandemic did not change in the BMI category (Table 3). Over 13% of women who were underweight and almost 9% who were overweight changed their body weight during this period to the normal weight category. As many as 74% of women who were underweight before the pandemic reduced their body weight, while only 21% gained weight. It should be noted that weight loss dominated in all subgroups, except the “obesity group”, where weight gain prevailed (Table 3).

3.2. Factors Associated with Body Weight Changes

Among dietary changes, an increase in vegetable intake, and a decrease in consumption of confectionery, salty snacks, commercial pastry, fast food, and sugar-sweetened beverages, and positive lifestyle changes (PLC) such as increases in both sleep time and PA were identified as significant variables for weight loss. In turn, negative lifestyle changes (NLC) such as increasing screen time and decreasing PA were identified as significant variables for weight gain. Total variances in body weight changes were explained by 15.6% of dietary changes, by 38.9% of negative lifestyle changes, and 34.6% of positive lifestyle changes, respectively (Table 1). Results of univariate and multivariate logistic regression models analyzing sociodemographic factors and body weight changes are presented in Table 4.
Older age and being underweight before pandemic lowered chance of weight loss by about 22% (aOR 0.78; 95% CI, 0.69–0.89) or 76% (aOR 0.24; 95% CI, 0.10–0.56), respectively (Table 4). In turn, remote work and/or study were associated with two times higher chances of weight loss (aOR 2.01; 95% CI, 1.27–3.18). Women who were overweight or with obesity had a higher chance of weight loss, about 1.4 times (aOR 1.39; 95% CI, 1.04–1.86), and 1.8 times (aOR 1.76; 95% CI, 1.15–2.69), respectively.
In the crude model, respondents with a lower educational level had a lower chance of weight loss, while respondents living in the highest macroeconomic region had a higher chance (Table 4), but associations disappeared after the adjustment.
Higher risk of weight gain was associated with living in a macroeconomic region >50% of EU-28 GDP (aOR 1.55; 95% CI, 1.16–2.08 for region 50–100% of EU-28 GDP and aOR 1.65; 95% CI, 1.08–2.53 for region >100% of EU-28 GDP). Moreover, women with obesity before the pandemic had a 1.6 times higher risk of weight gain (aOR 1.64; 95% CI, 1.15–2.32), while women who were underweight had a 46% lower risk of weight gain (aOR 0.54; 95% CI, 0.33–0.88).
The results of the regression analysis are shown in Table 5. Univariate regression analysis results indicated that healthy dietary changes (β = −0.316; R2 = 0.10, p < 0.001), positive lifestyle changes (β = −0.126; R2 = 0.02, p < 0.001), and higher DQS value (β = −0.093; R2 = 0.01, p < 0.001) were associated with weight loss. On the contrary, negative lifestyle changes (increase of screen time and decrease of PA) positively correlated with weight gain (β = 0.182; R2 = 0.03, p < 0.001). Taking into consideration the results of multivariate regression analysis (model 1), among four factors, only the value of DQS was not significant for body weight changes. Healthy dietary changes and positive lifestyle changes correlated with weight loss, while negative lifestyle changes determined weight gain. This model explained 12% of the variance in body weight changes. The final regression model (Model 2), that included adjustment for significant factors revealed in the logistic regression analysis (age, BMI before the pandemic, employment status, macroeconomic region, and changes in total food intake during the pandemic), explained 23% of the variance in body weight changes (R2 = 0.23, p < 0.001). Among four analyzed factors, only two remained important for body weight changes: healthy dietary changes correlated with weight loss (β = −0.167; p < 0.001), while the negative lifestyle changes correlated with weight gain (β = 0.113; p < 0.001).

4. Discussion

Our survey revealed that the during studied period of the COVID-19 pandemic in Poland, 34% of women gained weight, while 18% of women reduced weight. In a group with weight gain, women increased their body weight by 2.8 kg on average and around 65% of them increased their total food intake. The highest percentage (74%) of women who were underweight before the pandemic that reduced their body weight, and the highest percentage (44%) of women with obesity, who gained weight during the pandemic, should be assessed as the negative impact of the pandemic. Unhealthy dietary changes and the negative lifestyle changes that comprised of an increase in screen time and a decrease in PA were found as key factors associated with weight gain, while the quality of the diet itself measured by DQS had no effect. A higher risk of weight gain was associated with being obese before the pandemic or living in a macroeconomic region >50% of EU-28 GDP, while younger age, and remote work and/or study were associated with a higher chance of weight loss.
The weight loss established in our study was mainly positively associated with healthy eating changes (an increase in vegetable consumption, and a decrease in consumption of unhealthy food groups like confectionery, salty snacks, commercial pastry, fast food, and sugar=sweetened beverages). The vegetable intake is inversely related to the weight change over time [48], and reduces the likelihood of abdominal obesity [49] and therefore may promote weight loss. The decrease in body weight was also positively correlated with the decrease in consumption of the so-called discretionary foods: confectionery, salty snacks, commercial pastry, fast food, and sugar-sweetened beverages. Such an effect is a confirmed phenomenon, that reducing the consumption of those types of foods and replacing them, even partially, with healthy products leads to weight loss in people of all ages [50]. Our results prove that weight loss during the lockdown period was achieved by changes in eating behavior toward a healthier diet. Similar findings were obtained by Pellegrini et al. [39], although their interventional study concerned obese adults that had undergone the educational program of body weight reduction with the Mediterranean diet implementation. Even though it seems that our finding is positive for public health, we noted, that many women who were underweight further decreased their body weight during the pandemic, which should be considered as a disadvantage. It should be underlined that underweight adults with influenza may be five times more likely to develop severe disease, and have an increased risk of hospitalization, regardless of viral pathogen status [51]. Considering the above, this group deserves special attention from professionals in pandemic conditions and lockdown.
In our study, women who lost weight during the pandemic were young or started remote work and/or study. Being at home and remote working could have a dual effect on weight reduction. On the one hand, they could be conducive to a greater regularity of life, including the preparation of meals and their consumption [38], as well as to an interest in healthy eating. On the other hand, there has been a limitation of direct interpersonal contacts and gatherings conducive to an increase in the consumption of food, often unhealthy [52]. In addition, young women may lose weight more easily under the influence of various factors than older women, who undergo specific metabolic changes in perimenopause [53].
The results of our study showed that weight gain was favored by unhealthy lifestyle changes like reduced physical activity and increased screen time. Both those factors prove the enhancement of sedentary life, which generated a positive energy balance responsible for weight gain. An increase in screen time is positively associated with a risk of excessive body weight regardless of physical activity intensity. Moreover, this effect is especially noticeable in women, when insufficient physical activity and extended screen time occur simultaneously [54]. Additionally, low physical activity levels may influence both body fat and appetite dysregulation, so the physiological processes could play a role [55]. Even a few days of inactivity may give evident, negative health consequences [56]. Prolonged periods of COVID-19 isolation and the need to work remotely can lead to adverse weight gain with serious health consequences. In many cases, this affects people who are already obese, so an increase in the incidence of health complications related to obesity and inactivity can be expected. Specifically, obesity is a medical disorder with inflammation that induce immune response dysregulation. Regrettably, obese and overweight adults are also at higher risk of health decline with COVID-19 and need intensive care more often [57].
The present study showed that women living in a macroeconomic region> 50% of EU-28 GDP or being obese before the pandemic had a higher chance of weight gain. The first mentioned finding is a bit disturbing, as Abbade and Dewes showed [58], that economic development influences negatively the obesogenic environment and thus the obesogenic severity. Interestingly, the results of another study conducted in Poland among the population aged 15–29 years are in line with our findings and indicate the positive association between the economic situation and obesity prevalence [59]. Additionally, Fox et al. [60] emphasized that women’s empowerment associated with economic development, robustly predicts higher mean BMI, that could be important in our study group. As it turns out, the association is complex and differs depending on the country of study, and therefore on socio-demographic specificity. Perhaps this relationship is valid in typical market and lifestyle conditions. It is also possible that the time of COVID-19 isolation was completely different from previous people’s experiences, unpredictable and stressful, and therefore cannot be compared to times of relative economic calm, but no comparative data are available yet.
It is important to note that weight gain prevailed in women with obesity before the pandemic. Sidor and Rzymski [43] showed, on average, a similar tendency for both genders without specifying the women. The results of Di Renzo et al. [38] only show in Italian adults that the perception of weight gain during lockdown was observed in 48.6% of the population (men and women), but in fact, the changes have not been studied. Staying at home for a long time can also be conducive to eating tasty meals, snacks, and drinking alcohol [43]. The increase in intake of foods reach in fat and sugars and/or a decrease in physical activity due to increasing urbanization are the main and obvious reasons for the positive energy balance and the weight gain [13]. Perhaps behaviors that have not been practiced previously can appear in circumstances like that. During a nationwide quarantine, negative changes in dietary behaviors (e.g., snacking of unhealthy foods) and as a consequence, the changes in body weight can affect a significant percentage of the population. People who are overweight or obese are most prone to those negative modifications. Considering the pandemic nature of obesity and COVID-19, their cumulative consequences can strongly affect the health situation of societies, because, in addition to an increase in total food intake and particularly in the consumption of unhealthy foods, the self-reporting of boredom/loneliness, anxiety/depression have also been noted [39]. These observations lead to the overall conclusion that quarantine can enhance pre-existing adverse weight changes and potentially can increase BMI-related health problems [43].
Considering the opposite/ ambiguous effects of diet and lifestyle on weight changes in lockdown conditions, other aspects of such relationships should be recognized as human personality [61,62,63,64,65,66], which are drivers of self-regulation processes [67]. People with a higher level of self-regulatory characteristics, for example, conscientiousness, appreciation for their health, and engaging in activities that support maintaining health [68]. These features may prove to be significant for the adherence to the diet and thus the maintenance of a healthy body weight under blockage conditions, specifically when the physical activity has been reduced and screen time has been extended. Thus, personality traits may prove to be crucial in maintaining diet and body weight under closed conditions. Therefore, further research seems to be needed to clarify the association between personality traits and body weight changes in lockdown conditions in the context of diet.

Strengths and Limitations

It should be underlined that surveys on diet during the COVID-19 pandemic that have been conducted so far differ from our assumptions. The impact of the pandemic on lifestyle and eating behavior was studied mainly without gender differentiation, and changes in body weight were treated marginally or cursorily [38,39,40,41,43,44]. Although in other studies the weight changes during lockdown have been reported, not even one has clearly analyzed the nutritional or lifestyle determinants of this fact. An important strength of our study includes a homogeneous group of adult women from different regions of Poland. Besides, the online survey is assumed to be quite an ideal research tool during social (pandemic) isolation which allowed us to increase the number of study participants. The possibility of comparing body weight changes, dietary intake changes, and lifestyle changes in this group of women before and during social isolation due to the COVID-19 pandemic was another strength of this study. The PLifeCOVID-19 questionnaire allowed us to collect a high amount of information related to multidimensional dietary-lifestyle changes during the lockdowns.
There are also some limitations to the study that should be considered. Firstly, we were unable to verify the data due to the character of the survey. Nevertheless, online data collection is safe and effective in such specific conditions as national quarantine [69]. Secondly, body weight and height values as well as body weight changes were self-reported by women and therefore should be treated with caution. Thirdly, there is a lack of quantitative data on food consumption and energy intake. Moreover, the convenient sampling of respondents used in the survey may bias the findings and they cannot be generalized for the total population. Additionally, questionnaires that are spread through social media could be subject to selection bias. Finally, some bias may result from the characteristics of the survey method that we applied (a cross-sectional one).

5. Conclusions and Implications

Summarizing, the COVID-19 lockdown period changed the lifestyles of Polish women and caused bidirectional changes in body weight, however two times more women gained weight than lost it.
The weight of the body is influenced by a widely understood lifestyle, the factors of which act directly or indirectly. The latter include diet and exercise, while the isolation of COVID-19 can be seen as a new indirect factor, which triggers many new behaviors that determine diet and lifestyle. The isolation of COVID-19 limited social opportunities, outdoor activities, and everyday behaviors. The need to extend physical isolation is a challenge for specialists who should work to reduce the negative impact of the pandemic on nutritional status. It seems advisable to create separate dietary and lifestyle guidelines tailored to the individual needs of women who are underweight and with excessive body weight for the conditions of staying in physical isolation due to specific pandemic situations. It is worth highlighting that such guidelines should also take sustainability aspects into account. Therefore, in the future dietary guidelines development, more attention should be paid not only to the nourishment and health-related aspects but also to environmental impacts. Both, the reduction of excessive body weight and the maintenance of a normal weight should be based on the principle to eat and live sustainably and healthily.
Further studies should be conducted to understand the people’s social and health situation during a pandemic, which is important to formulate prevention plans adequate to reality depending on the needs as well as life and socio-demographic factors during the lockdown. For a better understanding of changes in weight and even in body structure, it would be advisable to collect additional anthropometric parameters, easily obtained from the respondent in a self-assessment, for example, circumferences of waist and hip. They could only partially replace the body composition analysis conducted in direct personal contact but would give a better picture than just body weight and height.
Moreover, as the share of obesity continues to increase, critical situations such as the COVID-19 pandemic might further increase the obesity pandemic and vice versa. Both pandemics overlap and intensify each other. The COVID-19 pandemic may contribute to the obesity pandemic and the obesity pandemic may increase the risk of complications and mortality from COVID-19. As such, developing the nutritional and lifestyle programs and engaging institutions as well as various groups of professionals like nutritionists, doctors, and psychologists, should be of special interest for public health.
The problem studied in our work suits Hakovirta and Denuwara’s concept of recognizing health as the fourth pillar of sustainable development [1]. Each element related to health, including body weight as a consequence of lifestyle and a determinant of health, can become an important indicator of the broadly understood sustainability development of societies.

Supplementary Materials

The following are available online at https://www.mdpi.com/2071-1050/12/18/7768/s1, Table S1. Food portions by weight changes in Polish women during the COVID-19 pandemic, Table S2. Lifestyle and food intake changes by weight changes in Polish women during the COVID-19 pandemic (% (n)).

Author Contributions

J.H., M.G., and M.A.Z.-P.: study concept and design; M.G., J.H., M.A.Z.-P., and M.E.D.: data acquisition; M.A.Z.-P., M.E.D., M.G., M.J.-B., and J.H.: data analysis; M.A.Z.-P.: statistical analysis for this study; M.E.D., M.G., M.J.-B., J.H., and M.A.Z.-P.: data interpretation and writing the original draft; M.E.D. and M.J.-B.: visualization; J.H. and M.G.: supervision. All authors have read and agreed to the published version of the manuscript.

Funding

The study was financially supported by sources of the Polish Ministry of Sciences and Higher Education within funds of the Institute of Human Nutrition Sciences, Warsaw University of Life Sciences (WULS), for scientific research.

Acknowledgments

The authors would like to extend their gratitude and acknowledgments to all study participants and to all colleagues for their support and help in disseminating the questionnaire.

Conflicts of Interest

The authors declare that they have no competing interests.

References

  1. Hakovirta, M.; Denuwara, N. How COVID-19 Redefines the Concept of Sustainability. Sustainability 2020, 12, 3727. [Google Scholar] [CrossRef]
  2. Pradhan, P.; Kropp, J.P. Interplay between Diets, Health, and Climate Change. Sustainability 2020, 12, 3878. [Google Scholar] [CrossRef]
  3. World Health Organization. Global Health Observatory Prevalence of Overweight among Adults, BMI ≥ 25, Age-standardized. Estimates by WHO Region. 2017. Available online: https://apps.who.int/gho/data/view.main.GLOBAL2461A?lang=en (accessed on 2 June 2020).
  4. Poznańska, A.; Rabczenko, D.; Wojtyniak, B. Selected life style-related health RSC factors. In Health Stastus of Polish Population–In Short; Wojtyniak, B., Goryński, P., Eds.; National Institute of Public Health–National Institute of Hygiene: Warsaw, Poland, 2018; pp. 227–239. ISBN 978-83-65870-16-2. [Google Scholar]
  5. World Health Organization. Obesity and Overweight. 2020. Available online: https://www.who.int/news-room/fact-sheets/detail/obesity-and-overweight (accessed on 2 June 2020).
  6. Zamri, L.A.; Appannah, G.; Zahari Sham, S.Y.; Mansor, F.; Ambak, R.; Mohd Nor, N.S.; Aris, T. Weight Change and Its Association with Cardiometabolic Risk Markers in Overweight and Obese Women. J. Obes. 2020. [Google Scholar] [CrossRef]
  7. Castillo-Martinez, L.; Lopez-Alvarenga, J.C.; Villa, A.R.; Gonzalez-Barranco, J. Menstrual cycle length disorders in 18-to 40-year-old obese women. Nutrition 2003, 19, 317–320. [Google Scholar] [CrossRef]
  8. Lumsden, M.A.; Hor, K. Impact of obesity on the health of women in midlife. Obstet. Gynaecol. 2015, 17, 201–208. [Google Scholar] [CrossRef]
  9. Douchi, T.; Kuwahata, R.; Yamamoto, S.; Oki, T.; Yamasaki, H.; Nagata, Y. Relationship of upper body obesity to menstrual disorders. Acta. Obstet. Gynecol. Scand. 2002, 81, 147–150. [Google Scholar] [CrossRef]
  10. Huttunen, R.; Syrjanen, J. Obesity and the risk and outcome of infection. Int. J. Obes. 2013, 37, 333–340. [Google Scholar] [CrossRef] [Green Version]
  11. Dobner, J.; Kaser, S. Body mass index and the risk of infection—From underweight to obesity. Clin. Microbiol. Infect. 2018, 24, 24–28. [Google Scholar] [CrossRef] [Green Version]
  12. Frasca, D.; Blomberg, B.B. The impact of obesity and metabolic syndrome on vaccination success. Interdiscip. Top. Gerontol. Geriatr. 2020, 43, 86–97. [Google Scholar]
  13. Lee, A.; Cardel, M.; Donahoo, W.T. Social and Environmental Factors Influencing Obesity. Endotext.Org. 2019. Available online: https://www.ncbi.nlm.nih.gov/books/NBK278977/ (accessed on 2 July 2020).
  14. Magkos, F.; Tetens, I.; Gjedsted Bügel, S.; Felby, C.; Rønnow Schacht, S.; Hill, J.O.; Ravussin, E.; Astrup, A. The Environmental Foodprint of Obesity. Obesity 2020, 28, 73–79. [Google Scholar] [CrossRef] [Green Version]
  15. World Health Organization. Nutrition Landscape Information System (NLiS). 2017. Available online: https://apps.who.int/nutrition/landscape/help.aspx?menu=0&helpid=392&lang=EN (accessed on 2 July 2020).
  16. Lorem, G.F.; Schirmer, H.; Emaus, N. What is the impact of underweight on self-reported health trajectories and mortality rates: A cohort study. Health Qual. Life Outcomes 2017, 15, 191. [Google Scholar] [CrossRef] [PubMed]
  17. Hong, S.; Yi, S.W.; Sull, J.W.; Hong, J.S.; Jee, S.H.; Ohrr, H. Body mass index and mortality among Korean elderly in rural communities: Kangwha Cohort Study. PLoS ONE 2015, 10, e0117731. [Google Scholar] [CrossRef] [Green Version]
  18. Pednekar, M.S.; Hakama, M.; Hebert, J.R.; Gupta, P.C. Association of body mass index with all-cause and cause-specific mortality: Findings from a prospective cohort study in Mumbai (Bombay), India. Int. J. Epidemiol. 2008, 37, 524–535. [Google Scholar] [CrossRef] [PubMed] [Green Version]
  19. Sauvaget, C.; Ramadas, K.; Thomas, G.; Vinoda, J.; Thara, S.; Sankaranarayanan, R. Body mass index, weight change and mortality risk in a prospective study in India. Intern. J. Epidemiol. 2008, 37, 990–1004. [Google Scholar] [CrossRef] [PubMed] [Green Version]
  20. Xiang, X.; An, R. Body weight status and onset of cognitive impairment among U.S. middle-aged and older adults. Arch. Gerontol. Geriatr. 2015, 60, 394–400. [Google Scholar] [CrossRef]
  21. Wu, S.; Wang, R.; Zhao, Y.; Ma, X.; Wu, M.; Yan, X.; He, J. The relationship between self-rated health and objective health status: A population-based study. BMC Public Health 2013, 13, 320. [Google Scholar] [CrossRef] [Green Version]
  22. Zhu, Y.; Wang, Q.; Pang, G.; Lin, L.; Origasa, H.; Wang, Y.; Di, J.; Shi, M.; Fan, C.; Shi, H. Association between Body Mass Index and Health-Related Quality of Life: The “Obesity Paradox” in 21,218 Adults of the Chinese General Population. PLoS ONE 2015, 10, e0130613. [Google Scholar] [CrossRef]
  23. Andersen, A.E.; Ryan, G.L. Eating disorders in the obstetric and gynecologic patient population. Obstet. Gynecol. 2009, 114, 1353–1367. [Google Scholar] [CrossRef]
  24. Boutari, C.; Pappas, P.D.; Mintziori, G.; Nigdelis, M.P.; Athanasiadis, L.; Goulis, D.G.; Mantzoros, C.S. The effect of underweight on female and male reproduction. Metab. Clin. Exp. 2020, 107, 154229. [Google Scholar] [CrossRef]
  25. Harpsøe, M.C.; Nielsen, N.M.; Friis-Møller, N.; Andersson, M.; Wohlfahrt, J.; Linneberg, A.; Nohr, E.A.; Jess, T. Body mass index and risk of infections among women in the Danish national birth cohort. Am. J. Epidemiol. 2016, 183, 1008e17. Available online: http://aje.oxfordjournals.org/content/183/11/1008.abstract (accessed on 5 July 2020). [CrossRef]
  26. Ladabaum, U.; Mannalithara, A.; Myer, P.A.; Singh, G. Obesity, abdominal obesity, physical activity, and caloric intake in US adults: 1988 to 2010. Am. J. Med. 2014, 127, 717–727. [Google Scholar] [CrossRef] [PubMed] [Green Version]
  27. Pearson, A.L.; Bentham, G.; Day, P.; Kingham, S. Associations between neighborhood environmental characteristics and obesity and related behaviours among adult New Zealanders. BMC Public Health 2014, 14, 553. [Google Scholar] [CrossRef] [PubMed] [Green Version]
  28. Angkurawaranon, C.; Jiraporncharoen, W.; Chenthanakij, B.; Doyle, P.; Nitsch, D. Urban environments and obesity in Southeast Asia: A systematic review, meta-analysis and meta-regression. PLoS ONE 2014, 9, e113547. [Google Scholar] [CrossRef] [PubMed]
  29. Burgoine, T.; Forouhi, N.G.; Griffin, S.J.; Wareham, N.J.; Monsivais, P. Associations between exposure to takeaway food outlets, takeaway food consumption, and body weight in Cambridgeshire, UK: Population based, cross sectional study. BMJ 2014, 348, g1464. [Google Scholar] [CrossRef] [Green Version]
  30. Escoto, K.; French, S.; Harnack, L.; Toomey, T.L.; Hannan, P.J.; Mitchell, N.R. Work hours, weight status, and weight–related behaviours: A study of metro transit workers. Int. J. Behav. Nutr. Phys. Act. 2010, 7, 91. [Google Scholar] [CrossRef] [Green Version]
  31. Wu, L.; Zhai, L.; Zhang, D. Sleep duration and obesity among adults: A meta-analysis of prospective studies. Sleep Med. 2014, 15, 1456–1462. [Google Scholar] [CrossRef]
  32. Kirkegaard, H.; Stovring, H.; Rasmussen, K.; Abrams, B.; Sørensen, T.I.A.; Nohr, E.A. How do pregnancy—Related weight changes and breastfeeding relate to maternal weight and BMI–adjusted waist circumference 7 y after delivery? Results from a path analysis. Am. J. Clin. Nutr. 2014, 99, 312–319. [Google Scholar] [CrossRef] [Green Version]
  33. Chaput, J.P.; Pérusse, L.; Després, J.P.; Tremblay, A.; Bouchard, C. Findings from the Quebec Family Study on the Etiology of Obesity: Genetics and Environmental Highlights. Curr. Obes. Rep. 2014, 3, 54–66. [Google Scholar] [CrossRef] [Green Version]
  34. Siahpush, M.; Huang, T.T.; Sikora, A.; Tibbits, M.; Shaikh, R.A.; Singh, G.K. Prolonged financial stress predicts subsequent obesity: Results from a prospective study of an Australian national sample. Obesity 2013, 22, 616–621. [Google Scholar] [CrossRef]
  35. Kubzansky, L.; Bordelois, P.; Jun, H.; Roberts, A.L.; Cerda, M.; Bluestone, N.; Koenen, K.C. The weight of traumatic stress: A prospective study of posttraumatic stress disorder symptoms and weight status in women. JAMA Psychiatry 2014, 71, 44–51. [Google Scholar] [CrossRef]
  36. Jeffery, S.; Karla, H. Marital status, marital history, body weight, and obesity. Marriage Fam. Rev. 2011, 47, 474–504. [Google Scholar] [CrossRef]
  37. Lassetter, J.H.; Clark, L.; Morgan, S.E.; Brown, L.B.; VanServellen, G.; Duncan, K.; Hopkins, E.S. Health literacy and obesity among native Hawaiian and Pacific Islanders in the United States. Public Health Nurs. 2015, 32, 15–23. [Google Scholar] [CrossRef] [PubMed]
  38. Di Renzo, L.; Gualtieri, P.; Pivari, F.; Soldati, L.; Attinŕ, A.; Cinelli, G.; Leggeri, C.; Caparello, G.; Barrea, L.; Scerbo, F.; et al. Eating habits and lifestyle changes during COVID-19 lockdown: An Italian survey. J. Transl. Med. 2020, 18, 1–15. [Google Scholar] [CrossRef] [PubMed]
  39. Pellegrini, M.; Ponzo, V.; Rosato, R.; Scumaci, E.; Goitre, I.; Benso, A.; Belcastro, S.; Crespi, C.; De Michieli, F.; Ghigo, E.; et al. Changes in Weight and Nutritional Habits in Adults with Obesity during the “Lockdown” Period Caused by the COVID-19 Virus Emergency. Nutrients 2020, 12, 2016. [Google Scholar] [CrossRef] [PubMed]
  40. Rodríguez-Pérez, C.; Molina-Montes, E.; Verardo, V.; Artacho, R.; García-Villanova, B.; Guerra-Hernández, E.J.; Ruíz-López, M.D. Changes in Dietary Behaviours during the COVID-19 Outbreak Confinement in the Spanish COVIDiet Study. Nutrients 2020, 12, 1730. [Google Scholar] [CrossRef]
  41. Ammar, A.; Brach, M.; Trabelsi, K.; Chtourou, H.; Boukhris, O.; Masmoudi, L.; Bouaziz, B.; Bentlage, E.; How, D.; Ahmed, M.; et al. Effects of COVID-19 Home Confinement on Eating Behaviour and Physical Activity: Results of the ECLB-COVID19 International Online Survey. Nutrients 2020, 12, 1583. [Google Scholar] [CrossRef]
  42. Logan, A.C.; Katzman, M.A.; Balanza-Martınez, V. Natural environments, ancestral diets, and microbial ecology: Is there a modern “paleo-deficit disorder”? Part II. J. Physiol. Anthropol. 2015, 34, 9. [Google Scholar] [CrossRef] [Green Version]
  43. Sidor, A.; Rzymski, P. Dietary Choices and Habits during COVID-19 Lockdown: Experience from Poland. Nutrients 2020, 12, 1657. [Google Scholar] [CrossRef]
  44. Górnicka, M.; Drywień, M.E.; Zielinska, M.A.; Hamułka, J. Dietary and Lifestyle Changes During COVID-19 and the Subsequent Lockdowns among Polish Adults: A Cross-Sectional Online Survey PLifeCOVID-19 Study. Nutrients 2020, 12, 2324. [Google Scholar] [CrossRef]
  45. Jarosz, M. Pyramid of Healthy Nutrition and Physical Activity for adults. National Center for Nutritional Education. 2019. Available online: https://ncez.pl/abc-zywienia-/zasady-zdrowego-zywienia/piramida-zdrowego-zywienia-i-aktywnosci-fizycznej-dla-osob-doroslych (accessed on 5 June 2020). (In Polish).
  46. Branca, F.; Nikogosian, H.; Lobstein, T. World Health Organization. Regional Office for Europe. In The Challenge of Obesity in the WHO European Region and the Strategies for Response; WHO Regional Office for Europe: Copenhagen, Denmark, 2007; ISBN 9789289014083. [Google Scholar]
  47. Ashwell, M.; Gibson, S. Waist-to-height ratio as an indicator of early health risk: Simpler and more predictive than using a matrix based on BMI and waist circumference. BMJ Open 2016, 6, e010159. [Google Scholar] [CrossRef] [Green Version]
  48. Bertoia, M.L.; Mukamal, K.J.; Cahill, L.E.; Hou, T.; Ludwig, D.S.; Mozaffarian, D.; Willett, W.C.; Hu, F.B.; Rimm, E.B. Changes in Intake of Fruits and Vegetables and Weight Change in United States Men and Women Followed for Up to 24 Years: Analysis from Three Prospective Cohort Studies. PLoS Med. 2015, 12, e1001878. [Google Scholar] [CrossRef] [PubMed]
  49. Yu, Z.M.; DeClercq, V.; Cui, Y.; Forbes, C.; Grandy, S.; Keats, M.; Parker, L.; Sweeney, E.; Dummer, T.J.B. Fruit and vegetable intake and body adiposity among populations in Eastern Canada: The Atlantic Partnership for Tomorrow’s Health Study. BMJ Open 2018, 8, 18060. [Google Scholar] [CrossRef] [Green Version]
  50. Lal, A.; Peeters, A.A.; Brown, V.; Nguyen, P.; Quynh Tran, H.N.; Nguyen, T.; Tonmukayakul, U.; Sacks, G.; Calache, H.; Martin, J.; et al. The Modelled Population Obesity-Related Health Benefits of Reducing Consumption of Discretionary Foods in Australia. Nutrients 2020, 12, 649. [Google Scholar] [CrossRef] [PubMed] [Green Version]
  51. Moser, J.-A.S.; Galindo-Fraga, A.; Ortiz-Hernández, A.A.; Gu, W.; Hunsberger, S.; Galán-Herrera, J.-F.; Guerrero, M.L.; Ruiz-Palacios, G.M.; Beigel, J.H. Underweight, overweight, and obesity as independent risk factors for hospitalization in adults and children from influenza and other respiratory viruses. Influenza Other Respi. Viruses. 2019, 13, 3–9. [Google Scholar] [CrossRef]
  52. Bell, R.; Pliner, P.L. Time to eat: The relationship between the number of people eating and meal duration in three lunch settings. Appetite 2003, 41, 215–218. [Google Scholar] [CrossRef] [Green Version]
  53. Abdulnour, J.; Doucet, E.; Brochu, M.; Lavoie, J.-M.; Strychar, I.; Rabasa-Lhoret, R.; Prud’homme, D. The effect of the menopausal transition on body composition and cardiometabolic risk factors: A Montreal-Ottawa New Emerging Team group study. Menopause 2012, 19, 760–767. [Google Scholar] [CrossRef]
  54. Duncan, M.J.; Vandelanotte, C.; Caperchione, C.; Christine Hanley, C.; Mummery, W.K. Temporal trends in and relationships between screen time, physical activity, overweight and obesity. BMC Public Health 2012, 12, 1060. [Google Scholar] [CrossRef] [PubMed]
  55. Panahi, S.; Tremblay, A. Sedentariness and health: Is sedentary behavior more than just physical inactivity? Front. Public. Heal. 2018, 6, 258. [Google Scholar] [CrossRef] [Green Version]
  56. Narici, M.; De Vito, G.; Franchi, M.; Paoli, A.; Moro, T.; Marcolin, G.; Grassi, B.; Baldassarre, G.; Zuccarelli, L.; Biolo, G.; et al. Impact of sedentarism due to the COVID-19 home confinement on neuromuscular, cardiovascular and metabolic health: Physiological and pathophysiological implications and recommendations for physical and nutritional countermeasures. Eur. J. Sport Sci. 2020, 1–22. [Google Scholar] [CrossRef]
  57. Magdy Beshbishy, A.; Hetta, H.F.; Hussein, D.E.; Saati, A.A.; Uba, C.; Rivero-Perez, N.; Zaragoza-Bastida, A.; Shah, M.A.; Behl, T.; Batiha, G.-S. Factors Associated with Increased Morbidity and Mortality of Obese and Overweight COVID-19 Patients. Biology 2020, 9, 280. [Google Scholar] [CrossRef]
  58. Abbade, E.B.; Dewes, H. Behavioral and societal drivers of an obesogenic environment worldwide. Nutr. Food Sci. 2015, 45, 229–241. [Google Scholar] [CrossRef]
  59. Zienkiewicz, E.; Okonski, M.; Matuszewski, Ł.; Zienkiewicz, T.; Go´zdziewska, M.; Klatka, M. Influence of urbanization level and Gross Domestic Product on the prevalence of adolescent obesity in Poland. Ann. Agric. Environ. Med. 2014, 21, 136–142. [Google Scholar] [PubMed]
  60. Fox, A.; Feng, W.; Asal, V. What is driving global obesity trends? Globalization or “modernization”? Glob. Health 2019, 15, 32. [Google Scholar] [CrossRef] [PubMed] [Green Version]
  61. Brummett, B.H.; Babyak, M.A.; Williams, R.B.; Barefoot, J.C.; Costa, P.T.; Siegler, I.C. NEO personality domains and gender predict levels and trends in body mass index over 14 years during midlife. J. Res. Personal. 2006, 40, 222–236. [Google Scholar] [CrossRef]
  62. Sutin, A.R.; Ferrucci, L.; Zonderman, A.B.; Terracciano, A. Personality and obesity across the adult life span. J. Pers. Soc. Psychol. 2011, 101, 579–592. [Google Scholar] [CrossRef] [Green Version]
  63. Magee, C.A.; Heaven, P.C.L. Big-Five personality factors, obesity and 2-year weight gain in Australian adults. J. Res. Personal. 2011, 45, 332–335. [Google Scholar] [CrossRef] [Green Version]
  64. Jokela, M.; Hintsanen, M.; Hakulinen, C.; Batty, G.D.; Nabi, H.; Singh-Manoux, A.; Kivimäki, M. Association of personality with the development and persistence of obesity: A meta-analysis based on individual-participant data. Obes. Rev. 2012, 14, 315–323. [Google Scholar] [CrossRef]
  65. Lahti, M.; Räikkönen, K.; Lemola, S.; Lahti, J.; Heinonen, K.; Kajantie, E.; Pesonen, A.-K.; Osmond, C.; Barker., D.J.P.; Eriksson, J.G. Trajectories of physical growth and personality dimensions of the Five-Factor Model. J. Pers. Soc. Psychol. 2013, 105, 154–169. [Google Scholar] [CrossRef]
  66. Shim, U.; Kim, H.N.; Roh, S.J.; Cho, N.H.; Shin, C.; Ryu, S.; Sung, Y.-A.; Kim, H.L. Personality traits and body mass index in a Korean population. PLoS ONE 2014, 9, e90516. [Google Scholar] [CrossRef] [Green Version]
  67. Hooker, K.; McAdams, D.P. Personality Reconsidered: A New Agenda for Aging Research. J. Gerontol. Psychol. Sci. 2003, 58, P296–P304. [Google Scholar] [CrossRef] [Green Version]
  68. Hampson, S.E.; Edmonds, G.W.; Barckley, M.; Goldberg, L.R.; Dubanoski, J.P.; Hillier, T.A. A Big Five Approach to Self-Regulation: Personality Traits and Health Trajectories in the Hawaii Longitudinal Study of Personality and Health. Psychol. Health Med. 2017, 21, 152–162. [Google Scholar] [CrossRef] [PubMed] [Green Version]
  69. Balanzá-Martínez, V.; Atienza-Carbonell, B.; Kapczinski, F.; De Boni, R.B. Lifestyle behaviours during the COVID-19—Time to connect. Acta Psychiatr. Scand. 2020, 141, 399–400. [Google Scholar] [CrossRef] [PubMed]
Figure 1. Flowchart of study sample collection.
Sustainability 12 07768 g001
Figure 2. Quantitative changes in body weight during the pandemic (mean ± SD). *** p ≤ 0.001, U-MannWhitney test.
Sustainability 12 07768 g002
Table 1. Factor-loading matrix for the dietary and lifestyle changes factors identified by principal component analysis (PCA).
VariablesDC
Dietary ChangesVegetables0.52
Fruits0.38
Whole grains products0.32
Milk and milk products−0.14
Pulses0.22
Fish and seafood0.18
Low-fat meat and/or eggs−0.04
Processed meats−0.43
Fast foods −0.47
Salty snacks−0.59
Confectionery−0.64
Sweetened spreads−0.35
Commercial pastry −0.55
Homemade pastry −0.34
Sweetened cereals and/or cereal bars−0.34
Sugar-sweetened beverages−0.47
Alcohol −0.32
Water 0.35
Explained variance (%)15.6
Cumulative explained variance (%)15.6
NLCPLC
Lifestyle ChangesSleep time0.420.80
Screen time0.800.05
Physical activity−0.590.63
Explained variance (%)38.934.6
Cumulative explained variance (%)38.973.5
DC—dietary changes; NLC—negative lifestyle changes; PLC—positive lifestyle changes.
Table 2. Characteristics of respondents by body weight changes during the pandemic.
VariablesTotal 100%
(n = 1769)
Changes in Body Weightp-Value 1
Loss 18.1%
(n = 320)
Stable 48.3%
(n = 854)
Gain 33.6%
(n = 595)
Age
<30 years29.1 (514)36.3 (116)28.7 (245)25.7 (153)0.017
30–39 years45.6 (806)43.4 (139)44.4 (379)48.4 (288)
40–49 years12.0 (212)11.3 (36)12.8 (109)11.3 (67)
50–59 years6.8 (121)5.3 (17)6.7 (57)7.9 (47)
≥60 years6.4 (113)3.4 (11)7.5 (64)6.4 (38)
Educational Level
lower21.4 (378)17.2 (55)22.7 (194)21.7 (129)0.117
higher (university)78.6 (1391)82.8 (265)77.3 (660)78.3 (466)
Family Composition
living alone9.3 (164)10.9 (35)8.4 (72)9.6 (57)0.652
living with partner21.6 (382)21.3 (68)21.3 (182)22.2 (132)
living with partner and/or children58.2 (1030)55.0(176)59.4 (507)58.3 (347)
living with parents or other relatives10.9 (193)12.8 (41)10.9 (93)9.9 (59)
Place of Living
rural15.8 (279)15.9 (51)16.4 (140)14.8 (88)0.004
town <50,000 inhabitants16.6 (294)15.0 (48)17.9 (153)15.6 (93)
town 50,000–100,000 inhabitants12.2 (215)9.4 (30)11.8 (101)14.1 (84)
town 101,000–500,000 inhabitants14.4 (254)10.9 (35)16.2 (138)13.6 (81)
town >500,000 inhabitants16.1 (285)15.6 (50)14.4 (123)18.8 (112)
urban agglomeration25.0 (442)33.1(106)23.3 (199)23.0 (137)
Macroeconomic Region
<50% of EU-28 GDP17.2 (305)13.8 (44)20.8 (178)13.9 (83)0.001
50–100% of EU-28 GDP60.8 (1076)59.4 (190)59.5 (508)63.5 (378)
>100% of EU-28 GDP21.9 (388)26.9 (86)19.7 (168)22.5 (134)
Employment Forms during the Pandemic
did not work or considerable work time reduction46.5 (823)42.2 (135)48.7 (416)45.7 (272)<0.001
began remote work and/or study40.4 (715)49.7 (159)36.2 (309)41.5 (247)
work in the same form as earlier13.1 (231)8.1 (26)15.1 (129)12.8 (76)
Difficulties with Food Ability during the Pandemic
no66.9 (1184)63.8 (204)69.2 (591)65.4 (389)0.128
yes33.1 (585)36.3 (116)30.8 (263)34.6 (206)
Changes in Total Food Intake during the Pandemic
ate less14.1 (250)42.8 (137)9.0 (77)6.1 (36)<0.001
no changes50.2 (888)43.1 (138)67.4 (576)29.2 (174)
ate more35.7 (631)14.1 (45)23.5 (201)64.7 (385)
Diet Quality Score
Mean ± SD1.9 ± 1.62.1 ± 1.51.9 ± 1.61.7 ± 1.70.049
Median2.02.0 a2.0 a2.0 b
Q1; Q31.0; 3.01.0; 3.01.0; 3.01.0; 3.0
BMI Category before the Pandemic
underweight6.0 (107)1.9 (6)9.3 (79)3.7 (22)<0.001
normal weight61.0 (1079)60.0 (192)62.8 (536)59.0 (351)
overweight24.0 (425)27.2 (87)21.8 (186)25.5 (152)
obesity8.9 (158)10.9 (35)6.2 (53)11.8 (70)
BMI Category during the Pandemic
underweight5.8 (103)5.0 (16)9.3 (79)1.3 (8)<0.001
normal weight61.0 (1079)68.4 (219)62.8 (536)54.5 (324)
overweight23.2 (411)18.1 (58)21.8 (186)28.1 (167)
obesity9.9 (176)8.4 (27)6.2 (53)16.1 (96)
1 significance level of Chi2 Pearson test for categorical variables or Kruskal–Wallis test for continuous variables; a, b, c—different letters mean statistical differences; SD—standard deviation; Q1—the lower quartile; Q3—the upper quartile; GDP—gross domestic product; BMI—body mass index.
Table 3. BMI category changes and weight changes during the pandemic.
VariablesBMI Category before the Pandemicp-Value 1
Underweight
6.0%
(n = 107)
Normal
61.0%
(n = 1079)
Overweight
24.0%
(n = 425)
Obesity
8.9%
(n = 158)
BMI during the Pandemic
underweight86.9 (93)0.9 (10)--<0.001
normal weight13.1 (14)95.3 (1028)8.7 (37)-
overweight-3.8 (41)85.2 (362)5.1 (8)
obesity--6.1 (26)94.9 (150)
Weight Changes
loss73.8 (79)49.7 (536)43.8 (186)33.5 (53)<0.001
stable5.6 (6)17.8 (192)20.5 (87)22.2 (35)
gain20.6 (22)32.5 (351)35.8 (152)44.3 (70)
1 significance level of Chi2 Pearson test; BMI—body mass index.
Table 4. Univariate and multivariate logistic regression models investigated an association between sociodemographic factors and body mass changes.
VariablesWeight LossWeight Gain
OR (95% CI)aOR (95% CI)OR (95% CI)aOR (95% CI)
Age (Decades)0.80 (0.71–0.91) ***0.78 (0.69–0.89) ***1.07 (0.98–1.17)1.03 (0.94–1.14)
Educational Level
lower0.72 (0.53–0.99) *0.82 (0.59–1.14)1.03 (0.81–1.31)1.03 (0.80–1.32)
higher (university)1111
Place of Living
rural1111
town <50,000.0.87 (0.57–1.35)0.93 (0.60–1.46)1.00 (0.71–1.43)1.01 (0.70–1.44)
town 50,000–100,0000.72 (0.44–1.18)0.73 (0.44–1.20)1.39 (0.96–2.02)1.32 (0.91–1.93)
town 101,000–500,000 town >500,0000.71 (0.45–1.14)0.68 (0.42–1.10)1.02 (0.71–1.46)1.01 (0.70–1.46)
urban agglomeration0.95 (0.62–1.46)0.79 (0.49–1.28)1.41 (0.99–1.99)1.24 (0.84–1.82)
rural1.41 (0.97–2.05)1.22 (0.78–1.92)0.97 (0.71–1.35)0.84 (0.57–1.23)
Macroeconomic Region
<50% of EU-28 GDP1111
50–100% of EU-28 GDP1.27 (0.89–1.82)1.22 (0.84–1.79)1.45 (1.09–1.92) ***1.55 (1.16–2.08) ***
>100% of EU-28 GDP1.69 (1.13–2.52) **1.22 (0.72–2.05)1.41 (1.02–1.96) *1.65 (1.08–2.53) *
Employment Forms during the Pandemic
did not work or considerable work time reduction1.55 (0.99–2.42)1.53 (0.97–2.41)1.01 (0.74–1.37)1.00 (0.73–1.38)
began remote work and/or study2.25 (1.45–3.52) ***2.01 (1.27–3.18) **1.08 (0.79–1.47)1.14 (0.82–1.57)
work in the same form as earlier1111
BMI before the Pandemic
underweight0.27 (0.12–0.63) **0.24 (0.10–0.56) ***0.54 (0.33–0.87) **0.54 (0.33–0.88) **
normal weight1111
overweight1.19 (0.90–1.58)1.39 (1.04–1.86) *1.15 (0.91–1.46)1.15 (0.90–1.46)
obesity1.31 (0.88–1.97)1.76 (1.15–2.69) **1.65 (1.18–2.32) **1.64 (1.15–2.32) **
OR—odds ratio; CI—confidence interval; aOR—adjusted odds ratio. BMI—body mass index; GDP—gross domestic product. * p ≤ 0.05; ** p ≤ 0.01; *** p ≤ 0.001.
Table 5. Regression analysis predicting body mass changes during pandemic among women.
FactorsUnivariateModel 1Model 2
β (95% CI)R2β (95% CI)β (95% CI)
Dietary Changes−0.316 0.10 ***−0.275−0.167
(−0.361–−0.272) ***(−0.321–−0.230) ***(−0.212–−0.121) ***
Negative Lifestyle Changes0.1820.03 ***0.1350.113
(0.136–0.227) ***(0.090–0.179) ***(0.070–0.156) ***
Positive Lifestyle Changes−0.1260.02 ***−0.071 −0.039
(−0.172–−0.080) ***(−0.116–−0.026) **(−0.082–0.004)
Diet Quality Score−0.093 0.01 ***−0.031 −0.025
(−0.140–−0.047) ***(−0.075–0.014)(−0.067–0.017)
R2--0.12 ***0.23 ***
Model 1—multivariate analysis included three dietary and lifestyle changes factors and diet quality score; Model 2—model 1 adjusted for age, BMI before the pandemic, changes in total food intake during the pandemic, and macroeconomic region; * p ≤ 0.05; ** p ≤ 0.01; *** p ≤ 0.001.

