
Impact of air transportation on the spread of Covid-19 between countries based on system dynamics
Abstract
For the spread COVID-19 between countries through air transportation, the influencing factors are analyzed, a system dynamics model which passes the validity test is established. Then, three key indicators, Basic Reproduction Rate, Initial Infection Individuals and Transfer Rate, are selected as independent variables to analyze the system changes through computer simulation. Based on the analysis, the infectivity of COVID-19 and the number of people transferred by air transportation are important factors affecting the import of epidemics for non-epidemic countries, and the sooner or later control of infectious diseases by epidemic countries has little effect on non-epidemic countries.
1Introduction
The COVID-19 epidemic has had a substantial impact on the whole social economy and people’s lives [1]. The spread of the virus mainly includes direct transmission and indirect transmission. Among them, direct transmission is mainly through nasal and oral secretions, including coughing, sneezing, and speaking droplets [2–4]. Indirect transmission channels mainly refer to people touching contaminated objects with their hands and then infection [2, 3], and includes aerosols formed by the suspension of closed spaces caused by small droplets [5]. Covid-19 is highly infectious because asymptomatic and pre-symptomatic individuals can transmit the virus [2–4]. According to relevant studies, asymptomatic infection accounted for 45% –50% [6]. Due to the COVID-19 pandemic, avoiding unnecessary travel was restricted or recommended in most countries or regions [7]. Some places quarantine people who have recently traveled to the epidemic area and restrict people from going to the epidemic area [8]. Other countries restrict all foreign travel and prohibit their citizens from international travel [9]. Air transport plays a critical role in today’s global economic society and has a significant impact on social development. Compared with other ways, air transportation is an efficient and high-speed way to travel for people and goods in a long journey, especially in international transportation [10].
Take the China-U.S. route as an example. During the COVID-19 pandemic, U.S. carriers suspended flights between China and US because of reduced demand and government restrictions on international travel in early 2020 [11], at the same China’s air carriers still maintained limited air transport links between the two countries [12]. At the end of March 2020, China-US flights were reduced to only 4 from 325 per week.With the prevalence of epidemics in the United States and government travel restrictions between China and the United States, the demand for travel from the United States to China has relatively increased. The relative shortage of flights has caused a shortage of air tickets, soaring air tickets, and a large number of people stranded [13, 14].
All these phenomena cause us to think about whether the reduction of international air transportation services played a key role in controlling the COVID-19 spread. A study in Science found that simple restriction management measure for travelling on reducing transmission is limited, and only delays the outbreak to a certain extent. Only with the combination of prevention and control measures, can effectively reduce the spread [15]. Harvard University’s research shows that travel restrictions are most useful in the early and late phase of an epidemic [16]. Sun and Wandelt summarized the literature on the combination of COVID-19 and air transport [17]. The existing relevant literature mainly relates to: (1) the mutual influence of COVID-19 and the air transportation network system; (2) the impact of COVID-19 on passenger flight experience; (3) the long-term impact of COVID-19 on aviation. In particular, some scholars have studied the impact of air transportation networks on the spread of COVID-19 [18–24]. However, there is very little research on the key factors of transmission between countries through air transport and how to interact.
Based on the above, the paper starts by analyzing the factors that affect the spread of COVID-19 between countries, establishing a system dynamics model, and finding the key factors in order to provide intellectual support for decision-making. The paper is organized as follow. Section 2 the system composition on spreading COVID-19 spread through air transportation and the necessary assumptions. Afterwards, section 3 establishes a system dynamics model on the spread of COVID-19, composed of two countries through air transportation, calibrates parameters, and tests the validity of the model. Then, Section 4 selects three key indicators as independent variables to analyze the system changes caused by this.Finally, the conclusion are presented in Section 5.
2Problem description and hypothesis
The classic SEIR model, which can used to analyze the COVID-19 epidemic, consists of four parts: S(susceptible), E(exposed),I(infectious) and R (recovered) [17, 18].With reference to the above literature, we divide the experience of people infected during the COVID-19 pandemic from the beginning of infection into four stages: Susceptible Individuals, unconfirmed individuals, confirmed individuals and death or recovery.
Susceptible individuals refer to individuals who have not been infected with the coronavirus, that is, have no antibodies. Unconfirmed individuals refer to individuals who have been infected but have not yet been confirmed, including asymptomatic infections and pre-symptomatic infections. Among unconfirmed individuals, asymptomatic individuals will recover because they are mildly ill, while pre-symptomatic infections will undergo a confirmed process. Assuming that all pre-symptomatic infections will develop into symptomatic infections, and all of them can be diagnosed, thus becoming confirmed individuals. After being confirmed, a small proportion will progress to death over a period of time, and most will recover. Recovery individuals mean that the virus disappears in their bodies and are no longer infectious.
In order to further analyze the problem, the following assumptions are formed.
1. Once all infected persons are diagnosed, they will strictly abide by the quarantine policy, whether at home or in centralized quarantine, and will not infect other sensitive individuals again, nor will they transfer between different countries and regions.
2. For the transportation links between countries, only air transport is considered. Assume that the total amount of air passenger traffic between the two countries in a single day is the same as before during the Covid-19 epidemic. Those who transfer between countries include: susceptible individuals, unconfirmed individuals, recovery individual. The proportion of these three groups of people transferred to other countries by air transport is same.
3. Once all susceptible individuals are infected into unconfirmed individuals, both asymptomatic and pre-symptomatic infections are contagious and will affect the unprotected individuals.
4. Since all asymptomatic individuals do not show obvious symptoms, it is assumed that they cannot be diagnosed or confirmed.
5. The probability of COVID-19 infection by airplane is rarely mentioned in the existing literature. Only one case mentioned in the literature is most likely to be infected by air transport [19]. Therefore, it is assumed that air transportation is not a channel for infection with COVID-19, provided that protective measures are taken. That is, the aircraft is only used as a tool to transfer passengers.
6. Immigration control and inspection for COVID-19 virus are not considered.
7. During the entire analysis and research cycle, the birth and death factors of the population are not considered.
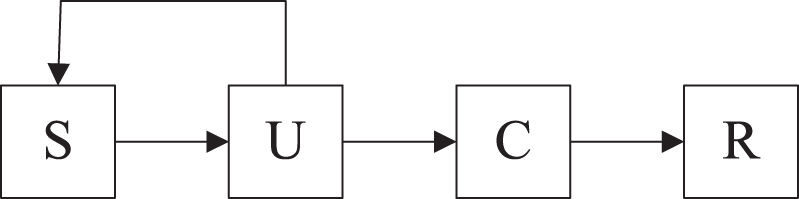
Based on the above descriptions and assumptions, the transformation relationship of COVID-19 in a certain country is shown in Fig. 1, where S is short for susceptible individuals, U for unconfirmed individuals, C for confirmed individuals, and R for recovery individuals.
Fig. 1
Transformation relationship of COVID-19.
Let S (i), U (i), C (i), R (i) be the numbers of susceptible individuals, unconfirmed individuals, confirmed individuals, and recovery individuals in country i, respectively. Based on the above analysis, the problem is limited to the spread of COVID-19 in two countries under the air transportation connection, and then a dynamic equation for the country I is constructed as shown below.
Among them, P(I) represents the total population of country I, and r (I), β (I), γ (I), δ (I) and r (I) represent respectively the basic infection rate, confirmed rate, the ratio from confirmed to recovery and the ratio from asymptomatic to recovery.
In Formula (2.1),
Similarly, the dynamic equation for the spread of COVID-19 in Country II is also constructed as follow.
In Formula (2.2), P(II), r (II), β (II), γ (II), and δ (II) represent the corresponding indicators of country II, and all formula expressions have meanings similar to those of formula (2.1).
Meanwhile, α (I) and η (I) respectively represent the ratio of the population transferred from country I to II by air transport and the probability of infection on the aircraft during the transfer from country I to II, while α (II) and η (II) represent the corresponding index transferred from country II to I.
3System dynamics model on Covid-19 transmission among countries
3.1System dynamics model
According to the above analysis, the system dynamics model of covid-19 spreading in two countries through air transportation is constructed, as shown in Fig. 2 below. The system dynamics model reflects the transfer relationship between domestic susceptible individuals, unconfirmed individuals, confirmed individuals, and recovery individuals in the two countries, country I and country II, as well as the transfer relationship between these populations in the two countries.
Fig. 2
The system dynamics model of COVID-19 spreading in two countries through air transportation
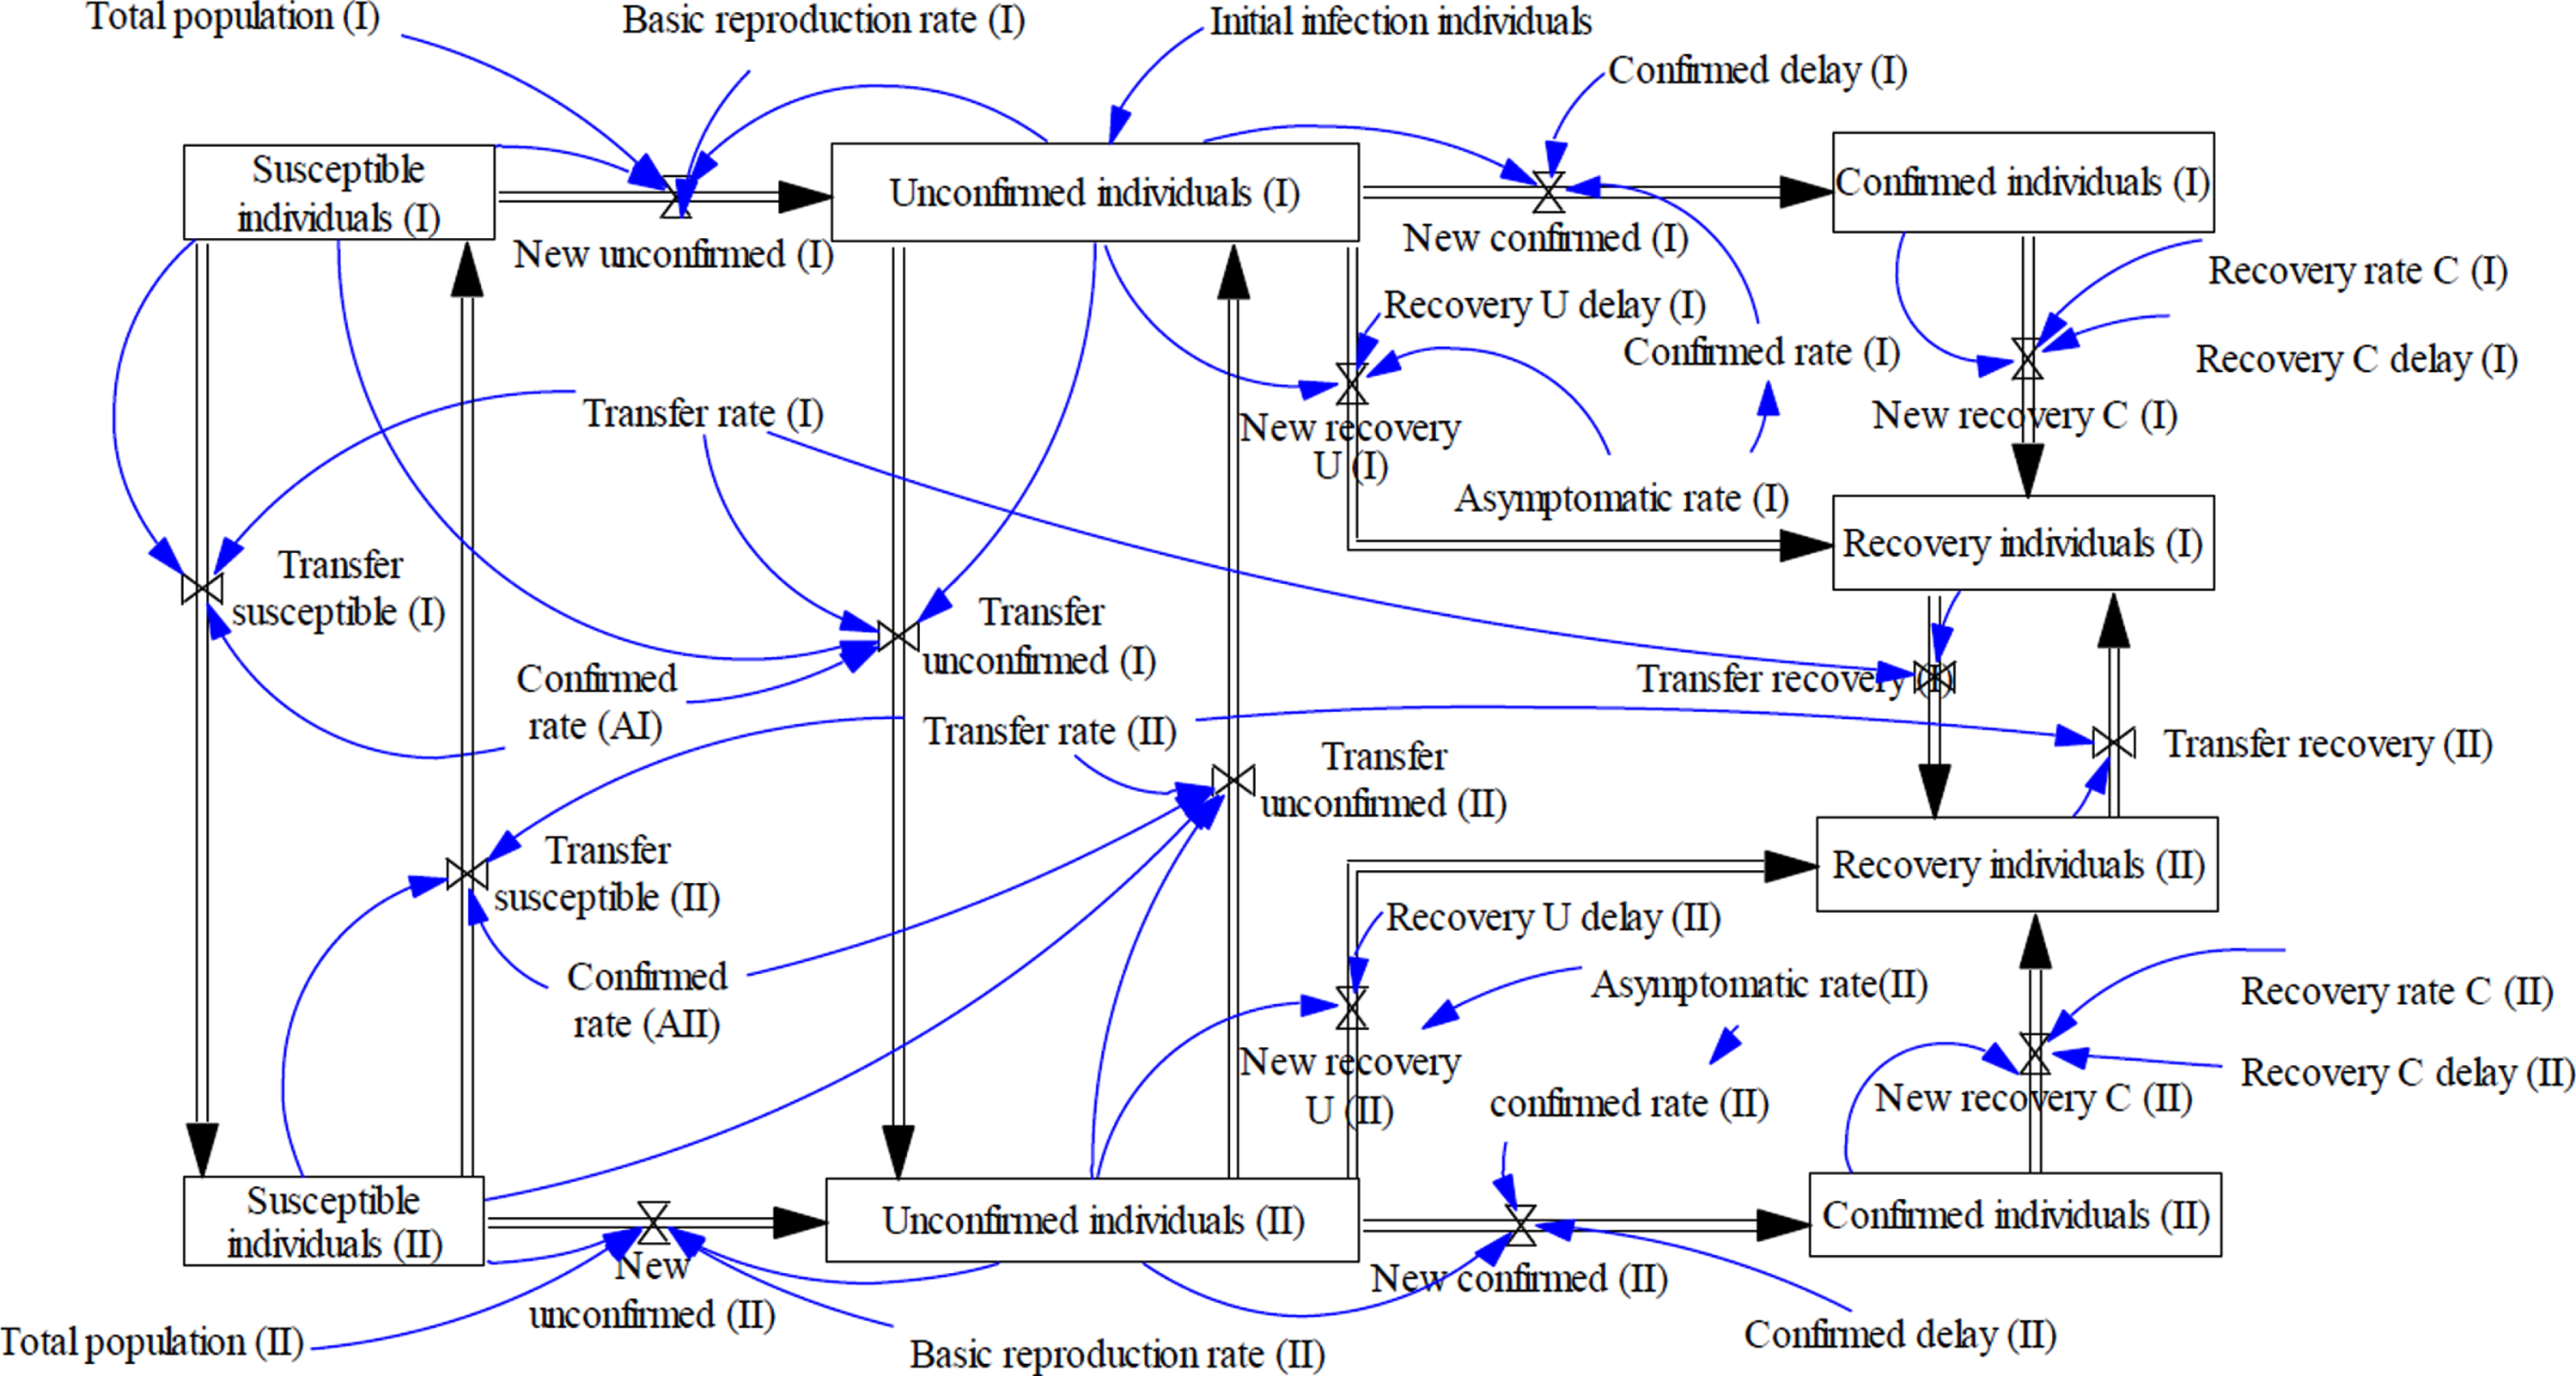
Among the model, there are 8 state variables, 4 for country I and 4 for country II, which are Susceptible individuals(I), Unconfirmed individuals(I), Confirmed individuals(I), Recovery individuals(I) and Susceptible individuals(II), Unconfirmed individuals(II), Confirmed individuals(II), Recovery individuals(II) respectively. There are also 14 rate variables, 4 for country I, 4 for country II, and 6 for transferring, and their meanings are shown in Table 1 below.
Table 1
The meanings of rate viriables of dynamics model
| Rate variables | Meanings |
| New unconfirmed(I) | New unconfirmed individuals from susceptible individuals in country I |
| New confirmed(I) | New confirmed individuals from unconfirmed individuals in country I |
| New recovery U(I) | New recovery individuals from unconfirmed individuals in country I |
| New recovery C(I) | New recovery individuals from confirmed individuals in country I |
| New unconfirmed(II) | New unconfirmed individuals from susceptible individuals in country II |
| New confirmed(II) | New confirmed individuals from unconfirmed individuals in country II |
| New recovery U(II) | New recovery individuals from unconfirmed individuals in country II |
| New recovery C(II) | New recovery individuals from confirmed individuals in country II |
| Transfer susceptible(I) | Transfer susceptible individuals through air transportation from country I |
| Transfer unconfirmed(I) | Transfer unconfirmed individuals through air transportation from country I |
| Transfer recovery(I) | Transfer recovery individuals through air transportation from country I |
| Transfer susceptible(II) | Transfer susceptible individuals through air transportation from country II |
| Transfer unconfirmed(II) | Transfer unconfirmed individuals through air transportation from country II |
| Transfer recovery(II) | Transfer recovery individuals through air transportation from country II |
3.2Mathematical model of main variables
Take China and the United States as an example to set the main parameters of the model, where country I represents United States and country II represents China. Considering that the epidemic in China has been basically under control since mid-March in 2020, the main epidemic prevention work has been converted to preventing overseas imports. At this time, the US epidemic began to initially break out to the pandemic stage. Therefore, the model mainly reflects the situation where the United States is the exporter of the COVID-19 and China is the importer.
The constant parameters are shown in Table 2 below.
Table 2
Constant parameters and expressions
| No. | Variable name | Unit | Value | Data source |
| 1 | Total population (I) | Dmnl | 330million | United Census Bureau. “U.S. and World Population Clock”. |
| 2 | Total population (II) | Dmnl | 1400million | China National Bureau of Statistics. “Statistical bulletin of national economic and social development of the people’s Republic of China in 2019” |
| 3 | Basic reproduction rate (I) | Dmnl/day | 0.25 | Sanche S, Lin YT, et al. (2020) [20] |
| 4 | Basic reproduction rate (II) | Dmnl/day | ||
| 5 | Transfer rate (I) | Dmnl/day | 0.00000403 | According to the China Civil Aviation Resource Website (http://www.carnoc.com/), the passenger traffic of China and the United States in 2018 and 2019 was 8.3 million and 8.1 million, respectively, with an average of 8.2 million. That is, an average of 700,000 per month and an average of 26,700 per day. Assuming that the two passenger flows from US to China and the China to US have the same ratio, that is, 13,300 one-way. So yes, the transfer rate from the United States to China (I) = 13.33 million / 330 million = 0.00000403, and the transfer rate from China to the United States (II) = 13.33 million / 1.4 billion = 0.0000095 |
| 6 | Transfer rate (II) | Dmnl/day | 0.0000095 | |
| 7 | Confirmed rate (AI) | Dmnl | 0 | Refer to the second part, Problem Description and Hypothesis, hypothesis 5. |
| 8 | Confirmed rate (AII) | |||
| 9 | Asymptomatic rate (I) | Dmnl/day | 0.4 | CDC. “COVID-19 Pandemic Planning Scenarios” shows the asymptomatic rate is 0.4,which is selected for the model [21]. |
| 10 | Asymptomatic rate (II) | |||
| 11 | Recovery rate C (I) | Dmnl/day | 0.97 | COVID-19 Dashboard [22] |
| 12 | Recovery rate C (I) | 0.95 | ||
| 13 | Confirmed delay (I) | day | 9 | According to CDC “COVID-19 Pandemic Planning Scenarios”, the median number of days from exposure to symptom onset and from symptom onset to test positive are 6 and 3, respectively. |
| 14 | Confirmed delay (II) | day | ||
| 15 | Recovery U delay (I) | day | 14 | So far, there is no data on the days when the virus disappears in asymptomatic infected persons. We assume that the quarantine period is 14 days as the virus disappearance period. |
| 16 | Recovery U delay (II) | day | 14 | |
| 17 | Recovery C delay (I) | day | 10 | According to CDC. “Overview of Testing for SARS-CoV-2 (COVID-19)”. |
| 18 | Recovery C delay (II) | day | 10 |
Other parameters are shown in Table 3 below.
Table 3
The main variables and expressions
| No. | Variable name | Unit | Calculation formula |
| 1 | New unconfirmed (I) | Dmnl/day | MAX(“Unconfirmed individuals (I) “*”Basic reproduction rate (I) “*”Susceptible individuals (I) “/”Total population (I)”,0) |
| 2 | New unconfirmed (II) | Dmnl/day | “Unconfirmed individuals (II) “*”Basic reproduction rate (II) “* “Susceptible individuals (II) “/”Total population (II)” |
| 3 | New confirmed (I) | Dmnl/day | MAX(DELAY1I(“Unconfirmed individuals (I) “*”Confirmed rate (I)”, “Confirmed delay (I)”,0), 0) |
| 4 | New confirmed (II) | Dmnl/day | DELAY1(“confirmed rate (II) “*”Unconfirmed individuals (II)”, “Confirmed delay (II)”) |
| 5 | Transfer susceptible (I) | Dmnl/day | Susceptible individuals (I) “*”Transfer rate (I)”*(1-”Confirmed rate (AI)”) |
| 6 | Transfer susceptible (II) | Dmnl/day | Susceptible individuals (II) “*”Transfer rate (II)”*(1-”Confirmed rate (AII)”) |
| 7 | Transfer unconfirmed (I) | Dmnl/day | Unconfirmed individuals (I) “*”Transfer rate (I)”-”Susceptible individuals (I)”*”Transfer rate (I)”*”Confirmed rate (AI)” |
| 8 | Transfer unconfirmed (II) | Dmnl/day | Unconfirmed individuals (II) “*”Transfer rate (II)”-”Susceptible individuals (II) “*”Transfer rate (II) “*”Confirmed rate (AII)” |
| 9 | Confirmed rate (I) | Dmnl/day | “1-”Asymptomatic rate (I)” |
| 10 | Confirmed rate (II) | Dmnl/day | “1-”Asymptomatic rate (II)” |
| 11 | New recovery C (I) | Dmnl/day | DELAY1I (“Confirmed individuals (I) “*”Recovery rate C (I)”,”Recovery C delay (I)”,0) |
| 12 | New recovery C (II) | Dmnl/day | DELAY1I (“Confirmed individuals (II) “*”Recovery rate C (II)”,”Recovery C delay (II)”,0) |
| 13 | New recovery U (I) | Dmnl/day | DELAY1 (“Unconfirmed individuals (I) “*”Asymptomatic rate (I)”, “Recovery U delay (I)”) |
| 14 | New recovery U (II) | Dmnl/day | DELAY1 (“Unconfirmed individuals (II) “*”Asymptomatic rate (II)”, “Recovery U delay (II)”) |
| 15 | Transfer recovery (I) | Dmnl/day | “Recovery individuals (I) “*”Transfer rate (I)” |
| 16 | Transfer recovery (II) | Dmnl/day | “Recovery individuals (II) “*”Transfer rate (II)” |
| 17 | Susceptible individuals (I) | Dmnl | INTEG (+“Transfer susceptible (II)”-”New unconfirmed (I)”-”Transfer susceptible (I)”,”Total population (I)”) |
| 18 | Susceptible individuals (II) | Dmnl | INTEG (-“New unconfirmed (II)”-“Transfer susceptible (II)”+“Transfer susceptible (I)”,”Total population (II)”) |
| 19 | Unconfirmed individuals (I) | Dmnl | INTEG (+“New unconfirmed (I)”+“Transfer unconfirmed (II)”-“New confirmed (I)”-“New recovery U (I)”-“Transfer unconfirmed (I)”,10000) |
| 20 | Unconfirmed individuals (II) | Dmnl | INTEG (+“New unconfirmed (II)”+“Transfer unconfirmed I)”-“New confirmed (II)”-“New recovery U (II)”-“Transfer unconfirmed (II)”,10000) |
| 21 | Confirmed individuals (I) | Dmnl | INTEG (+“New confirmed (I)”-“New recovery C (I)”,0) |
| 22 | Confirmed individuals (II) | Dmnl | INTEG (+“New confirmed (II)”-“New recovery C (II)”,0) |
| 23 | Recovery individuals (I) | Dmnl | INTEG (+“New recovery C (I)”+“New recovery U (I)”+“Transfer recovery (II)”-“Transfer recovery (I)”,0) |
| 24 | Recovery individuals (I) | Dmnl | INTEG (+“New recovery C (II)”+“New recovery U (II)”+“Transfer recovery (I)”-“Transfer recovery (II)”,0) |
3.3Model testing
System dynamics model testing includes dimensional consistency testing, mechanical error testing, model validity testing, and equation extreme condition testing [23]. The established system dynamics model has passed the dimensional consistency test and mechanical error test of through Vensim software.
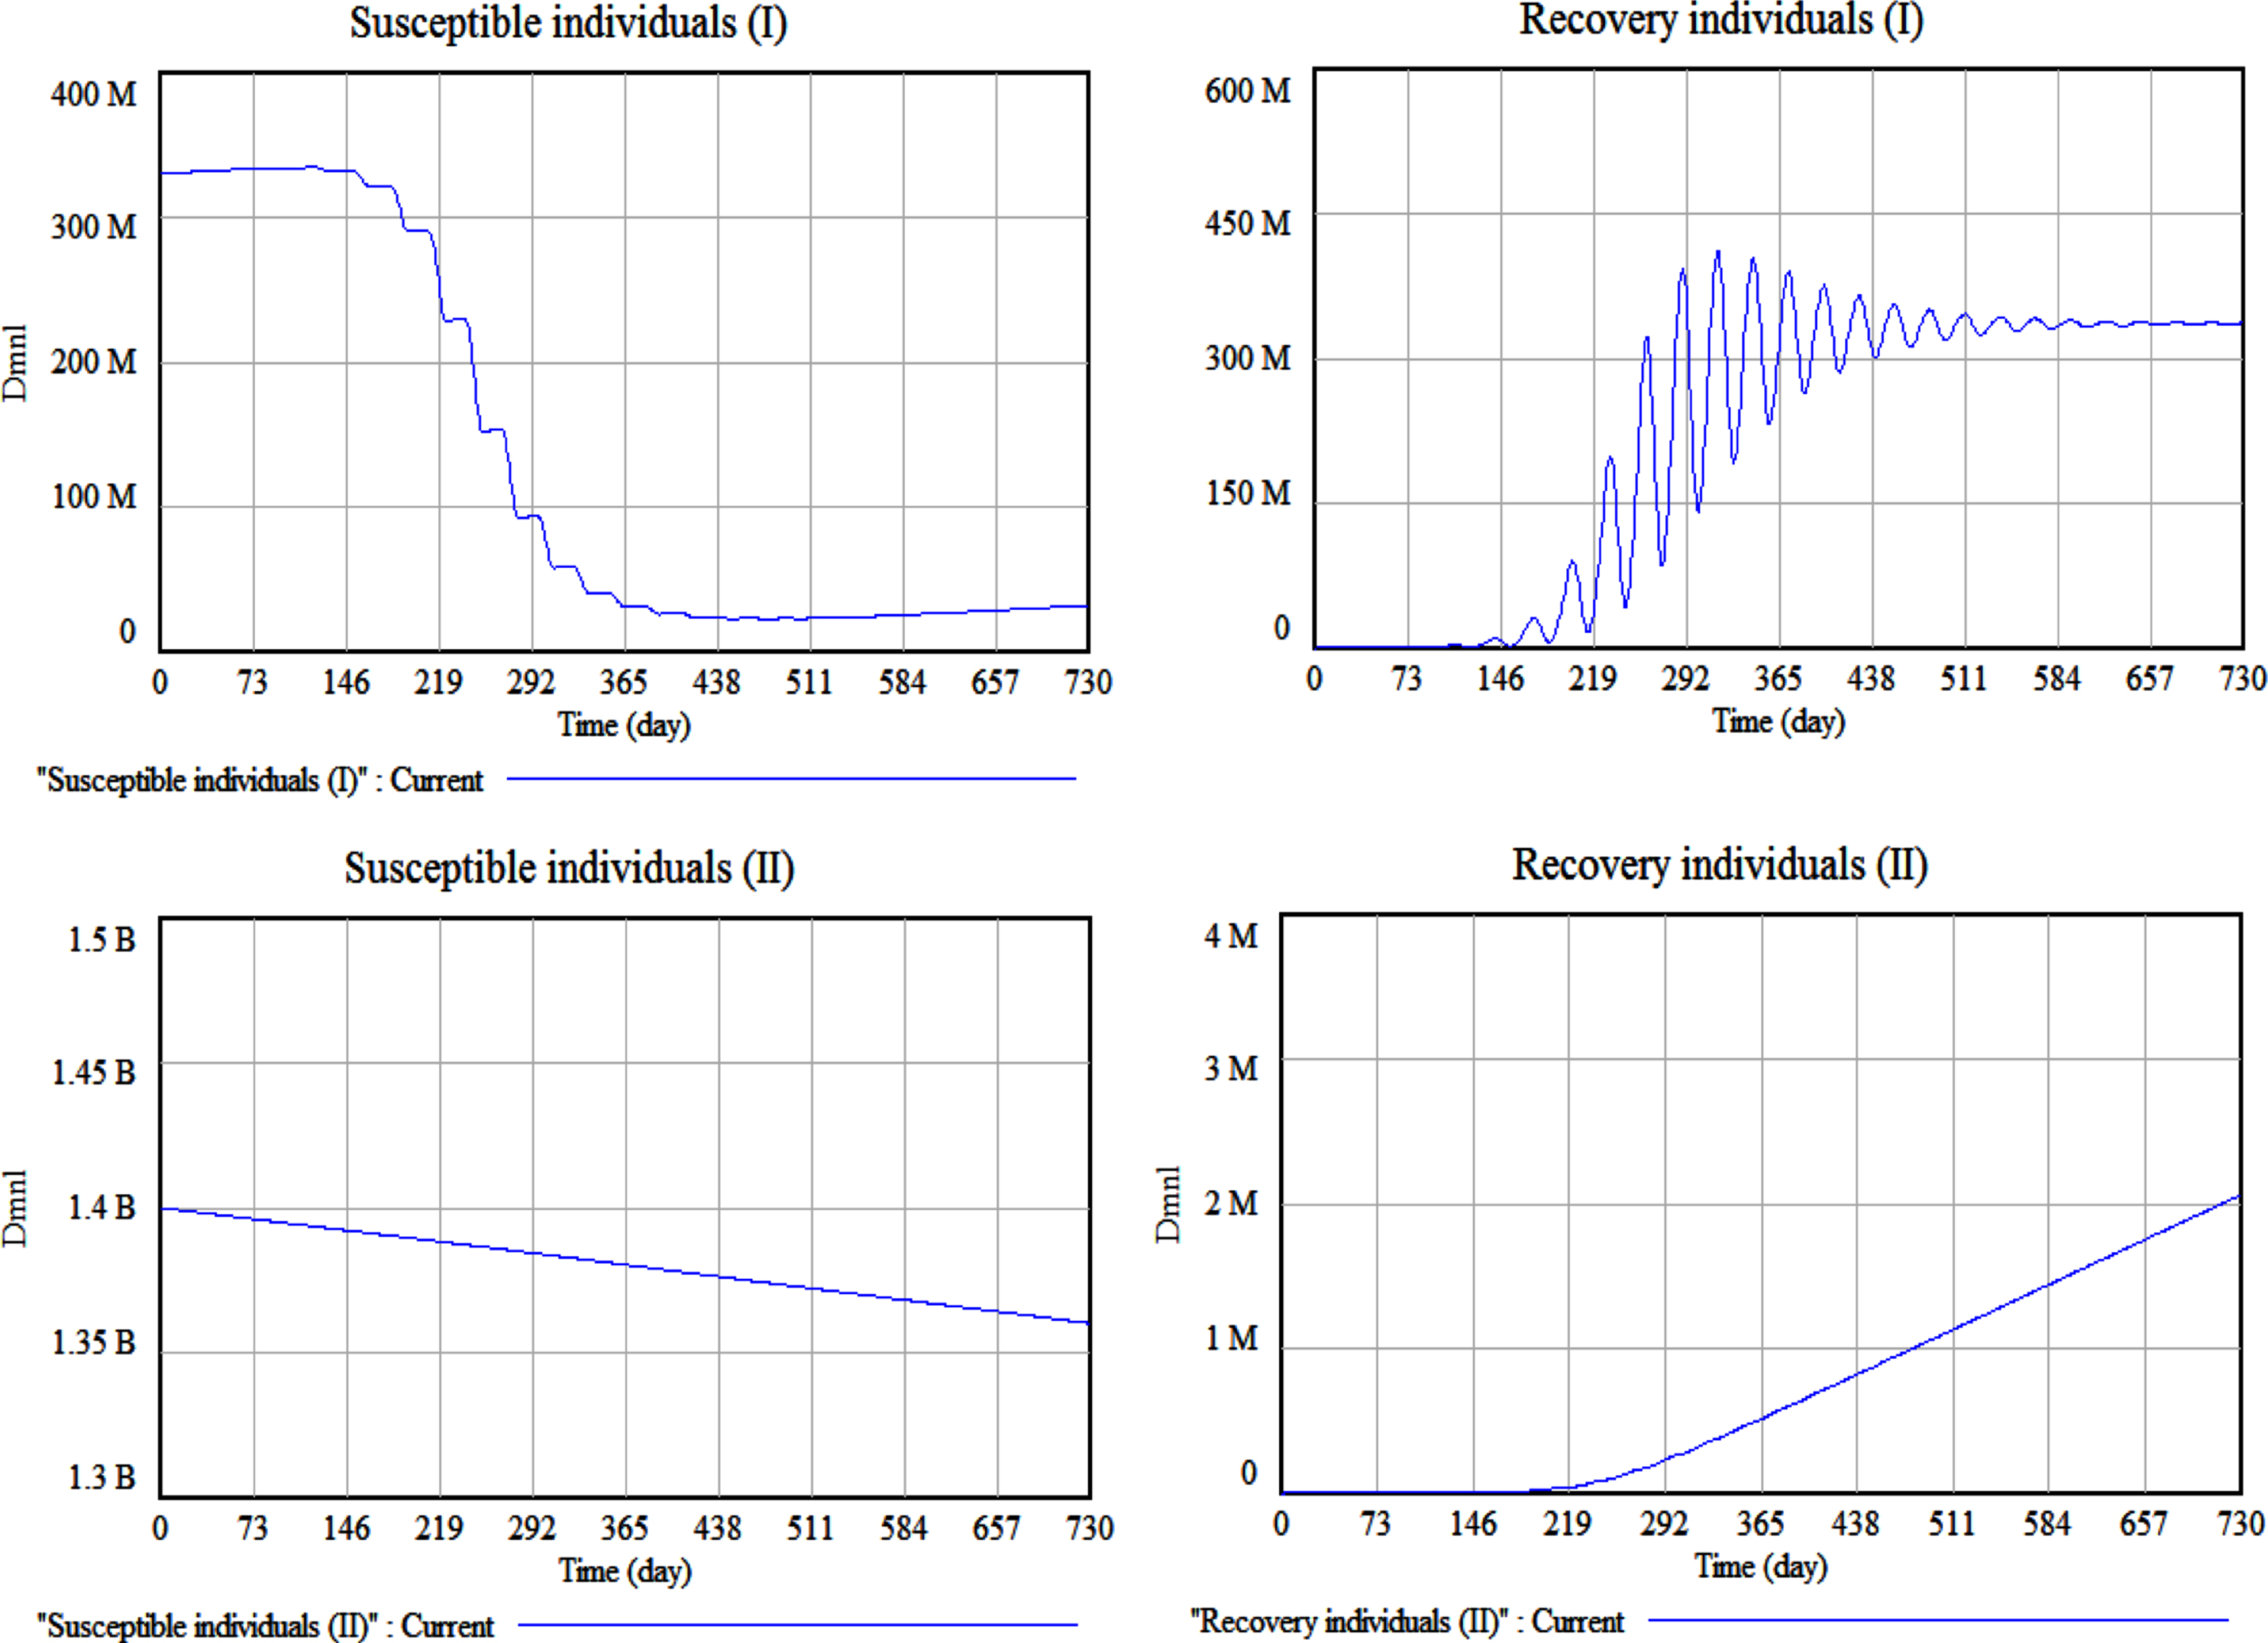
For the model validity testing, all parameters are set according to the above. The validity testing results are shown in Fig. 3. It is concluded that with the change of the susceptible individuals population in Country I,epidemic center (the United States), the susceptible population has a downward trend, and the recovery population is an increasing trend. For the Country II, China, as the importing country of COVID-19, the susceptible population is reduced and the recovered population is increased, while the number of these two indicators is much smaller than the Country I, US. These trends are consistent with reality and prove that the model has passed the validity testing.
Fig. 3
Validity testing
For the extreme condition testing, set the initial unconfirmed individuals (I) and unconfirmed individuals (II) to 0, transfer rate (I) and transfer rate (II) to 0, and use Vensim to simulate. The results of susceptible individuals (I) and susceptible individuals (II) are constants, and the values equal to the total population of the country (or region), while confirmed individuals(I), confirmed individuals(II), recovery individuals(I) and recovery individuals(II) have a fixed value of 0. This is consistent with the actual understanding. In the absence of initial infections and imported infections, the confirmed cases and recovered cases are 0. According to this, the model passes the extreme condition test.
4Computer simulation and impact analysis
To better analyze the spread and impact of COVID-19 through air transportation, especially between United States and China, three key indicators, Basic reproduction rate, Initial infection individuals and Transfer rate, are selected as independent variables to analyze the system changes caused by this. The main observation-dependent variables selected are Susceptible individuals(I), Recovery individuals(I), Susceptible individuals(II), Unconfirmed individuals(I), Confirmed individuals(II), and Recovery individuals (II).
4.1Basic reproduction rate
Sanche (2020) analyses suggest the exponential growth rate for COVID-19 in the outbreak is probably 0.21–0.3/day [25], which is basically consistent with the data given by the CDC. 0.25/day, an average value was selected for basic analysis.
In order to further analyze the impact of the Basic reproduction rate on the system, suppose the changes in Basic reproduction rate are respectively 0.05 0.15 0.25 0.35 0.45 and 0.55. The main observation variables are shown in Fig. 4.
Through analysis, from the changes in the main parameters in Fig. 4, the following conclusions can be drawn. In the case of Basic reproduction rate = 0.05, that is, when the value of Basic reproduction rate is small, the virus can stop spreading without intervention. For other values of Basic reproduction rate, COVID-19 will spread over a period of time to achieve the effect of herd immunity [26]. As the value of Basic reproduction rate increases, the spread will be faster, and the effect of herd immunity will also be faster, but it may have a large impact on the medical system and cause substantial casualties.
Fig. 4
The impact of changes in the Basic Reproduction Rate on the main parameters
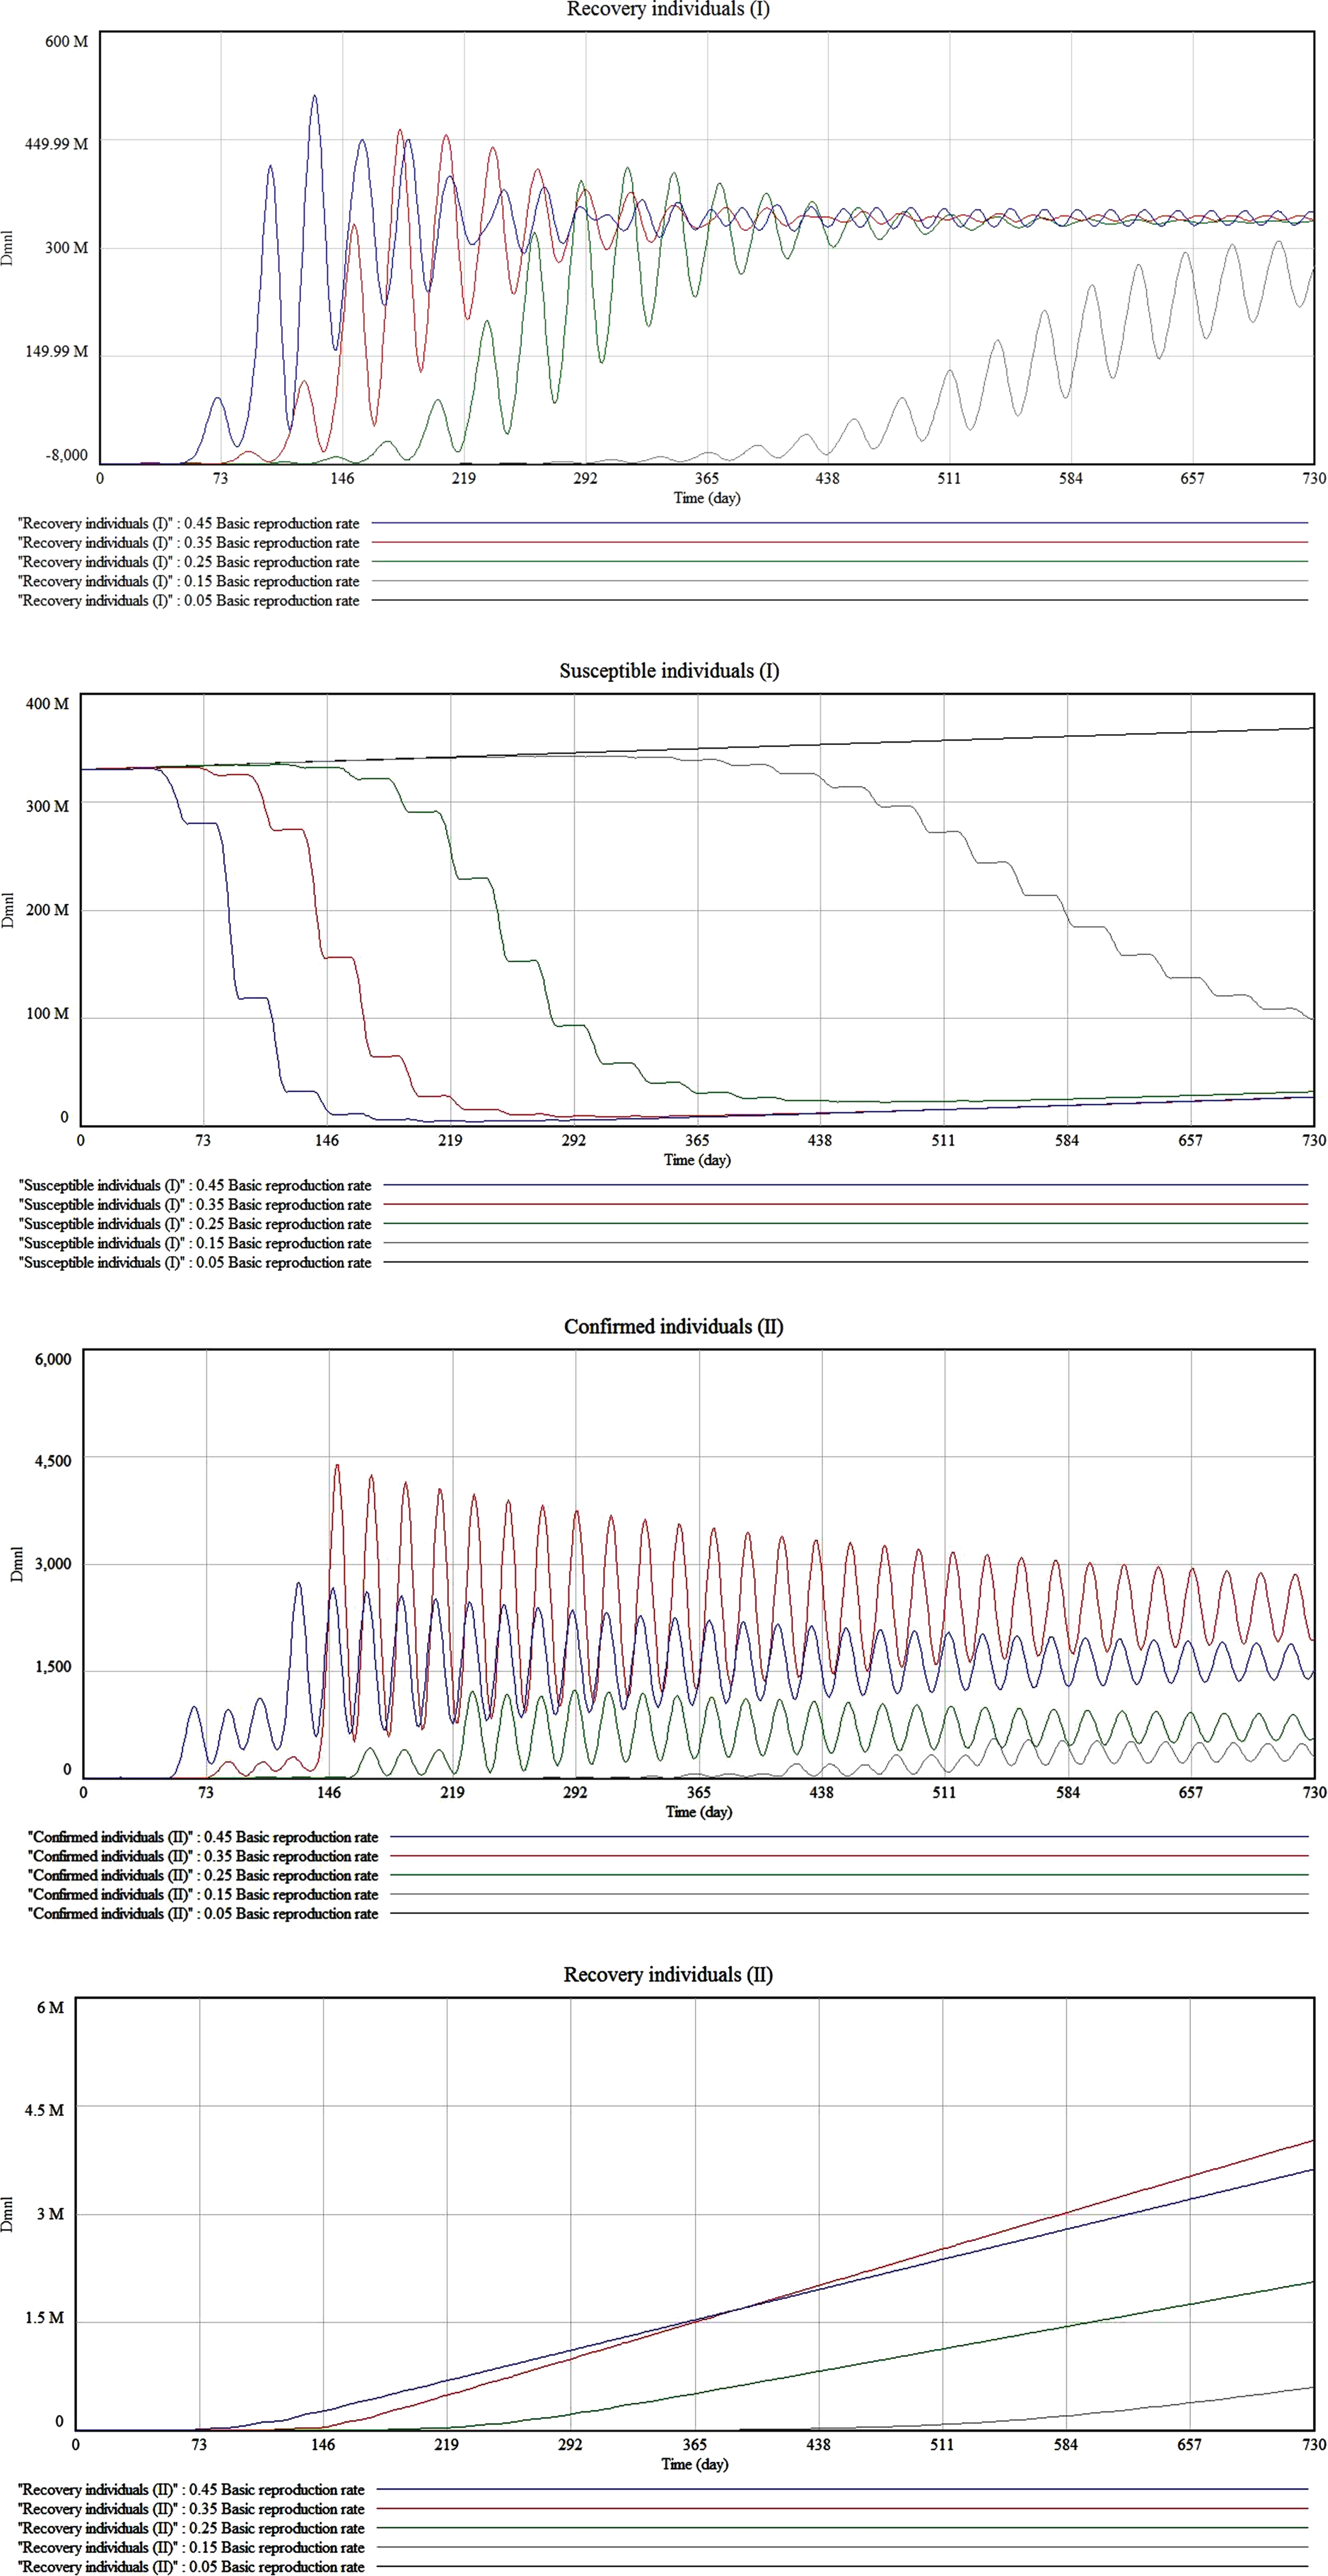
For the spread of the COVID-19 from one country to others through air transportation, the larger value of Basic reproduction rate, the easier to spread the virus to other countries [27]. Basic reproduction rate is an important factor for the international spread of covid-19 by air transportation to nonepidemic countries.
4.2Initial infection individuals
Since COVID-19 has an incubation period, there may be misjudgments in the initial stage, so it is very difficult to determine the initial infection data.The original analysis selected unconfirmed individuals = 10000 [28]. In order to analyze the impact of the initial number of infected individuals on the system, assume that the changes in initial unconfirmed individuals are 100, 1,000, 10,000, 50,000, and 100,000.The main observation variables are shown in Fig. 5.
Fig. 5
The impact of changes in Initial Infection Individuals on the main parameters
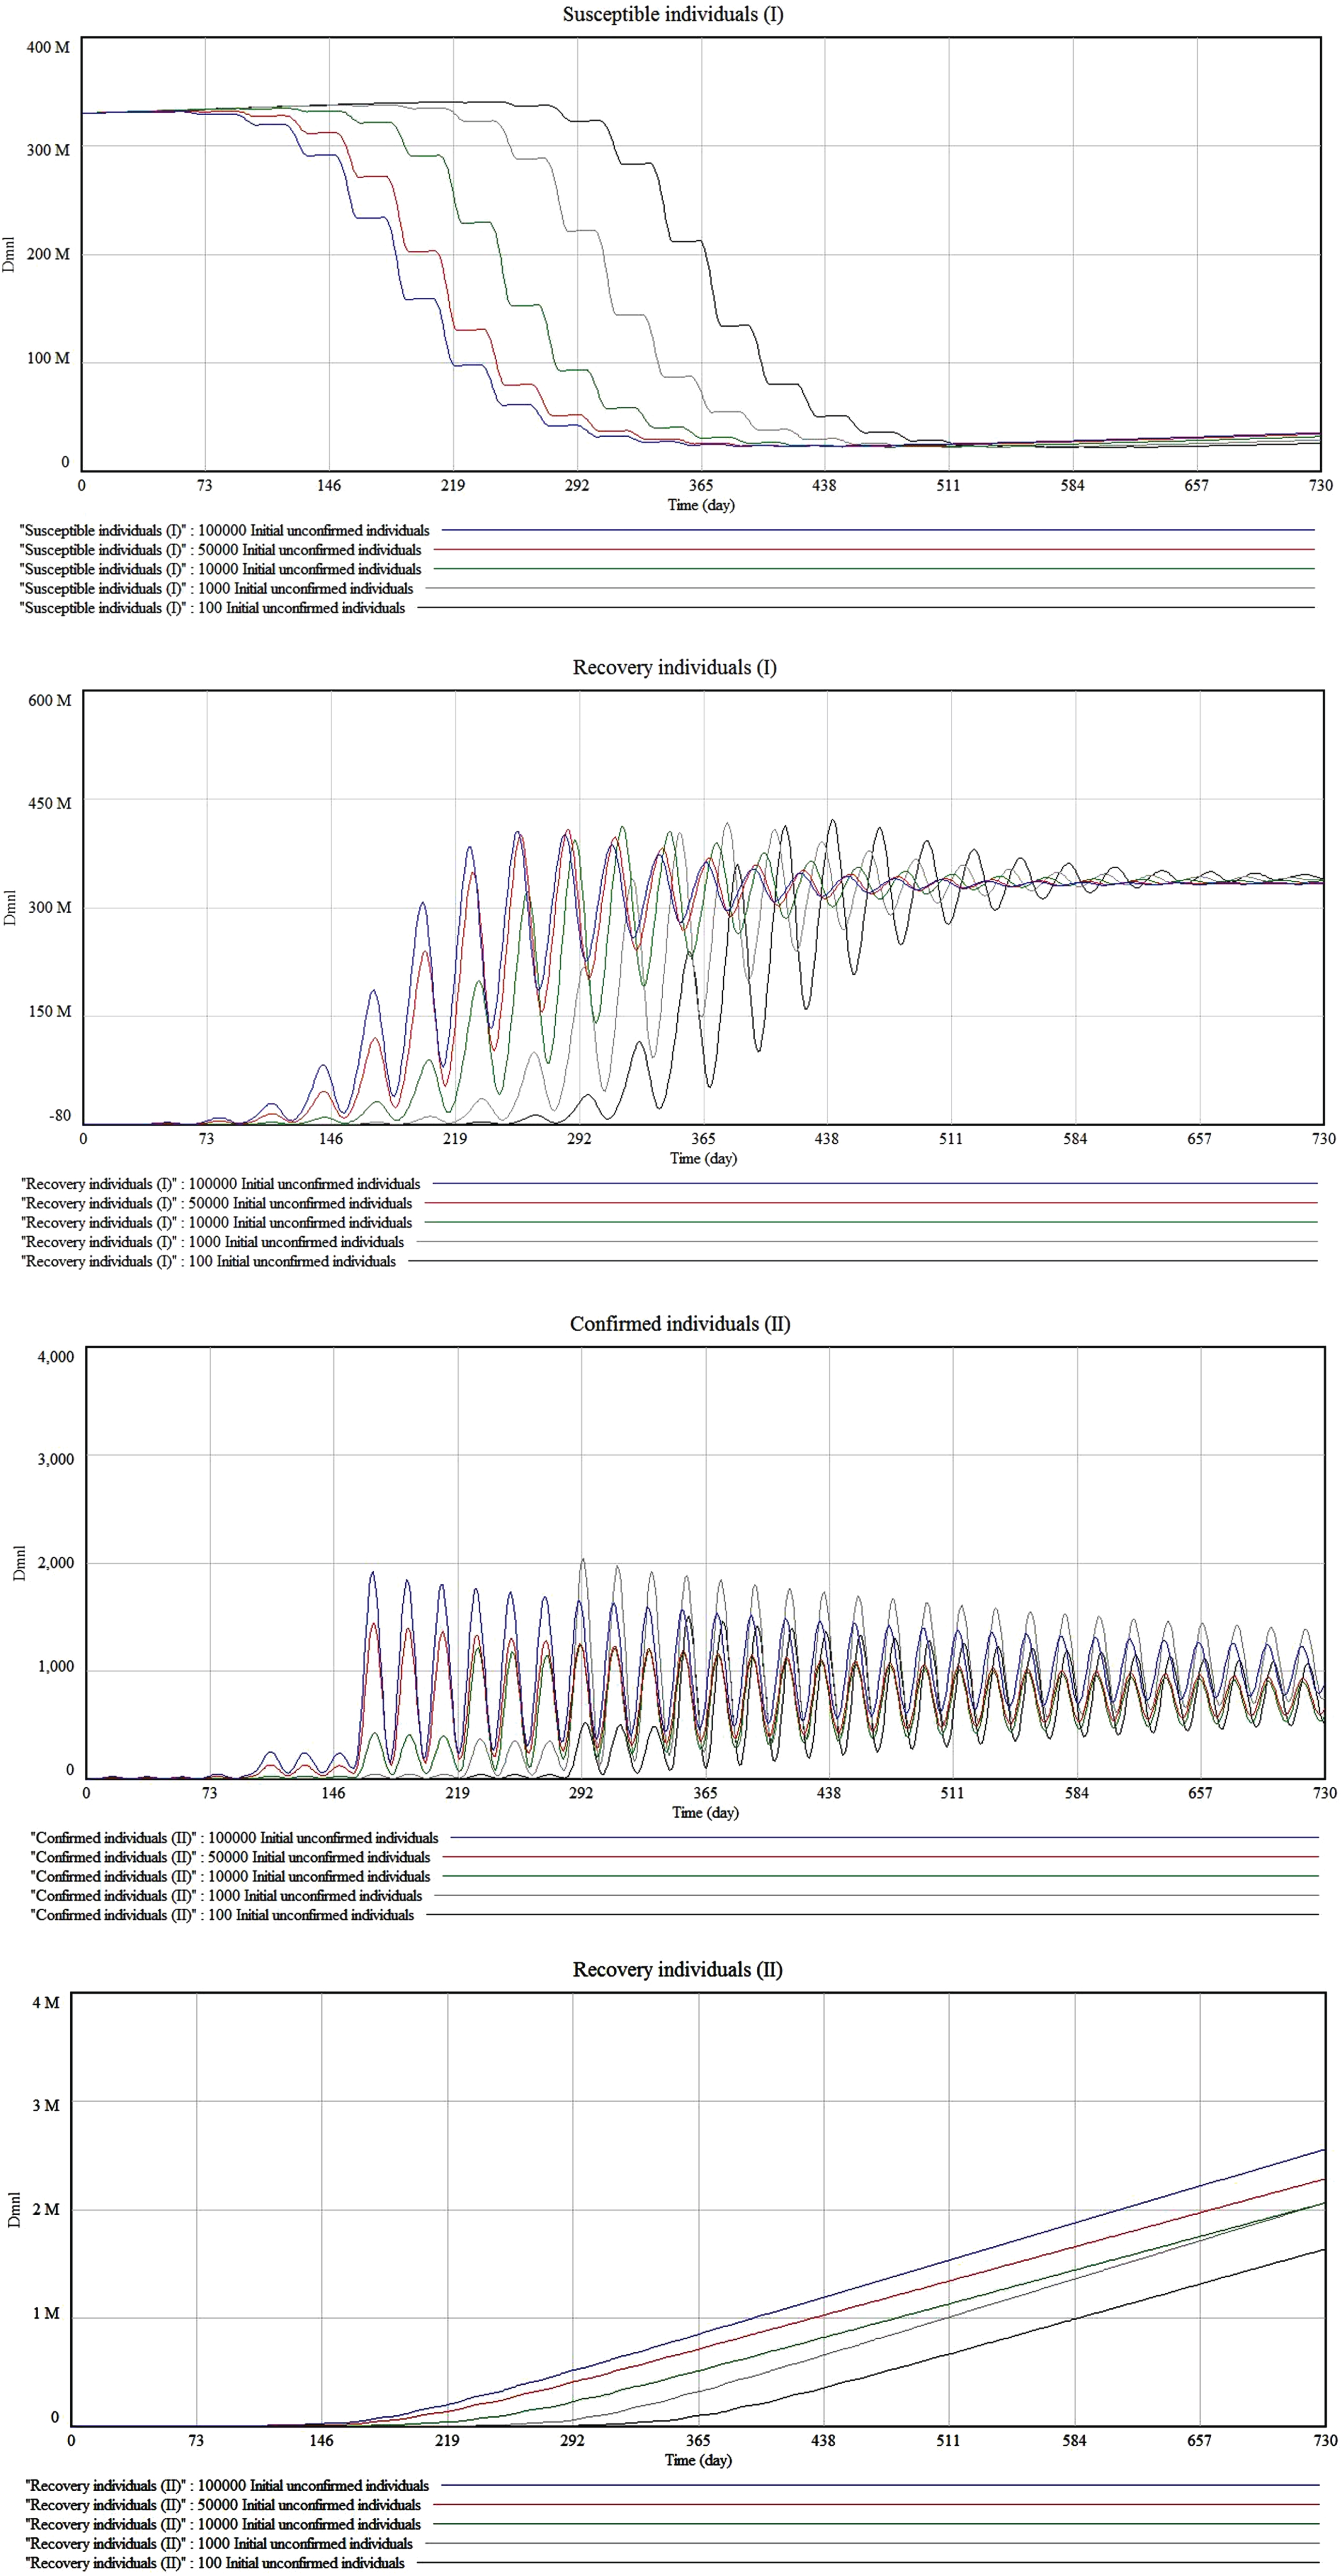
Through analysis, from the changes in the main parameters in Fig. 5, the following conclusions can be drawn [29]. The larger the number of Initial unconfirmed individuals, the later the control of COVID-19, the faster the spread, and the faster the effect of herd immunity. The negative effect is that it is easier for large-scale mass outbreaks to cause a considerable impact on the medical system.
For the the spread of the COVID-19 epidemic to other countries through air transportation, with other parameters unchanged, the larger the number of Initial unconfirmed individuals, the more likely it is to pose a threat of imported transmission to nonepidemic countries. However, this change cannot constitute the main influencing factor.
4.3Transfer rate
The initial transfer rate is calculated based on regular flights in 2019 between countries. In order to further analyze the impact of changes in the transfer rate, assume that the changes of transfer rate, that is, international flights reduction, are 5%, 10%, 25%, 50%, 75% and 100% of normal flights under the epidemic. The main observation variables are shown in Fig. 6.
Fig. 6
The impact of changes in Transfer Rate on the main parameters
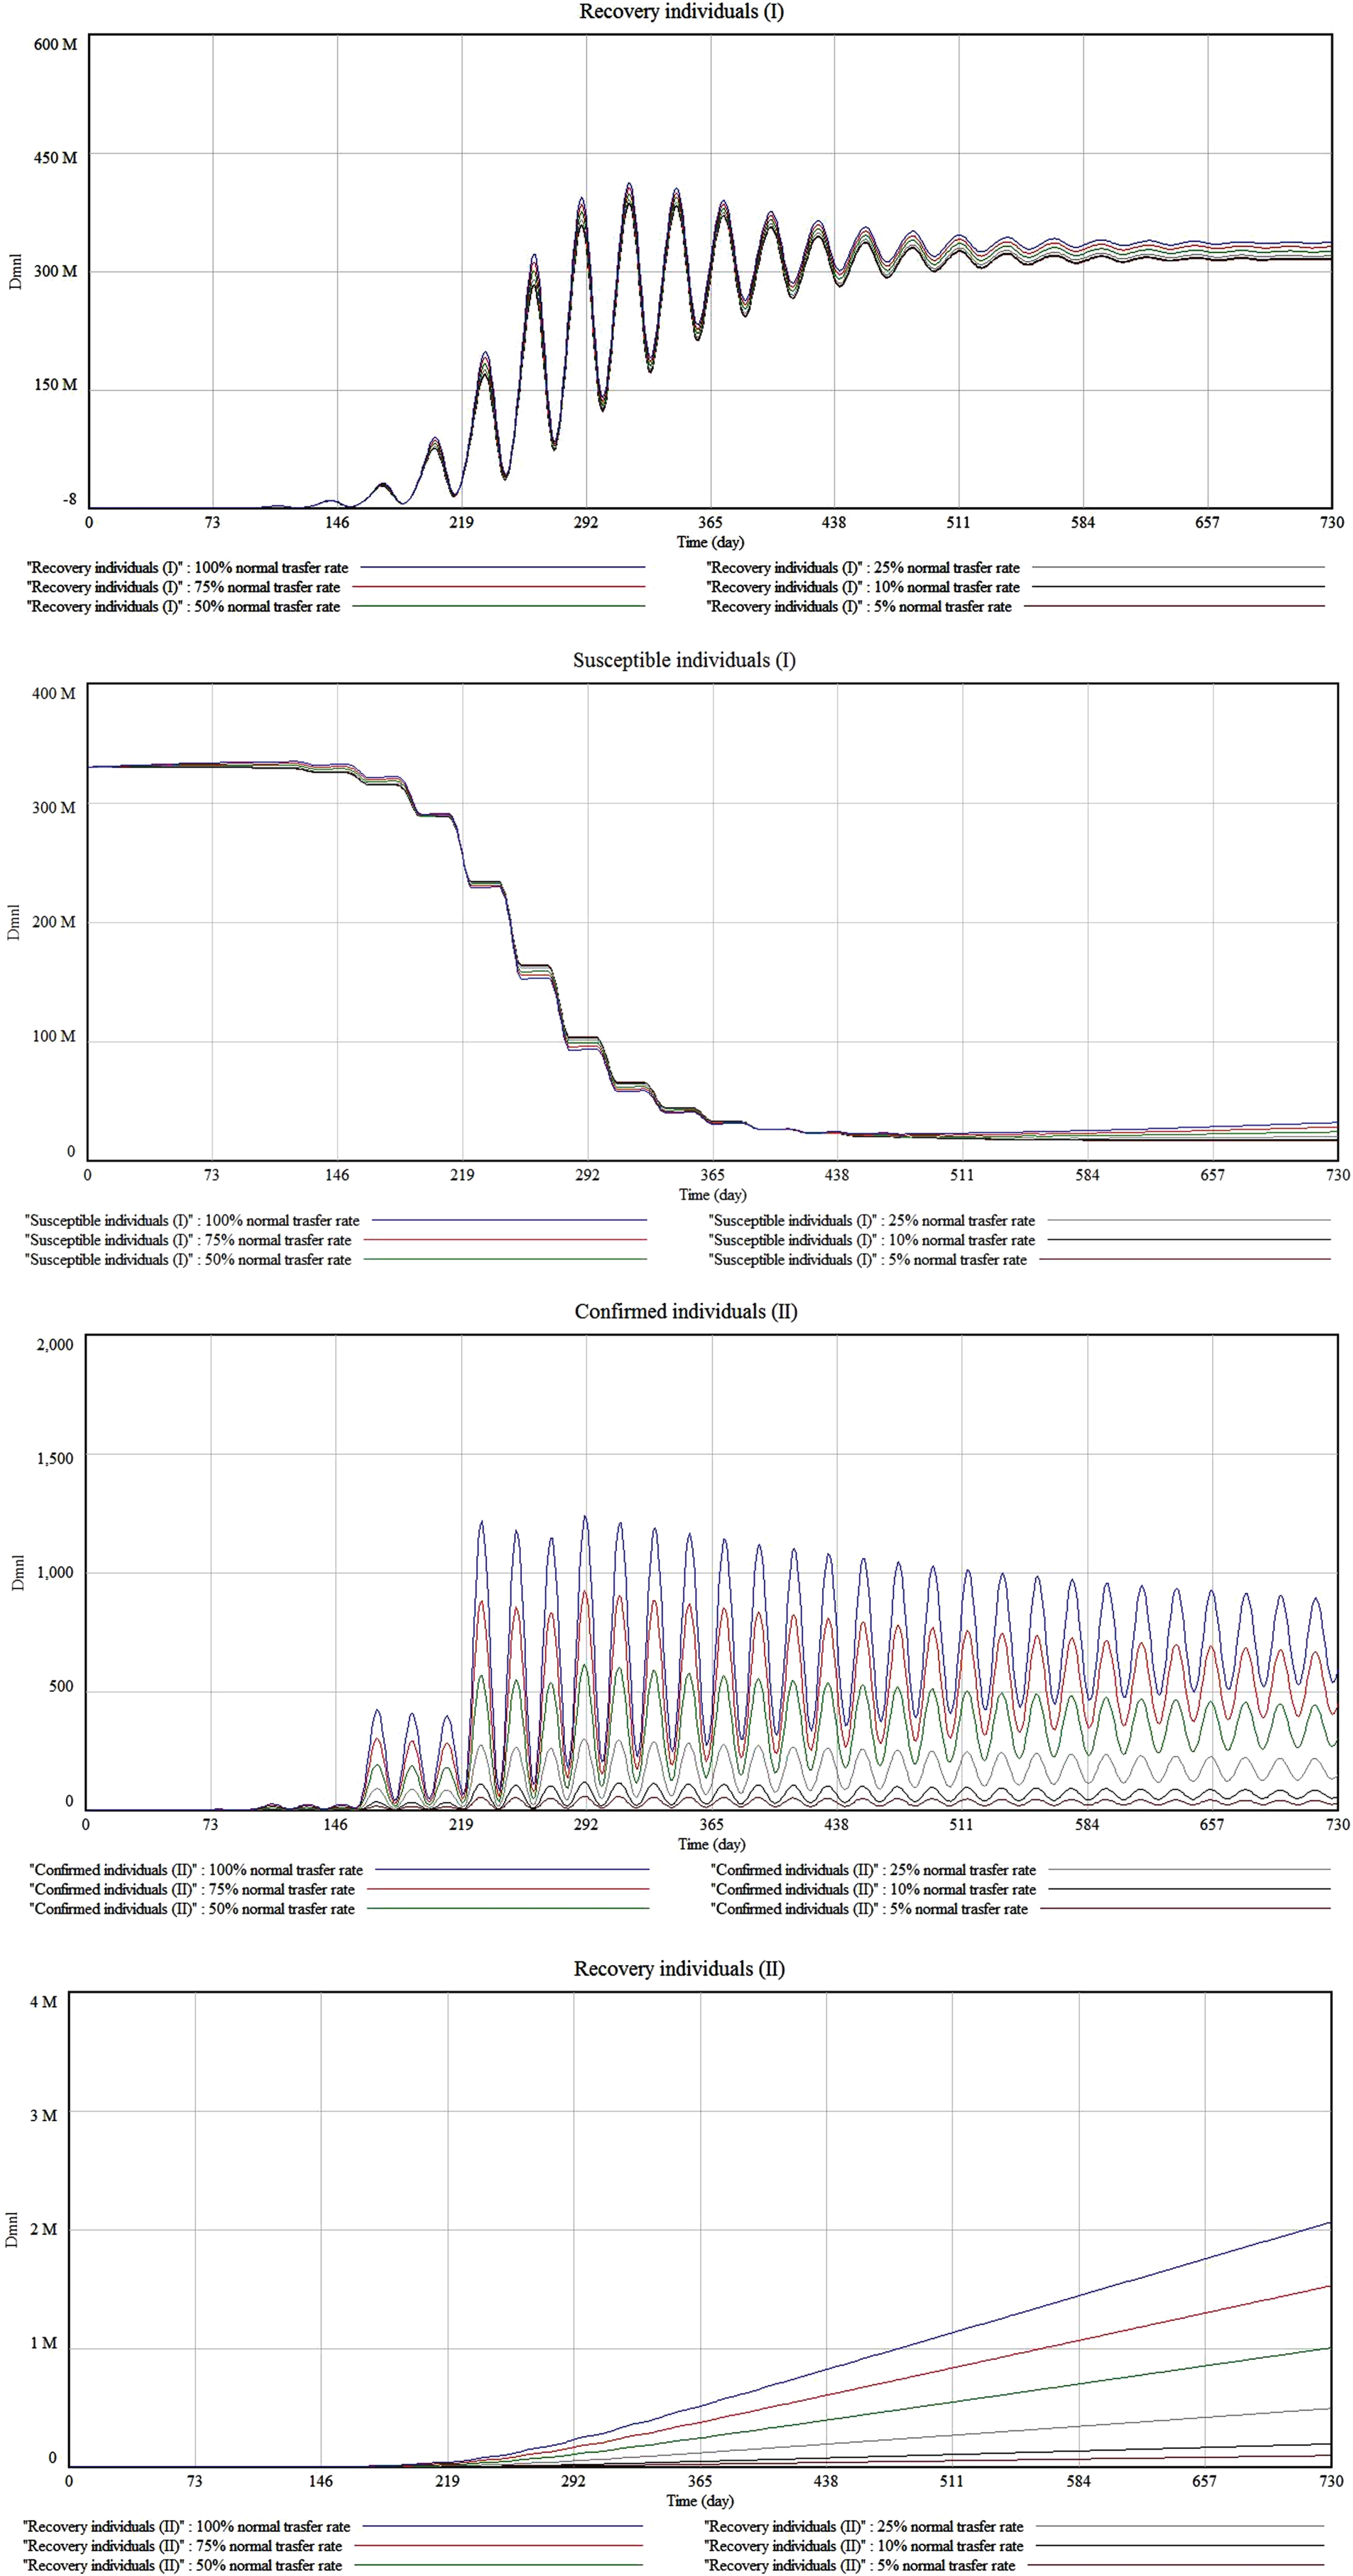
Through analysis, from the changes in the main parameters in Fig. 6, the following conclusions can be drawn [30]. The change in Transfer rate has a slight impact on the spread of COVID-19 in countries where the epidemic is at the center, but the impact is not significant.
For the spread epidemic to other countries through air transportation, with other parameters unchanged, the larger the transfer rate value, the easier it is to pose a threat of imported transmission to nonepidemic countries [31]. This change is very significant and obvious.
5Conclusion
The paper systematically analyzed the factors affecting the spread of COVID-19 in air transportation, established a system dynamics model, and passed the validity test.
Three key indicators, Basic reproduction rate, Initial infection individuals and Transfer rate, are selected as independent variables to analyze the system changes. Through computer simulation, with the increase of the Basic reproduction rate and Initial unconfirmed individuals, the COVID-19 spread will accelerate in the country where the epidemic is located, and at the same time it will easily impact the medical system and cause a large number of casualties, while Transfer rate has a slight impact on the spread in epidemic country.
For the spread of the COVID-19 to other countries through air transportation, the degree of the three independent variables of impact is different. Basic reproduction rate and Transfer rate will have a significant impact on the spread of the epidemic, while the Initial infection individuals have no significant impact. In other words, the infectivity of COVID-19 and the number of people transferred by air transportation are important factors affecting the import of epidemics for nonepidemic countries, and the sooner or later control of infectious diseases by epidemic countries has little effect on nonepidemic countries.
The spread of COVID-19 between countries through air transportation is analyzed and discussed, and the system dynamics model established is based on data from China and the United States. The data of other countries has not been analyzed, and the applicability of the model needs further testing and further research. In addition, a new strain of COVID-19 with stronger transmission ability has recently appeared, and the influence of this factor is not considered in the paper, and it is also used as the content of further discussion and research.
Acknowledgments
This work is supported by National Natural Science Foundation of China (71403225).
References
[1] | The New York Times Editorial, Here Comes the Coronavirus Pandemic: now, after many fire drills, the world may be facing a real fire, The New York Times, [Online]. Available: https://www.nytimes.com/2020/02/29/opinion/sunday/corona-virus-usa.html. Feb. 29, 2020. |
[2] | World Health Organization, Q&As on COVID-19 and related health topics, [Online]. Available: https://www.who.int/emergencies/diseases/novel-coronavirus-2019/question-and-answers-hub. April 17, 2020. |
[3] | U.S. Centers for Disease Control and Prevention, How COVID-19 Spreads, [Online]. Available: https://www.cdc.gov/coronavirus/2019-ncov/prevent-getting-sick/how-covid-spreads.html. April 3, 2020. |
[4] | European Centre for Disease Prevention and Control, Q & A on COVID-19. [Online]. Available: https://www.ecdc.europa.eu/en/covid-19/questions-answers. April 30, 2020. |
[5] | World Health Organization, Q & A: How is COVID-19 transmitted? [Online]. Available: https://www.who.int/news-room/q-a-detail/coronavirus-disease-covid-19-how-is-it-transmitted. July 12, 2020. |
[6] | Oran D.P. and Topol E.J. , Prevalence of Asymptomatic SARS-CoV-2 Infection: A Narrative Review, Annals of Internal Medicine 173: ((2020) ), 362–367. |
[7] | U.S. Centers for Disease Control and Prevention, COVID-19 Information for Travel, [Online]. Available: https://www.cdc.gov/coronavirus/2019-ncov/transmission/index.html. Feb. 25, 2020. |
[8] | Australian Government, Coronavirus (COVID-19) –information for Australian travelers, [Online]. Available: https://www.smartraveller.gov.au/COVID-19. Apr. 9, 2020. |
[9] | The New York Times Editorial, Coronavirus Travel Restrictions, Across the Globe, [Online]. Available: https://www.nytimes.com. Mar. 26, 2020. |
[10] | Button K. and Taylor S. , International air transportation and economic development, Journal of Air Transport Management 6: ((2000) ), 209–222. |
[11] | USA Today, Delta, American, United to suspend all China mainland flights as coronavirus crisis grows, [Online]. Available: . Jan. 31, 2020. |
[12] | Forbes You Can Still Fly U.S. To China If You Need To Go, [Online]. Available: https://www.forbes.com/sites/tedreed/2020/02/13/you-can-still-fly-us-to-china-if-you-need-to-go/?sh=53ee7c57637f. Feb. 13, 2020. |
[13] | Reuters, Chinese students fleeing virus-hit U.S. pay $20,000 for seats on private jets, [Online]. Available: https://www.reuters.com/article/us-health-coronavirus-china-students-idUSKBN21C0SF. Mar. 25, 2020. |
[14] | U.S. Department of Transportation, Notification and Order Disapproving Schedules, [Online]. Available: https://www.transportation.gov/briefing-room/us-department-transportation-modifies-june-3-order-regarding-chinese-carriers. Jun. 3, 2020. |
[15] | Chinazzi M. , Davis J.T. , Ajelli M. , Gioannini C. , Litvinova M. and Merler S. , The effect of travel restrictions on the spread of the 2019 novel coronavirus (COVID-19) outbreak, Science 368: ((2020) ), 395–400. |
[16] | Oxford Martin School, University of Oxford, COVID-19: Study shows that travel restrictions are most useful in the early and late phase of an epidemic, [Online]. Available: https://www.oxfordmartin.ox.ac.uk/news/covid-19-travel-restrictions-study. Mar. 25, 2020. |
[17] | Sun X. , Wandelt S. , et al., COVID-19 pandemic and air transportation: Successfully navigating the paper hurricane, Journal of Air Transport Management 94: ((2021) ), 1–13. |
[18] | Chu A.M.Y. , Tiwari A. and So M.K.P. , Detecting early signals of COVID-19 global pandemic from network density, J Trav Med 27: (5) ((2020) ), 1–3. |
[19] | Coelho M.T. , Rodrigues J.F. , et al., Global expansion of COVID-19 pandemic is driven by population size and airport connections, PeerJ 8: ((2020) ). |
[20] | Daon Y. , Thompson R. and Obolski U. , Estimating COVID-19 outbreak risk through air travel, J Trav Med 27: ((2020) ). |
[21] | Zhang L. , Yang H. , Wang K. and Zhan Y. , Measuring imported case risk of COVID-19 from inbound international flights —a case study on China, J Air Transport Manag 89: ((2020) ), 101918. |
[22] | Sun X. , Wandelt S. and Zhang A. , On the degree of synchronization between air transport connectivity and COVID-19 cases at worldwide level, Transport Policy 105: ((2021) ), 115–123. |
[23] | Bao X. , Ji P. , et al., The impact of COVID-19 on the worldwide air transportation network, Royal Society Open Science 8: ((2021) ), 1–11. |
[24] | Meng F. , Gong W. , et al., Impact of different control policies for COVID-19 outbreak on the air transportation industry: A comon between China, the U.S. and Singapore, Plos One 16: ((2021) ), 1–19 paris. |
[25] | Hou C. , Chen J. and Zhou Y. , The effectiveness of quarantine of Wuhan city against the Corona Virus Disease 2019 (COVID-19): A well-mixed SEIR model analysis, Medical Virology 4: ((2020) ), 841–848. |
[26] | He S. , Peng Y. and Sun K. , SEIR modeling of the COVID-19 and its dynamics, Nonlinear Dynamics 101: ((2020) ), 1667–1680. |
[27] | Eldin C. , Lagier J.C. , Mailhe M. and Gautret P. , Probable aircraft transmission of Covid-19 in-flight from the Central African Republic to France, Trav Med Infect Dis 35: ((2020) ), 101643–101643. |
[28] | Sanche S. , Lin Y.T. , Xu C. , Romero-Severson E. , Hengartner N. and Ke R. , High contagiousness and rapid spread of severe acute respiratory syndrome coronavirus 2, Emerg Infect Dis 25: ((2020) ), 1470–1477. |
[29] | U.S. Centers for Disease Control and Prevention, COVID-19 Pandemic Planning Scenarios, [Online]. Available: https://www.cdc.gov/coronavirus/2019-ncov/hcp/planning-scenarios.html. Sep. 10, 2020. |
[30] | ArcGIS, Johns Hopkins University, COVID-19 Dashboard by the Center for Systems Science and Engineering (CSSE) at Johns Hopkins University (JHU), [Online]. Available: https://coronavirus.jhu.edu/data. Jul. 5, 2021. |
[31] | Zhong Y. , Li X. and Jia X. , System dynamics, Beijing, China: Science and Technology Press, (2009) . |

