Article

Emissions Reduction of Greenhouse Gases, Ozone Precursors, Aerosols and Acidifying Gases from Road Transportation during the COVID-19 Lockdown in Colombia

by
Yiniva Camargo-Caicedo
1,*,
Laura C. Mantilla-Romo
1 and
Tomás R. Bolaño-Ortiz
2,3,4,*
1
Environmental Systems Modeling Research Group (GIMSA), Universidad del Magdalena, Santa Marta 470001, Colombia
2
Mendoza Regional Faculty-National Technological University (FRM-UTN), Mendoza M5500, Argentina
3
National Scientific and Technical Research Council (CONICET), Mendoza M5500, Argentina
4
Centre for Environmental Technologies (CETAM), Universidad Técnica Federico Santa María, Valparaíso 46383, Chile
*
Authors to whom correspondence should be addressed.
Appl. Sci. 2021, 11(4), 1458; https://doi.org/10.3390/app11041458
Submission received: 27 December 2020 / Revised: 25 January 2021 / Accepted: 26 January 2021 / Published: 5 February 2021
(This article belongs to the Special Issue Advances in Air Quality Monitoring and Assessment)

Abstract

:
The aim of this work was to analyze the changes in the emissions from the transport sector during the COVID-19 lockdown in Colombia. We compared estimated emissions from road transportation of four groups of pollutants, namely, greenhouse gases (CO2, CH4, N2O), ozone precursor gases (CO, NMVOC, NOx), aerosols (BC, PM2.5, PM10), and acidifying gases (NH3, SO2), during the first half of 2020 with values obtained in the same period of 2018. The estimate of emissions from road transportation was determined using a standardized methodology consistent with the 2006 Intergovernmental Panel on Climate Change (IPCC) Guidelines for National Greenhouse Gas Inventories and the European Environment Agency/European Monitoring and Evaluation Program. We found a substantial reduction in GHG emissions for CH4, N2O, and CO2 by 17%, 21%, and 28%, respectively. The ozone precursors CO and NMVOC presented a decrease of 21% and 22%, respectively, while NOx emissions were reduced up to 15% for the study period. In addition, BC decreased 15%, and there was a reduction of 17% for both PM10 and PM2.5 emissions. Finally, acidifying gases presented negative variations of 19% for SO2 and 23% for NH3 emissions. Furthermore, these results were consistent with the Ozone Monitoring Instrument (OMI) satellite observations and measurements at air quality stations. Our results suggest that the largest decreases were due to the reduction in the burning of gasoline and diesel oil from the transport sector during the COVID-19 lockdown. These results can serve decision makers in adopting strategies to improve air quality related to the analyzed sector.

Graphical Abstract

1. Introduction

COVID-19 emerged on 30 December 2019 [1] and was declared a global pandemic by the World Health Organization on 11 March 2020 [2]. The outbreak of the virus started in Wuhan, the capital of Hubei Province, China, and in a few weeks, it had spread to dozens of other countries in Asia [3]. Since then, the SARS-CoV-2 virus has spread in Africa, America, Asia, Europe and Oceania [4]. It led to most countries adopting isolation measures to stop its spread and avoid the collapse of health systems [5]. The first case in Colombia was confirmed by the National Health Institute on 6 March 2020. The Ministry of Health and Social Protection declared a public health emergency in the country on 12 March 2020, and a few weeks later, the Ministry of Interior ordered preventive lockdown and containment measures starting on 25 March 2020, whereby many human activities in the educational, cultural, transportation, and industrial manufacturing sectors were constrained. Consequently, educational institutes and non-essential factories remained closed, public events were cancelled, and work at home was implemented, to prevent the further spread of the COVID-19 pandemic.
The anthropogenic changes caused by the lockdown led to a decline in industrial production and energy consumption, up to 30% in some countries [6,7]. Energy demand has been altered drastically worldwide, and due to forced confinement, many international borders were closed and populations were isolated in their homes [8]. This led to a change in some consumption patterns for energy, e.g., those related to the transport sector, because of a reduction in mobility. These restrictions on economic activity during the pandemic have reduced NO2 emissions in China, Europe and the United States during COVID-19 [9].
Mobility has also been one of the things most affected by the COVID-19 restrictions. The changes in patterns of mobility indicate a reduction in vehicular traffic; as a consequence, a decrease in emissions associated with this sector is to be expected, given that the greenhouse gas (GHG) emissions from road and aviation transportation make up 72% and 11% of all GHG emissions, respectively [10]. Consequently, containment measures implemented in various countries have shown changes in the air quality [11,12,13,14]. The use of fossil fuels by road vehicles is the main source of four groups of pollutants, including GHG [10], including carbon dioxide (CO2), methane (CH4), and nitrous oxide (N2O); ozone precursor gases, such as carbon monoxide (CO) [15], non-methane volatile organic compounds (NMVOC) [16], and nitrogen oxides (NOx) [17,18]; aerosols, including black carbon (BC) [10] and particulate matter (PM2.5, PM10) [15]; acidifying gases, such as ammonia (NH3) [19] and sulfur dioxide (SO2) [20]. GHG emissions, such as CO2, are mainly produced by power generation and road transport. Other GHG emissions, such as CH4, are generated by fermentation processes, fossil fuel extraction and use, landfills and waste. In addition, N2O is produced from soil emissions [21]. Ozone precursor gases, such as CO, are emitted by incomplete fuel combustion of road transport as well as industrial processes [22]. NMVOCs are important air pollutants because of their contributions of secondary compounds (aerosols and ozone), generated from gasoline combustion [16,23,24]. The emissions of NOx (NOx = NO + NO2) mainly include biomass burning and fuel combustion (e.g., power plant combustion, industrial emissions and transportation emissions) [25]. Aerosol emissions are contributed mostly as by-products of combustion from thermal power stations, vehicle engines and factories [26], with on-road vehicles being the source of fine particulate matter (PM2.5) [27]. In addition, one of the main anthropogenic emissions sources of BC is the incomplete combustion of fossil fuels (especially diesel) in vehicles [10]. Acidifying gases are emitted by the combustion of biomass and fossil fuels as well as by industrial activity [19,20]. NH3 emissions related to road traffic are due to use of catalytic NOx reduction systems on light and heavy-duty vehicles [19], whose devices use an injection of urea or ammonia [28]. Recent studies showed that the containment measures to minimize the spread of SARS-CoV-2 have resulted in reductions of 15% to 40% in industrial sectors and temporarily reduced China’s CO2 emissions by 25%. The European Public Health Alliance (EPHA) states that, in Italy, the urban NO₂ pollution comes mainly from traffic, especially diesel vehicles, which are also a major source of particulate matter; the COVID-19 pandemic has resulted in a remarkable drop in these pollutants. France also showed a drop in NOx emissions as a result of the reduction in economic activities and transportation. During the spread of the COVID-19 pandemic in New York, traffic levels were estimated to be down 35% compared with the previous year; significant decreases in the emissions of CO and CO2 were registered, with a 5–10% reduction in CO2 [26].
Some studies have examined the effects of the COVID-19 lockdown on urban mobility [18,29,30,31]. The data show that mobility has dropped around the world as the spread of the virus has increased; public transportation systems were the most affected due to users refusing to use them in order to avoid social contact, and therefore the risk of contagion [32]. Other studies have shown an improvement in air quality in some Colombian cities due to mobility restrictions during the COVID-19 lockdown [33,34]. However, these studies did not look at the changes in atmospheric emissions associated with the observed air quality changes. Google, in its COVID-19 Community Mobility Reports for Colombia (https://www.google.com/covid19/mobility/), reports that, in April 2020, the country saw the biggest reduction in visits to retail and recreation places (77%), transport stations (77%), parks (67%), grocery stores and pharmacies (59%), and workplaces (58%), while the trend of mobility in residential areas increased by 28%. At the beginning of May, the opening of some economic sectors caused an increase in mobility in relation to the previous month, especially in workplaces (17%), grocery stores and pharmacies (13%), retail and recreation places (10%), and transport stations (9%).
Therefore, the aim of this study is to analyze the changes in the emissions associated with road transportation during the COVID-19 lockdown in Colombia, comparing these emissions with values obtained in the same period of 2018 for four groups of pollutants, namely, GHGs (CH4, CO2, N2O), ozone precursor gases (CO, NMVOC, NOx), aerosols (BC, PM10, PM2.5), and acidifying gases (NH3, SO2). The results can serve decision makers in the development of strategies to improve air quality related to the road transport sector in Colombia. This article is ordered as follows. Section 2 describes the methodology applied to estimate emissions in Colombia and details the changes in air quality observed by Bogotá’s air quality network and from the OMI satellite. Section 4 details the results of the emissions changes and improvements in air quality in Colombia due to its COVID-19 pandemic lockdown, while Section 5 discusses the results and provides further analysis in light of updated literature. Finally, Section 5 reports the main conclusions and perspectives.

2. Materials and Methods

2.1. Study Area

Colombia occupies a total surface of 1,140,000 km2 in the northern part of South America (Figure 1). It has a population of approximately 49.5 million inhabitants, distributed into 32 departments and one capital district, Bogotá D.C., with a population of 7.8 million [35]. The gross domestic product (GDP) was 323.80 billion USD (at current prices), with a per capita income of 7842 USD (GDP/capita) in 2019, according to the World Bank data and its trading economics projections [36]. The country’s vehicle fleet reached 15.6 million units in 2020 [37], with a fuel consumption during the first half of the year equivalent to 2.5 million m3 diesel oil, 2.6 million m3 gasoline and 600,000 m3 compressed natural gas (CNG). According to the last Colombia GHG national inventory presented to the Intergovernmental Panel on Climate Change (IPCC) [38], from a sectorial point of view, annual Carbon Dioxide Equivalent (CO2 eq.) emissions (for the year 2012) correspond to 158.6 Tg to agriculture, 78.0 Tg to energy, 13.3 Tg to waste, and 8.9 Tg to industry. While the transport sub-sector emitted 28.2 Tg, contributing 36% of energy sector emissions and 11% of the total emissions of the country.

2.2. Emission Estimation

We studied emissions from road transportation in four groups of pollutants that affect climate change, air quality and health, namely, GHGs (CH4, CO2 and N2O), ozone precursor gases (CO, NMVOC and NOx), aerosols (BC, PM10 and PM2.5), and acidifying gases (NH3 and SO2).
Several studies have been conducted to estimate the emissions from road transportation based on fuel consumption [17,39,40]. To estimate these emissions, we selected a standardized methodology consistent with the 2006 IPCC Guidelines for National Greenhouse Gas Inventories [41] and the method from the EEA/EMEP Emission Inventory Guidebook 2019. [42]. Thus, we used tier 1 methods that use activity data derived from available statistical information (energy statistics, production statistics, traffic counts, population size, etc.). In addition, tier 1 emission factors were chosen to represent "typical" or "averaged" process conditions; they tended to be independent of technology. Furthermore, we used an additional level of detail (tier 2) for the calculation of SO2 emissions, since Colombian fuel emission factors were used [43]. This is consistent with previous studies that showed that this methodology was adequate to estimate inventories at the national level, when detailed information by city was not available [20,44,45,46,47]. Overall, the method was based on estimating emissions through a linear relationship between activity data and emission factors (Table A1). The calculation was made using Equation (1), as follows:
E p = p , f , v F u e l f , v * E f p , f , v
where E (p) is the total emission for species or pollutant p, Fuel (f,v) is the fuel sold (diesel, gasoline and CNG) for type of vehicle v, Ef (p,f,v) is the emission factor for pollutant species p, for type of fuel f and vehicle v.
Therefore, the emission estimate for each polluting species was calculated using Equation (1) with the following data:
Fuel: We used the Statistical Bulletin by Ministry of Mines and Energy [48], which includes activities such as monthly sales of fuels for the first half of 2018. We used the Liquid Fuel Information System (SICOM) [49], which includes monthly sales to fuel retail distributors for the first half of 2020. In addition, we used the Mercantile Exchange Colombia [50] (as shown in Table A2), for data on the consumption of CNG (Figure A1). Furthermore, considering that consumption was only focused on the transport sector, fuel distribution data was obtained from automotive service stations, assuming 96% of the distribution of the total of this category (retail distributors) was the total of the fuel supply, according to SICOM data [49]. For fuel consumption by vehicle type, the consumption distribution percentages (Table 1) of the indicative action plan for energy efficiency [51] were selected, calculating consumption by vehicle category.
Number of vehicles: Census of number of vehicles by type (vehicle category) from the Single National Traffic Registry of Colombia [37].
Emission factors: The emission factors considered were those established by the EMEP/EEE Joint Inventory Guide to Air Pollutant Emissions database [42], for vehicle type and pollutant (GHGs, ozone precursors, aerosols and acidifying gases). The SO2 emission factor and the power calorific value by type of fuel was obtained from the 2016 UPME FECOC calculator (Colombian fuel emission factors) in energy units (Kg Tj−1) [43], except the CNG power calorific value was taken from the PROMIGAS technical notes [52]. These values were assumed for all types of vehicle under study. Additionally, CO2eq from the main GHGs (CH4 and N2O) was estimated. CO2eq emissions with a 100-year horizon global warming potential (GWP100: CH4 = 28 and N2O = 298) have been considered through the IPCC’s suggestion in the 5th Assessment Report (AR5) [53]. We analyzed the monthly variations in emissions from January to June 2018 and 2020. The emissions reduction during the COVID-19 pandemic lockdown in Colombia was calculated based on the year 2018.

2.3. Emissions Reduction vs. Air Quality Improvement

We analyzed the improvements in air quality to relate them to the emission reductions analyzed during the quarantine period. We used data from five air quality traffic stations in Bogotá (Carvajal-Sevillana, Estación Móvil, Fontibón, Las Ferias, Minambiente) available in the Bogotá Air Quality Monitoring Database (BAQMD) [54]. These data were used to assess the air quality concentration of CO, SO2, NO2 and O3; the equipment used by BAQMD is specified in Table A3. For each station, data from April, May and June of 2018 were used to calculate the mean concentrations of each pollutant for each month. Similarly, data from April, May and June of 2020 were used to calculate mean levels of each pollutant during the lockdown. It is worth clarifying that BAQMD reports pollutant concentrations under standard conditions (1 atm and 25 °C). Thus, this allowed us to perform a comparison with concentrations during the same period of a base year (2018). This base-year comparison was also performed to control for meteorological conditions. We used tropospheric NO2 data for April to June 2018 and 2020, retrieved from the ozone monitoring instrument (OMI), a visual and ultraviolet spectrometer aboard the NASA Aura spacecraft [55]. This information enabled the emissions analysis and estimation associated with road transportation in the four groups of pollutants previously cited. In addition, the average NO2 retrieved from OMI data was estimated for the period of April to June 2018 and 2020 to evaluate the NO2 level variation during the pandemic lockdown in Colombia [56].

3. Results

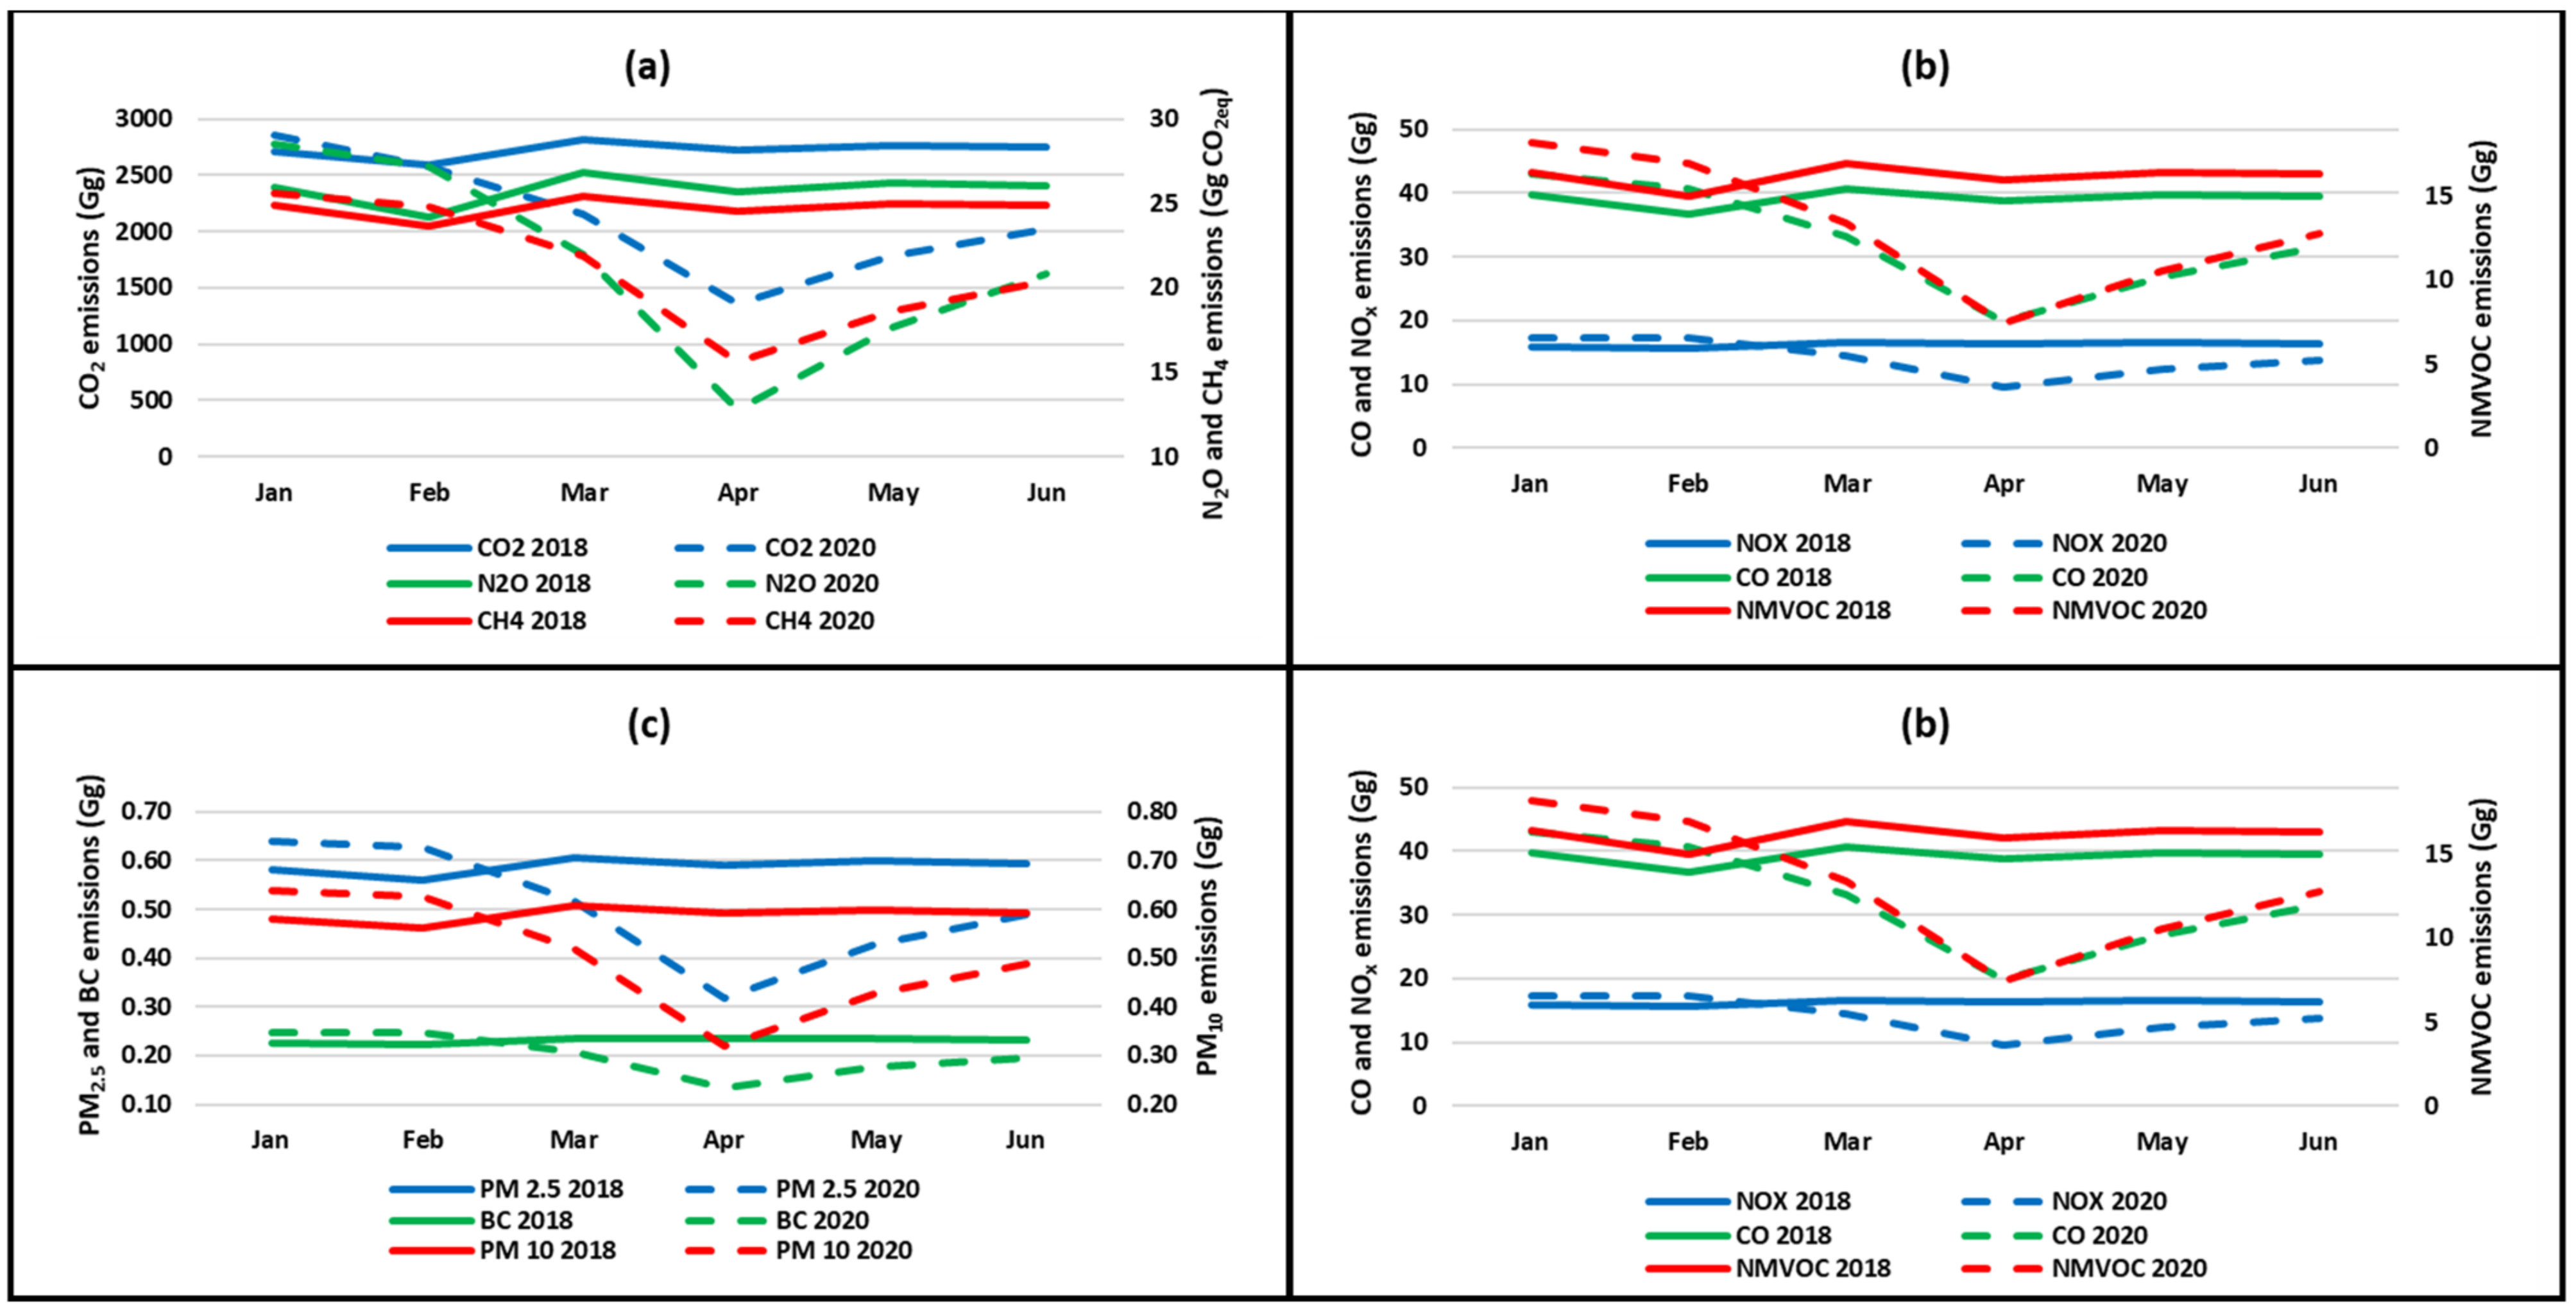
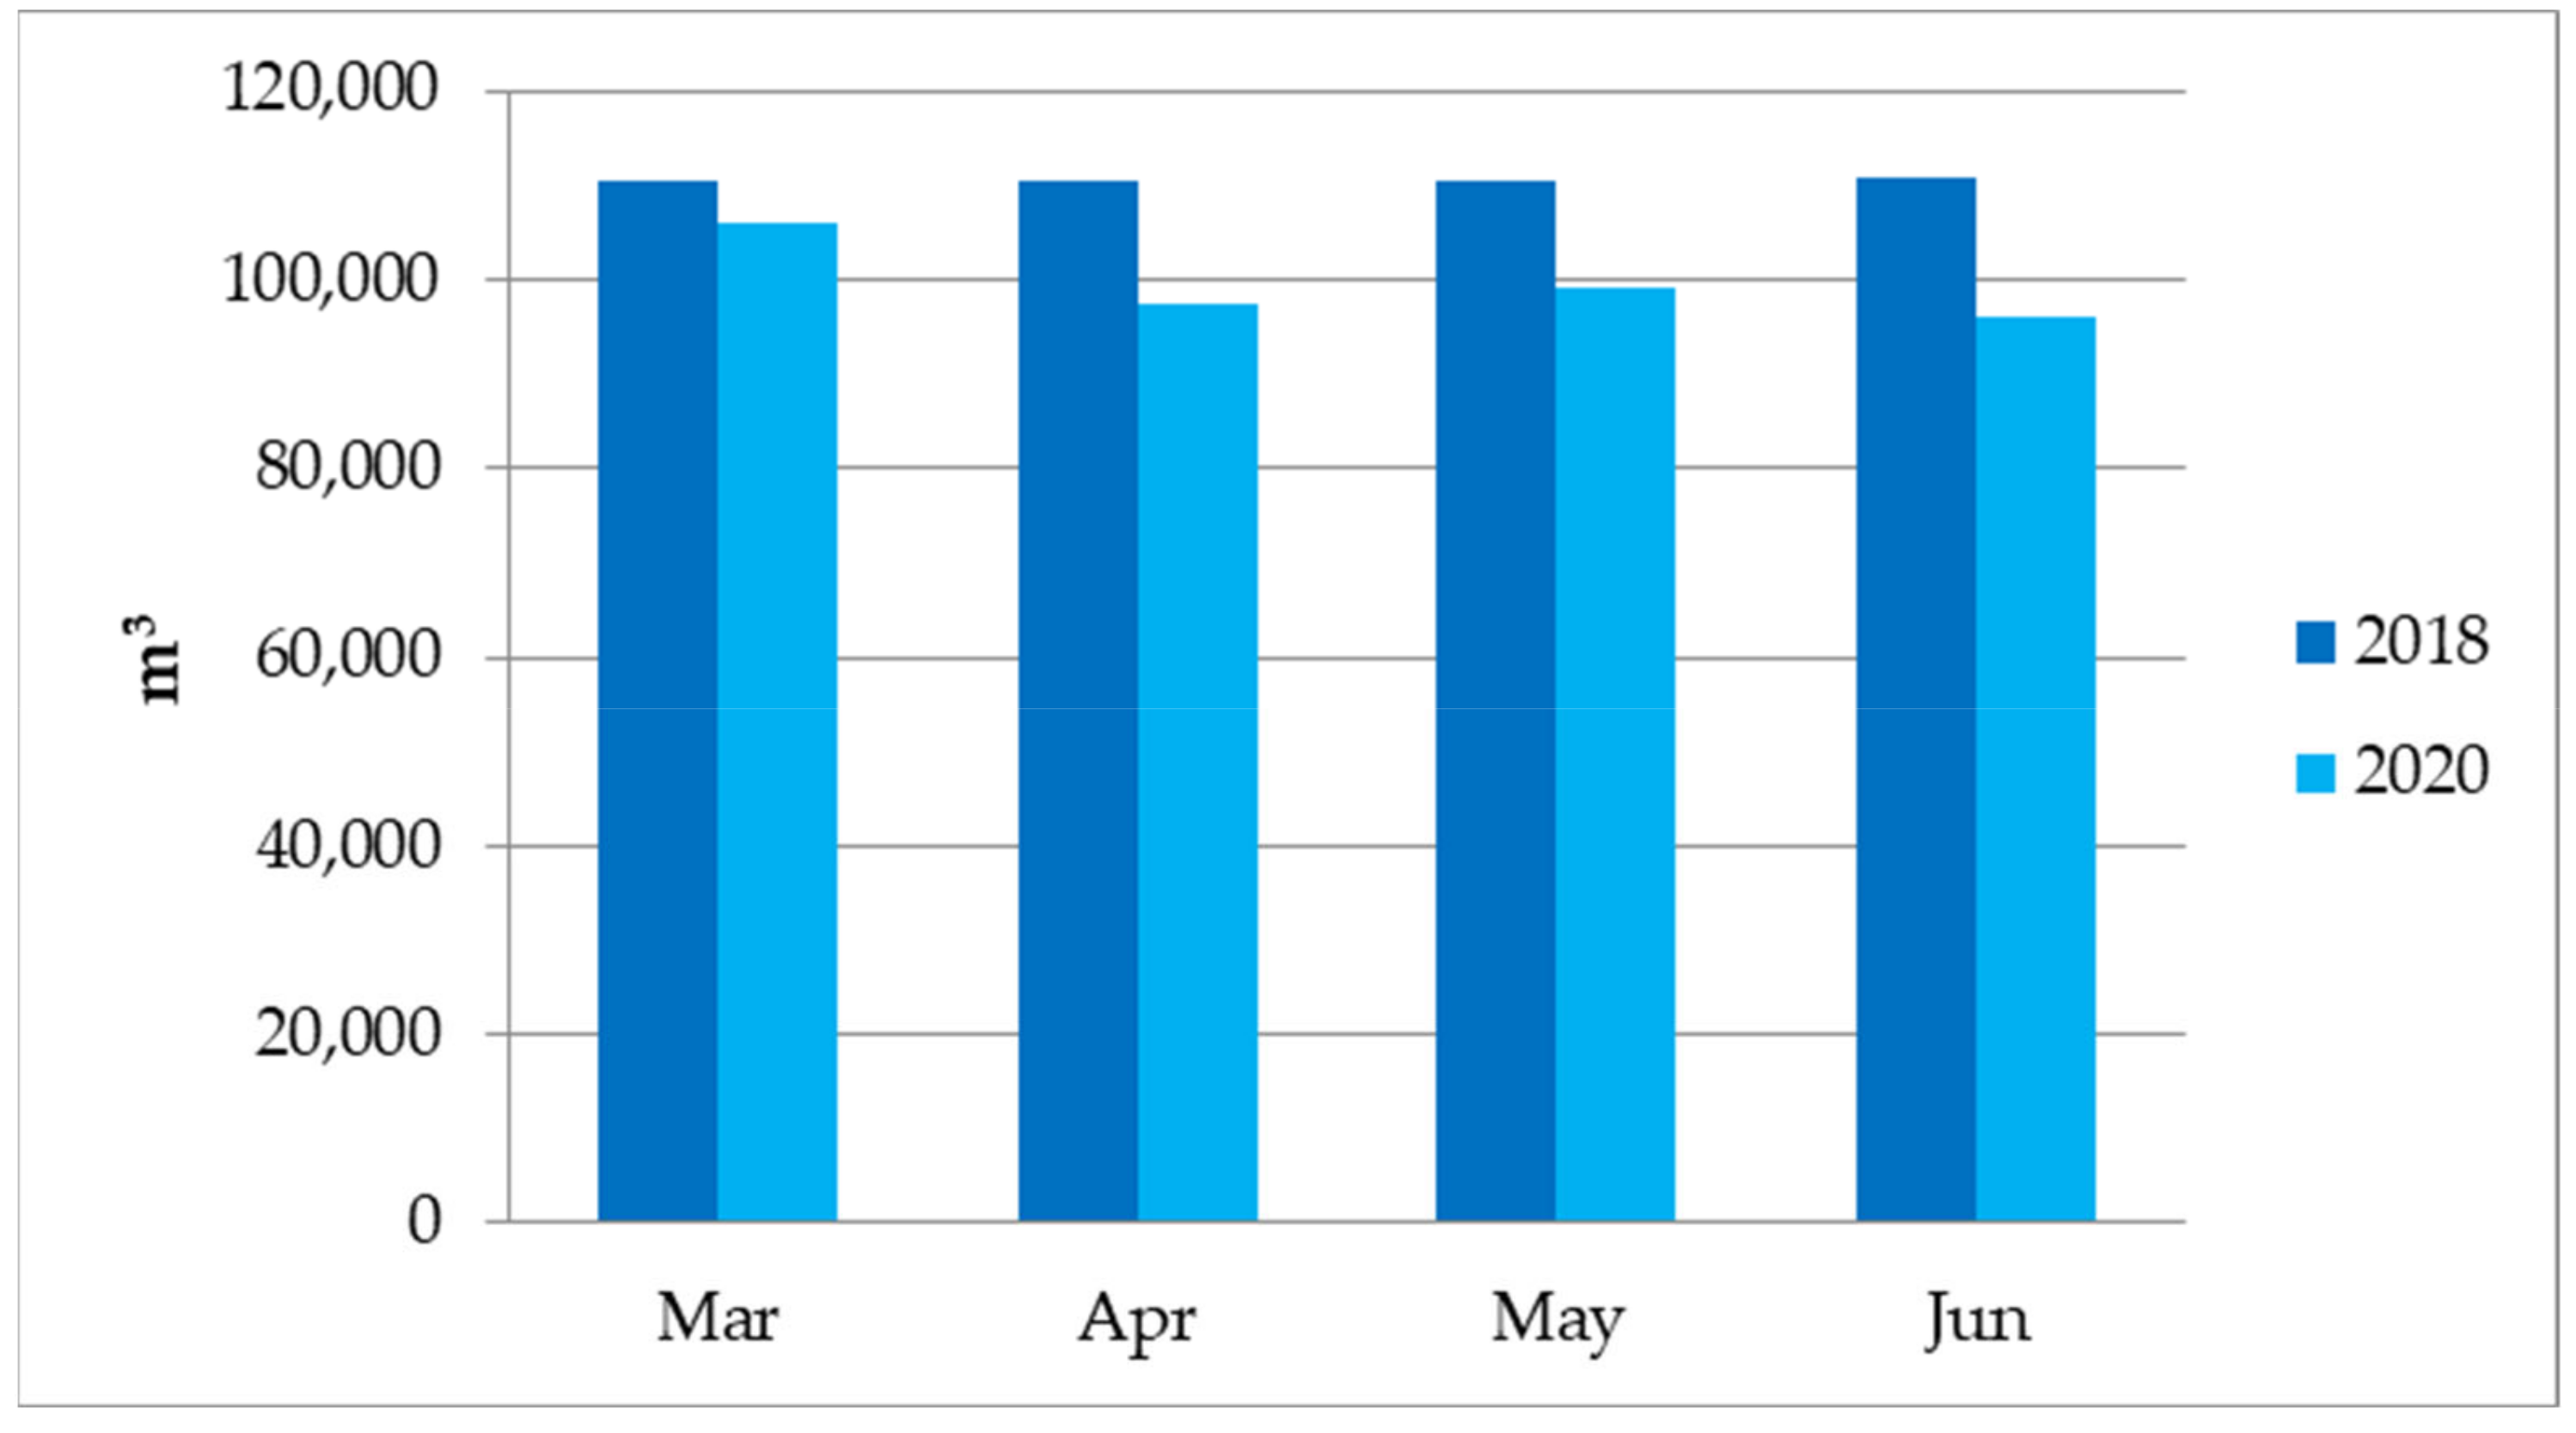
Figure 2 shows the monthly emissions of analyzed pollutants for the compared periods. In the first half of 2020, the emissions of the four groups of pollutants associated with road transportation decreased starting in March compared with those estimated for the base year 2018. In late March 2020, the national government adopted vehicle restrictions, so April showed a higher reduction of GHG emissions for CO2, CH4 and N2O in percentages equivalent to 58%, 40% and 71%, respectively. CO2 reduction was the most representative due its contribution of 97.62% of the total emissions from the transport sector, specifically the burning of fossil fuels by road transportation (lightweight and cargo vehicles) [38]. Later, GHG emissions increased in May by 24%, 16% and 27% for CO2, CH4 and N2O, respectively, owing the reactivation of some economic sectors. Restrictions began to be relaxed, allowing the opening of some activities that were restricted during the confinement. As a result, GHG emissions in June continued to increase, though they remained lower than those of 2018.
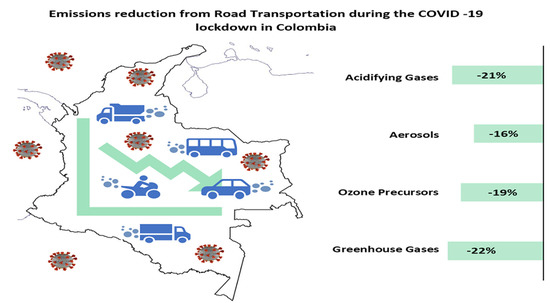
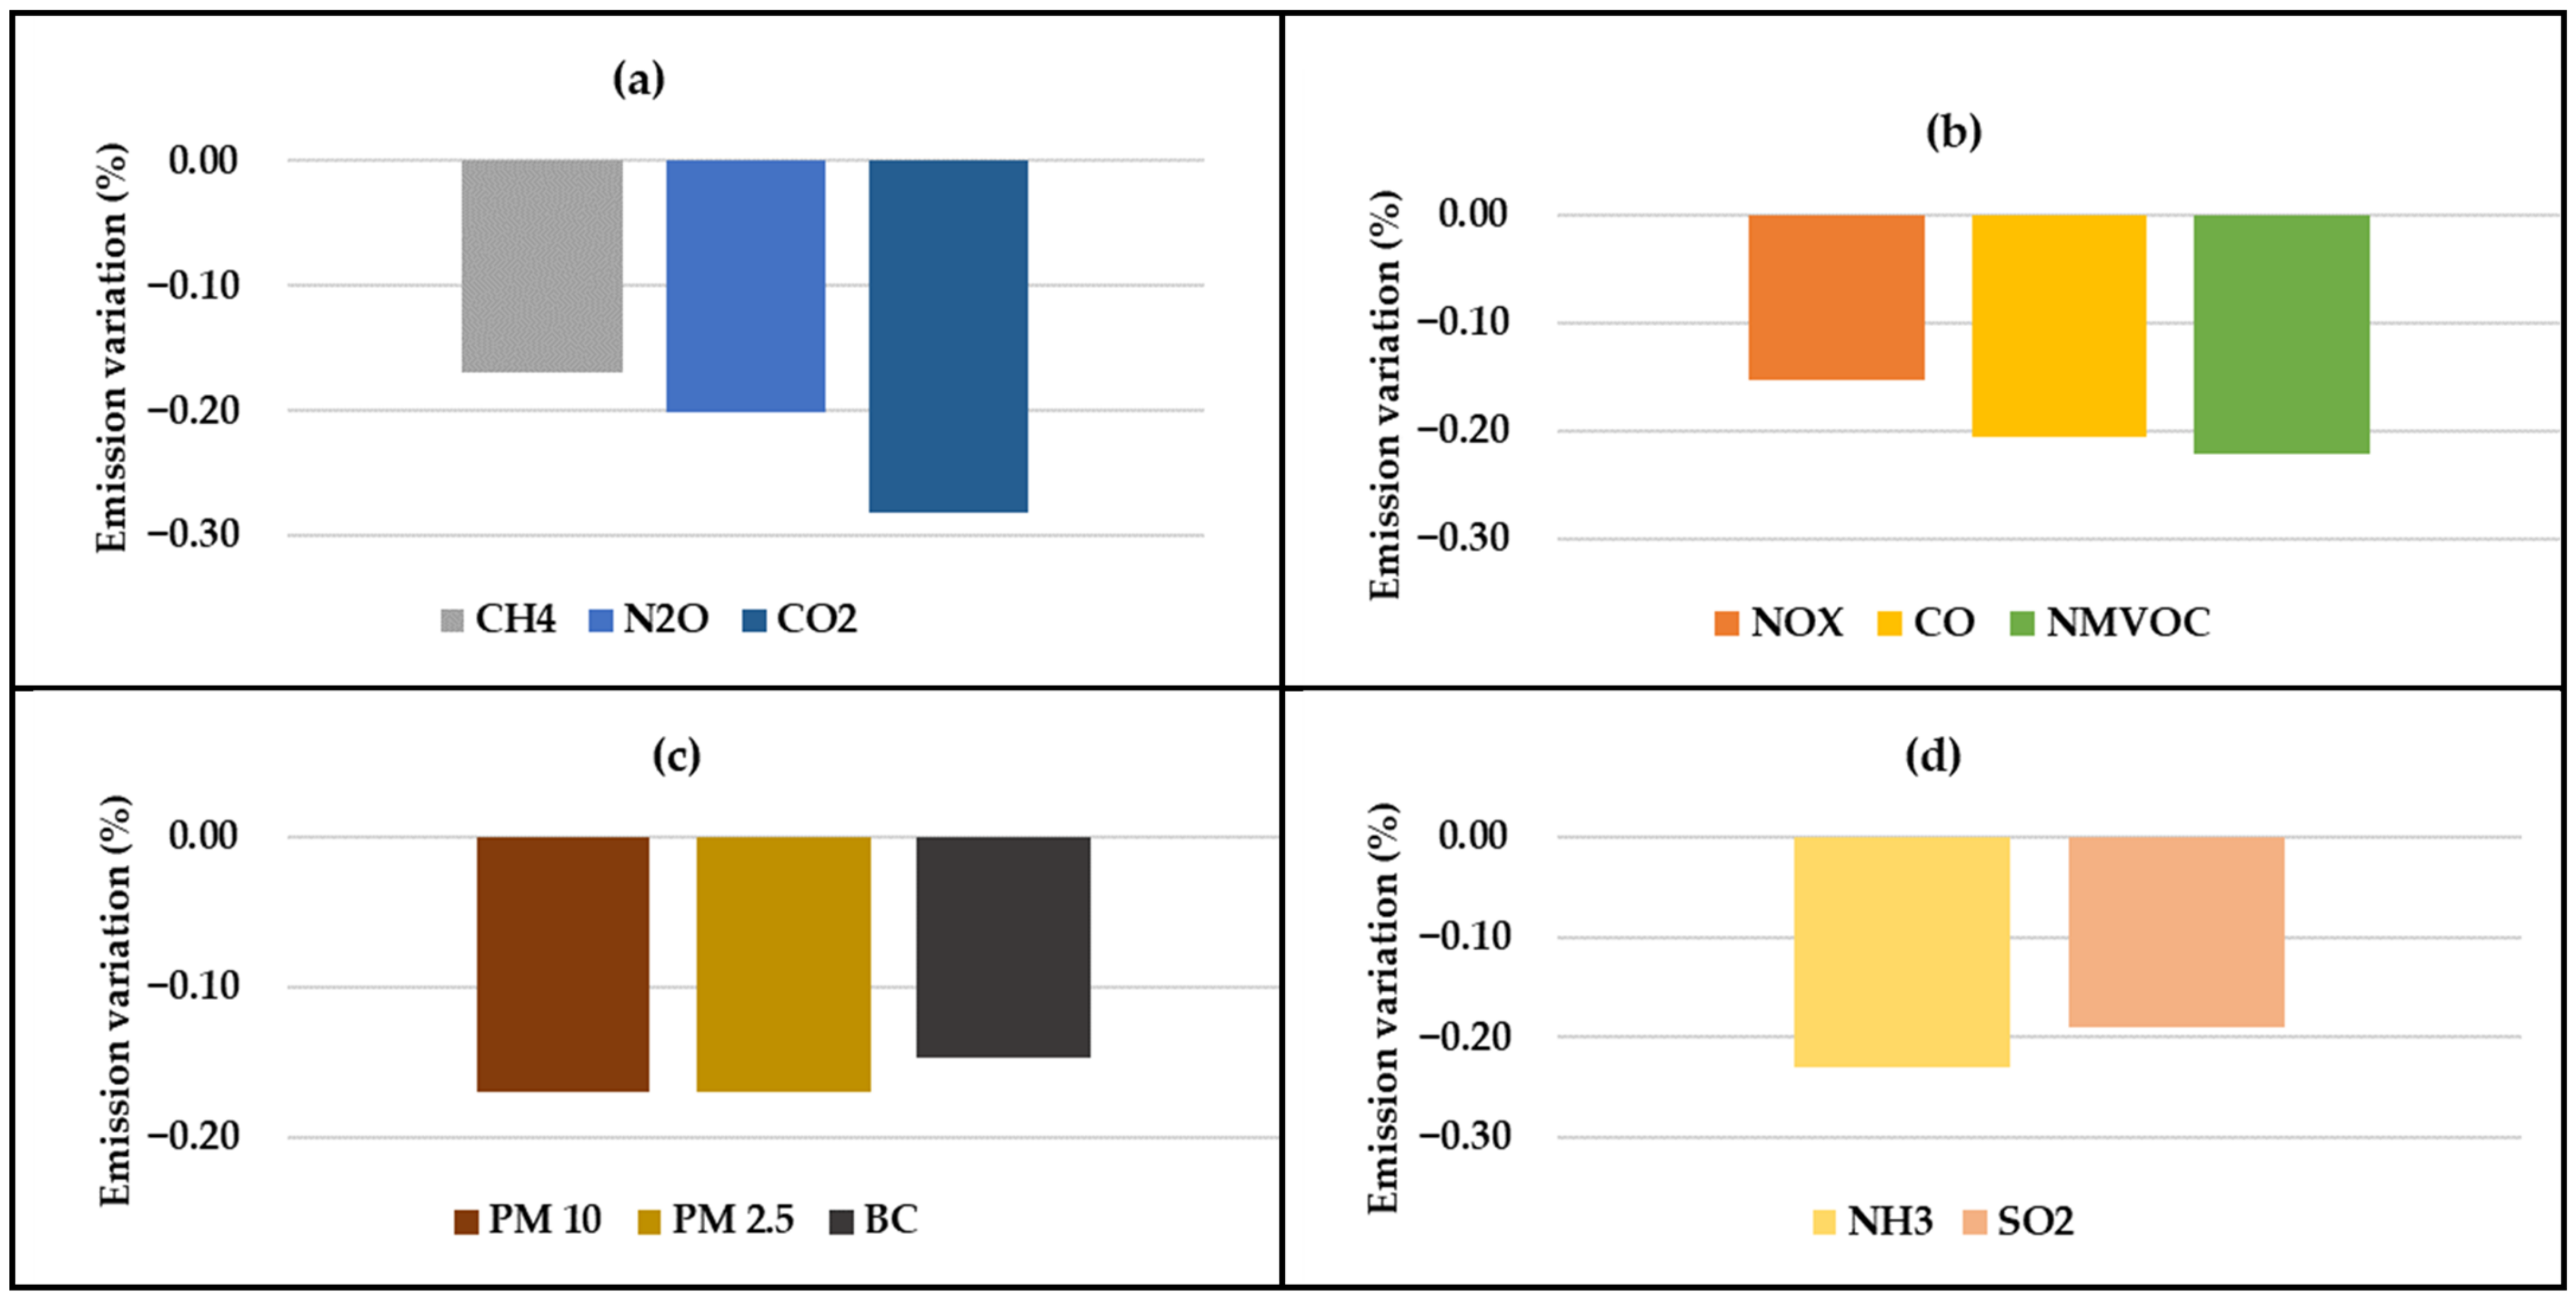
As shown in Figure 3, all estimated pollutants showed reductions between January and June 2020 due to the pandemic lockdown in Colombia. Negative variations in GHG emissions were 28%, 17% and 20% for CO2, N2O and CH4, respectively. While the ozone precursor group showed a reduction of up to 21% and 22% for CO and NMVOC, respectively. The emissions of these pollutants were mostly the result of burning gasoline and diesel oil, which represent 90% of the total emissions. In addition, the NOx emissions variation was −15% for the study period, with 50% of the total emissions by this pollutant attributed to the burning of diesel oil.
Aerosol emissions of PM10 and PM2.5 each showed a negative emissions variation of 17%, which was associated mostly with the fuel consumption by cargo vehicles and public transport [57]. BC emissions showed a decrease of 15%, and acidifying gases also displayed reductions. SO2 emissions showed a negative variation of 19%, while NH3 emissions were reduced by 23% of its. These emissions reductions were mainly produced by the reduction in consumption of gasoline and diesel oil. In general, pollutant groups that registered the most reduction in emissions variations were GHGs (−22%) and acidifying gases (−21%), while CO2 presented the greatest reduction among all pollutants analyzed.
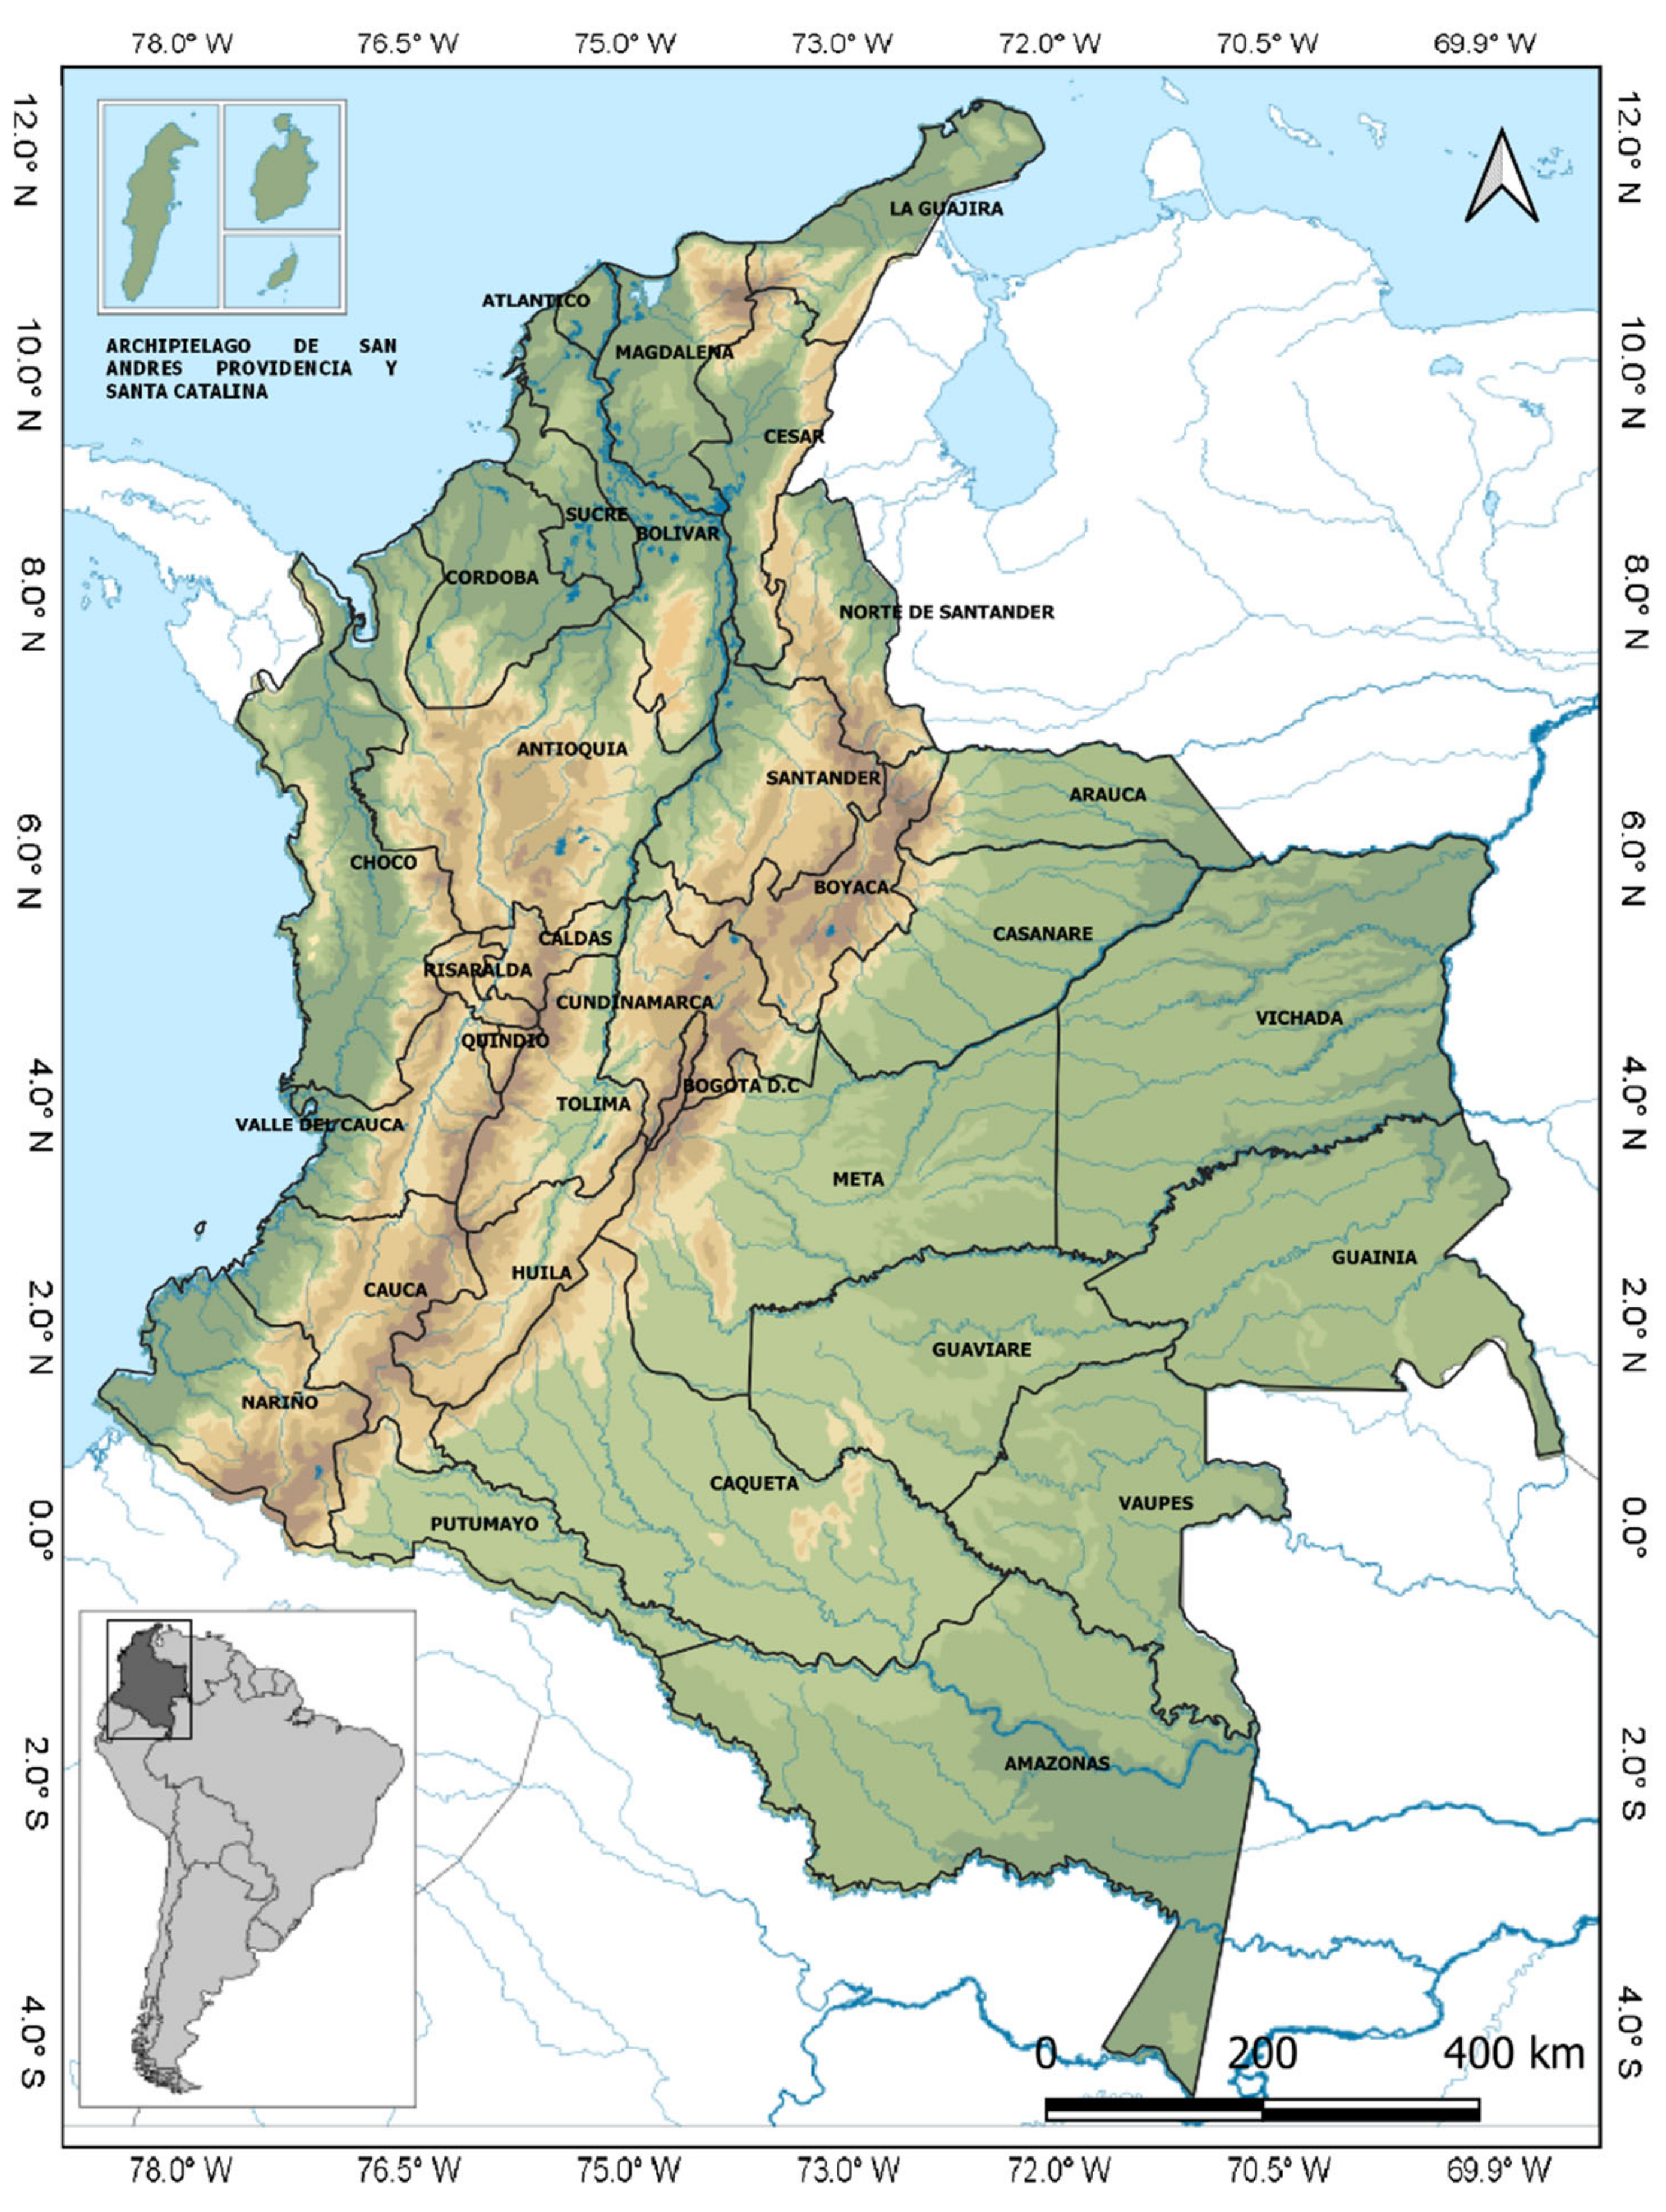
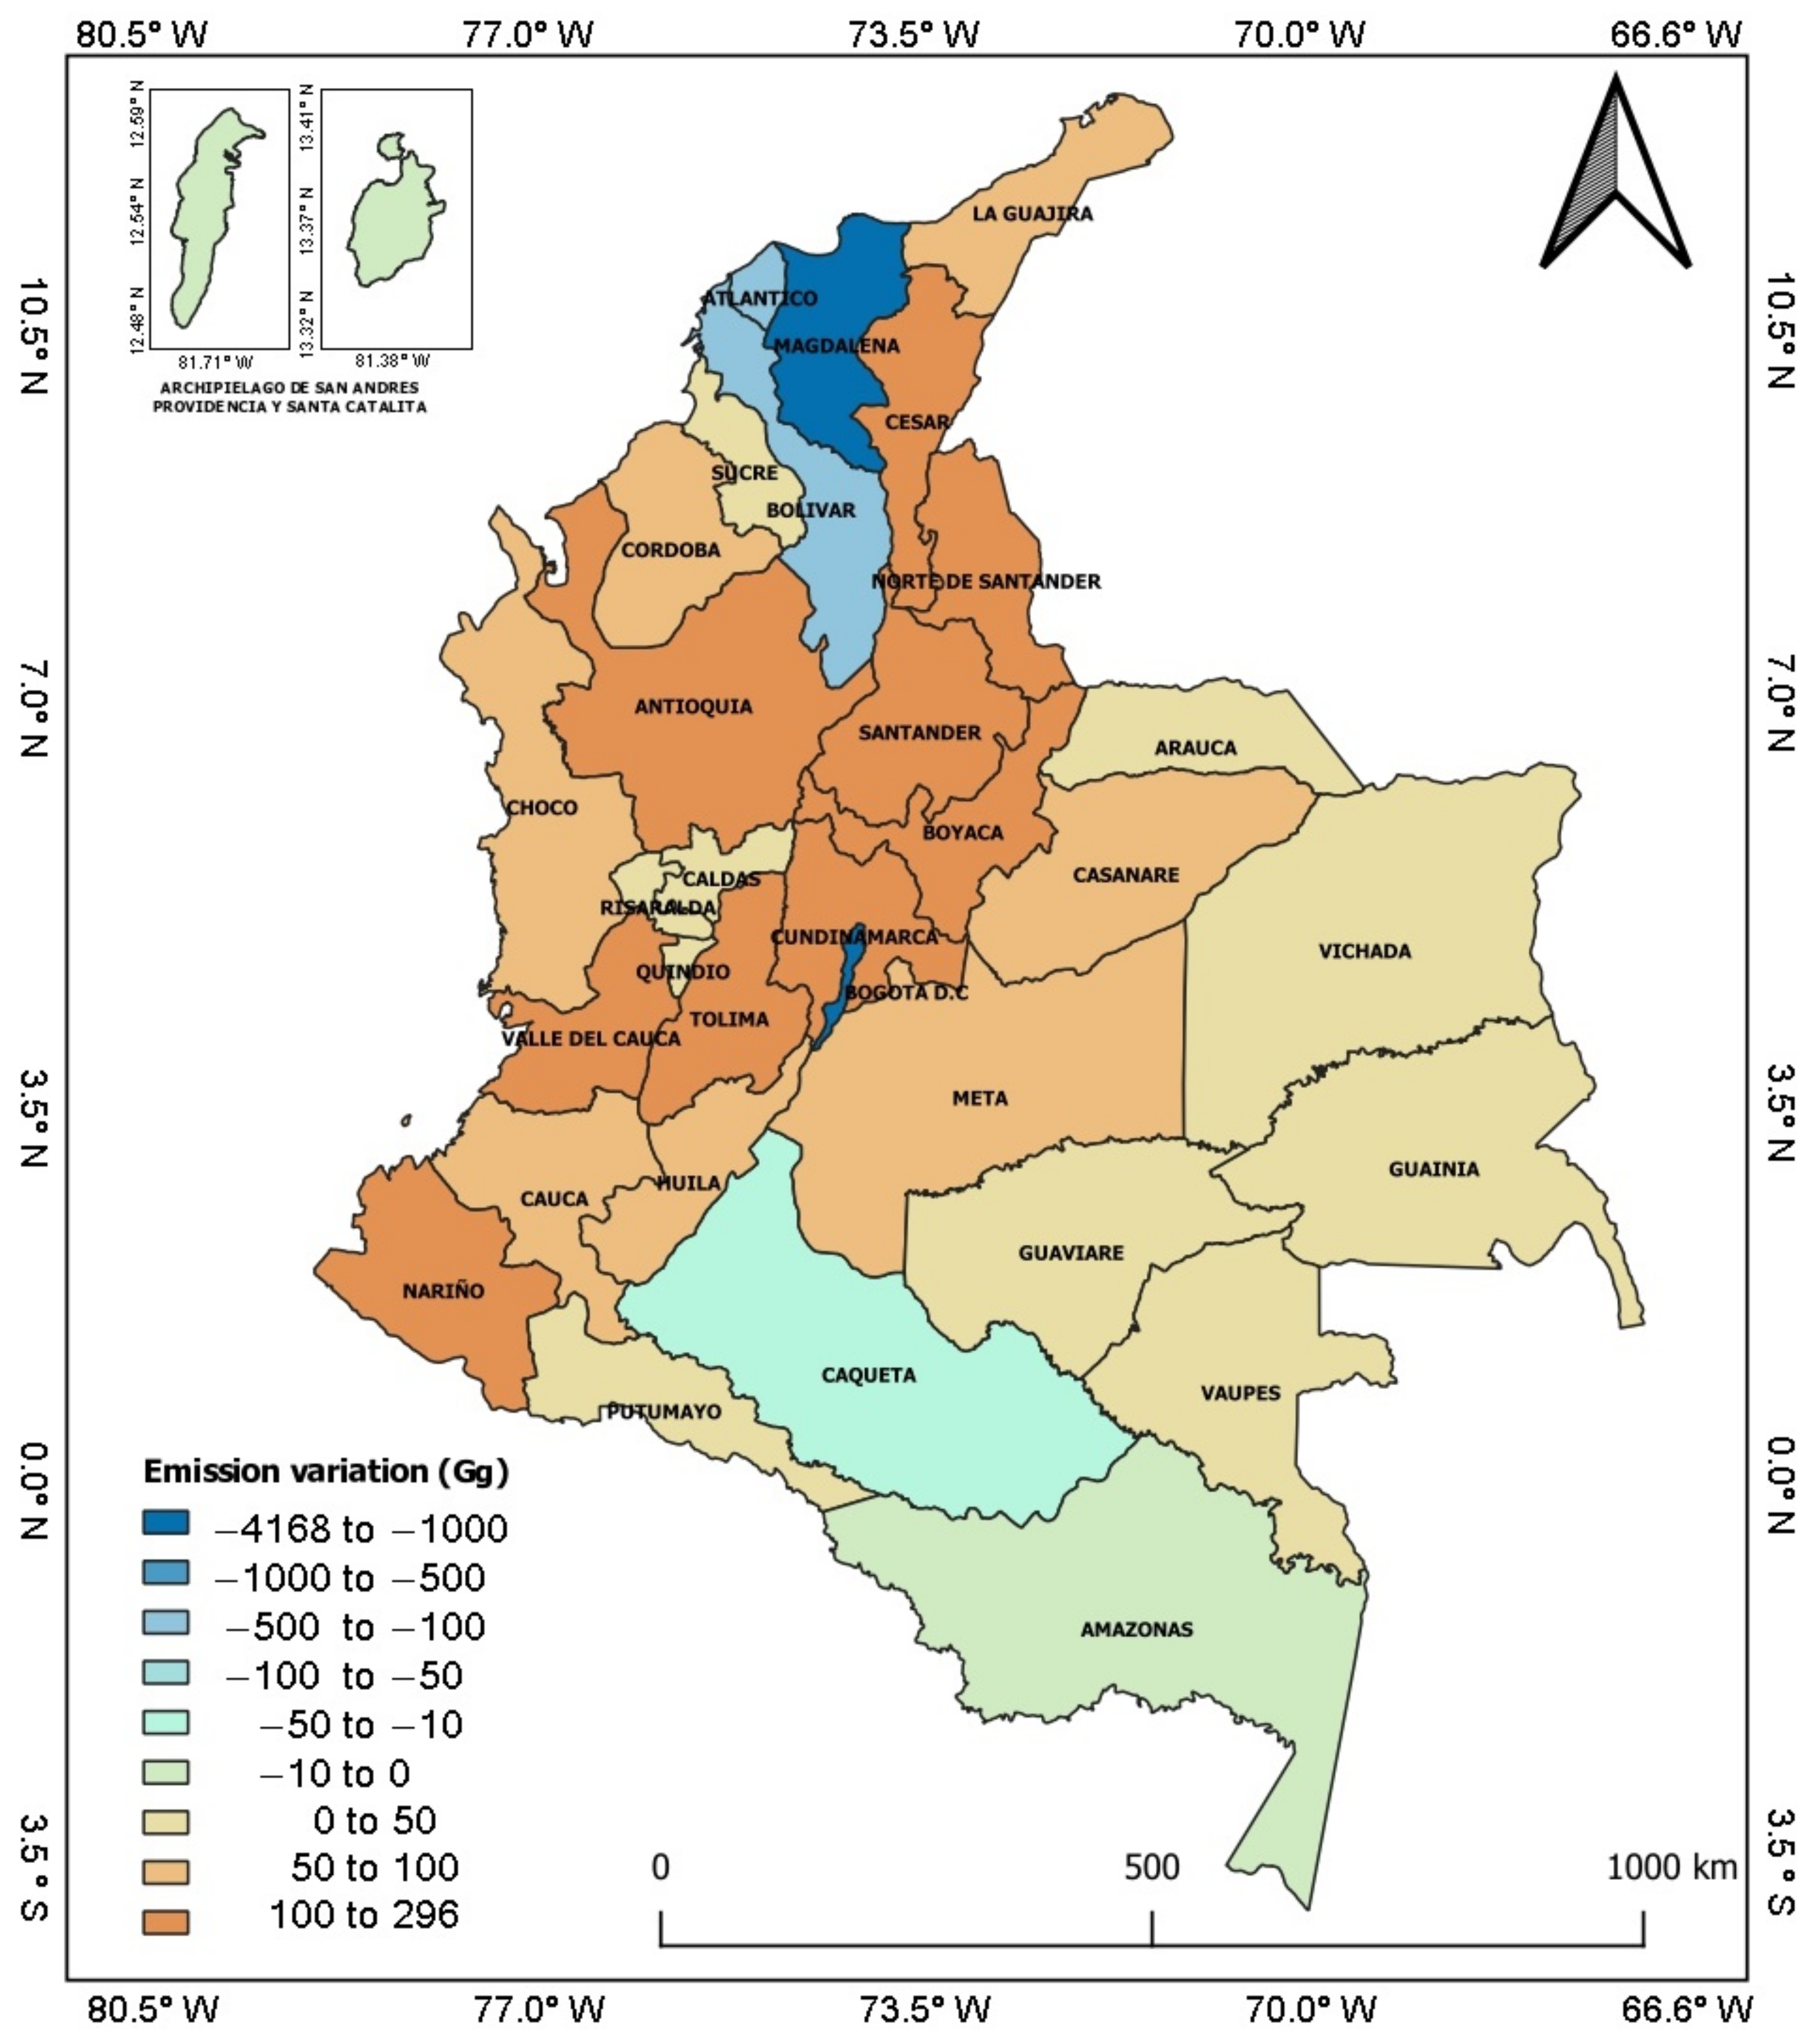
Figure 4 shows the variations in CO2 emissions in Colombia. Territorial divisions that showed the greatest reduction in CO2 emissions were Bogotá D.C. (−4168 Gg CO2), Magdalena (−1381 Gg CO2), Bolívar (−308 Gg CO2), Atlántico (−118 Gg CO2), and Caquetá (−30 Gg CO2). These contrast with positive emission variations in departments such as Valle del Cauca (295 Gg CO2), Cundinamarca (278 Gg CO2), Norte de Santander (248 Gg CO2), Antioquia (232 Gg CO2), and Cesar (209 Gg CO2), during the study period.
Colombian administrative divisions that showed the greatest reduction in CO2 (Bogota, Magdalena, Bolivar, Atlántico and Caquetá) make up 44.5% of the national population. The circulation of people was reduced to avoid contagion by COVID-19. Thus, these territories registered (between March and June 2020) a decrease of 6005 Gg of CO2 compared to the same period in 2018. While Valle del Cauca, Cundinamarca, Norte de Santander, Antioquia, and Cesar departments reported a total increase of 1262 Gg CO2. Overall, the net reduction in Colombia was approximately of 4743 Gg CO2 (Table A4).
Considering the significant emission reduction of CO2 in Bogotá D.C., associated with road transportation and its population density, we also analyzed data from five air quality traffic stations in Bogotá. In addition, we evaluated the concentrations of CO, SO2, NO2 and O3 during the lockdown period ranging from April to June 2020 and compared these to the same period in 2018. We observed significant air quality improvements through a decrease in CO, SO2 and NO2 in areas influenced by vehicular traffic. Drastic reductions in CO (up to −60.85%), SO2 (up to −73.23%), and NO2 (up to −60.60%) concentrations were observed in the urban area during the lockdown, as shown in Table 2. By contrast, an increase of up to 106.32% (in May) in ozone concentrations was observed in urban areas of Bogotá.
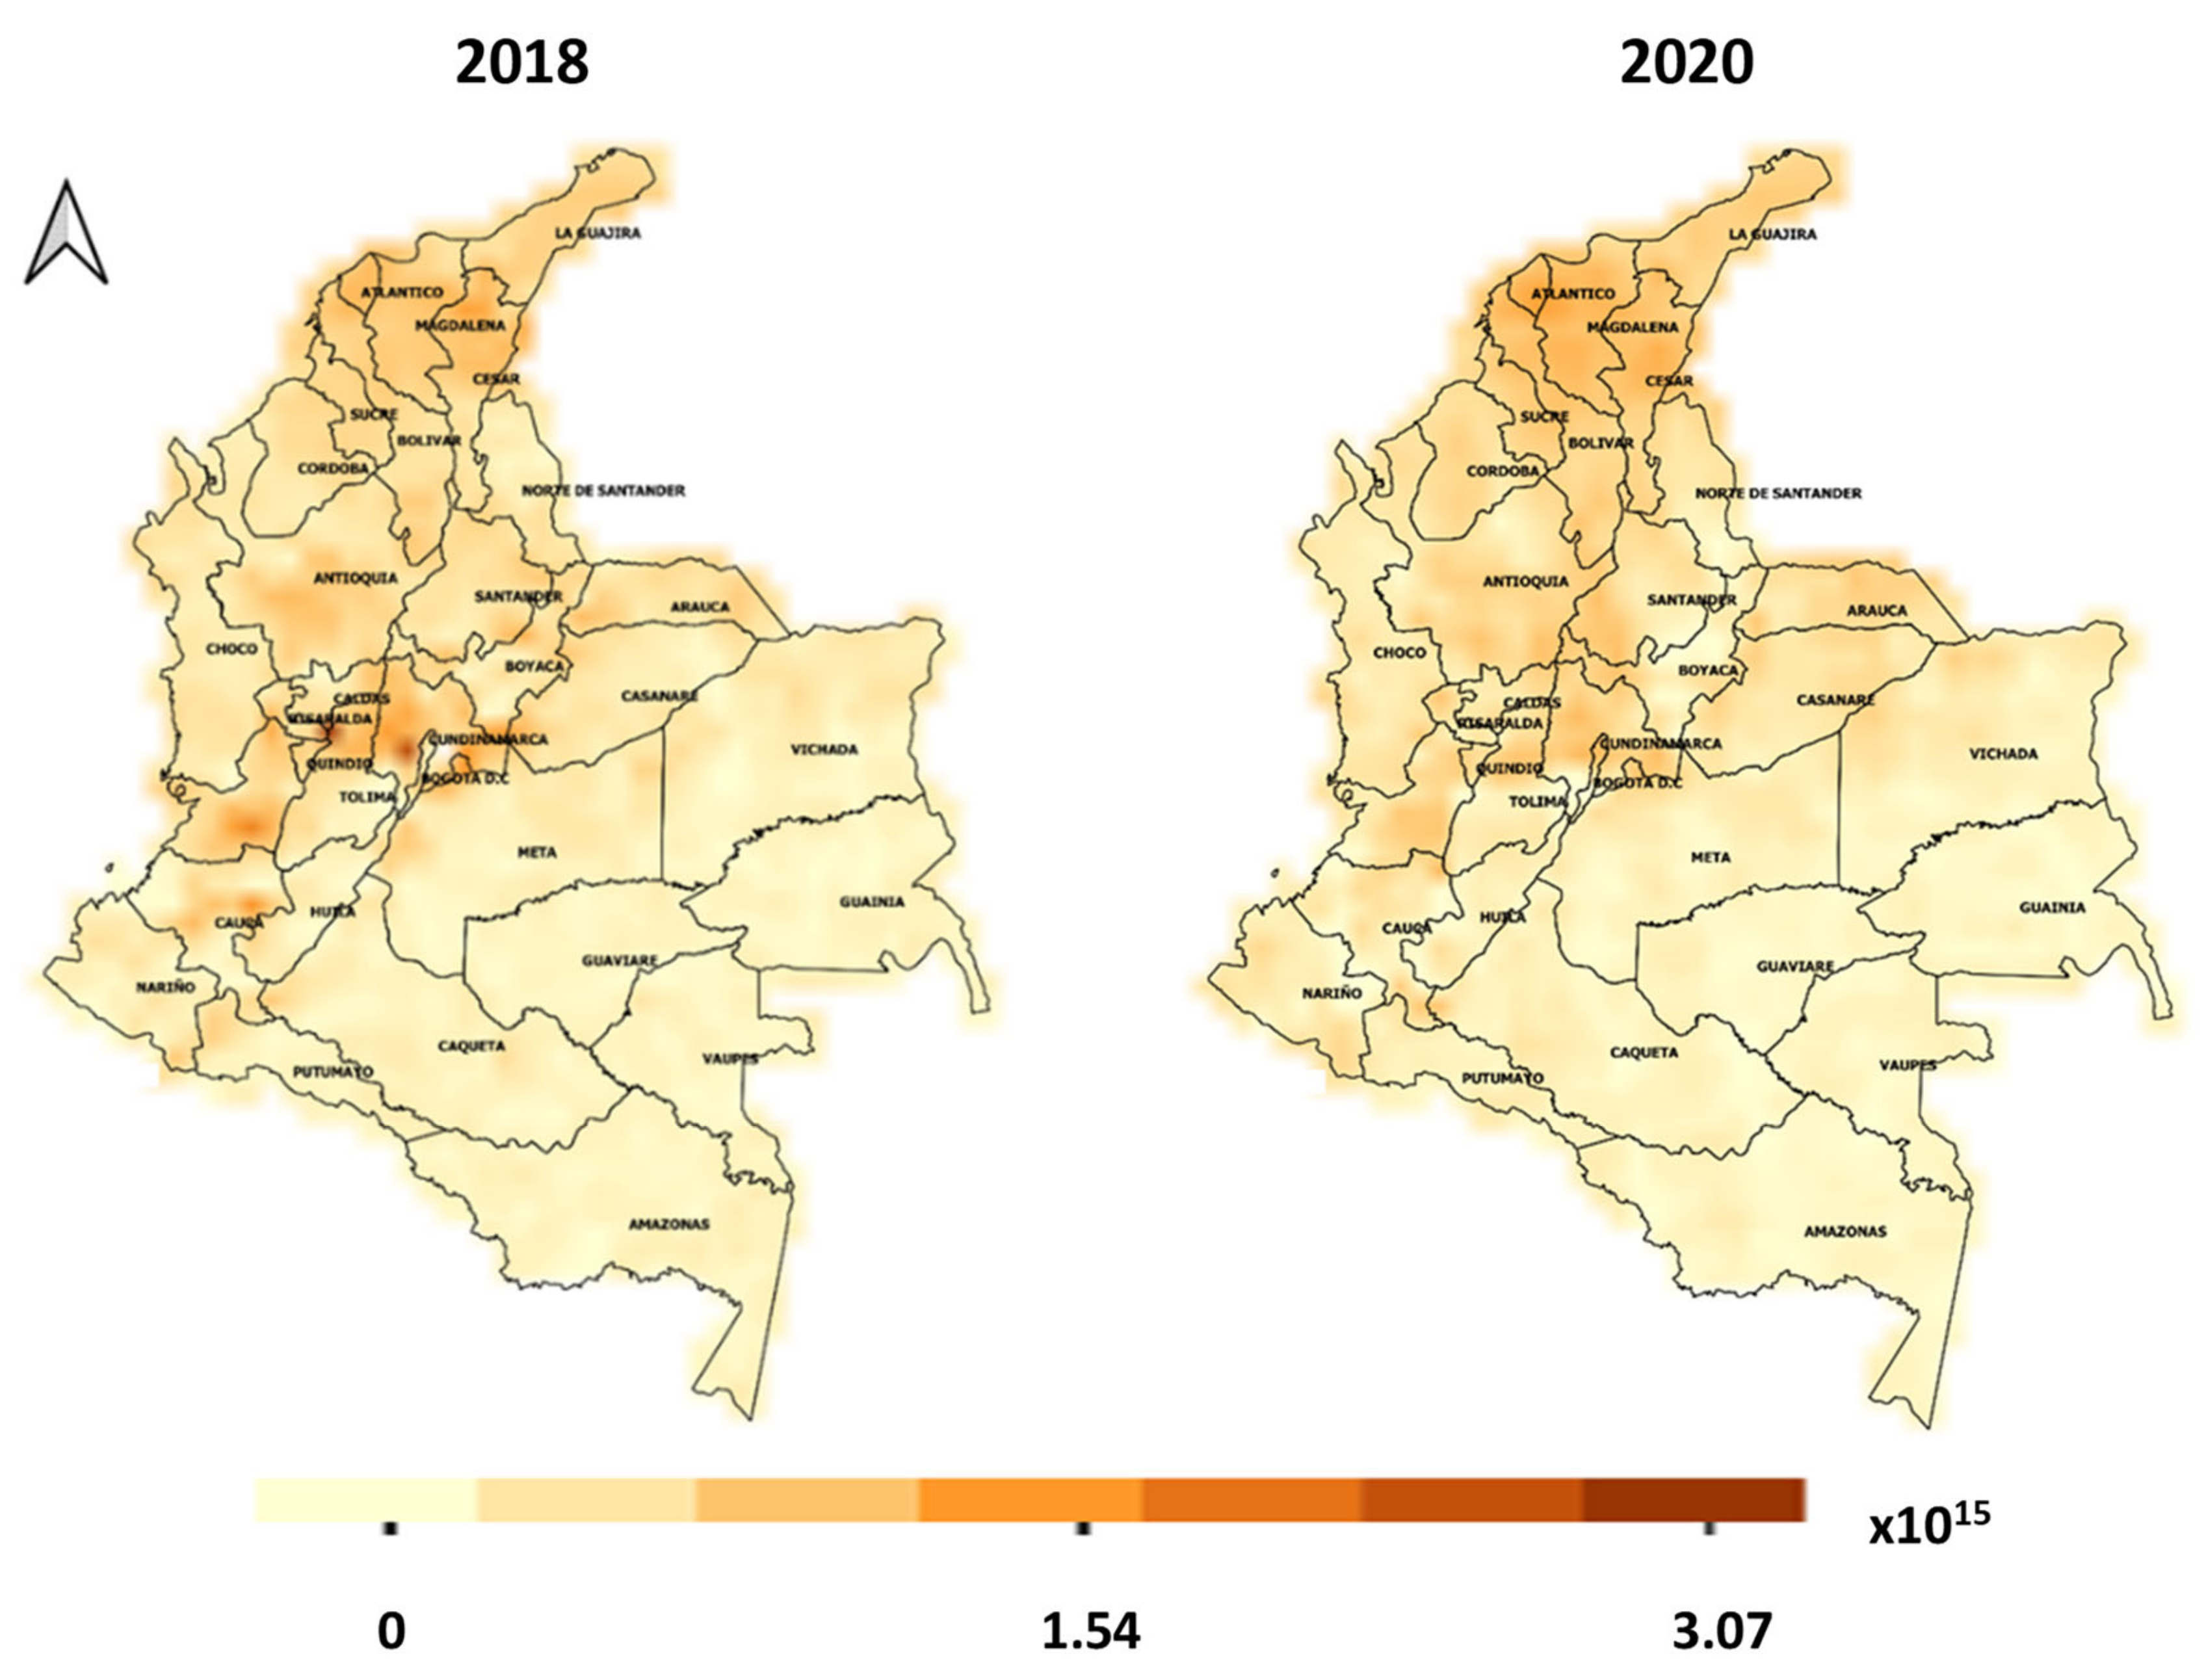
Figure 5 shows NO2 concentration reductions visualized by satellite measurement of background tropospheric data available from OMI. The levels of NO2 over Colombia decreased substantially in the Central Region during the lockdown (April to June 2020) compared to the same period in 2018. Nevertheless, the north region showed an increase in the levels of NO2 over Atlántico, Bolívar, Cesar, La Guajira and Magdalena departments.

4. Discussion

The Colombian government’s restrictions to curb the spread of the COVID-19 pandemic have had a significant impact in several sectors of its economy due to the cessation of some activities [58]. Our results showed reductions for the four groups of pollutants analyzed. In particular, a total of 6010 Gg were eliminated, mainly in seven territorial subdivisions of Colombia where close to 50% of the national population live [59]. One of the positive impacts identified is the emissions reduction from decreased road transport. This is registered by recent studies on air quality improvements carried out in Sao Paulo (Brazil), which reported high reductions of air pollutant concentrations during its partial lockdown due to the decrease in vehicular traffic in analyzed areas [60]. In Barcelona (Spain), the most significant reductions were estimated for pollutants related to traffic emissions [61]. Emissions in China caused by road transport have been affected by the lockdown, generating a reduction of the pollutants associated with this sector [62]. Therefore, the lockdown significantly reduced the air pollution (air pollutants and warming gases) in most cities across the world [26].
Emissions of the four pollutant groups selected in this study depend on the consumption of fossil fuels, which during the lockdown decreased in accordance with the lower vehicle traffic in Colombia. According to Colombian government reports, diesel and gasoline consumption experienced a drop of 50% and 65%, respectively, since mid-March when the lockdown began [63]. Furthermore, the Mercantile Exchange Colombia did not register increases in the consumption data for CNG [50]. This led to a reduction in the estimated emissions of the four pollutant groups studied, with the most variation in GHGs, specifically CO2. It is consistent with recent studies that affirm the first sector with the greatest reduction in global emissions of CO2 during isolation was transportation [64].
The emissions reduction of ozone precursor gases (CO, NMVOC, NOx) registered in this study is consistent with the highest reduction of CO and NO2 that occurred in China due the lockdown measures taken to control the COVID-19 pandemic, which dramatically reduced the number of vehicles on the road, and consequently led to an improvement in air quality due most likely to reduced emissions from some sectors (such as the transportation linked to the NO2 emissions). This occurred chiefly in those provinces with large fleet vehicular and secondary industries, which suggests that the reduced emissions from the transportation and industrial sectors caused a decrease in concentrations of these gases [18]. In addition, it was reported that NO2 emissions were reduced by up to 60% in the city of Santander (Spain) [32]. Other studies found a 20–30% reduction in emissions of NO2 in China, Spain, France, Italy, and the USA due to the lockdown [9] and a drastic reduction of NO (up to −77.3%), NO2 (up to −54.3%), and CO (up to −64.8%) in Sao Paulo (Brazil). In the case of NO, one recent study demonstrated that heavy-duty diesel trucks are the major sources of this pollutant [65]. While the NMVOC emissions reduction was −22% in this study, other research has shown a PM2.5 emissions reduction of −17% [23].
Aerosol reductions (BC, PM10, PM2.5) in our study were consistent with recent studies. Chinese researchers carried out an analysis of PM2.5 data in cities such as Beijing, Shanghai, Guangzhou, and Wuhan during COVID-19 and found a pronounced reduction in air pollution attributed to the reduction of emissions in transportation and industrial sectors [18]. As well, it was observed over the major cities of India, such as Delhi, Mumbai, Hyderabad, Kolkata and Chennai, that a decline in PM2.5 during the lockdown period registered a significant improvement in air quality, which provides important information to the cities’ administration about the implementation of regulations [14]. Other studies conducted during the lockdown suggested the main sources of atmospheric particulate matter PM10 and PM2.5 (include fossil fuel combustion, motor vehicle exhaust emissions, industrial production, secondary particulate matter generation, among others) experienced a significant reduction up to −48.9% in three of China’s provinces [66]. The decline in PM2.5 emissions due to the lockdown to control the spread of SARS-CoV-2 in New York, Los Angeles, Zaragoza, Rome, Dubai, Delhi, Mumbai, Beijing and Shanghai reflected the positive changes that contributed to improve air quality [67]. BC emissions reduction can be attributed to on-road diesel sources [68], so the mitigation of transportation-related BC emissions decreased the global emissions significantly [69].
In this study, acidifying gases (NH3, SO2) also showed a significant emissions reduction, up to −23% for NH3. Other studies found that decreasing emissions were identified in Kannur district, India (−16%), due to a complete shutdown of traffic and industrial activities [70], as NH3 emissions come mainly from heavy-duty diesel vehicles [65]. In addition, SO2 emissions registered a decrease (−19%), which was identified in China as a decrease attributed to lower emissions from traffic and coal combustion [62]. Kannur, India, reported decreased emissions (−62%), and a diurnal variation most pronounced during peak traffic hours was absent during the lockdown owing to the roads being deserted [70].
Figure 4 shows NO2 emissions increased in the northern Colombian region due to events of long-range pollution transport, like regional biomass burning beginning at the end of March, during the lockdown, according to recent studies [33,34]; the air quality improvement shown in this period was partially annulled by the impact of these events.
Despite an emissions reduction in the four pollutant groups selected, an increase of ozone concentration was observed in urban areas of Bogotá. This result was consistent with recent studies, in which Sao Paulo (Brazil) urban areas, highly influenced by road transportation, had an increase of approximately 30% in ozone emissions [60]. The increase of ozone concentration is related to nitrogen monoxide decreases, which may cause a reduction in ozone consumption during the photochemical reactions [61,71]. Moreover, VOCs are often the limiting precursors for O3 production in urban areas [23,31]. O3 levels increased up to 57%, probably due to lower titration of O3 by NO (titration, NO + O3 = NO2 + O2), and the decrease of NOx added to the increase of solar irradiation and temperatures in this period of the year [61]; ozone levels are a major concern in tropical cities, where the temperature and insolation favor the atmospheric processes leading to O3 formation [31]. In this sense, recent studies also showed that reductions in PM2.5 during the COVID-19 pandemic favored the formation of O3 due to a reduction in NOx levels due to reduced transport and an increase in solar radiation [31,72]. On the other hand, the increase in ozone seems to be associated with the decrease in PM2.5, because the sinking of hydroperoxy radicals is slowed down, and therefore, ozone production accelerates [73].
Therefore, these results showed that a reduction in the transport sector contributed to lower emissions of the four pollutant groups (GHGs, ozone precursors, aerosols and acidifying gases), but was not able to cut down ozone concentrations, which leads us to consider other strategies aimed at reducing emissions and the reactivity in the troposphere, such as fuel composition and the control of vehicular emission systems. However, these results indicate that today, more than ever, we must take measures that are focused on individual behavioral changes.
Previous studies recommend high-impact actions for emissions savings >0.8 Mg CO2 eq per year for countries, with potential contribution to systemic change and substantial reduction in annual emissions, such as living without vehicles (2.4 Mg CO2 eq saved per year) and opting for more efficient vehicles or switching to electric cars (1.19 Mg CO2 eq saved per year) [74]. Using the cleanest available technology (electric cars) results in significant reductions. Despite the fact that these actions can be effective, the dependence of people on the use of conventional cars is increasingly noticeable, and it is evidenced by the vehicle fleet records in Colombia. Therefore, governments should consider the adoption of incentives to use fewer polluting vehicles [75]. Also, Wynes et al. [74] show significant emissions reductions through moderate-impact actions (emissions savings 0.2–0.8 Mg CO2 eq per year), such as replacing gasoline-burning vehicles with hybrid cars, and even the use of public transportation, which reduces emissions by 26–76% [76], as well as biking and walking. In Colombia, incentive measures should encourage the use of CNG or hybrid vehicles, as natural gas represents the lowest emissions compared to the other fuels under study.
The changes in air pollution during the COVID-19 lockdown can provide insight into the achievability of air quality improvement when there are significant restrictions in emissions related to the sectors with the greatest impact, thus giving regulators better ability to control air pollution [13]. However, it is likely that most of the changes observed in 2020 in terms of emissions are temporary, since no structural changes are reflected in the economic or transport systems [8]. Moreover, several studies have shown that poor air quality is related to increases in infections and mortality due to COVID-19 [77,78,79,80]. This would indicate that a reduction in emissions and improvements in air quality could also reduce the rate of infection and mortality due to COVID-19 [47,81,82,83,84,85]. Thus, it would be expected that prevention measures (such as social distancing and lockdowns, among others) are actually more profitable than a cure [78,86,87].

5. Conclusions

The effect of restricted human activities due to the COVID-19 pandemic in Colombia since mid-March of 2020 was studied by analyzing emissions variations of eleven criteria pollutants, comparing the first half of 2020 with values obtained in the same period of 2018. In general, the air quality improved during the COVID-19 lockdown, and it was apparently caused by reductions in emissions of some human activities, such as in the transportation sector. Lifting the lockdown and the normalization of activities in the productive sectors may reverse the reduction of global air pollution and even increase air pollution levels if researchers, decision makers, productive sectors, and governments do not articulate efforts to maintain the economy with minimum emissions. COVID-19 has allowed us to analyze the positive impacts of the measures adopted during the lockdown, specifically those that have generated reductions in pollution emissions with evident consequences for the air quality. Thus, it is important to identify the impact of low, moderate and high actions on reducing emissions, with emphasis in the agricultural and energy sectors, and especially the contributions of the transport sub-sector. The circumstances under which we have lived, and the measures adopted during the pandemic, taking in consideration changes for improving environmental conditions, can be the subject of dialogue at the next conference of the United Nations for Climate Change, COP26. Additionally, future work may use more detailed methodologies, such as tier 3 [42,88], to achieve high-resolution spatial inventories in Colombia.

Author Contributions

Conceptualization, Y.C.-C. and T.R.B.-O.; data curation, Y.C.-C., L.C.M.-R. and T.R.B.-O.; formal analysis, Y.C.-C., L.C.M.-R. and T.R.B.-O.; investigation, Y.C.-C., L.C.M.-R. and T.R.B.-O.; methodology, Y.C.-C., L.C.M.-R. and T.R.B.-O.; writing—original draft preparation, Y.C.-C., L.C.M.-R. and T.R.B.-O.; project administration, Y.C.-C.; software, L.C.M.-R.; supervision, Y.C.-C. and T.R.B.-O.; visualization, Y.C.-C., L.C.M.-R. and T.R.B.-O.; writing—original draft, Y.C.-C., L.C.M.-R. and T.R.B.-O.; funding acquisition, Y.C.-C. All authors have read and agreed to the published version of the manuscript.

Funding

The work of T.R.B.-O. was funded in part by the Consejo Nacional de Investigaciones Científicas y Técnicas (CONICET) (National Council for Scientific and Technical Investigations), the National Agency of Scientific and Technological Promotion (ANPCyT) (Agencia Nacional de Promoción Científica y Tecnológica) under project PICT 2016 1115, and Universidad Tecnológica Nacional (UTN) (National Technological University) in Argentina. T.R.B.-O. also thanks GORE-FNDR-V Región in Valparaíso and Programa de Asignación Rápida de Recursos para Proyectos de Investigación Sobre el Coronavirus (COVID−19) (project CO-VID0581-2020), ANID, Ministerio de Ciencia, Tecnología, Conocimiento e Innovación, both in Chile. Y.C.-C. and L.M.R. thank the grants and fund research (AA N° 014-2015, AA N° 031-2016, Res N° 0388-2017, Res N° 0709-2017, Res N° 0119-2018, Res N° 0305-2018 and Res N°0347-2020) from Universidad del Magdalena (Santa Marta, Colombia).

Institutional Review Board Statement

Not applicable.

Informed Consent Statement

Not applicable.

Data Availability Statement

The data presented in this study are available on request from the corresponding authors.

Acknowledgments

We would like to thank Viverlys Diaz-Gutierrez for her help to graph Figure 4. We also would like to thank NASA’s Aura Mission scientific teams, and their associated personnel, for the production of the data used in this research effort.

Conflicts of Interest

The authors declare no conflict of interest.

Appendix A

Table A1. Emission factors by vehicle classification and fuel type.
Vehicle TypeFuelCO2 *CH4 **N2O **CO *NMVOC *NOx *BC *PM2.5 *PM10 *NH3 *SO2 +
(Kg/m3)(kg/TJ)(Kg/m3)(Kg/m3)(Kg/m3)(Kg/m3)(Kg/m3)(Kg/m3)(Kg/m3)(Kg/m3)(kg/TJ)
Personal carsGasoline232925.000.1561.747.396.423 × 10−30.020.020.813.57
Gas Oil26783.900.072.810.5910.950.530.930.930.052.91
CNG197292.000.0660.909.8110.93---0.06-
Light commercial vehiclesGasoline232925.000.14111.9410.729.727 × 10−40.010.010.493.57
Gas Oil26783.900.056.251.3012.600.711.281.280.032.91
CNG197292.00-4.100.149.35-0.010.01--
Heavy duty vehiclesGas Oil26783.900.046.411.6228.200.420.790.790.012.91
CNG197292.00-4.100.199.35-0.010.01--
MotorcyclesGasoline232925.000.0439.5496.584.880.181.621.620.043.57
* EMEP/EEA air pollutant emission inventory guidebook 2019 [42]. ** 2006 IPCC Guidelines for National Greenhouse Inventories [41]. + 2016 UPME FECOC calculator (Colombian fuel emission factors) [43].
Table A2. Fuel sales (m3) by department for March to June 2018 and 2020.
DepartmentsGasolineDiesel
2018202020182020
Amazonas116718081167491
Antioquia154,614195,364154,614206,015
Arauca245613,591245611,024
San Andrés y Providencia184423971844621
Atlántico73,85546,49973,85553,498
Bogotá D.C.1,112,981184,188892,924144,130
Bolívar118,59745,119124,42873,072
Boyacá25,13239,38321,61953,587
Caldas17,59624,28011,60619,639
Caquetá868014,16722,5706439
Casanare775115,88312,36537,034
Cauca18,29941,41311,31722,147
Cesar30,87159,56559,162112,311
Choco660619,768509115,555
Córdoba22,81337,64616,22636,267
Cundinamarca74,08988,49174,260165,606
Guainía9563576670696
Guaviare2257427013142293
Huila21,20034,23616,06726,438
La Guajira378131,62910,08016,893
Magdalena268,51722,459320,75718,756
Meta19,92434,32022,96747,797
Nariño33,58172,83621,19146,554
Norte de Santander14,74468,93821,41167,054
Putumayo730417,83860647558
Quindío11,74116,622708313,289
Risaralda20,31629,55414,63522,211
Santander45,70063,67542,61865,638
Sucre11,01418,367612214,021
Tolima28,85538,16026,87660,583
Valle del Cauca106,590143,53284,913163,125
Vaupés18345824493
Vichada57228776361887
Figure A1. Fuel consumption from March to June 2018 and 2020. GNG sales data was only available at the national level.
Applsci 11 01458 g0a1
Table A3. Equipment used by BAQMD to monitor air quality in Bogota city [54]. Note that only the equipment that measures the parameters (pollutants) used in this comparison is shown.
PollutantsMeasurement Principle UsedEquipment
COInfrared absorption spectrophotometryCO Thermo Scientific 48i
SO2Ultraviolet pulsed fluorescenceSO2 Thermo Scientific 43i
NO2ChemiluminescenceNOx Ecotech 9841
O3Absorption spectrophotometry in the ultravioletO3 Ecotech 9841
Table A4. CO2 emissions (Gg) by departments from March to June 2018 and 2020.
Departments20182020
Amazonas5.845.53
Antioquia774.151006.71
Arauca12.3061.18
San Andrés y Providencia9.237.25
Atlántico369.79251.56
Bogotá D.C.4983.45814.97
Bolívar609.43300.76
Boyacá116.43235.23
Caldas72.06109.14
Caquetá80.6550.24
Casanare51.17136.16
Cauca72.93155.77
Cesar230.33439.49
Choco29.0287.70
Córdoba96.59184.80
Cundinamarca371.42649.57
Guainía4.0210.19
Guaviare8.7816.09
Huila92.40150.54
La Guajira35.80118.91
Magdalena1484.36102.54
Meta107.91207.93
Nariño134.96294.31
Norte de Santander91.67340.13
Putumayo33.2561.79
Quindío46.3174.30
Risaralda86.51128.31
Santander220.57324.08
Sucre42.0580.33
Tolima139.18251.11
Valle del Cauca475.65771.13
Vaupés1.081.31
Vichada3.0411.75

References

  1. Aylward, B.; Liang, W. Report of the WHO-China Joint Mission on Coronavirus Disease 2019 (COVID-19). WHO-China Jt. Mission Coronavirus Dis. 2020, 2019, 16–24. [Google Scholar]
  2. World Health Organization (WHO) Coronavirus disease 2019 Situation Report 51 11th March 2020. World Health Organ. 2020, 2019, 2633. [CrossRef] [Green Version]
  3. Wang, C.; Horby, P.W.; Hayden, F.G.; Gao, G.F. A novel coronavirus outbreak of global health concern. Lancet 2020, 395, 470–473. [Google Scholar] [CrossRef] [Green Version]
  4. JHU Coronavirus Resources Center. Available online: https://coronavirus.jhu.edu/map.html (accessed on 25 April 2020).
  5. Wilder-Smith, A.; Freedman, D.O. Isolation, quarantine, social distancing and community containment: Pivotal role for old-style public health measures in the novel coronavirus (2019-nCoV) outbreak. J. Travel Med. 2020, 27, taaa020. [Google Scholar] [CrossRef] [PubMed]
  6. McKibbin, W.; Fernando, R. The Global Macroeconomic Impacts of COVID-19. Brook. Inst. 2020, 1–43. [Google Scholar] [CrossRef] [Green Version]
  7. May, B. World Economic Prospects Monthly. Econ. Outlook 2020, 44, 1–33. [Google Scholar] [CrossRef] [Green Version]
  8. Le Quéré, C.; Jackson, R.B.; Jones, M.W.; Smith, A.J.P.; Abernethy, S.; Andrew, R.M.; De-Gol, A.J.; Willis, D.R.; Shan, Y.; Canadell, J.G.; et al. Temporary reduction in daily global CO2 emissions during the COVID-19 forced confinement. Nat. Clim. Chang. 2020, 10, 647–654. [Google Scholar] [CrossRef]
  9. Muhammad, S.; Long, X.; Salman, M. COVID-19 pandemic and environmental pollution: A blessing in disguise? Sci. Total Environ. 2020, 728, 138820. [Google Scholar] [CrossRef]
  10. IPCC Proposed outline of the special report in 2018 on the impacts of global warming of 1.5 °C above pre-industrial levels and related global greenhouse gas emission pathways, in the context of strengthening the global response to the threat of climate cha. Ipcc Sr15 2018, 2, 17–20.
  11. Dantas, G.; Siciliano, B.; França, B.B.; da Silva, C.M.; Arbilla, G. The impact of COVID-19 partial lockdown on the air quality of the city of Rio de Janeiro, Brazil. Sci. Total Environ. 2020. [Google Scholar] [CrossRef]
  12. O’Reilly, K.M.; Auzenbergs, M.; Jafari, Y.; Liu, Y.; Flasche, S.; Lowe, R. Effective transmission across the globe: The role of climate in COVID-19 mitigation strategies. Lancet Planet. Health 2020, 4, e172. [Google Scholar] [CrossRef]
  13. Sharma, S.; Zhang, M.; Anshika; Gao, J.; Zhang, H.; Kota, S.H. Effect of restricted emissions during COVID-19 on air quality in India. Sci. Total Environ. 2020. [Google Scholar] [CrossRef] [PubMed]
  14. Singh, R.P.; Chauhan, A. Impact of lockdown on air quality in India during COVID-19 pandemic. Air Qual. Atmos. Health 2020, 13, 921–928. [Google Scholar] [CrossRef] [PubMed]
  15. Pant, P.; Harrison, R.M. Estimation of the contribution of road traffic emissions to particulate matter concentrations from field measurements: A review. Atmos. Environ. 2013, 77, 78–97. [Google Scholar] [CrossRef]
  16. Ly, B.T.; Kajii, Y.; Nguyen, T.Y.L.; Shoji, K.; Van, D.A.; Do, T.N.N.; Nghiem, T.D.; Sakamoto, Y. Characteristics of roadside volatile organic compounds in an urban area dominated by gasoline vehicles, a case study in Hanoi. Chemosphere 2020, 254, 126749. [Google Scholar] [CrossRef]
  17. Fameli, K.M.; Kotrikla, A.M.; Psanis, C.; Biskos, G.; Polydoropoulou, A. Estimation of the emissions by transport in two port cities of the northeastern Mediterranean, Greece. Environ. Pollut. 2020, 257, 113598. [Google Scholar] [CrossRef]
  18. Wang, Y.; Yuan, Y.; Wang, Q.; Liu, C.; Zhi, Q.; Cao, J. Changes in air quality related to the control of coronavirus in China: Implications for traffic and industrial emissions. Sci. Total Environ. 2020, 731, 139133. [Google Scholar] [CrossRef]
  19. Tournadre, B.; Chelin, P.; Ray, M.; Cuesta, J.; Kutzner, R.D.; Landsheere, X.; Fortems-Cheiney, A.; Flaud, J.-M.; Hase, F.; Blumenstock, T.; et al. Atmospheric ammonia (NH3) over the Paris megacity: 9 years of total column observations from ground-based infrared remote sensing. Atmos. Meas. Tech. 2020, 13, 3923–3937. [Google Scholar] [CrossRef]
  20. Puliafito, S.E.; Bolaño-Ortiz, T.; Berná, L.; Pascual Flores, R. High resolution inventory of atmospheric emissions from livestock production, agriculture, and biomass burning sectors of Argentina. Atmos. Environ. 2020, 223, 117248. [Google Scholar] [CrossRef]
  21. Janssens-maenhout, G. Supplement of EDGAR v4.3.2 Global Atlas of the three major greenhouse gas emissions for the period 1970–2012. Earth Syst. Sci. Data 2019, 11, 959–1002. [Google Scholar] [CrossRef] [Green Version]
  22. Janssens-Maenhout, G.; Crippa, M.; Guizzardi, D.; Dentener, F.; Muntean, M.; Pouliot, G.; Keating, T.; Zhang, Q.; Kurokawa, J.; Wankmüller, R.; et al. HTAP-v2.2: A mosaic of regional and global emission grid maps for 2008 and 2010 to study hemispheric transport of air pollution. Atmos. Chem. Phys. 2015, 15, 11411–11432. [Google Scholar] [CrossRef] [Green Version]
  23. Huang, X.; Zhang, Y.; Wang, Y.; Ou, Y.; Chen, D.; Pei, C.; Huang, Z.; Zhang, Z.; Liu, T.; Luo, S.; et al. Evaluating the effectiveness of multiple emission control measures on reducing volatile organic compounds in ambient air based on observational data: A case study during the 2010 Guangzhou Asian Games. Sci. Total Environ. 2020, 723, 138171. [Google Scholar] [CrossRef] [PubMed]
  24. Franco, J.F.; Pacheco, J.; Belalcázar, L.C.; Behrentz, E. Characterization and source identification of VOC species in Bogotá, Colombia. Atmósfera 2015, 28, 1–11. [Google Scholar] [CrossRef]
  25. Xue, R.; Wang, S.; Li, D.; Zou, Z.; Chan, K.L.; Valks, P.; Saiz-Lopez, A.; Zhou, B. Spatio-temporal variations in NO2 and SO2 over Shanghai and Chongming Eco-Island measured by Ozone Monitoring Instrument (OMI) during 2008–2017. J. Clean. Prod. 2020, 258, 120563. [Google Scholar] [CrossRef]
  26. Anjum, N. Good in The Worst: COVID-19 Restrictions and Ease in Global Air Pollution. Preprints 2020. [Google Scholar] [CrossRef]
  27. Kheirbek, I.; Haney, J.; Douglas, S.; Ito, K.; Matte, T. The contribution of motor vehicle emissions to ambient fine particulate matter public health impacts in New York City: A health burden assessment. Environ. Health A Glob. Access Sci. Source 2016, 15, 89. [Google Scholar] [CrossRef] [Green Version]
  28. Chang, Y.; Zou, Z.; Deng, C.; Huang, K.; Collett, J.L.; Lin, J.; Zhuang, G. The importance of vehicle emissions as a source of atmospheric ammonia in the megacity of Shanghai. Atmos. Chem. Phys. 2016, 16, 3577–3594. [Google Scholar] [CrossRef] [Green Version]
  29. Huang, Y.; Zhou, J.L.; Yu, Y.; Mok, W.; Lee, C.F.C. Uncertainty in the Impact of the COVID-19 Pandemic on Air Quality in Hong Kong, China. Atmosphere 2020, 11, 914. [Google Scholar] [CrossRef]
  30. Musselwhite, C.; Avineri, E.; Susilo, Y. Editorial JTH 16 –The Coronavirus Disease COVID-19 and implications for transport and health. J. Transp. Health 2020, 16, 4–7. [Google Scholar] [CrossRef]
  31. Siciliano, B.; Dantas, G.; Cleyton, M.; Arbilla, G. Increased ozone levels during the COVID-19 lockdown: Analysis for the city of Rio de Janeiro, Brazil. Sci. Total Environ. 2020, 737, 139765. [Google Scholar] [CrossRef]
  32. Aloi, A.; Alonso, B.; Benavente, J.; Cordera, R.; Echániz, E.; González, F.; Ladisa, C.; Lezama-Romanelli, R.; López-Parra, Á.; Mazzei, V.; et al. Effects of the COVID-19 lockdown on urban mobility: Empirical evidence from the city of Santander (Spain). Sustainbility 2020, 12, 3870. [Google Scholar] [CrossRef]
  33. Mendez-Espinosa, J.F.; Rojas, N.Y.; Vargas, J.; Pachón, J.E.; Belalcazar, L.C.; Ramírez, O. Air quality variations in Northern South America during the COVID-19 lockdown. Sci. Total Environ. 2020, 749, 141621. [Google Scholar] [CrossRef] [PubMed]
  34. Arregocés, H.A.; Rojano, R.; Restrepo, G. Impact of lockdown on particulate matter concentrations in Colombia during the COVID-19 pandemic. Sci. Total Environ. 2020, 142874. [Google Scholar] [CrossRef] [PubMed]
  35. DANE Departamento Administrativo Nacional de Estadística (DANE). Available online: https://www.dane.gov.co/index.php/estadisticas-por-tema/demografia-y-poblacion/proyecciones-de-poblacion (accessed on 18 January 2021).
  36. Economics, T. Colombia—Economic Forecasts—2020–2022 Outlook. Available online: https://tradingeconomics.com/colombia/forecast (accessed on 30 July 2020).
  37. Runt Runt—Registro Único Nacional de Tránsito. Available online: https://www.runt.com.co/runt-en-cifras/parque-automotor (accessed on 1 July 2020).
  38. IDEAM. Inventario Nacional y Departamental de Gases Efecto Invernadero. Tercera Comunicación Nacional de Cambio Climático; IDEAM: Bogota, Colombia, 2016; ISBN 9789588971254. [Google Scholar]
  39. Hao, H.; Wang, H.; Ouyang, M. Fuel conservation and GHG (Greenhouse gas) emissions mitigation scenarios for China’s passenger vehicle fleet. Energy 2011, 36, 6520–6528. [Google Scholar] [CrossRef]
  40. Bebkiewicz, K.; Chłopek, Z.; Lasocki, J.; Szczepański, K.; Zimakowska-Laskowska, M. Analysis of emission of greenhouse gases from road transport in Poland between 1990 and 2017. Atmosphere 2020, 11, 387. [Google Scholar] [CrossRef] [Green Version]
  41. Eggleston, H.S.; Miwa, K.; Srivastava, N.; Tanabe, K. IPCC 2006 IPCC Guidelines for National Greenhouse Inventories—A primer, Prepared by the National Greenhouse Gas Inventories Programme; Iges: Hayama, Japan, 2006; ISBN 4-88788-032-4. [Google Scholar]
  42. EMEP. EEA Report No 13/2019; EMEP: Geneva, Switzerland, 2019; ISBN 978-92-9480-098-5. [Google Scholar]
  43. FECOC Unidad de Planeación Minero Energética—UPME. Available online: http://www.upme.gov.co/Calculadora_Emisiones/aplicacion/calculadora.html (accessed on 26 July 2020).
  44. Puliafito, S.E.; Allende, D.G.; Castesana, P.S.; Ruggeri, M.F. High-resolution atmospheric emission inventory of the argentine energy sector. Comparison with edgar global emission database. Heliyon 2017, 3, 489. [Google Scholar] [CrossRef] [PubMed] [Green Version]
  45. Puliafito, S.E.; Allende, D.; Pinto, S.; Castesana, P. High resolution inventory of GHG emissions of the road transport sector in Argentina. Atmos. Environ. 2015, 101, 303–311. [Google Scholar] [CrossRef]
  46. Puliafito, S.E.; Bolaño-Ortiz, T.R.; Berná Peña, L.L.; Pascual-Flores, R.M. Dataset supporting the estimation and analysis of high spatial resolution inventories of atmospheric emissions from several sectors in Argentina. Data Br. 2020, 29, 105281. [Google Scholar] [CrossRef]
  47. Bolaño-Ortiz, T.R.; Puliafito, S.E.; Berná-Peña, L.L.; Pascual-Flores, R.M.; Urquiza, J.; Camargo-Caicedo, Y. Atmospheric Emission Changes and Their Economic Impacts during the COVID-19 Pandemic Lockdown in Argentina. Sustainability 2020, 12, 8661. [Google Scholar]
  48. Ministry of Mines and Energy Information System of Liquid Fuels of Colombia-SICOM. Available online: https://www.sicom.gov.co/index.php/boletin-estadistico (accessed on 18 January 2021).
  49. Ministry of Mines and Energy Information System of Liquid Fuels of Colombia-SICOM. Available online: https://www.sicom.gov.co/sicom/identificacionAction.do?method=pRedirectHttps (accessed on 1 July 2020).
  50. GMGNC Manager of the Natural Gas Market in Colombia-GMGNC. Available online: https://www.bmcbec.com.co/informes/informes-mensuales (accessed on 20 November 2020).
  51. UPME Plan de Acción Indicativo de Eficiencia Energética 2017–2022; Bogotá, 2016; pp.1–157. Available online: https://www1.upme.gov.co/DemandaEnergetica/MarcoNormatividad/PAI_PROURE_2017-2022.pdf (accessed on 20 July 2020).
  52. PROMIGAS Promigas S.A. E.S.P. Available online: http://www.promigas.com/Es/Noticias/Paginas/Revista-Magasin/Edicion-27/Pagina-69.aspx (accessed on 23 July 2020).
  53. Myhre, G.; Shindell, D.; Bréon, F.-M.F.-M.; Collins, W.; Fuglestvedt, J.; Huang, J.; Koch, D.; Lamarque, J.-F.J.-F.; Lee, D.; Mendoza, B.; et al. Anthropogenic and Natural Radiative Forcing: Supplementary Material. Clim. Chang. 2013. [Google Scholar] [CrossRef]
  54. Secretary of Environment Bogotá, Bogotá Air Quality Monitoring Network—RMCAB. Available online: http://201.245.192.252:81/home/map (accessed on 4 September 2020).
  55. OMI National Aeronautics and Space Administration. Available online: https://www.nasa.gov/mission_pages/aura/spacecraft/omi.html (accessed on 24 July 2020).
  56. Acker, J.G.; Leptoukh Eos, G. Trans. AGU. In Proceedings of the Online Analysis Enhances Use of NASA Earth Science Data; AGU: Washington, DC, USA, 2007; pp. 14–17. [Google Scholar]
  57. De Souza, C.D.R.; Silva, S.D.; Da Silva, M.A.V.; de D’Agosto, M.A.; Barboza, A.P. Inventory of conventional air pollutants emissions from road transportation for the state of Rio de Janeiro. Energy Policy 2013, 53, 125–135. [Google Scholar] [CrossRef]
  58. Undp Undp in Latin America and the Caribbean. Available online: https://www.latinamerica.undp.org/content/rblac/en/home/library/crisis_prevention_and_recovery/social-and-economic-impact-of-covid-19-and-policy-options-in-arg.html (accessed on 29 July 2020).
  59. DANE Statistics by Demography and Population in Colombia. Available online: https://www.dane.gov.co/index.php/estadisticas-por-tema/demografia-y-poblacion (accessed on 19 January 2021).
  60. Nakada, L.Y.K.; Urban, R.C. COVID-19 pandemic: Impacts on the air quality during the partial lockdown in São Paulo state, Brazil. Sci. Total Environ. 2020, 139087. [Google Scholar] [CrossRef] [PubMed]
  61. Tobías, A.; Carnerero, C.; Reche, C.; Massagué, J.; Via, M.; Minguillón, M.C.; Alastuey, A.; Querol, X. Changes in air quality during the lockdown in Barcelona (Spain) one month into the SARS-CoV-2 epidemic. Sci. Total Environ. 2020, 726, 138540. [Google Scholar] [CrossRef] [PubMed]
  62. Silver, B.; He, X.; Arnold, S.R.; Spracklen, D.V. The impact of COVID-19 control measures on air quality in China. Environ. Res. Lett. 2020, 15. [Google Scholar] [CrossRef]
  63. Dinero Dinero. Available online: https://www.dinero.com/pais/articulo/consumo-de-gasolina-en-colombia-en-junio-de-2020/290275 (accessed on 24 July 2020).
  64. Liu, Z.; Ciais, P.; Deng, Z.; Lei, R.; Davis, S.J.; Feng, S.; Zheng, B.; Cui, D.; Dou, X.; Zhu, B.; et al. Near-real-time monitoring of global CO2 emissions reveals the effects of the COVID-19 pandemic. Nat. Commun. 2020, 11, 5172. [Google Scholar] [CrossRef]
  65. He, L.; Zhang, S.; Hu, J.; Li, Z.; Zheng, X.; Cao, Y.; Xu, G.; Yan, M.; Wu, Y. On-road emission measurements of reactive nitrogen compounds from heavy-duty diesel trucks in China. Environ. Pollut. 2020, 262, 114280. [Google Scholar] [CrossRef]
  66. Xu, K.; Cui, K.; Young, L.H.; Wang, Y.F.; Hsieh, Y.K.; Wan, S.; Zhang, J. Air quality index, indicatory air pollutants and impact of covid-19 event on the air quality near central china. Aerosol Air Qual. Res. 2020, 20, 1204–1221. [Google Scholar] [CrossRef] [Green Version]
  67. Chauhan, A.; Singh, R.P. Decline in PM2.5 concentrations over major cities around the world associated with COVID-19. Environ. Res. 2020, 187, 109634. [Google Scholar] [CrossRef]
  68. de Miranda, R.M.; Perez-Martinez, P.J.; de Fatima Andrade, M.; Ribeiro, F.N.D. Relationship between black carbon (BC) and heavy traffic in São Paulo, Brazil. Transp. Res. Part D Transp. Environ. 2019, 68, 84–98. [Google Scholar] [CrossRef]
  69. Chen, W.T.; Lee, Y.H.; Adams, P.J.; Nenes, A.; Seinfeld, J.H. Will black carbon mitigation dampen aerosol indirect forcing? Geophys. Res. Lett. 2010, 37, 1–5. [Google Scholar] [CrossRef] [Green Version]
  70. Resmi, C.T.; Nishanth, T.; Satheesh Kumar, M.K.; Manoj, M.G.; Balachandramohan, M.; Valsaraj, K.T. Air quality improvement during triple-lockdown in the coastal city of Kannur, Kerala to combat Covid-19 transmission. PeerJ 2020, 8, e9642. [Google Scholar] [CrossRef] [PubMed]
  71. De Fatima, M.; Kumar, P.; Dias, E.; Freitas, D.; Yuri, R.; Martins, J.; Martins, L.D.; Nogueira, T.; Perez-martinez, P.; Maura, R.; et al. ~ o Paulo: Evolution over the last 30 Air quality in the megacity of S a years and future perspectives. Atmos. Environ. 2017, 159, 66–82. [Google Scholar] [CrossRef] [Green Version]
  72. Sicard, P.; De Marco, A.; Agathokleous, E.; Feng, Z.; Xu, X.; Paoletti, E.; Rodriguez, J.J.D.; Calatayud, V. Amplified ozone pollution in cities during the COVID-19 lockdown. Sci. Total Environ. 2020, 735, 139542. [Google Scholar] [CrossRef] [PubMed]
  73. Li, K.; Jacob, D.J.; Liao, H.; Shen, L.; Zhang, Q.; Bates, K.H. Anthropogenic drivers of 2013–2017 trends in summer surface ozone in China. Proc. Natl. Acad. Sci. USA 2019, 116, 422–427. [Google Scholar] [CrossRef] [Green Version]
  74. Wynes, S.; Nicholas, K.A. The climate mitigation gap: Education and government recommendations miss the most effective individual actions. Environ. Res. Lett. 2017, 12, 074024. [Google Scholar] [CrossRef] [Green Version]
  75. Andrade-Castañeda, H.J.; Arteaga-Céspedes, C.C.; Segura-Madrigal, M.A. Emisión de gases de efecto invernadero por uso de combustibles fósiles en Ibagué, Tolima (Colombia). Corpoica Cienc. y Tecnol. Agropecu. 2017, 18, 103–112. [Google Scholar] [CrossRef] [Green Version]
  76. Chester, M.; Pincetl, S.; Elizabeth, Z.; Eisenstein, W.; Matute, J. Infrastructure and automobile shifts: Positioning transit to reduce life-cycle environmental impacts for urban sustainability goals. Environ. Res. Lett. 2013, 8. [Google Scholar] [CrossRef]
  77. Anderson, R.M.; Heesterbeek, H.; Klinkenberg, D.; Hollingsworth, T.D. How will country-based mitigation measures influence the course of the COVID-19 epidemic? Lancet 2020, 395, 931–934. [Google Scholar] [CrossRef]
  78. Goscé, L.; Johansson, A. Analysing the link between public transport use and airborne transmission: Mobility and contagion in the London underground. Environ. Health 2018, 17, 84. [Google Scholar] [CrossRef] [Green Version]
  79. Filippini, T.; Rothman, K.J.; Goffi, A.; Ferrari, F.; Maffeis, G.; Orsini, N.; Vinceti, M. Satellite-detected tropospheric nitrogen dioxide and spread of SARS-CoV-2 infection in Northern Italy. Sci. Total Environ. 2020, 739, 140278. [Google Scholar] [CrossRef]
  80. Saha, B.; Debnath, A.; Saha, B. Analysis and finding the correlation of air quality parameters on the spread and deceased case of COVID-19 patients in India 2020. 2020, Research Square. Available online: https://assets.researchsquare.com/files/rs-34647/v1/d82c5de9-56a1-435b-a1e4-6ca206b8838f.pdf (accessed on 18 January 2021).
  81. Bolaño-Ortiz, T.R.; Camargo-Caicedo, Y.; Puliafito, S.E.; Ruggeri, M.F.; Bolaño-Diaz, S.; Pascual-Flores, R.; Saturno, J.; Ibarra-Espinosa, S.; Mayol-Bracero, O.L.; Torres-Delgado, E.; et al. Spread of SARS-CoV-2 through Latin America and the Caribbean region: A look from its economic conditions, climate and air pollution indicators. Environ. Res. 2020, 191, 109938. [Google Scholar] [CrossRef] [PubMed]
  82. Bolaño-Ortiz, T.R.; Pascual-Flores, R.M.; Puliafito, S.E.; Camargo-Caicedo, Y.; Berná-Peña, L.L.; Ruggeri, M.F.; Lopez-Noreña, A.I.; Tames, M.F.; Cereceda-Balic, F. Spread of COVID-19, Meteorological Conditions and Air Quality in the City of Buenos Aires, Argentina: Two Facets Observed during Its Pandemic Lockdown. Atmosphere 2020, 11, 1045. [Google Scholar] [CrossRef]
  83. Bashir, M.F.; Bilal, B.M.A.; Komal, B. Correlation between environmental pollution indicators and COVID-19 pandemic: A brief study in Californian context. Environ. Res. 2020, 109652. [Google Scholar] [CrossRef]
  84. Travaglio, M.; Popovic, R.; Yu, Y.; Leal, N.; Martins, L.M. Links between air pollution and COVID-19 in England. medRxiv 2020. [Google Scholar] [CrossRef] [Green Version]
  85. Ogen, Y. Assessing nitrogen dioxide (NO2) levels as a contributing factor to coronavirus (COVID-19) fatality. Sci. Total Environ. 2020, 726, 138605. [Google Scholar] [CrossRef]
  86. Mankia, K.; Di Matteo, A.; Emery, P. Prevention and cure: The major unmet needs in the management of rheumatoid arthritis. J. Autoimmun. 2020, 110, 102399. [Google Scholar] [CrossRef]
  87. Brianti, M.; Magnani, M.; Menegatti, M. Optimal choice of prevention and cure under uncertainty on disease effect and cure effectiveness. Res. Econ. 2018, 72, 327–342. [Google Scholar] [CrossRef]
  88. EMEP EMEP/EEA air pollutant emission inventory guidebook—2016—European Environment Agency. EEA Reports 2016. [CrossRef]
Figure 1. Location of Colombia in South America. Study area covers the entire territory of Colombia.
Applsci 11 01458 g001
Figure 2. Estimated total emissions (Gg) of the four groups of pollutants that affect climate change, air quality and health: (a) GHGs (CH4, CO2 and N2O); (b) ozone precursors (CO, NMCOV and NOx); (c) aerosols (BC, PM10 and PM2.5); (d) acidifying gases (NH3 and SO2) for January to June of 2018 and 2020.
Applsci 11 01458 g002
Figure 3. Emissions variations of the four groups of pollutants in the study: (a) GHGs; (b) ozone precursors; (c) aerosols; (d) acidifying gases, during the January to June 2020 in relation to the same period of 2018.
Applsci 11 01458 g003
Figure 4. Spatial distribution of CO2 emissions variation through internal political and territorial divisions (departments). Warm and cold colors indicate an increase and decrease, respectively, in emissions between the March and June 2018 and 2020.
Applsci 11 01458 g004
Figure 5. Spatial distribution of mean levels of tropospheric NO2 through internal political and territorial divisions (departments) between April and June 2018 and 2020. Source: Time averaged map of NO2 tropospheric column (30% cloud screened) daily 0.25 deg. (OMI OMNO2dv003) 1/cm2.
Applsci 11 01458 g005
Table 1. Fuel consumption by vehicle category [51].
FuelConsumption (%)
CarsCargoPublic TransportMotorcyclesOthers
Gasoline77--221
Diesel oil185326-3
CNG9172--
Table 2. Mean concentration and standard deviation of CO, SO2, NO2 and O3 in Bogotá during the lockdown (April to June 2020) compared to the same period in 2018 [54].
Air PollutantMean Concentration 2018 (µg.m−3)Mean Concentration 2020 (µg.m−3)Variation of Mean Concentrations (%) from 2018 to 2020
AprMayJunAprMayJunAprMayJun
CO1408.75 ± 363.641269.63 ± 304.621074.67 ± 396.98551.55 ± 276.74787.13 ± 301.38920.46 ± 422.75−60.85−38.18−13.8
SO23.90 ± 2.003.41 ± 1.264.50 ± 1.502.83 ± 1.193.30 ± 2.064.13 ± 2.15−27.39−16.57−8.22
NO256.10 ± 12.2044.70 ± 7.8246.60 ± 7.4622.10 ± 9.7527.80 ± 14.4629.30 ± 12.59−60.6−37.81−37.12
O314.66 ± 6.8810.28 ± 3.9513.06 ± 6.7537.53 ± 13.6121.21 ± 7.0718.16 ± 7.4360.92106.3227.66
Publisher’s Note: MDPI stays neutral with regard to jurisdictional claims in published maps and institutional affiliations.

