
Performance Evaluation of the BZ COVID-19 Neutralizing Antibody Test for the Culture-Free and Rapid Detection of SARS-CoV-2 Neutralizing Antibodies

 ,
,
Abstract
:1. Introduction
2. Materials and Methods
2.1. Sample Collection and Preparation
2.2. PRNT
2.3. cPass sVNT
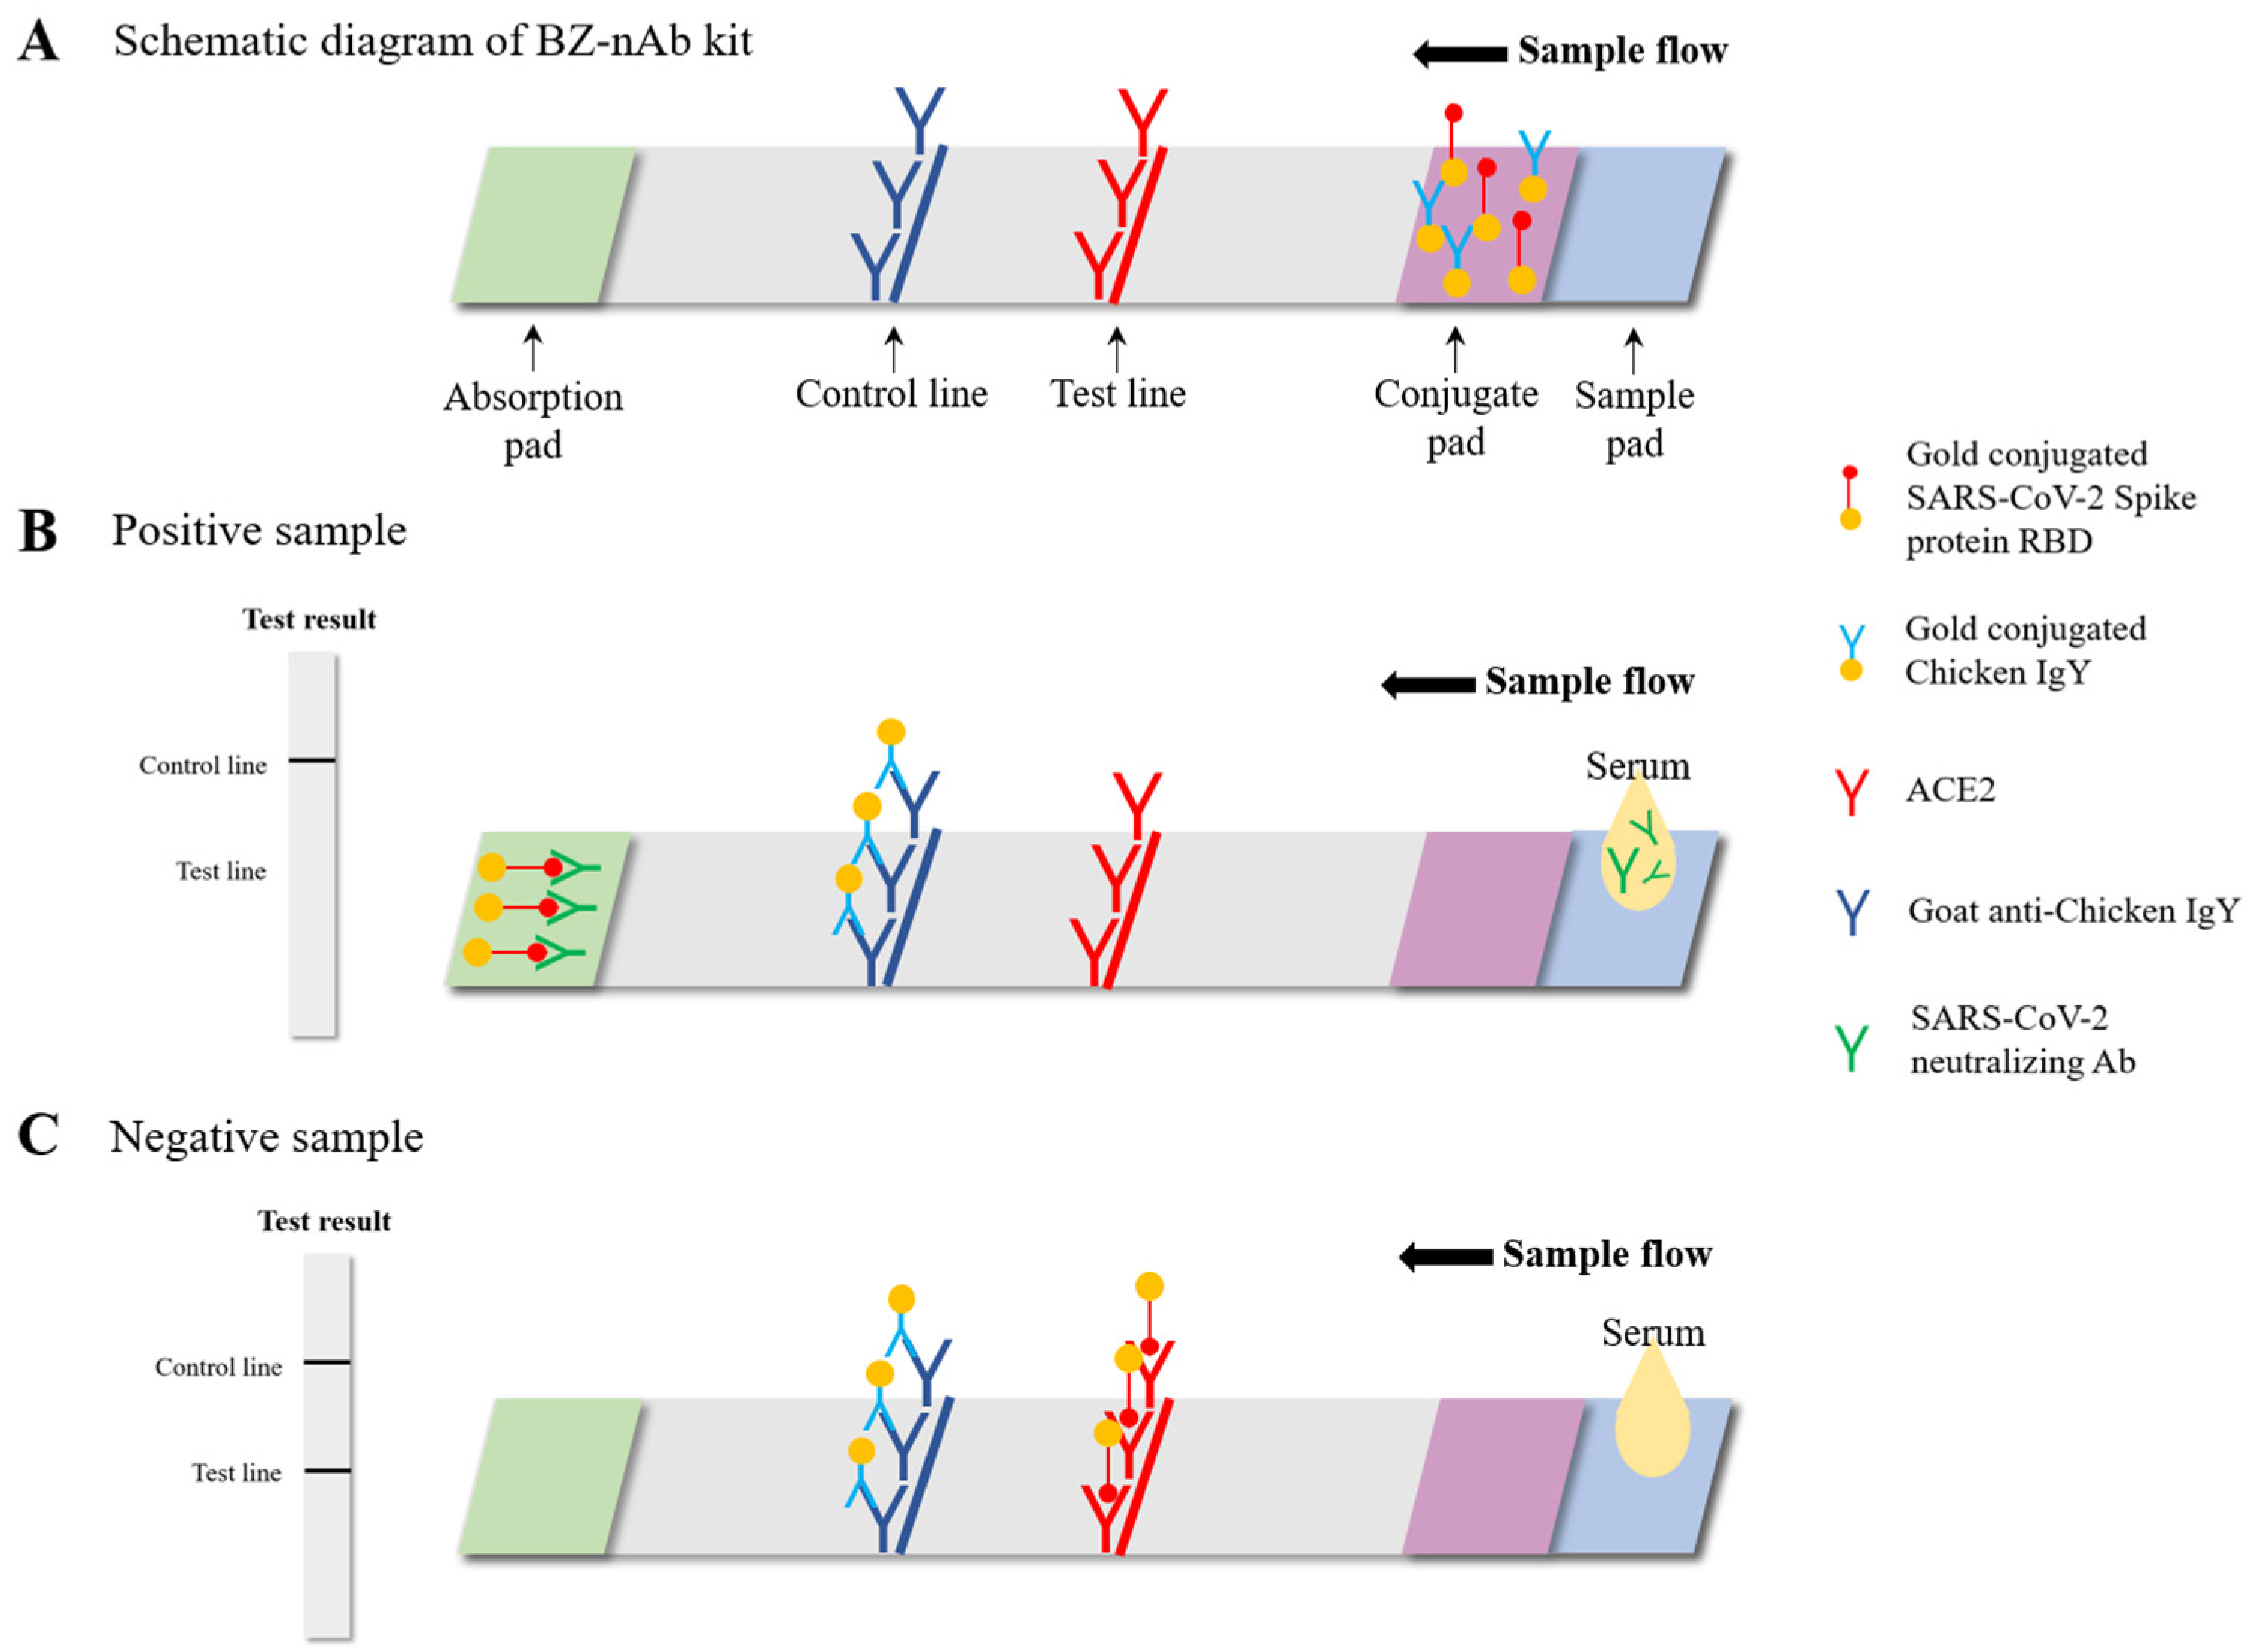
2.4. BZ-nAb
2.5. Statistical Analysis
3. Results
3.1. BZ-nAb Test Line Intensity Measurement by the SIA
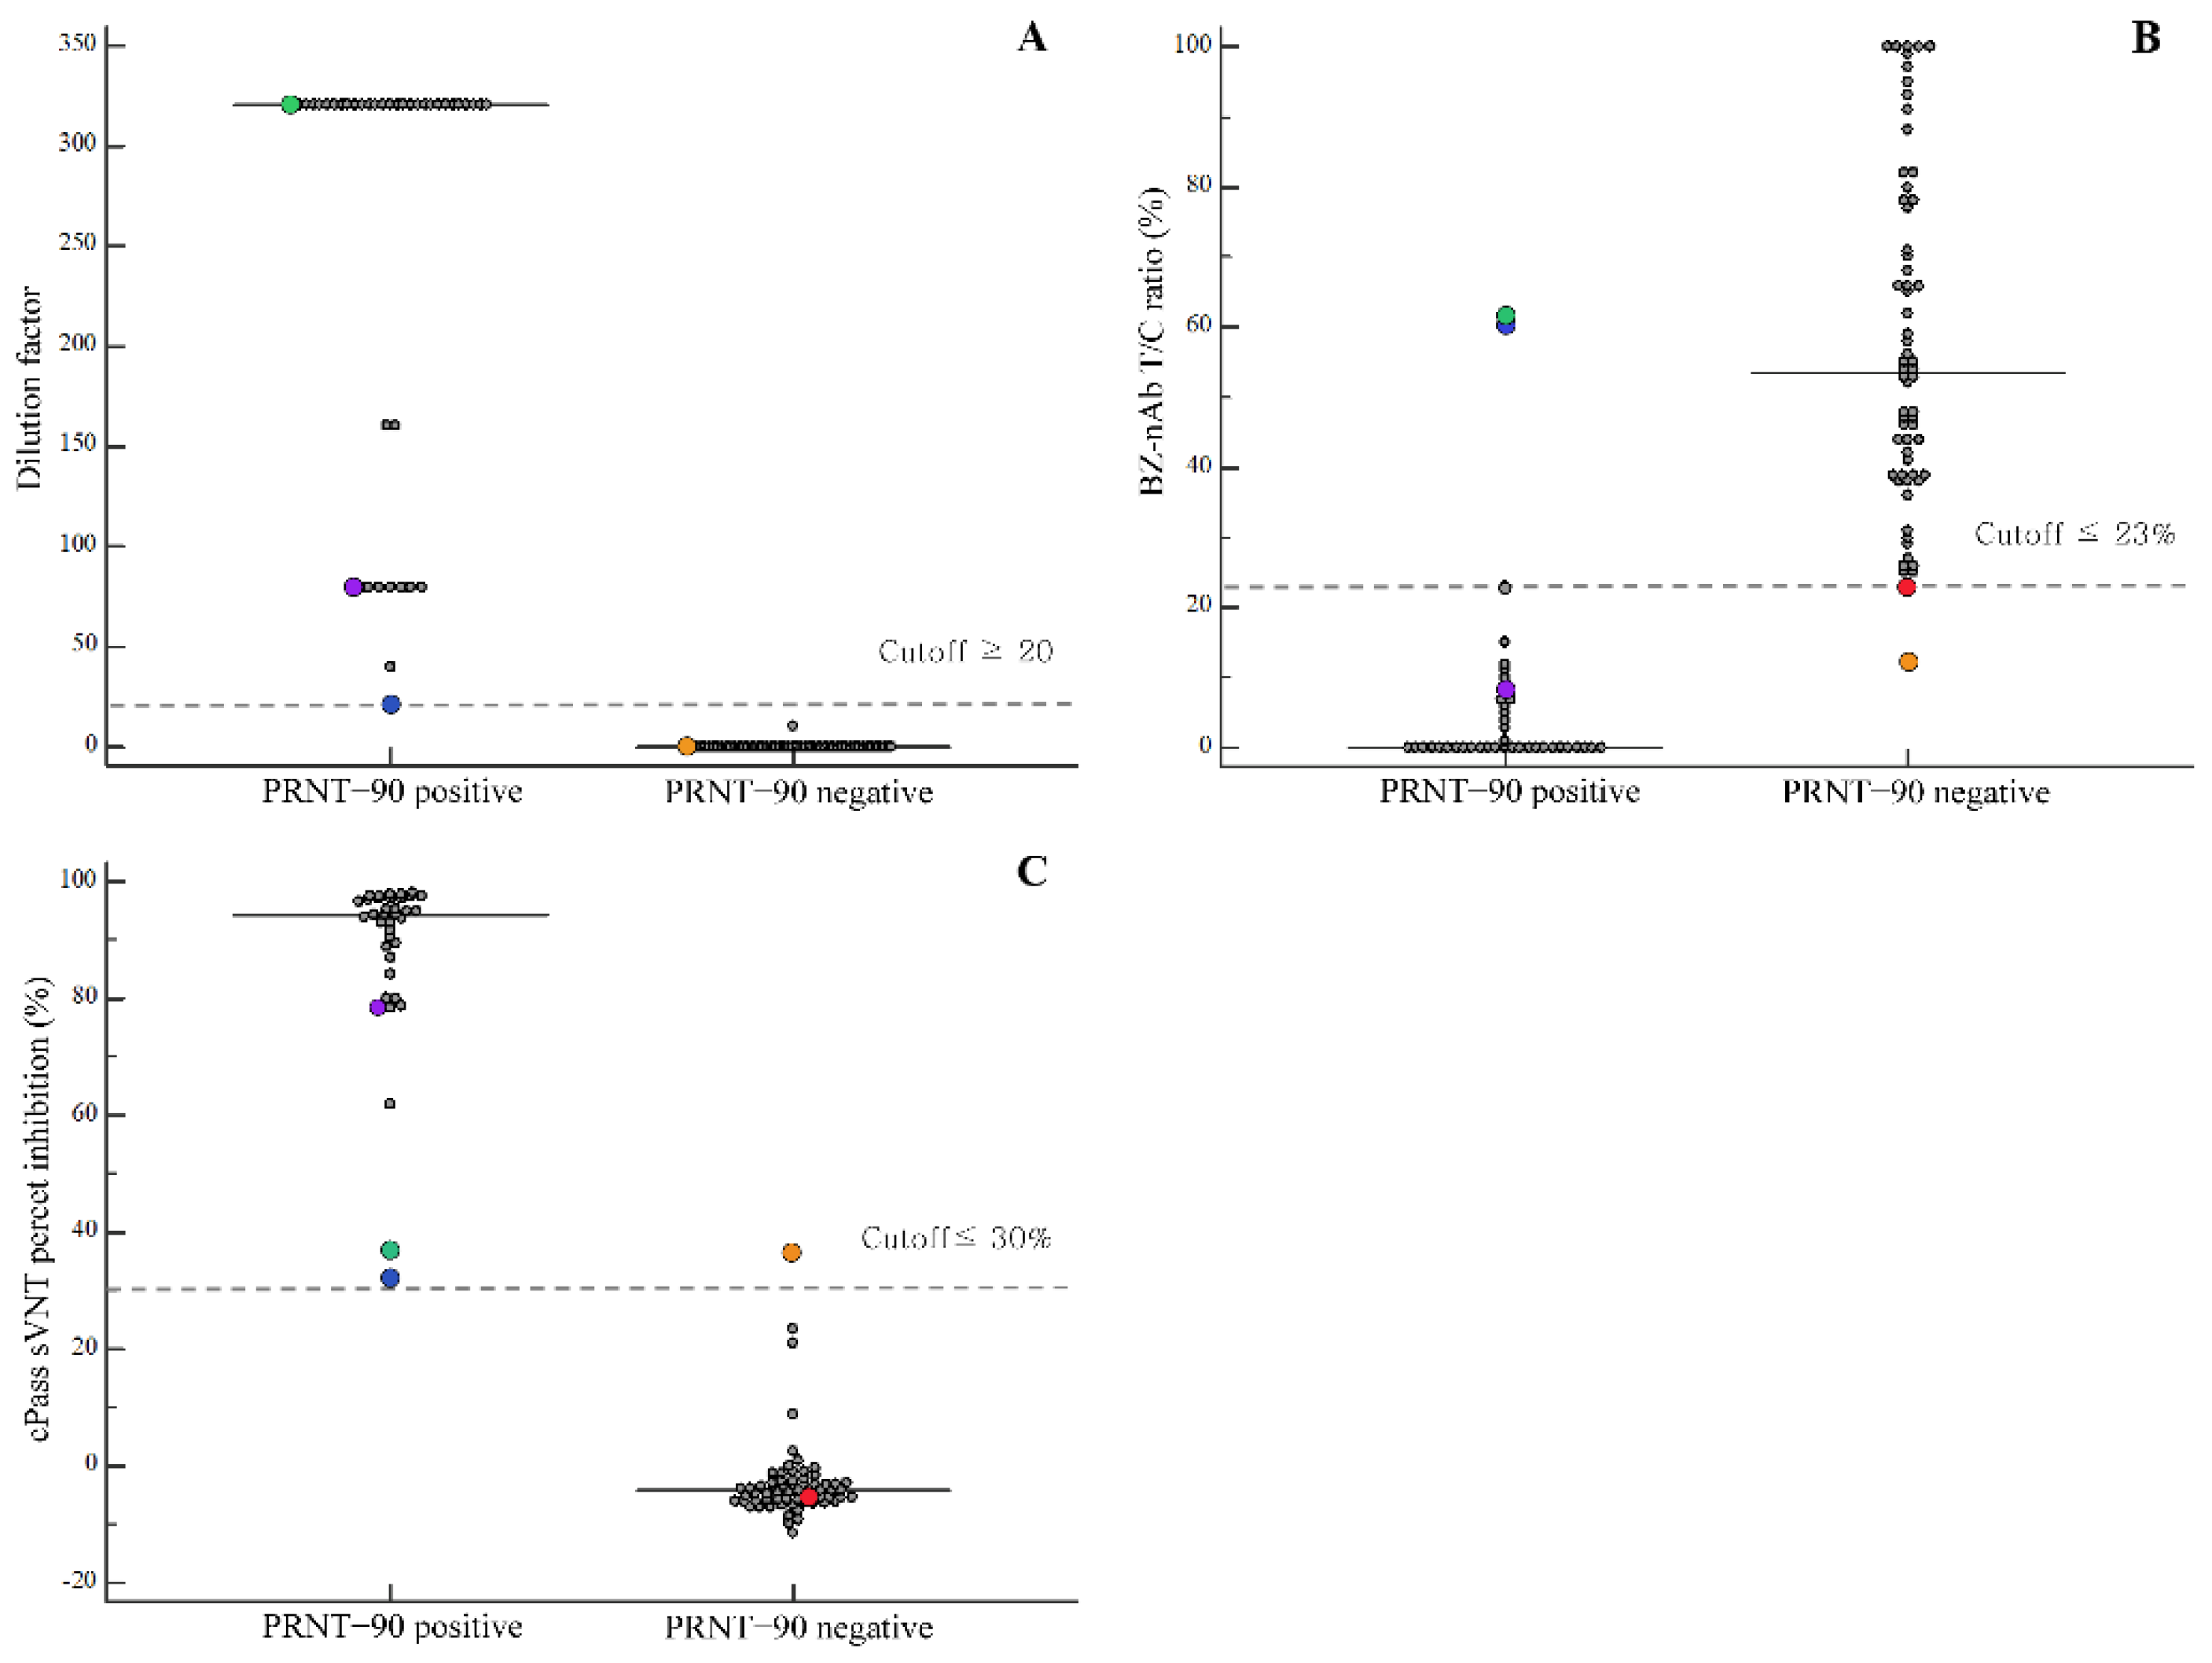
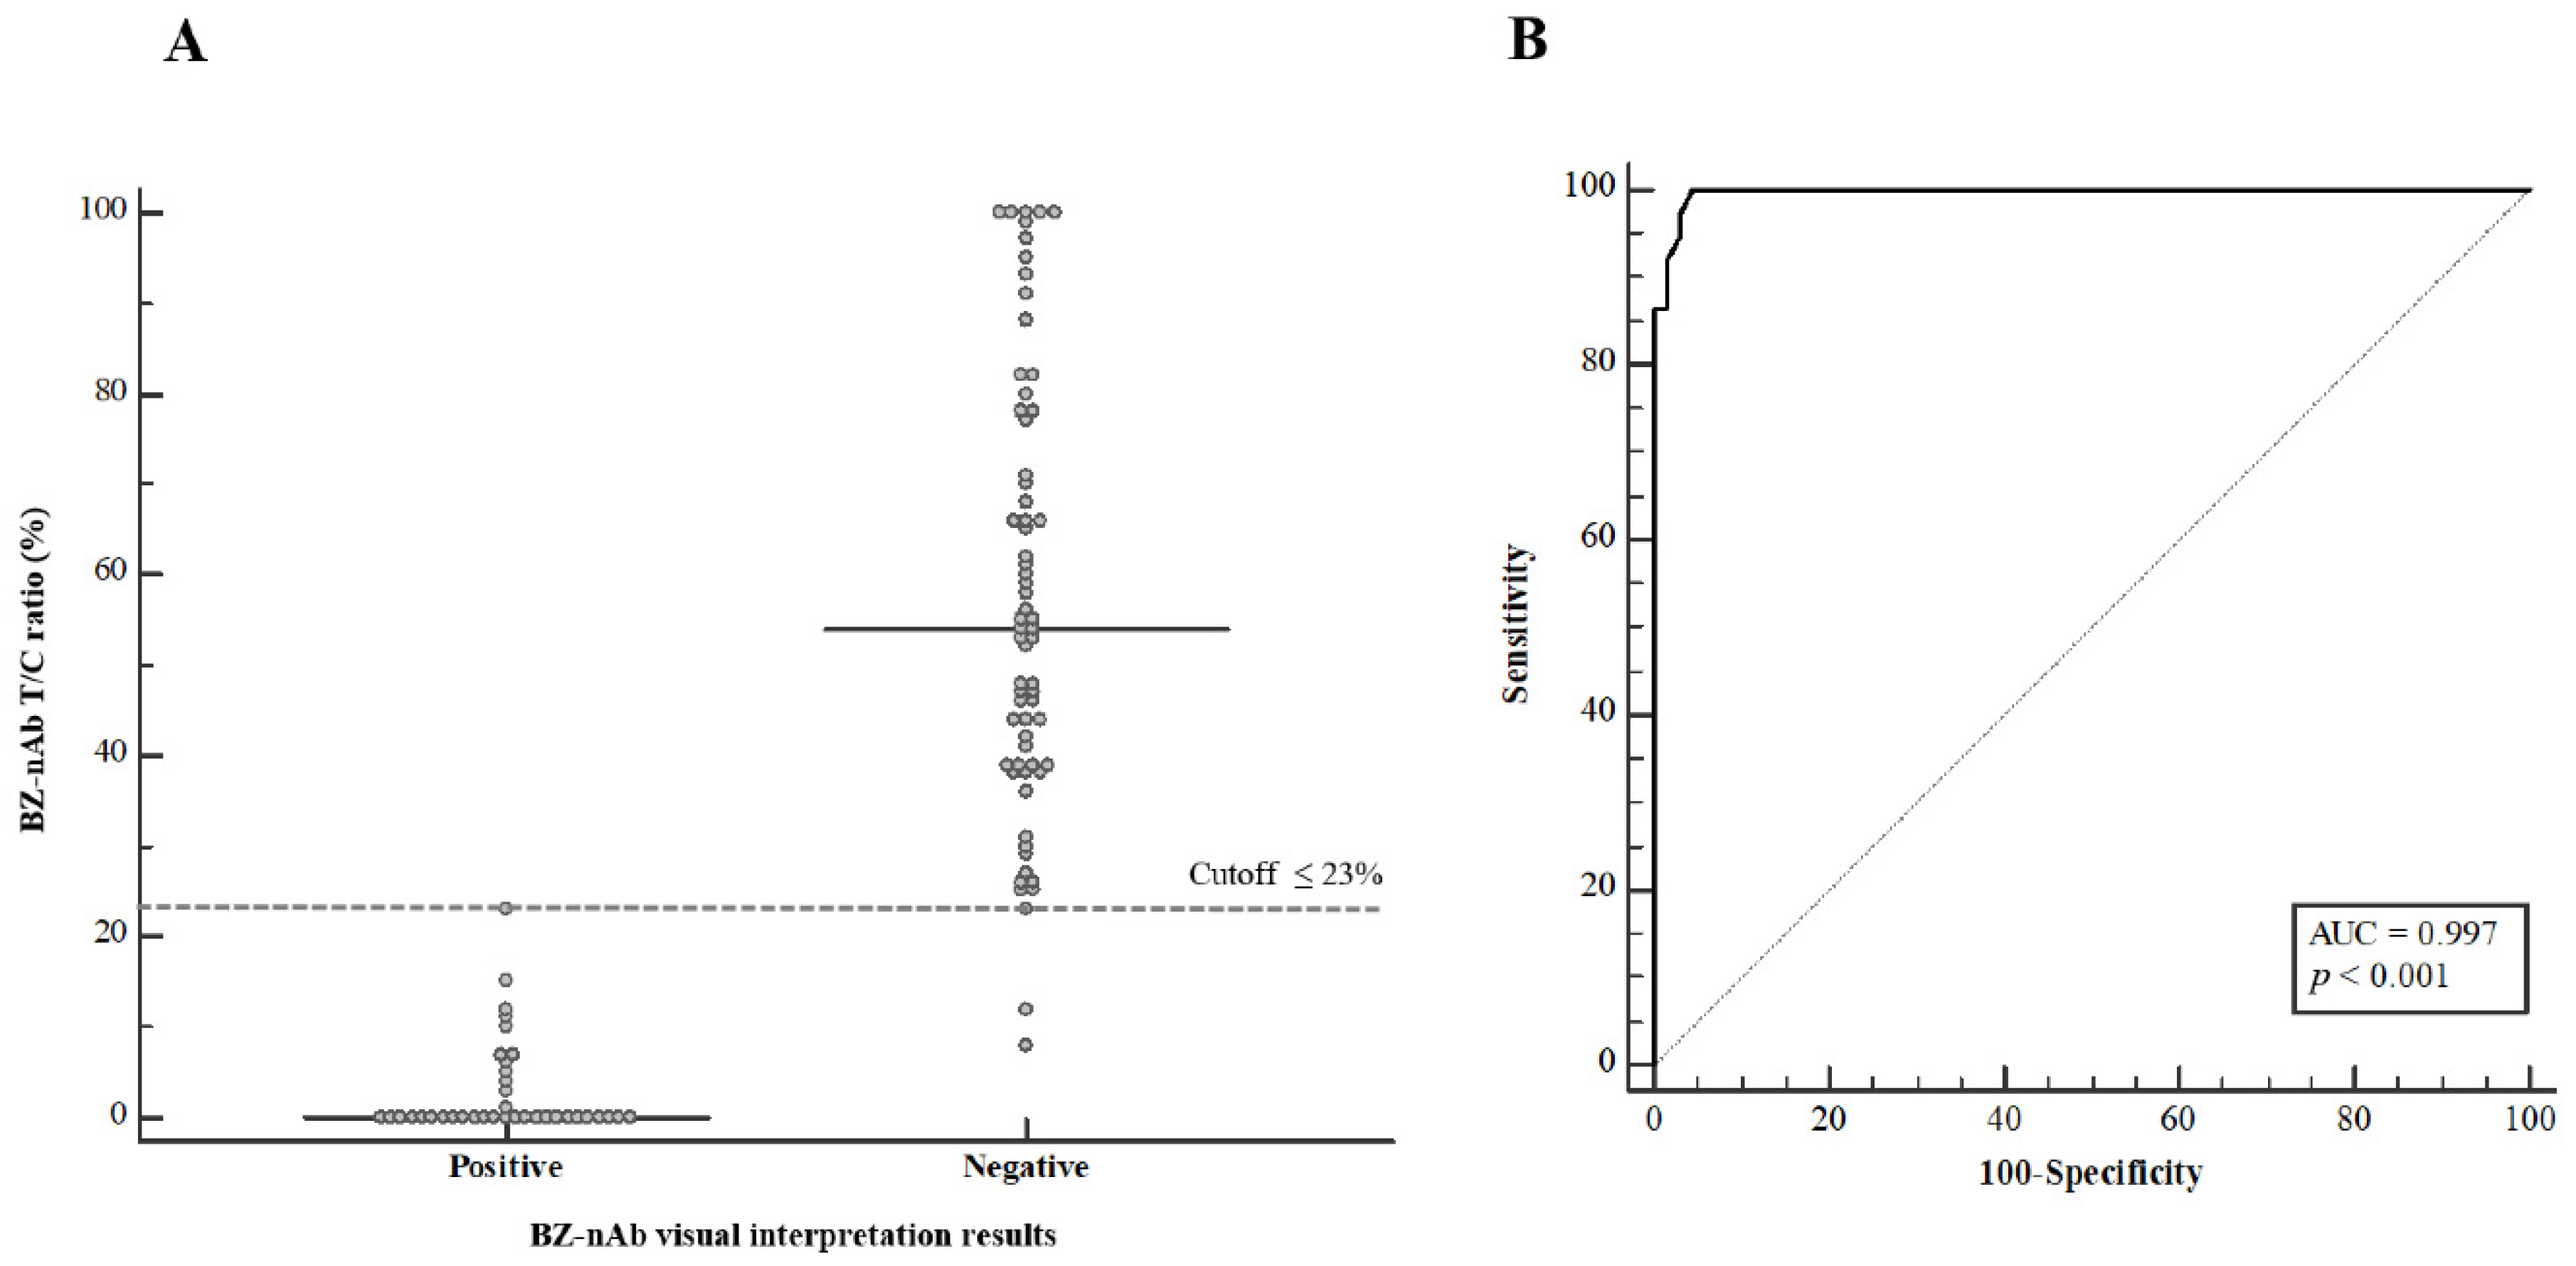
3.2. Performance Evaluation of the BZ-nAb and cPass sVNT for the Detection of SARS-CoV-2 nAbs
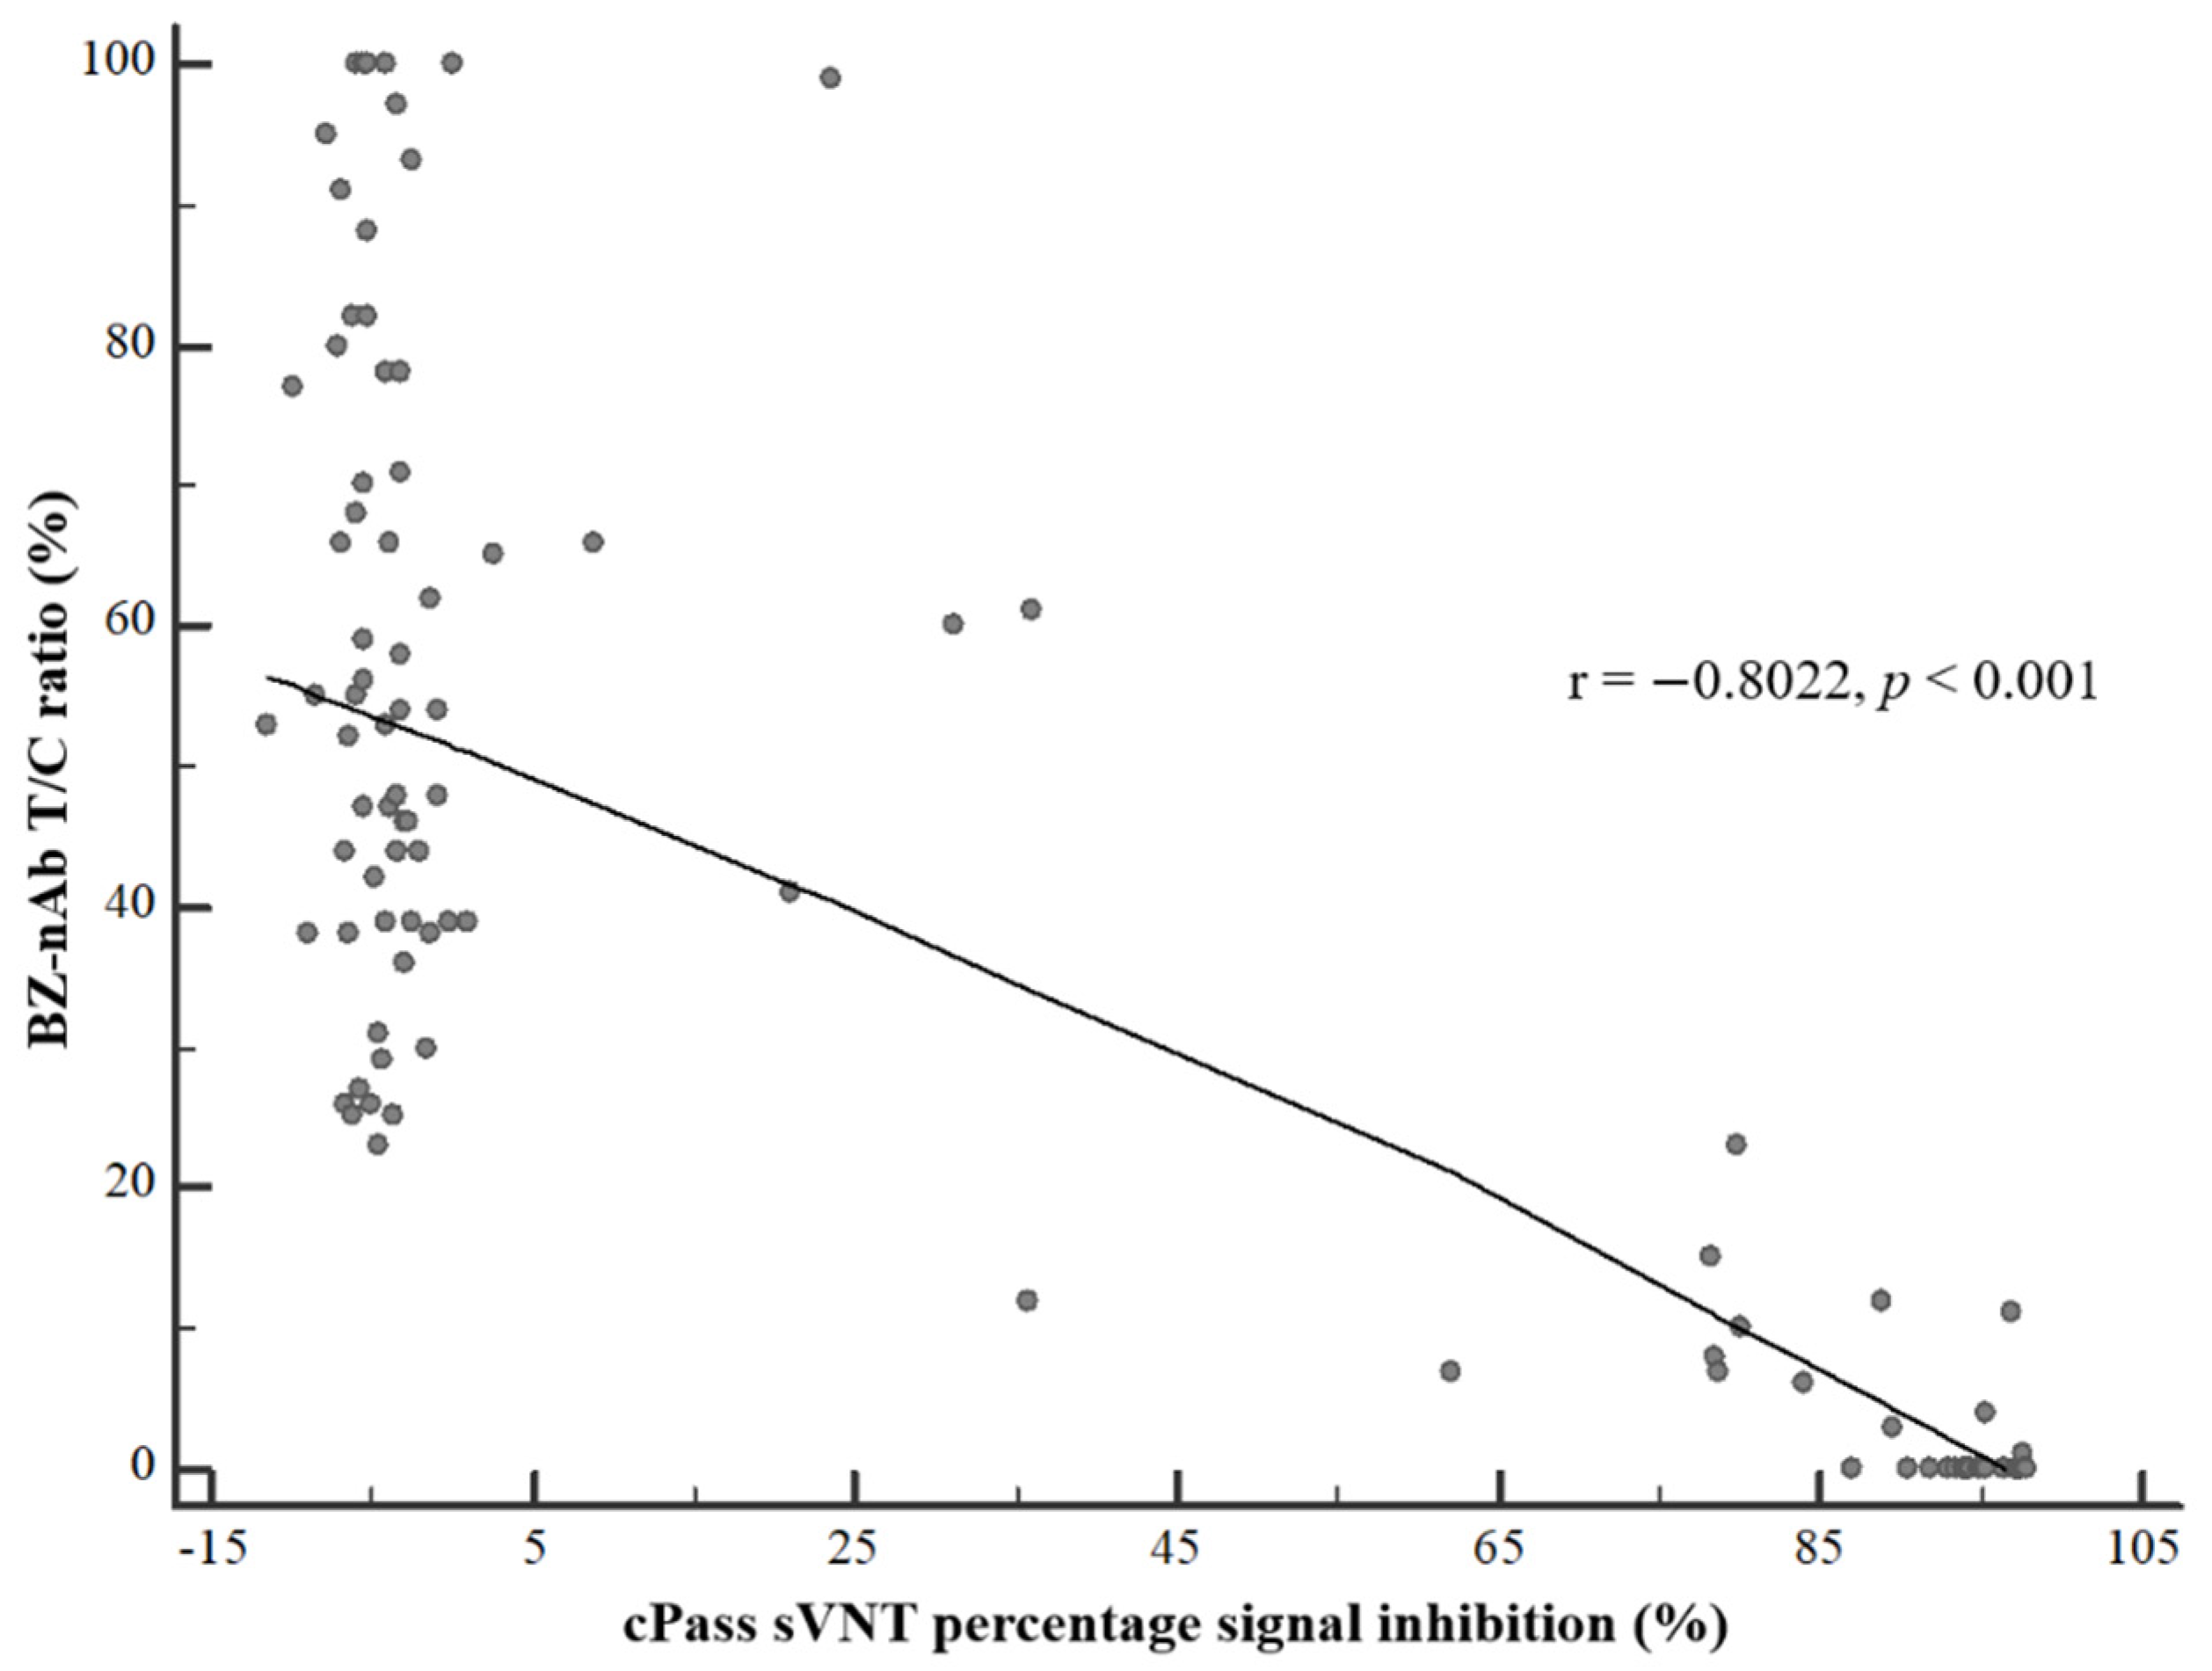
3.3. Agreement of BZ-nAb and cPass sVNT Results
4. Discussion
5. Conclusions
Supplementary Materials
Author Contributions
Funding
Institutional Review Board Statement
Informed Consent Statement
Data Availability Statement
Conflicts of Interest
References
- Kim, J.H.; Marks, F.; Clemens, J.D. Looking beyond COVID-19 vaccine phase 3 trials. Nat. Med. 2021, 27, 205–211. [Google Scholar] [CrossRef]
- Lumley, S.F.; O’Donnell, D.; Stoesser, N.E.; Matthews, P.C.; Howarth, A.; Hatch, S.B.; Marsden, B.D.; Cox, S.; James, T.; Warren, F.; et al. Antibody Status and Incidence of SARS-CoV-2 Infection in Health Care Workers. N. Engl. J. Med. 2021, 384, 533–540. [Google Scholar] [CrossRef] [PubMed]
- Piccoli, L.; Park, Y.J.; Tortorici, M.A.; Czudnochowski, N.; Walls, A.C.; Beltramello, M.; Silacci-Fregni, C.; Pinto, D.; Rosen, L.E.; Bowen, J.E.; et al. Mapping Neutralizing and Immunodominant Sites on the SARS-CoV-2 Spike Receptor-Binding Domain by Structure-Guided High-Resolution Serology. Cell 2020, 183, 1024–1042.e21. [Google Scholar] [CrossRef] [PubMed]
- GeurtsvanKessel, C.H.; Okba, N.M.A.; Igloi, Z.; Bogers, S.; Embregts, C.W.E.; Laksono, B.M.; Leijten, L.; Rokx, C.; Rijnders, B.; Rahamat-Langendoen, J.; et al. An evaluation of COVID-19 serological assays informs future diagnostics and exposure assessment. Nat. Commun. 2020, 11, 3436. [Google Scholar] [CrossRef] [PubMed]
- Muecksch, F.; Wise, H.; Batchelor, B.; Squires, M.; Semple, E.; Richardson, C.; McGuire, J.; Clearly, S.; Furrie, E.; Greig, N.; et al. Longitudinal Serological Analysis and Neutralizing Antibody Levels in Coronavirus Disease 2019 Convalescent Patients. J. Infect. Dis. 2021, 223, 389–398. [Google Scholar] [CrossRef]
- Dispinseri, S.; Secchi, M.; Pirillo, M.F.; Tolazzi, M.; Borghi, M.; Brigatti, C.; De Angelis, M.L.; Baratella, M.; Bazzigaluppi, E.; Venturi, G.; et al. Neutralizing antibody responses to SARS-CoV-2 in symptomatic COVID-19 is persistent and critical for survival. Nat. Commun. 2021, 12, 2670. [Google Scholar] [CrossRef]
- Khoury, D.S.; Cromer, D.; Reynaldi, A.; Schlub, T.E.; Wheatley, A.K.; Juno, J.A.; Subbarao, K.; Kent, S.J.; Triccas, J.A.; Davenport, M.P. Neutralizing antibody levels are highly predictive of immune protection from symptomatic SARS-CoV-2 infection. Nat. Med. 2021, 27, 1205–1211. [Google Scholar] [CrossRef] [PubMed]
- Walsh, E.E.; Frenck, R.W., Jr.; Falsey, A.R.; Kitchin, N.; Absalon, J.; Gurtman, A.; Lockhart, S.; Neuzil, K.; Mulligan, M.J.; Bailey, R.; et al. Safety and Immunogenicity of Two RNA-Based COVID-19 Vaccine Candidates. N. Engl. J. Med. 2020, 383, 2439–2450. [Google Scholar] [CrossRef]
- Jackson, L.A.; Anderson, E.J.; Rouphael, N.G.; Roberts, P.C.; Makhene, M.; Coler, R.N.; McCullough, M.P.; Chappell, J.D.; Denison, M.R.; Stevens, L.J.; et al. An mRNA Vaccine against SARS-CoV-2—Preliminary Report. N. Engl. J. Med. 2020, 383, 1920–1931. [Google Scholar] [CrossRef]
- Folegatti, P.M.; Ewer, K.J.; Aley, P.K.; Angus, B.; Becker, S.; Belij-Rammerstorfer, S.; Bellamy, D.; Bibi, S.; Bittaye, M.; Clutterbuck, E.A.; et al. Safety and immunogenicity of the ChAdOx1 nCoV-19 vaccine against SARS-CoV-2: A preliminary report of a phase 1/2, single-blind, randomised controlled trial. Lancet 2020, 396, 467–478. [Google Scholar] [CrossRef]
- Perera, R.A.; Mok, C.K.; Tsang, O.T.; Lv, H.; Ko, R.L.; Wu, N.C.; Yuan, M.; Leung, W.S.; Chan, J.M.; Chik, T.S.; et al. Serological assays for severe acute respiratory syndrome coronavirus 2 (SARS-CoV-2), March 2020. Eurosurveillance 2020, 25, 2000421. [Google Scholar] [CrossRef] [PubMed] [Green Version]
- Lau, E.H.Y.; Tsang, O.T.Y.; Hui, D.S.C.; Kwan, M.Y.W.; Chan, W.H.; Chiu, S.S.; Ko, R.L.W.; Chan, K.H.; Cheng, S.M.S.; Perera, R.; et al. Neutralizing antibody titres in SARS-CoV-2 infections. Nat. Commun. 2021, 12, 63. [Google Scholar] [CrossRef] [PubMed]
- Nie, J.; Li, Q.; Wu, J.; Zhao, C.; Hao, H.; Liu, H.; Zhang, L.; Nie, L.; Qin, H.; Wang, M.; et al. Establishment and validation of a pseudovirus neutralization assay for SARS-CoV-2. Emerg. Microbes Infect. 2020, 9, 680–686. [Google Scholar] [CrossRef] [PubMed] [Green Version]
- Muruato, A.E.; Fontes-Garfias, C.R.; Ren, P.; Garcia-Blanco, M.A.; Menachery, V.D.; Xie, X.; Shi, P.Y. A high-throughput neutralizing antibody assay for COVID-19 diagnosis and vaccine evaluation. Nat. Commun. 2020, 11, 4059. [Google Scholar] [CrossRef]
- Taylor, S.C.; Hurst, B.; Charlton, C.L.; Bailey, A.; Kanji, J.N.; McCarthy, M.K.; Morrison, T.E.; Huey, L.; Annen, K.; DomBourian, M.G.; et al. A New SARS-CoV-2 Dual-Purpose Serology Test: Highly Accurate Infection Tracing and Neutralizing Antibody Response Detection. J. Clin. Microbiol. 2021, 59, e02438-20. [Google Scholar] [CrossRef]
- Murray, M.J.; McIntosh, M.; Atkinson, C.; Mahungu, T.; Wright, E.; Chatterton, W.; Gandy, M.; Reeves, M.B. Validation of a commercially available indirect assay for SARS-CoV-2 neutralising antibodies using a pseudotyped virus assay. J. Infect. 2021, 82, 170–177. [Google Scholar] [CrossRef]
- BioZentech. COVID-19 Neutralizing Ab Test [Instructions for Use]; BioZentech: Seoul, Korea, 2021. [Google Scholar]
- Noble, L.; Scott, L.; Stewart-Isherwood, L.; Molifi, S.J.; Sanne, I.; Da Silva, P.; Stevens, W. Continuous quality monitoring in the field: An evaluation of the performance of the Fio Deki Reader™ for rapid HIV testing in South Africa. BMC Infect. Dis. 2020, 20, 320. [Google Scholar] [CrossRef]
- Kalinga, A.K.; Mwanziva, C.; Chiduo, S.; Mswanya, C.; Ishengoma, D.I.; Francis, F.; Temu, L.; Mahikwano, L.; Mgata, S.; Amoo, G.; et al. Comparison of visual and automated Deki Reader interpretation of malaria rapid diagnostic tests in rural Tanzanian military health facilities. Malar. J. 2018, 17, 214. [Google Scholar] [CrossRef]
- Visser, T.; Ramachandra, S.; Pothin, E.; Jacobs, J.; Cunningham, J.; Menach, A.L.; Gatton, M.L.; Dos Santos Souza, S.; Nelson, S.; Rooney, L.; et al. A comparative evaluation of mobile medical APPS (MMAS) for reading and interpreting malaria rapid diagnostic tests. Malar. J. 2021, 20, 39. [Google Scholar] [CrossRef]
- Kim, Y.J.; Bae, J.Y.; Bae, S.; Hwang, S.; Kwon, K.T.; Chang, H.H.; Lee, W.K.; Cui, C.; Lee, G.E.; Kim, S.W.; et al. Neutralizing Antibody Responses to SARS-CoV-2 in Korean Patients Who Have Recovered from COVID-19. Yonsei Med. J. 2021, 62, 584–592. [Google Scholar] [CrossRef]
- Liu, L.; Wang, P.; Nair, M.S.; Yu, J.; Rapp, M.; Wang, Q.; Luo, Y.; Chan, J.F.; Sahi, V.; Figueroa, A.; et al. Potent neutralizing antibodies against multiple epitopes on SARS-CoV-2 spike. Nature 2020, 584, 450–456. [Google Scholar] [CrossRef] [PubMed]
- Papenburg, J.; Cheng, M.P.; Corsini, R.; Caya, C.; Mendoza, E.; Manguiat, K.; Lindsay, L.R.; Wood, H.; Drebot, M.A.; Dibernardo, A.; et al. Evaluation of a Commercial Culture-Free Neutralization Antibody Detection Kit for Severe Acute Respiratory Syndrome-Related Coronavirus-2 and Comparison with an Antireceptor-Binding Domain Enzyme-Linked Immunosorbent Assay. Open Forum Infect. Dis. 2021, 8, ofab220. [Google Scholar] [CrossRef] [PubMed]


| Neutralizing Ab Detection Methods | Total Number of Samples | True Positive | False Positive | False Negative | True Negative | Sensitivity a (95% CI) | Specificity b (95% CI) | |
|---|---|---|---|---|---|---|---|---|
| PRNT-90 Positive | PRNT-90 Negative | |||||||
| BZ COVID-19 neutralizing Ab test | ||||||||
| Visual interpretation | 40 | 64 | 37 | 0 | 3 | 64 | 92.5 (79.6–98.4) | 100 (94.4–100) |
| Interpretation using T/C ratio cutoff | 40 | 64 | 38 | 2 | 2 | 62 | 95.0 (83.1–99.4) | 96.9 (89.2–99.6) |
| cPass surrogate virus neutralization test | 37 | 64 | 37 | 1 | 0 | 63 | 100 (90.5–100) | 98.4 (91.6–100) |
| cPass sVNT Results | Percent Agreement (95% CI) a | Kappa Statistic (95% CI) | |||||
|---|---|---|---|---|---|---|---|
| Positive | Negative | Positive | Negative | Overall | |||
| BZ-nAb with visual interpretation | Positive | 34 | 0 | 89.5 (75.2–97.1) | 100 (94.3–100) | 96.0 (90.2–98.9) | 0.914 (0.831–0.996) |
| Negative | 4 | 63 | |||||
| BZ-nAb with T/C ratio cutoff | Positive | 36 | 1 | 94.7 (82.3–99.4) | 98.4 (91.5–100) | 97.0 (91.6–99.4) | 0.936 (0.866–1) |
| Negative | 2 | 62 | |||||
Publisher’s Note: MDPI stays neutral with regard to jurisdictional claims in published maps and institutional affiliations. |
© 2021 by the authors. Licensee MDPI, Basel, Switzerland. This article is an open access article distributed under the terms and conditions of the Creative Commons Attribution (CC BY) license (https://creativecommons.org/licenses/by/4.0/).
Share and Cite
Jung, B.K.; Yoon, J.; Bae, J.-Y.; Kim, J.; Park, M.-S.; Lee, S.Y.; Lim, C.S. Performance Evaluation of the BZ COVID-19 Neutralizing Antibody Test for the Culture-Free and Rapid Detection of SARS-CoV-2 Neutralizing Antibodies. Diagnostics 2021, 11, 2193. https://doi.org/10.3390/diagnostics11122193
Jung BK, Yoon J, Bae J-Y, Kim J, Park M-S, Lee SY, Lim CS. Performance Evaluation of the BZ COVID-19 Neutralizing Antibody Test for the Culture-Free and Rapid Detection of SARS-CoV-2 Neutralizing Antibodies. Diagnostics. 2021; 11(12):2193. https://doi.org/10.3390/diagnostics11122193
Chicago/Turabian StyleJung, Bo Kyeung, Jung Yoon, Joon-Yong Bae, Jeonghun Kim, Man-Seong Park, Suk Yong Lee, and Chae Seung Lim. 2021. "Performance Evaluation of the BZ COVID-19 Neutralizing Antibody Test for the Culture-Free and Rapid Detection of SARS-CoV-2 Neutralizing Antibodies" Diagnostics 11, no. 12: 2193. https://doi.org/10.3390/diagnostics11122193