
Tourism Village Carbon Footprint after COVID-19 Pandemic: A Challenge to Sustainability

 ,
, 
Abstract
:1. Introduction
2. Methods
- Ec = Carbon emission of solid waste (kg CO2/kg)
- EF = Emission Factor of solid waste
- V = Solid waste volume
- Ec = Carbon emission of the building (kg CO2/m2)
- EF = Embodied GHG for building = 6.7 kg CO2/m2
- A = Building’s area
3. Results
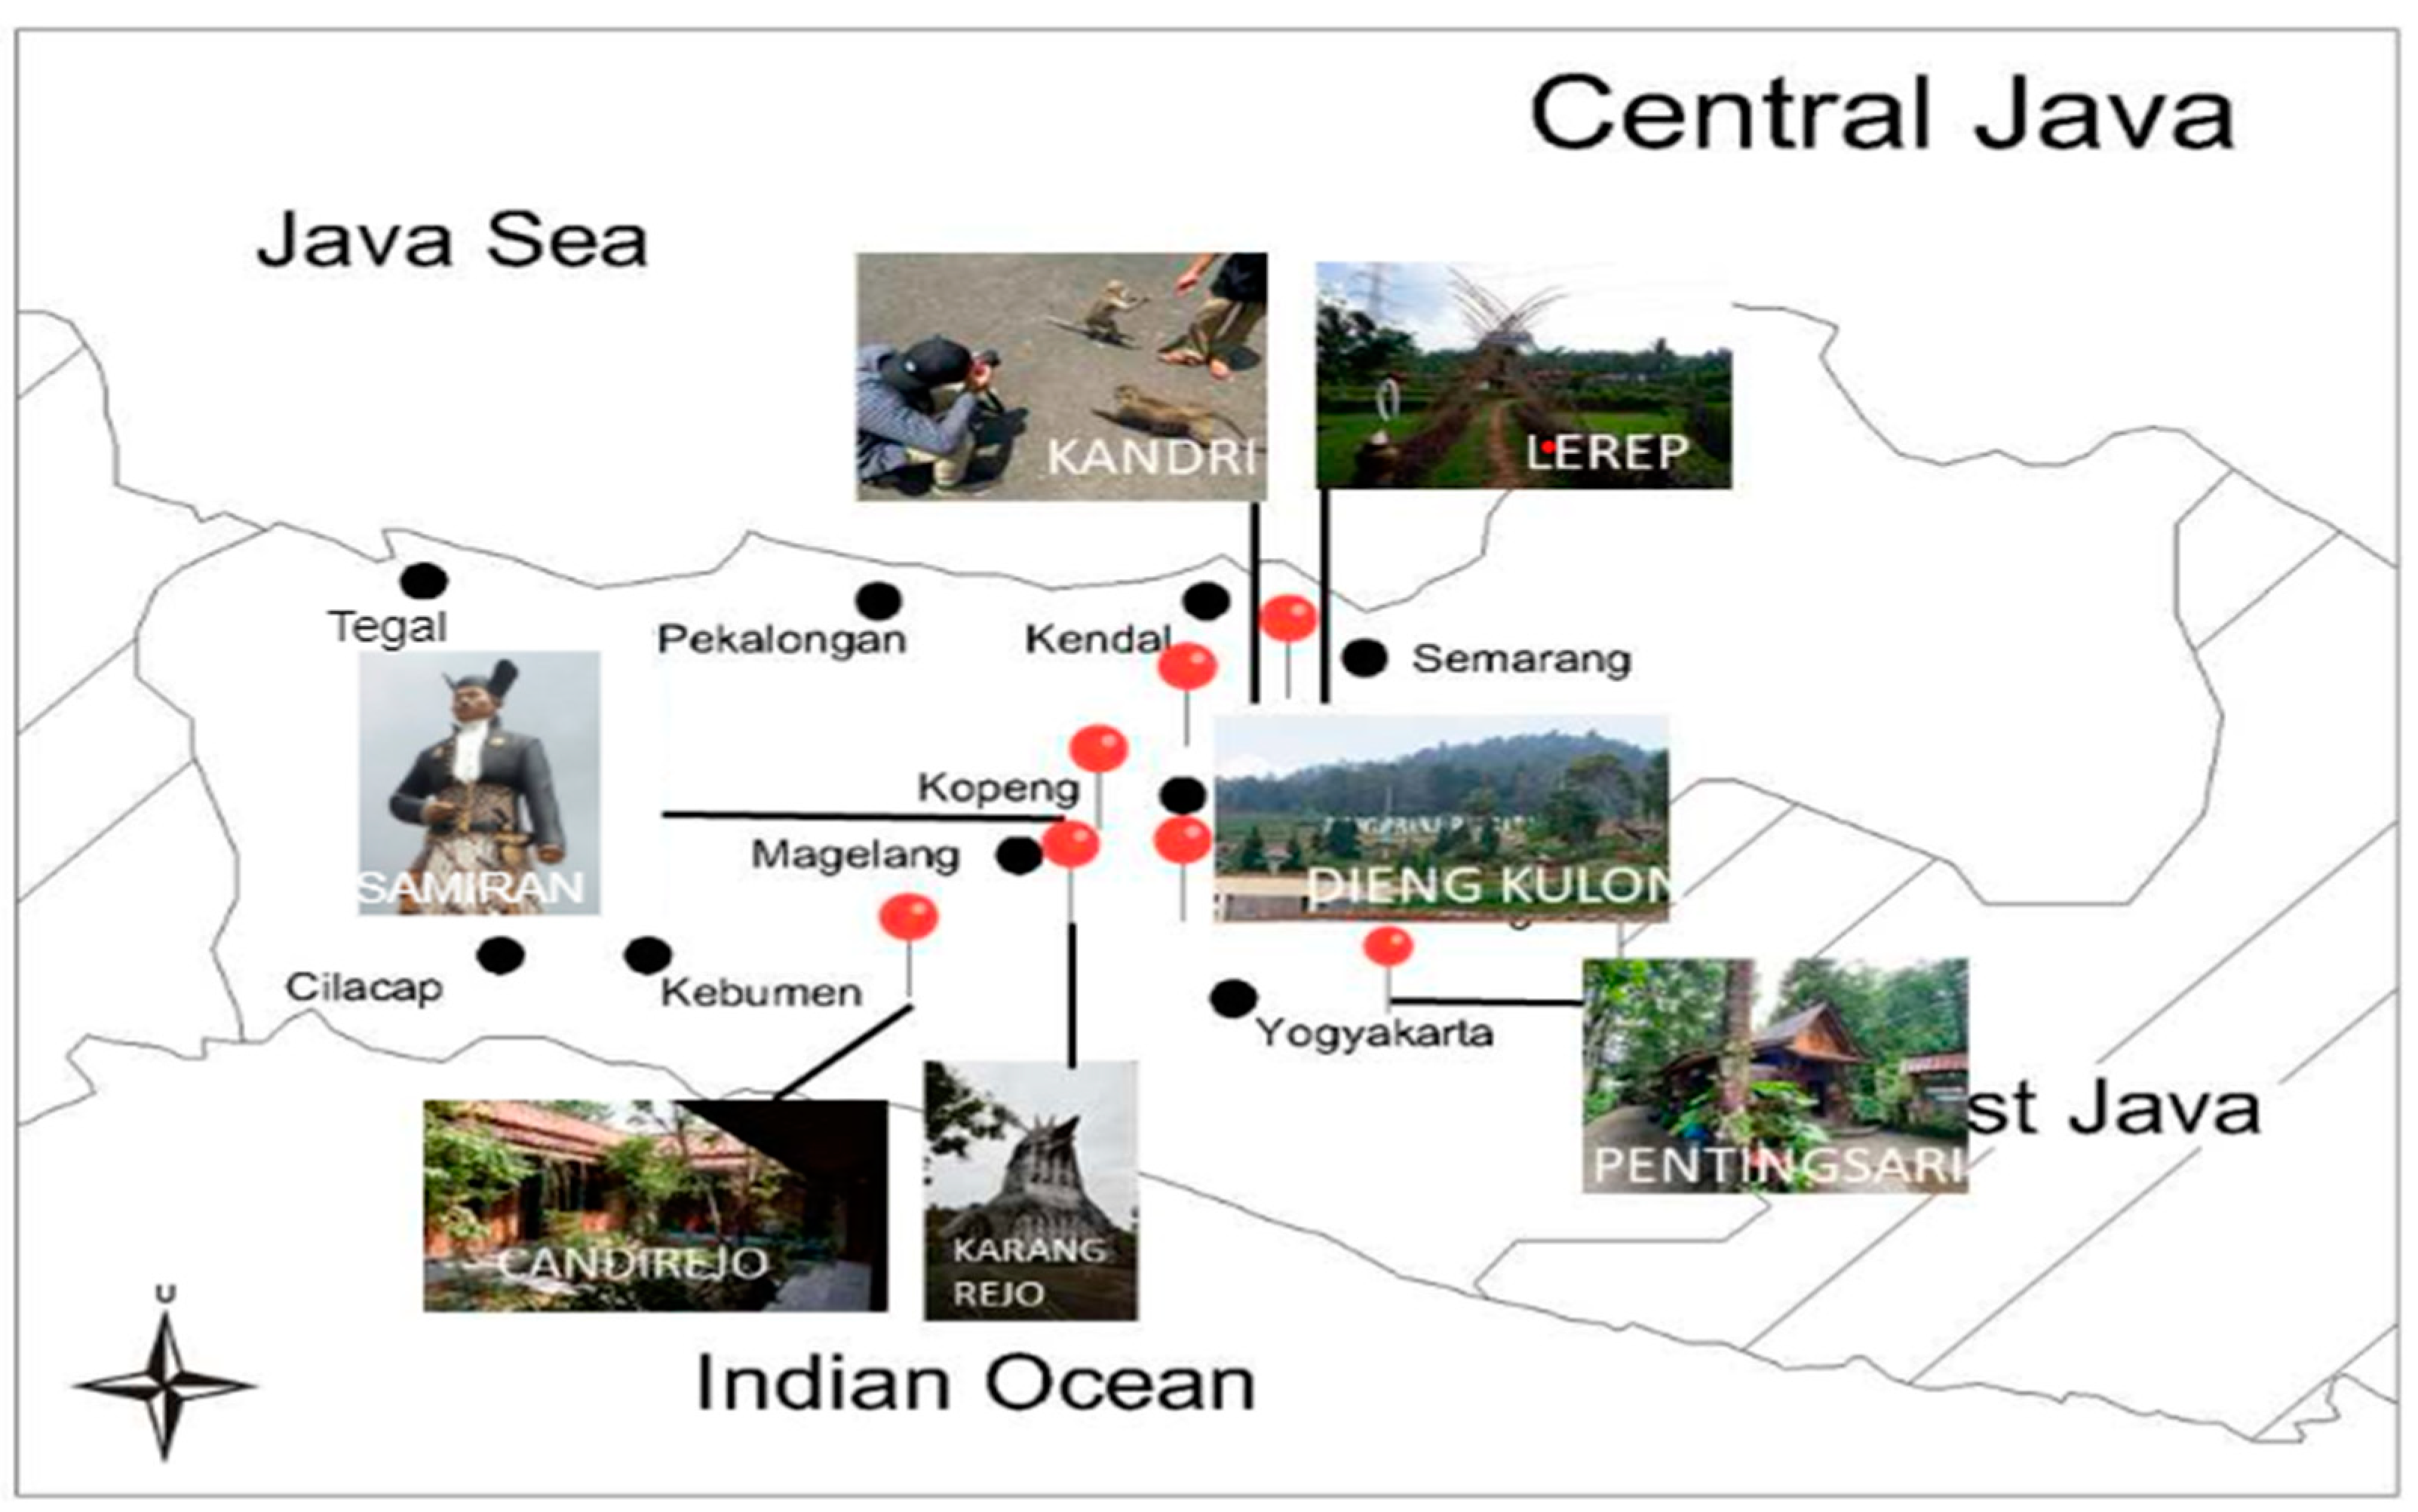
3.1. Resources and Visitor Arrival in Tourism Village
3.2. Solid Waste Carbon Footprint
3.3. Building’s Carbon Footprint
4. Discussion
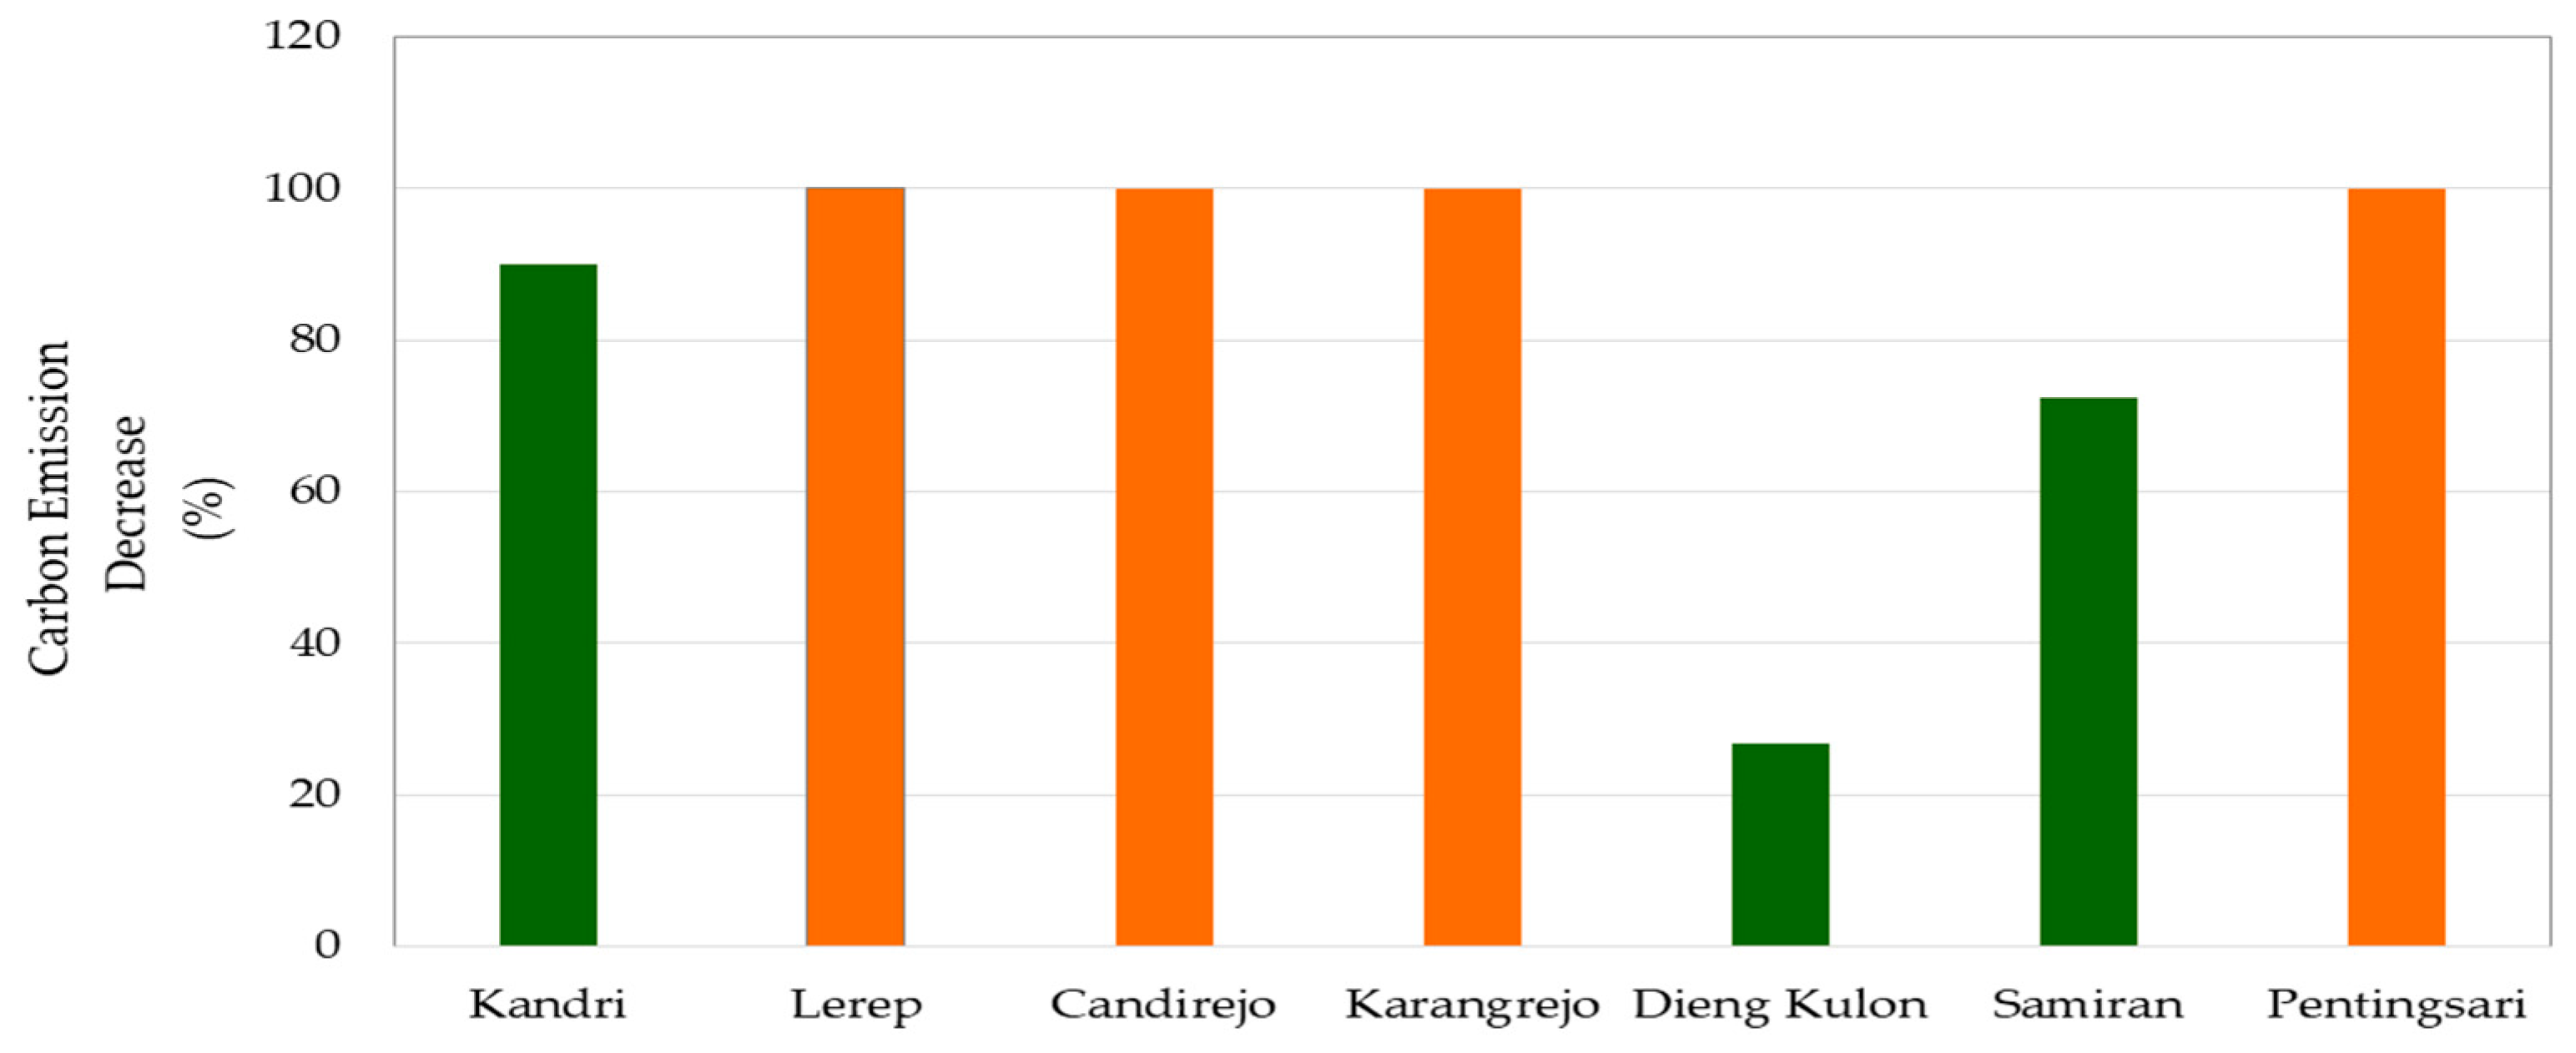
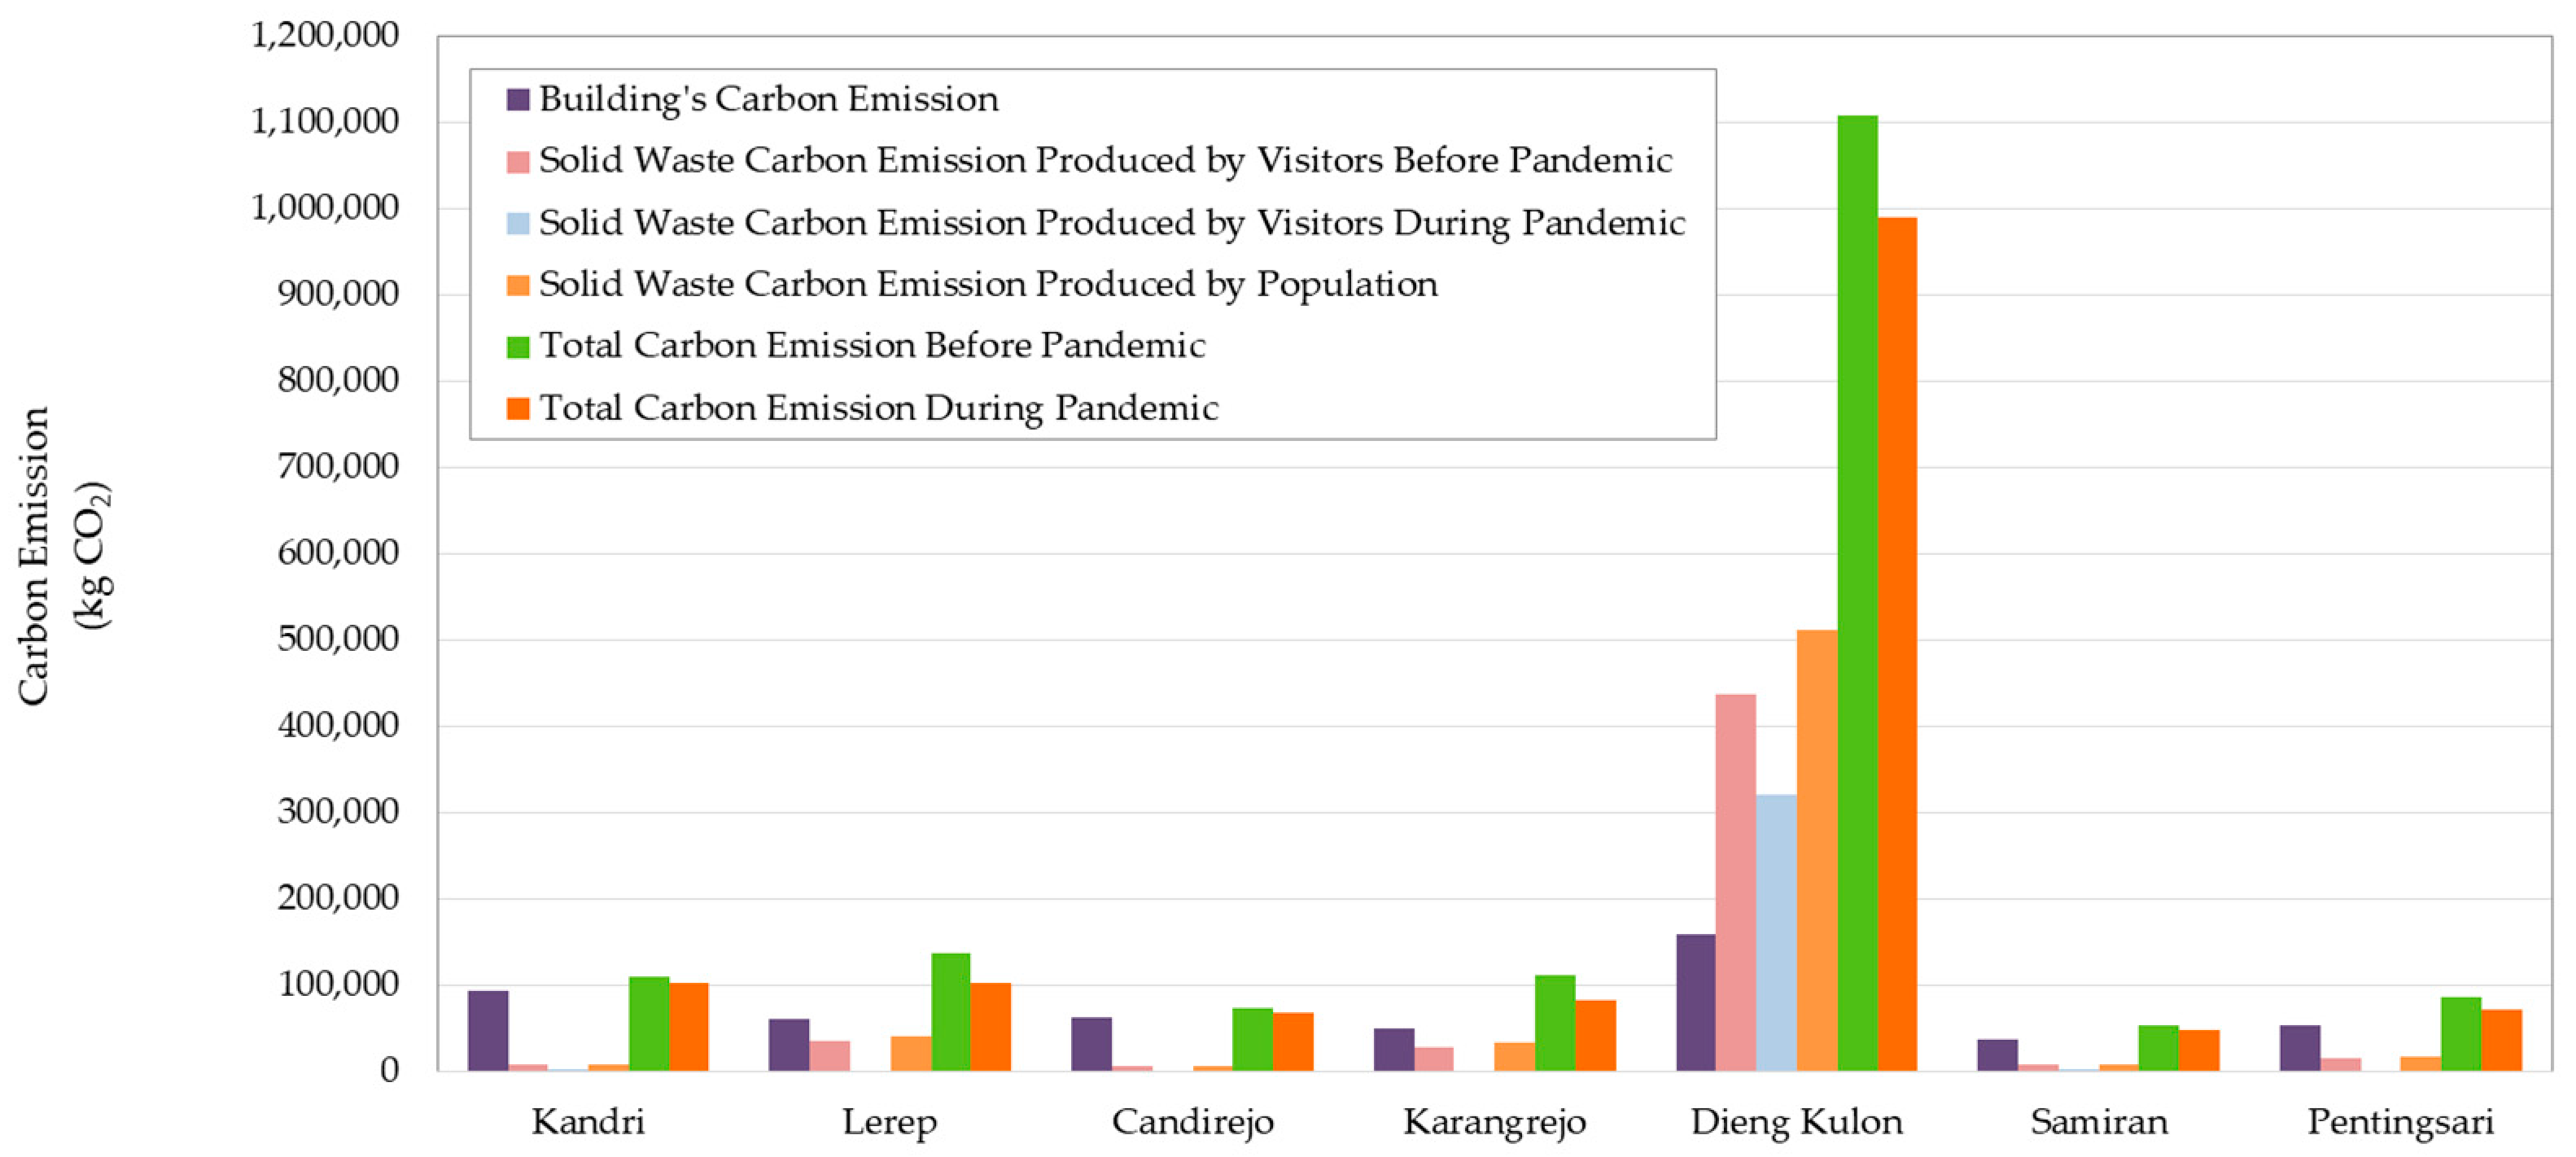
4.1. Carbon Footprint Analysis
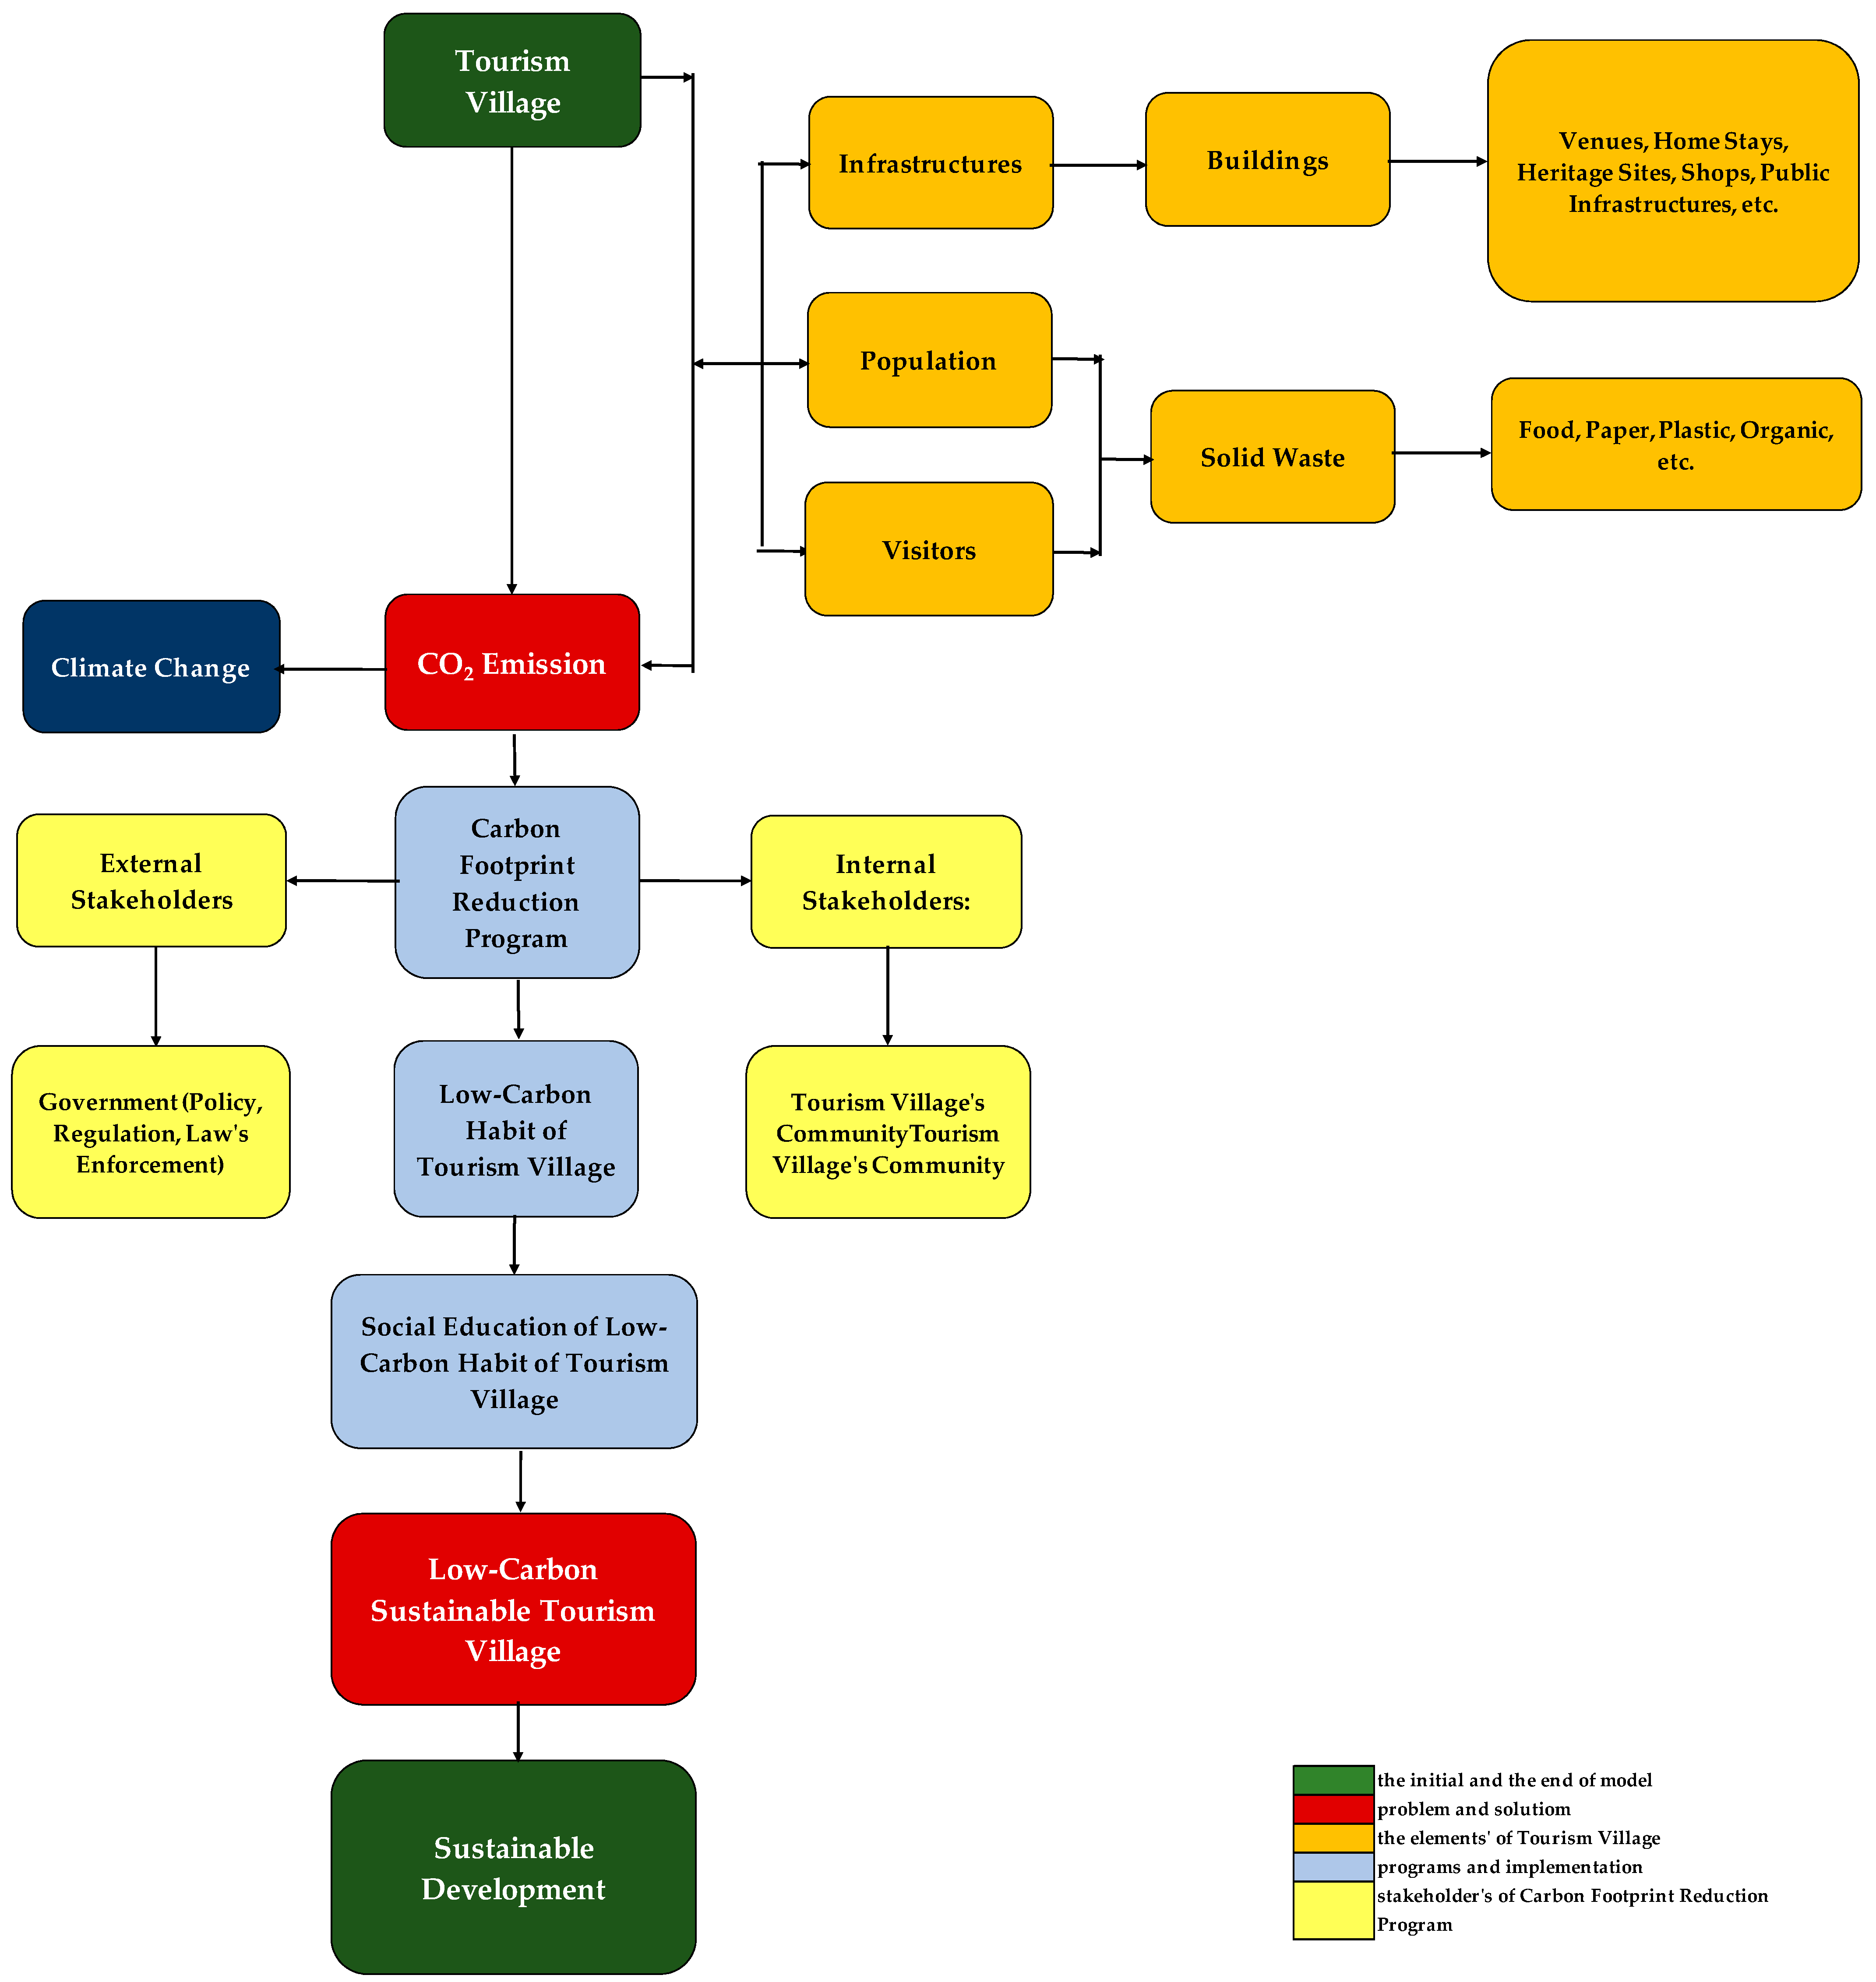
4.2. Comprehensive Model
5. Conclusions
Author Contributions
Funding
Institutional Review Board Statement
Informed Consent Statement
Data Availability Statement
Acknowledgments
Conflicts of Interest
References
- Masson-Delmotte, V.; Zhai, P.; Chen, Y.; Goldfarb, L.; Gomis, M.I.; Matthews, J.B.R.; Berger, S.; Huang, M.; Yelekçi, O.; Yu, R.; et al. Working Group I Contribution to the Sixth Assessment Report of the Intergovernmental Panel on Climate Change; Cambridge University Press: Cambridge, UK, 2021; In Press. [Google Scholar]
- Nurhidayah, L. Sea-level rise (slr) and its implication on human security and human rights in indonesia: A legal analysis. Springer Clim. 2021, 2021, 33–52. [Google Scholar] [CrossRef]
- Triyanti, A.; Marfai, M.A.; Mei, E.T.W.; Rafliana, I. Review of socio-economic development pathway scenarios for climate change adaptation in indonesia: Disaster risk reduction perspective. In Climate Change Research, Policy and Actions in Indonesia; Springer: Cham, Switzerland, 2021; ISBN 9783030555351. [Google Scholar]
- Lenzen, M.; Sun, Y.Y.; Faturay, F.; Ting, Y.P.; Geschke, A.; Malik, A. The carbon footprint of global tourism. Nat. Clim. Chang. 2018, 8, 522–528. [Google Scholar] [CrossRef]
- Sun, Y.; Malik, A. Tourism’s Alarming—and Growing—Carbon Footprint. Available online: https://www.brinknews.com/tourisms-alarming-and-growing-carbon-footprint/ (accessed on 10 December 2021).
- Yang, W.; Zhao, R.; Chuai, X.; Xiao, L.; Cao, L.; Zhang, Z.; Yang, Q.; Yao, L. China’s pathway to a low carbon economy. Carbon Balance Manag. 2019, 14, 14. [Google Scholar] [CrossRef] [PubMed] [Green Version]
- Bhaktikul, K.; Aroonsrimorakot, S.; Laiphrakpam, M.; Paisantanakij, W. Toward a low-carbon tourism for sustainable development: A study based on a royal project for highland community development in Chiang Rai, Thailand. Environ. Dev. Sustain. 2021, 23, 10743–10762. [Google Scholar] [CrossRef]
- Töbelmann, D.; Wendler, T. The impact of environmental innovation on carbon dioxide emissions. J. Clean. Prod. 2020, 244, 118787. [Google Scholar] [CrossRef]
- He, J.; Tu, X. On Sustainable Development of Low-carbon Tourism in Jiangxi Province. J. Phys. Conf. Ser. 2020, 1549, 1–6. [Google Scholar] [CrossRef]
- Qiao, G.; Gao, J. Chinese tourists’ perceptions of climate change and mitigation behavior: An application of norm activation theory. Sustainability 2017, 9, 1322. [Google Scholar] [CrossRef] [Green Version]
- Saputra, E. An analysis of tourist carbon footprint in Indonesia—The case of D.I. Yogyakarta. Geogr. Malays. J. Soc. Sp. 2013, 9, 24–37. [Google Scholar]
- Tang, C.; Wan, Z.; Ng, P.; Dai, X.; Sheng, Q.; Da, C. Temporal and spatial evolution of carbon emissions and their influencing factors for tourist attractions at heritage tourist destinations. Sustainability 2019, 11, 5944. [Google Scholar] [CrossRef] [Green Version]
- Su, J. Impact of tourism resource development based on low-carbon mode: A case study of Guizhou ethnic areas. Ecol. Process. 2019, 8, 21. [Google Scholar] [CrossRef]
- UNWTO. World Tourism Barometer; UNWTO: Madrid, Spain, 2021; Volume 19. [Google Scholar]
- Vanzetti, D. Peters Ralf COVID-19 and Tourism: An Update—Assessing the Economic Consequences 2021. Available online: https://unctad.org/system/files/official-document/ditcinf2021d3_en_0.pdf (accessed on 12 January 2022).
- UNWTO. Tourism and COVID-19—Unprecedented Economic Impacts. Available online: https://www.unwto.org/tourism-and-covid-19-unprecedented-economic-impacts (accessed on 30 December 2021).
- Obersteiner, G.; Gollnow, S.; Eriksson, M. Carbon Footprint Reduction Potential of Waste Management Strategies in Tourism. Environ. Dev. 2021, 39, 100617. [Google Scholar] [CrossRef] [PubMed]
- Martins, A.M.; Cró, S. The Impact of Tourism on Solid Waste Generation and Management Cost in Madeira Island for the Period 1996–2018. Sustainability 2021, 13, 5238. [Google Scholar] [CrossRef]
- Larasti, A.K. Environmental Impacts Management of the Coachella Valley Music and Arts Festival. Tour. J. Pariwisata 2020, 2, 56. [Google Scholar] [CrossRef]
- Widyarsana, I.M.W.; Agustina, E. Waste Management Study In The Archipelago Tourism Area (Case Study: Nusa Penida District, Bali Province, Indonesia). E3S Web Conf. 2020, 148, 05002. [Google Scholar] [CrossRef]
- Muñoz, E.; Navia, R. Waste Management in Touristic Regions. Waste Manag. Res. 2015, 33, 593–594. [Google Scholar] [CrossRef]
- Wu, W.; Zhang, X.; Yang, Z.; Wall, G.; Wang, F. Creating a low carbon tourism community by public cognition, intention and behaviour change analysisa case study of a heritage site (Tianshan Tianchi, China). Open Geosci. 2017, 9, 197–210. [Google Scholar] [CrossRef] [Green Version]
- Röck, M.; Saade, M.R.M.; Balouktsi, M.; Rasmussen, F.N.; Birgisdottir, H.; Frischknecht, R.; Habert, G.; Lützkendorf, T.; Passer, A. Embodied GHG Emissions of Buildings—The Hidden Challenge for Effective Climate Change Mitigation. Appl. Energy 2020, 258, 114107. [Google Scholar] [CrossRef]
- UN Environment Programme 2020 Global Status Report for Buildings and Construction. Glob. Status Rep. 2020, 2020, 20–24.
- Shang, M.; Geng, H. A study on Carbon Emission Calculation of Residential Buildings Based on Whole Life Cycle Evaluation. E3S Web Conf. 2021, 261. [Google Scholar] [CrossRef]
- Bowyer, J. Carbon Implications of Building Materials Selection; The Wood Products Council: Minneapolis, MA, USA, 2015. [Google Scholar]
- Sari, D.; Rizki, M.; Nathania, B.; Ahmad, M.; Gunawam Gan, P.; Noor, N. Indonesia Zero Emissions Application (EMISI): Methodology for Calculating Individual Emissions from Food, Clothing, Electricity Consumption, and Solid Waste. World Resour. Inst. 2021. [Google Scholar] [CrossRef]
- Nurhadi, M.; Budiarti, R. Timbunan Sampah Harian Pada Rumah Tangga; Bintari Foundation: Semarang, Indonesia, 2020. [Google Scholar]


| Subject | Emission Factor |
|---|---|
| Rural-Household-Solid Waste-Inorganic | 0.668 |
| Rural-Household-Solid Waste-Organic | 0.45 |
| Solid Waste | Production per Person per Day (kg) | Production per Person per Month (30 Days) (kg) |
|---|---|---|
| Food | 0.0232 | 0.696 |
| Paper | 0.0753 | 2.259 |
| Plastic | 0.0662 | 1.986 |
| Organic | 0.3305 | 9.915 |
| No. | Tourism Village | Venues | Tourism Products |
|---|---|---|---|
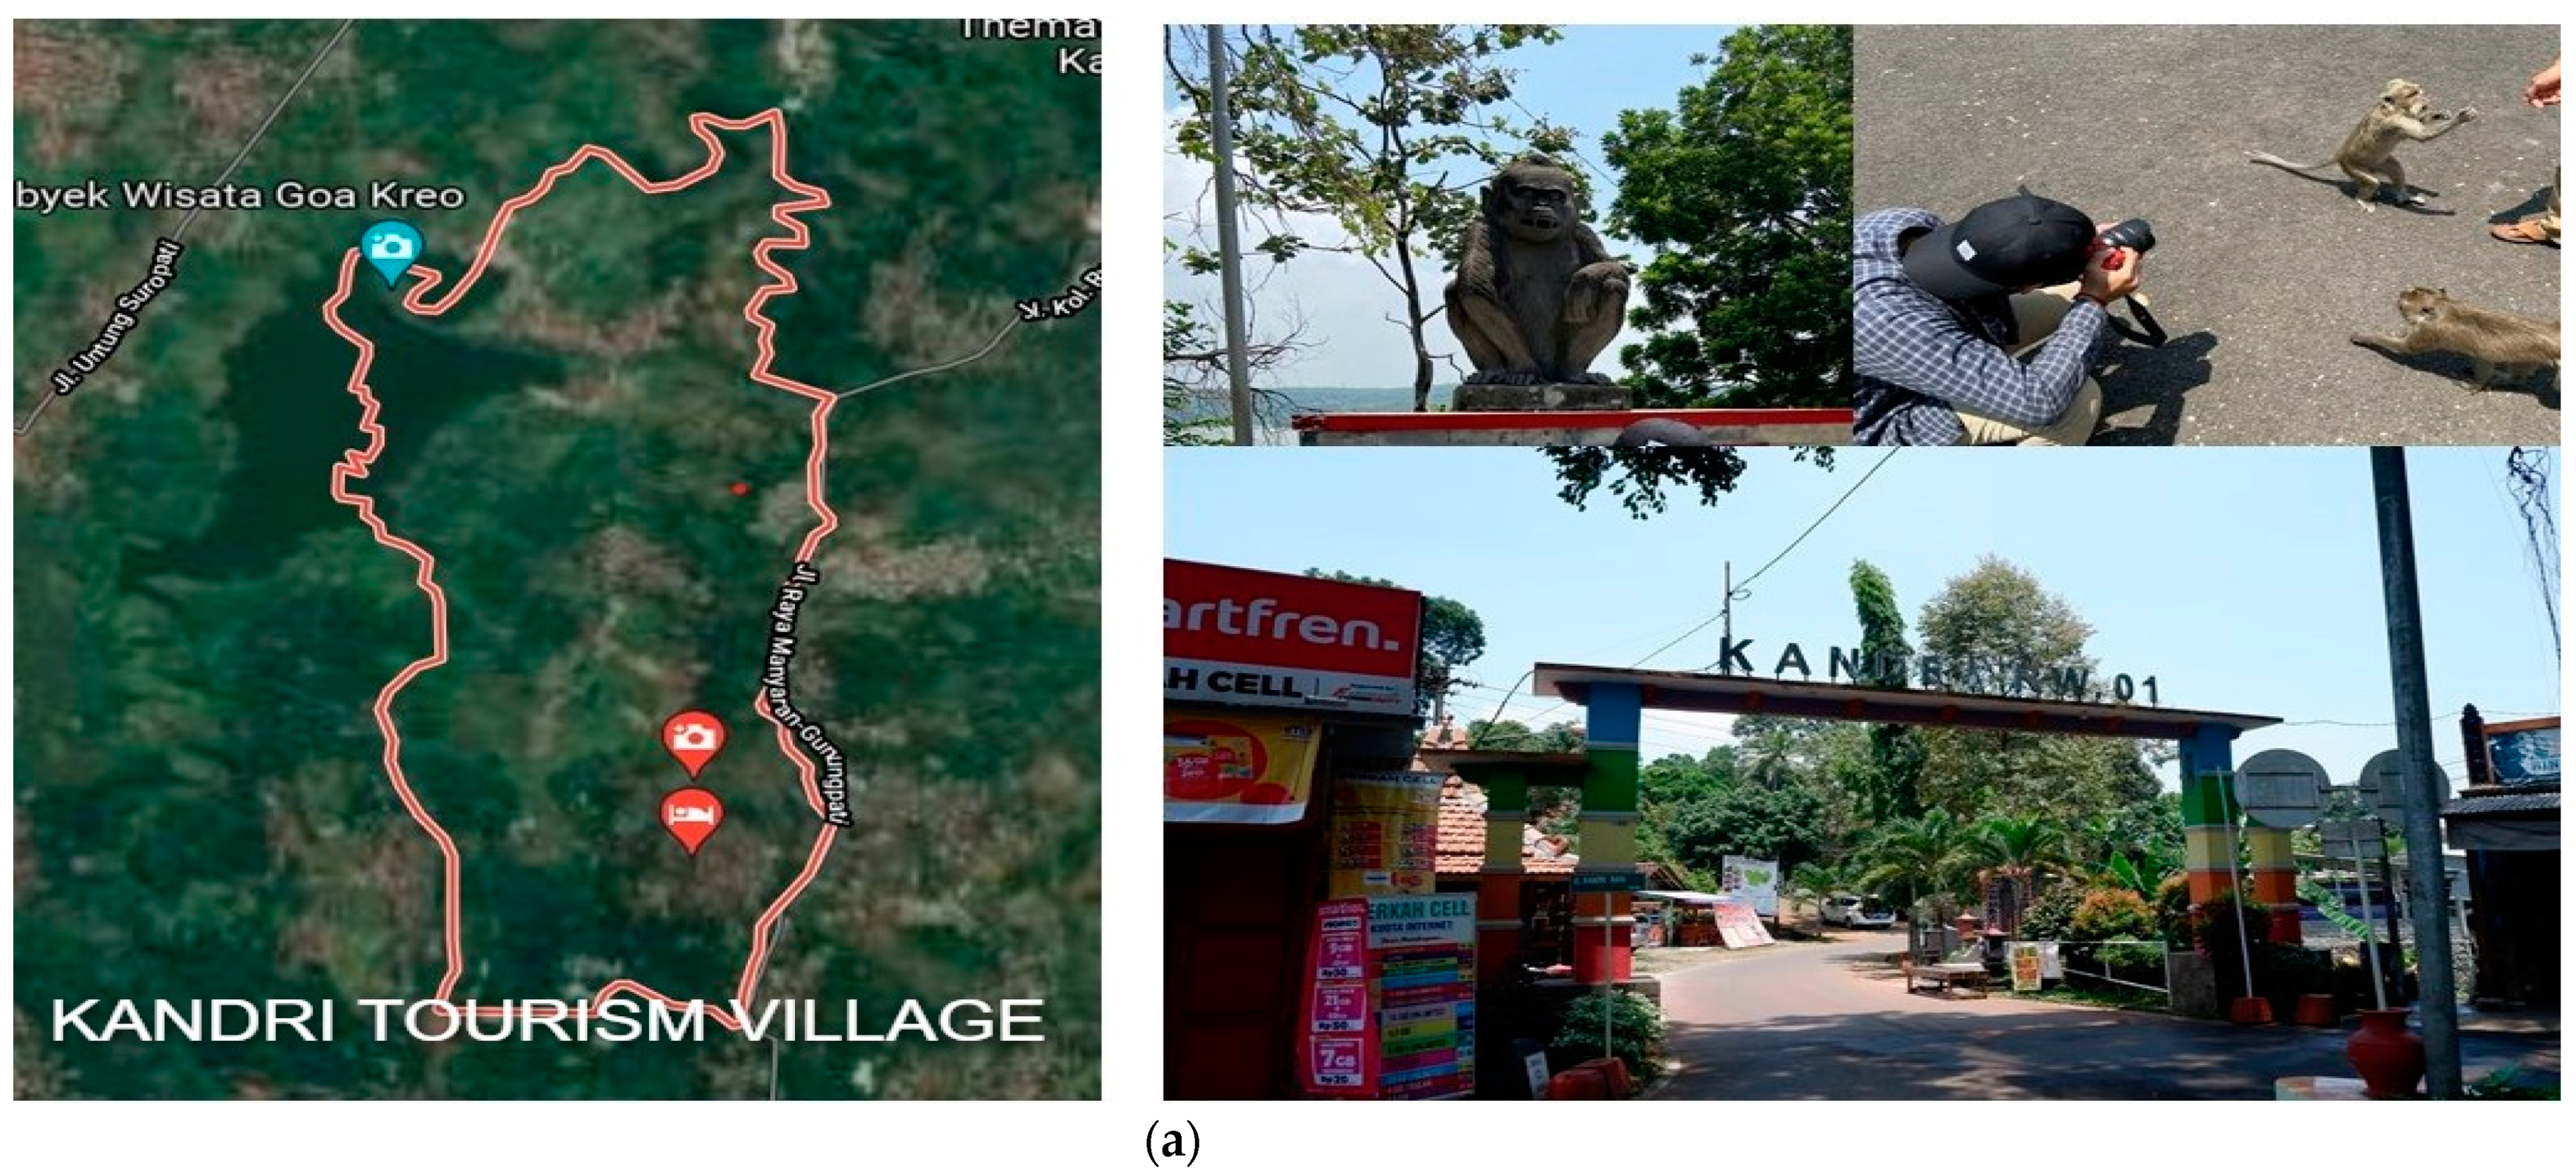
| 1. | Kandri | (1) Natural venues: Kandri Lake, Gede Lake, Jamu Lake, Kreo Cave, Monkeys population at Kreo Cave; Jatibarang Dam; (2) Culinary venues: Centre of Chips and Cassava Production; Beverages product; Cassava product home industries (Omah Pohung); (3) Omah Alas Art and Culture Studio; (4) Tourist Information Centre; (5) Home Stays | Packages: “Paket Nyawah (Planted Paddy Package)”, “Paket Petik Jambu” (Picking Guava Package) |
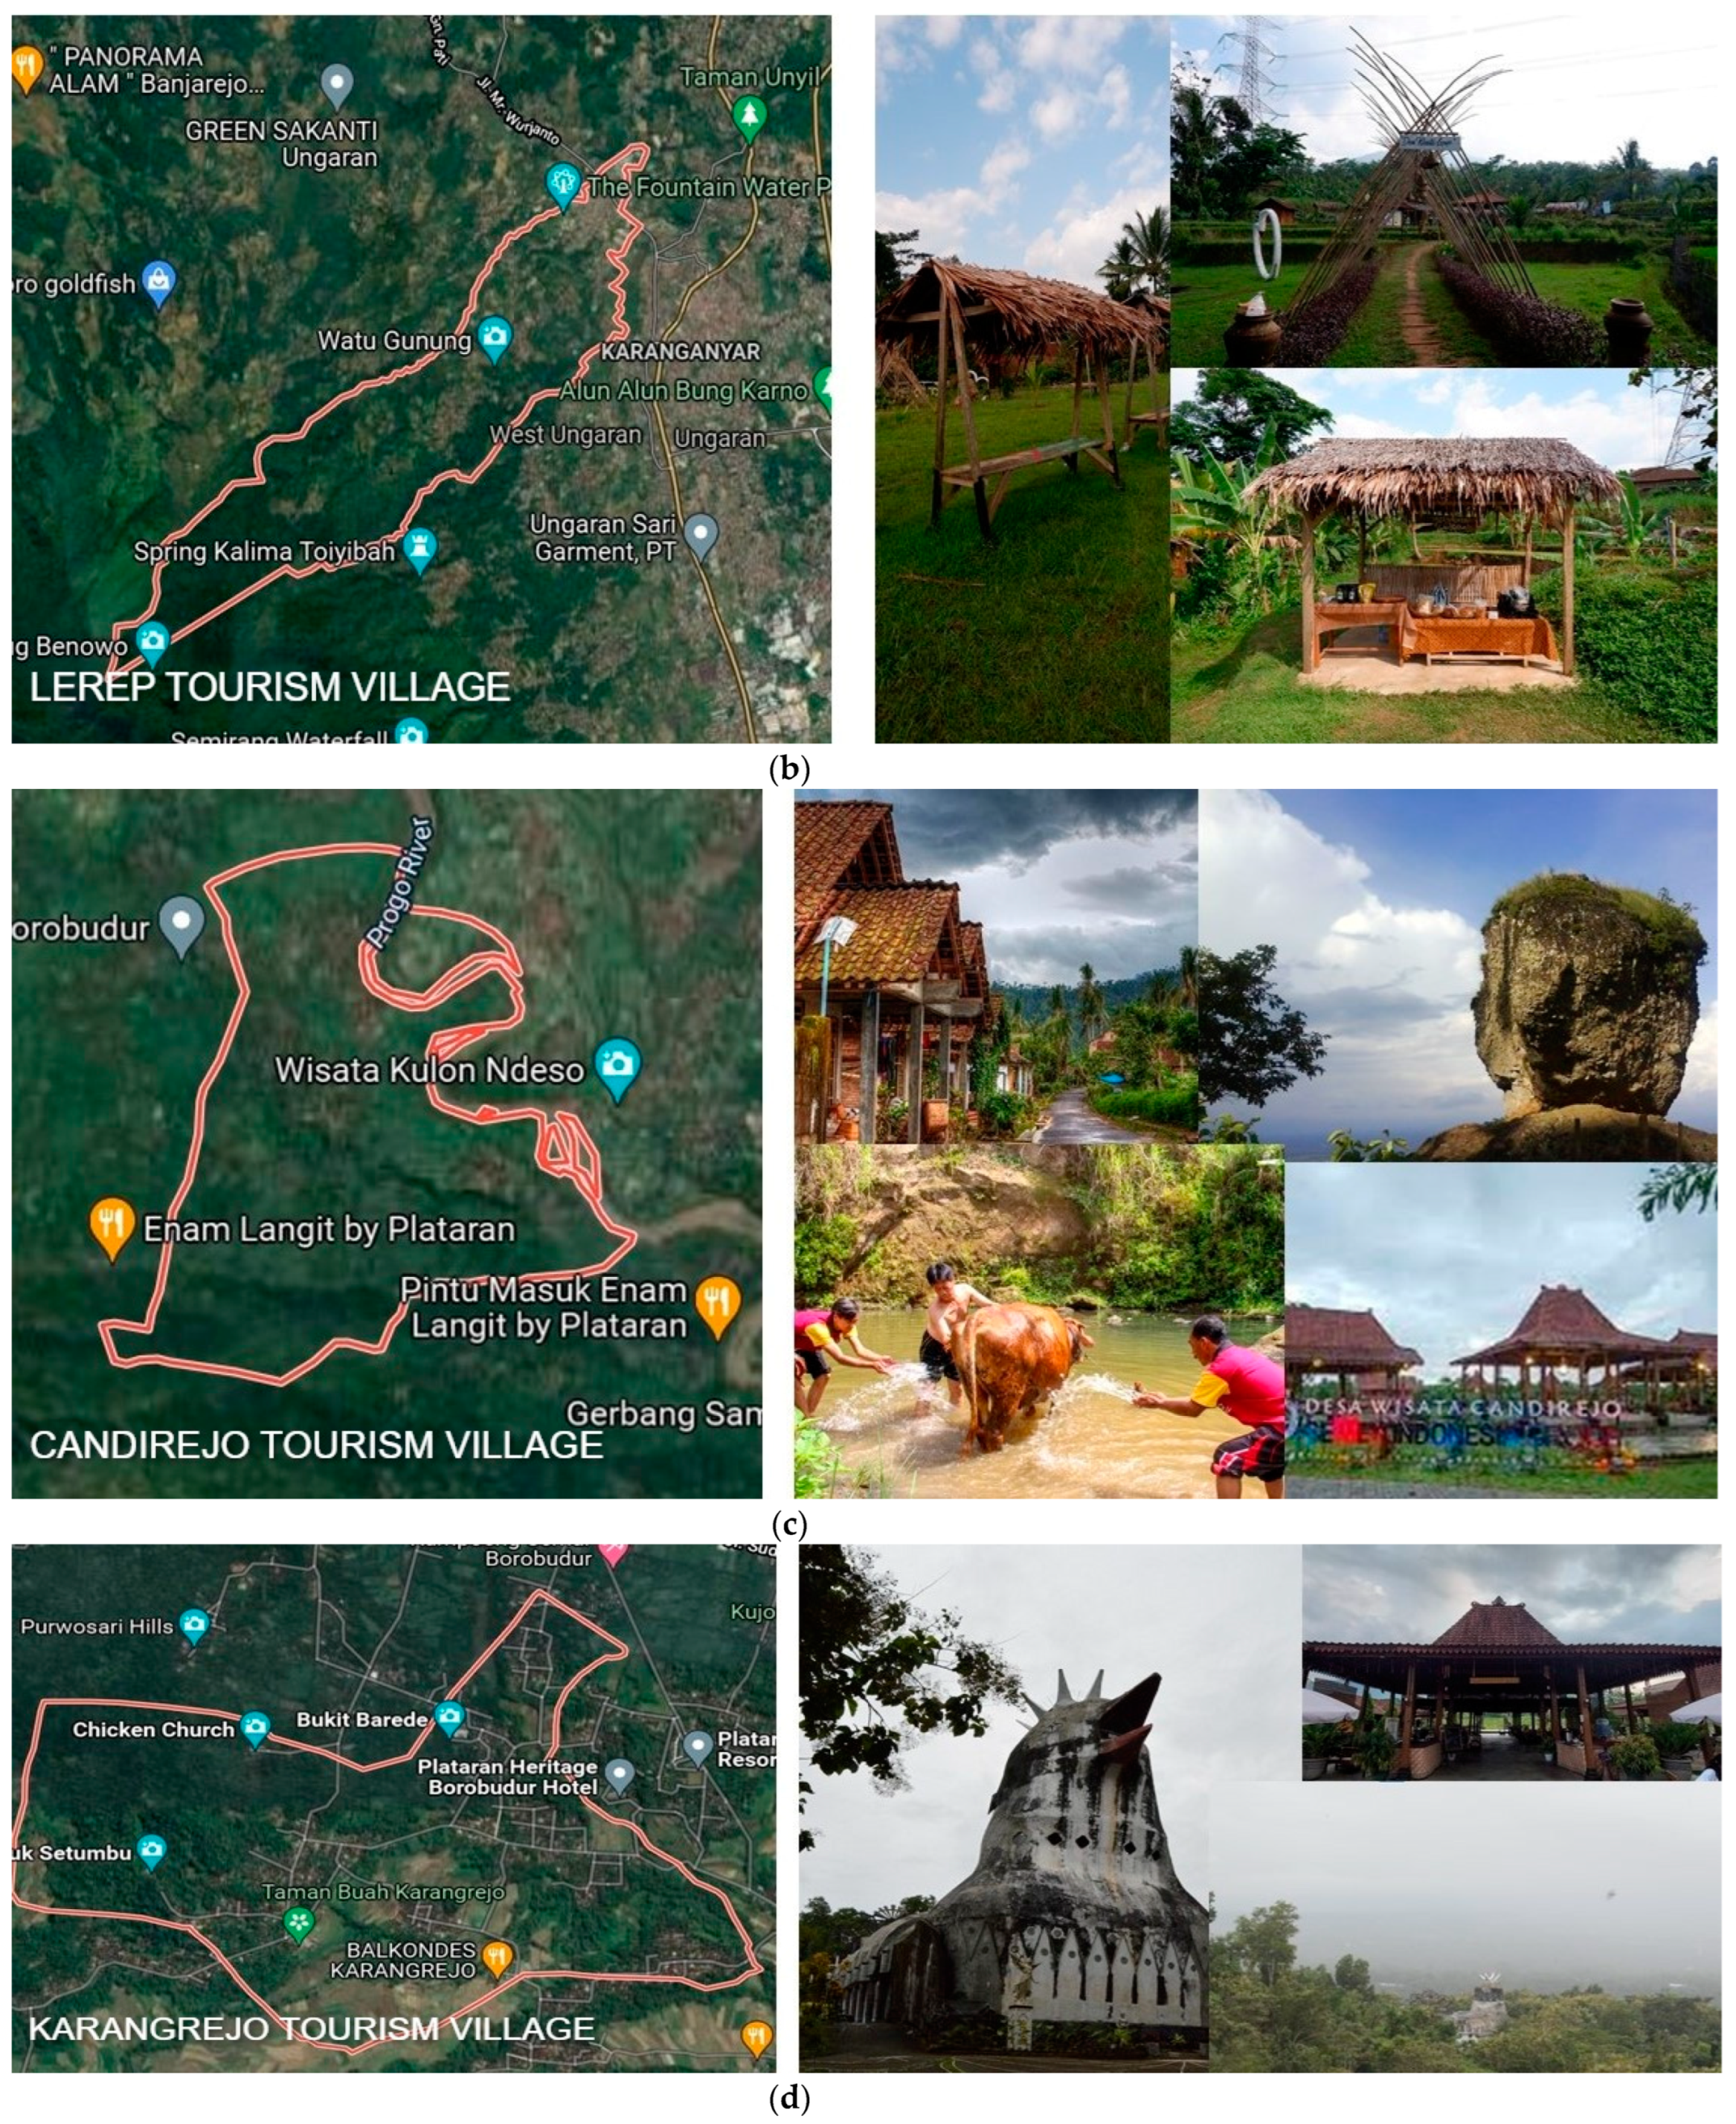
| 2. | Lerep | (1) Natural venues: Curug Indrakila Waterfall; Embung Sebligo Waterboom; Watu Gunung Natural Swimming Pool; (2) Home Stays | Packages: Education-Tourism Packages (A-F Packages), Eco-Edu Tour Package |
| 3. | Candirejo | (1) Natural sites: Watu Kendil, Tempuran, Tuk Banyu Asin (Ancient Lake); (2) Shops: Food product, stone handycraft, and miscellanous handycraft shops; (3) Home Stays | Packages: One Day Field Trip, Half-Day Field Trip, Live In, Rafting, Dokar (horse cart) Village Tour, Cycling Tour, Live-In, Walking-Around Village, Village Experience, Cooking Lesson, Traditional Dance |
| 4. | Karangrejo | (1) Natural venues: Punthu Setumbuk (Dove Hill), Barede Hill, Chicken Churh, Karangrejo Fruit Park; (2) Shops: Batik Shop, Culinary Shops; (3) Home Stays; (4) Events: Sedekah Bumi (Traditional Thanksgiving Ceremony), Desa Budaya (Cultural Village) | Packages: Traditional Farming Education, Jeep Sumringah Tour, VW (Volks Wagen) Sumilir Packages, Onthel Manunggal (Biking Tour) |
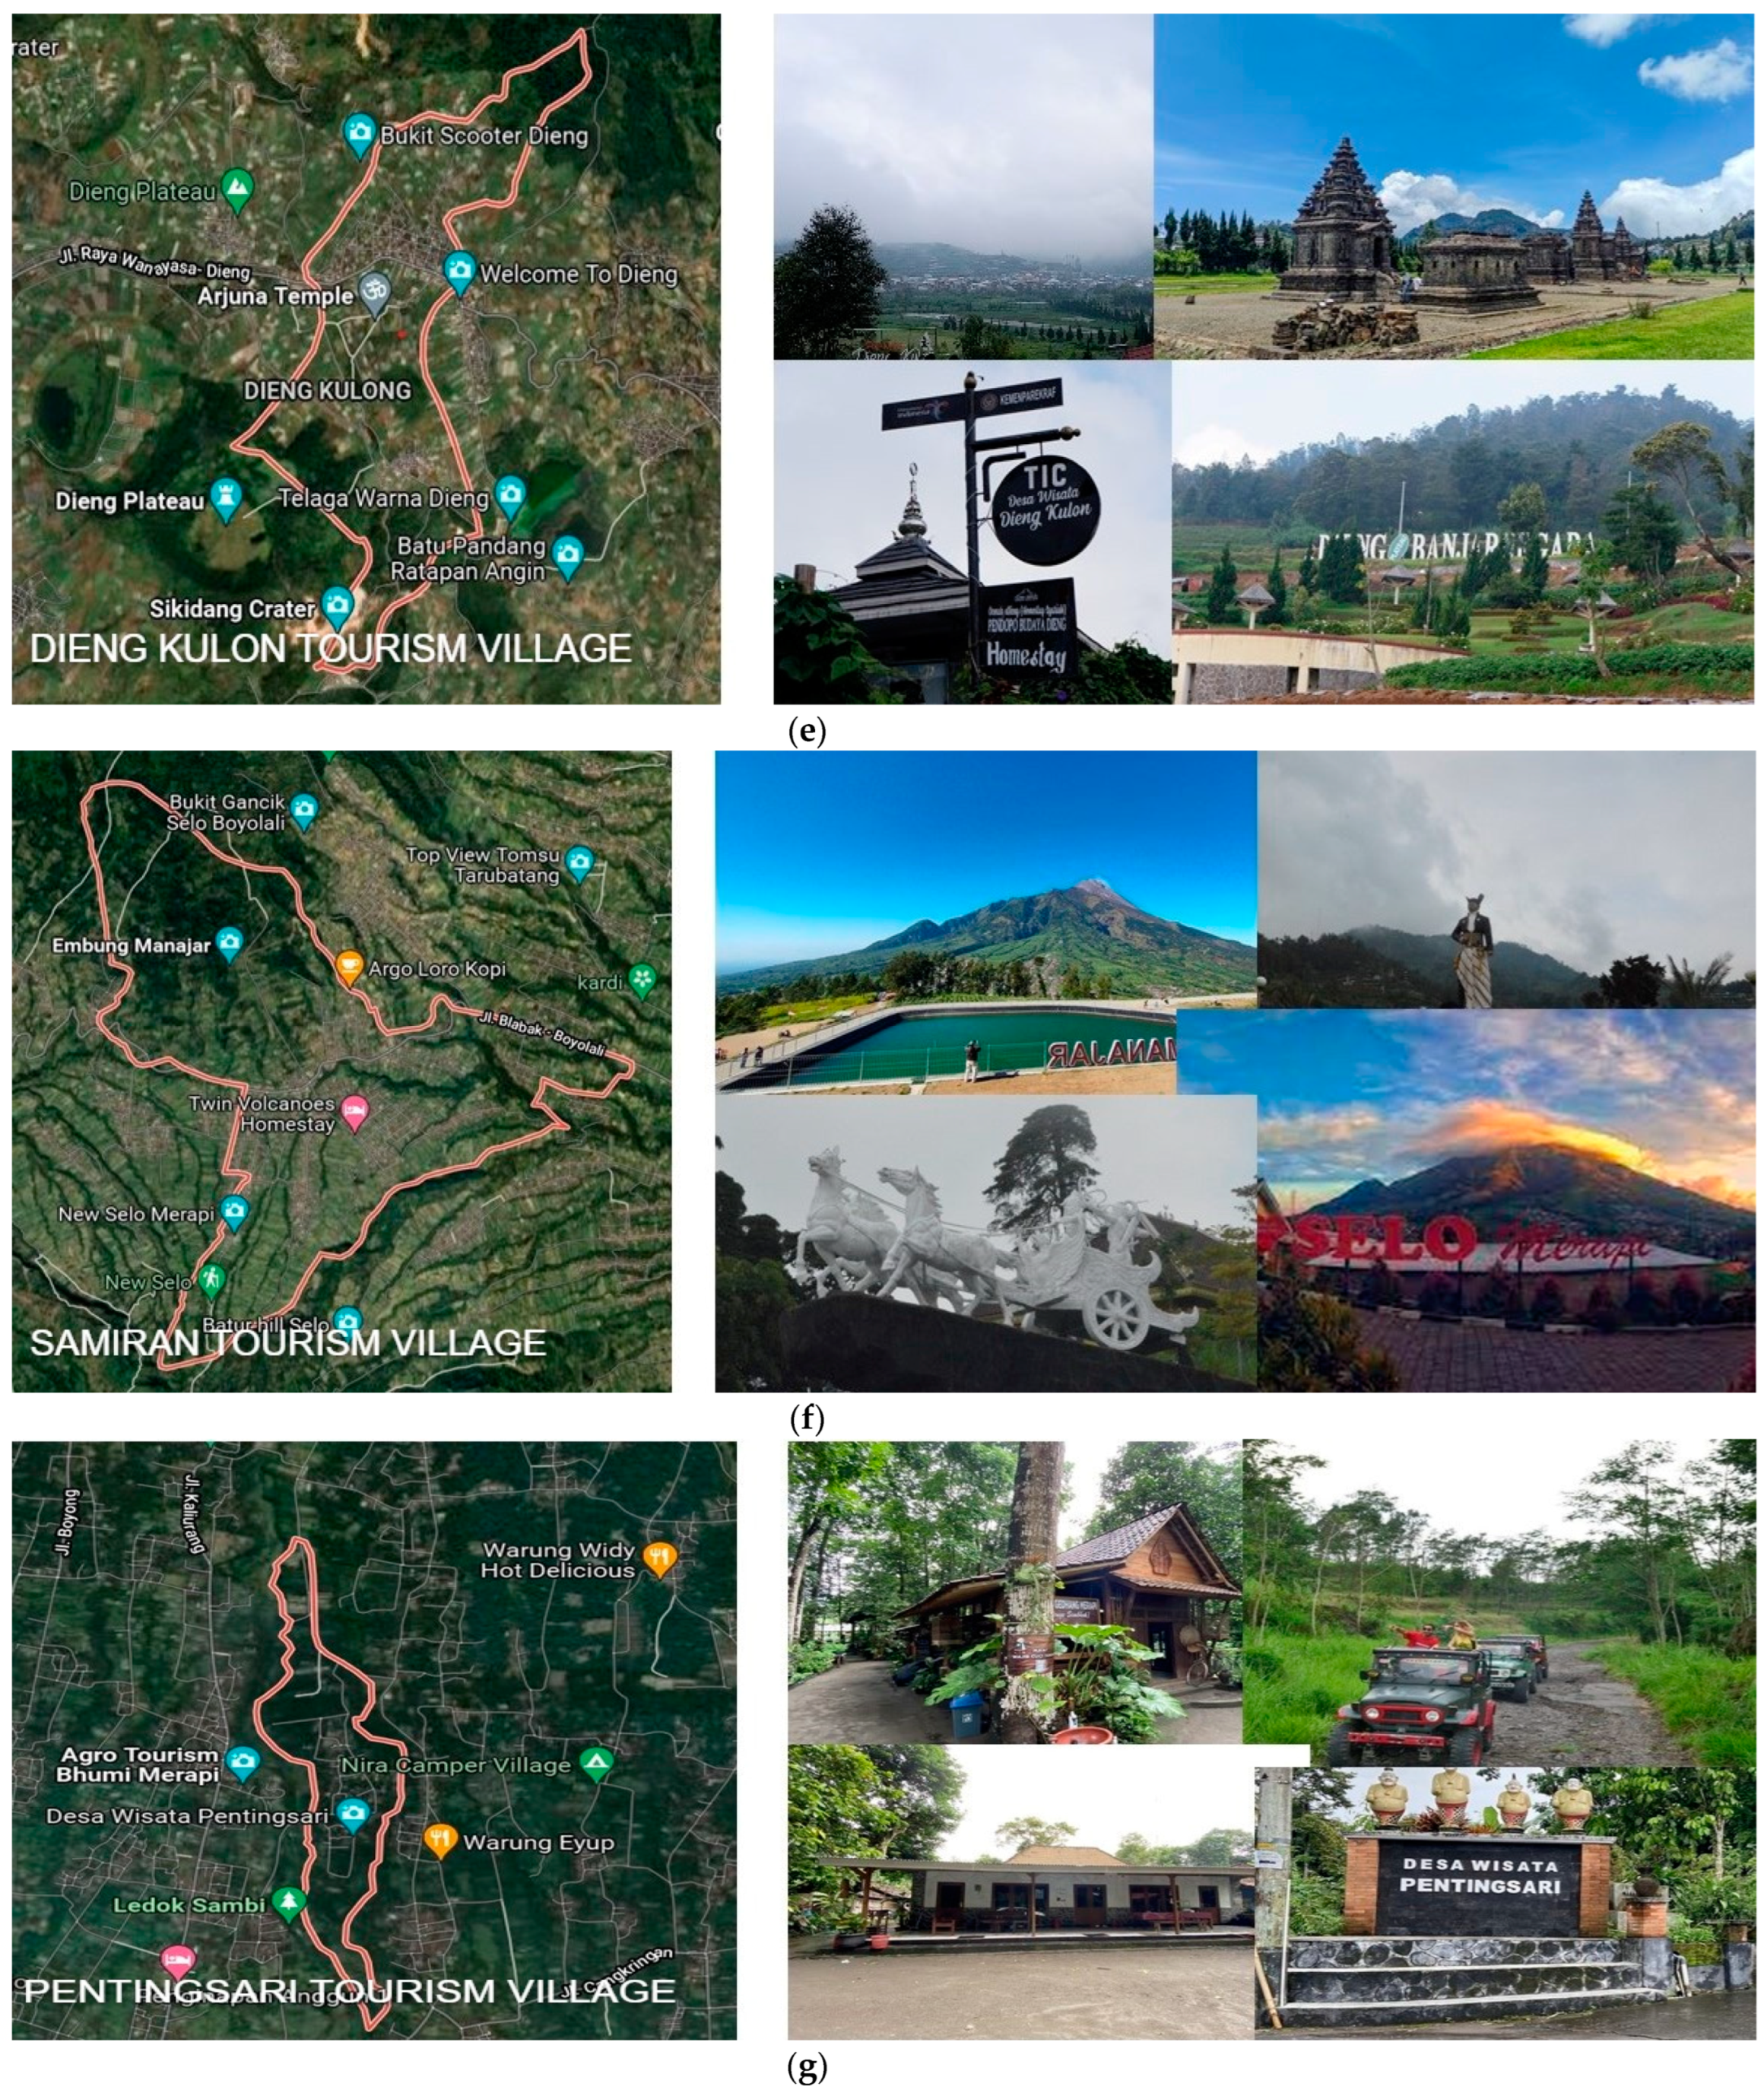
| 5. | Dieng Kulon | (1) Natural venues: Sikidang Crater, Arjuna Temple, and Kaliasa Dieng Museum; (2) Culinary shops; (3) Home Stays; (4) Events: Dieng Kulon Festival, Jazz Above the Sky | Non-Package |
| 6. | Samiran | (1) Natural venues: Gua Raja (King Cave), Petilasan Kebo Kanigara (Kebo Kanigara) Heritage Site, Mt. Merapi, Mt. Merbabu, Argadewi Agro-Tourism; (2) Shops: Diary products shops, Vegetables Shops; (3) Home Stays | Packages: custom-made packages, One-Day Package, Two-Days Package, Wisata Petik Sayur (Picking Vegetables Package), learning gamelan (traditional Javanese music instruments) packages, milking cows learning package, Reog Dance learning package. |
| 7. | Pentingsari | (1) Natural venue: Outbond Area; (2) Restaurants: Warunge Simbok (Mom’s Cafetaria); (3) Shops: Batik Shop, Culinary Shops; (4) Home Stays | Packages: Family Package, Live-In; Jeep Lava Tour Merapi |
| No. | Tourism Village | Area (km2) | Population (Person) | Population Density (Person/km2) |
|---|---|---|---|---|
| 1. | Kandri | 319.64 | 3797 | 11.88 |
| 2. | Lerep | 682 | 9000 | 13.20 |
| 3. | Candirejo | 300.63 | 4700 | 15.63 |
| 4. | Karangrejo | 174 | 3016 | 17.33 |
| 5. | Dieng Kulon | 210 | 5300 | 25.24 |
| 6 | Samiran | 631.11 | 3715 | 5.89 |
| 7 | Pentingsari | 103 | 390 | 3.79 |
| No. | Tourism Village | Population (Person) | Visitor’s Arrival per Month | The Ratio of Visitor to Population | ||
|---|---|---|---|---|---|---|
| Before Pandemic (Person) | During Pandemic (Person) | Before Pandemic (%) | During Pandemic (%) | |||
| 1. | Kandri | 3797 | 1000 | 100 | 26.34 | 2.63 |
| 2. | Lerep | 9000 | 4942 | 0 | 54.91 | 0 |
| 3. | Candirejo | 4700 | 750 | 0 | 15.96 | 0 |
| 4. | Karangrejo | 3016 | 4000 | 0 | 132.63 | 0 |
| 5. | Dieng Kulon | 5300 | 61,500 | 45,000 | 1160.38 | 849.06 |
| 6. | Samiran | 3715 | 1030 | 285 | 27.73 | 7.67 |
| 7. | Pentingsari | 390 | 2083 | 0 | 534.10 | 0 |
| No. | Tourism Village | Visitor before Pandemic (Person/Month) | Solid Waste Volume per Category before Pandemic | Total Solid Waste Volume before Pandemic | |||
|---|---|---|---|---|---|---|---|
| Food (kg/Month) | Paper (kg/Month) | Plastic (kg/Month) | Organic (kg/Month) | ||||
| 1. | Kandri | 1000 | 696.00 | 2259.00 | 1986.00 | 9915.00 | 14,856.00 |
| 2. | Lerep | 4942 | 3439.63 | 11,163.98 | 9814.81 | 48,999.93 | 73,418.35 |
| 3. | Candirejo | 750 | 522.00 | 1694.25 | 1489.50 | 7436.25 | 11,142.00 |
| 4. | Karangrejo | 4000 | 2784.00 | 9036.00 | 7944.00 | 39,660.00 | 59,424.00 |
| 5. | Dieng Kulon | 61,500 | 42,804.00 | 138,928.50 | 122,139.00 | 609,772.50 | 913,644.00 |
| 6. | Samiran | 1030 | 716.88 | 2326.77 | 2045.58 | 10,212.45 | 15,301.68 |
| 7. | Pentingsari | 2083 | 1449.77 | 4705.50 | 4136.84 | 20,652.95 | 30,945.05 |
| No. | Tourism Village | Visitor during Pandemic (Person/Month) | Waste Volume per Category during Pandemic | Total Waste Volume during Pandemic | |||
|---|---|---|---|---|---|---|---|
| Food (kg/Month) | Paper (kg/Month) | Plastic (kg/Month) | Organic (kg/Month) | ||||
| 1. | Kandri | 100 | 69.60 | 225.90 | 198.60 | 991.50 | 1485.60 |
| 2. | Lerep | 0 | 0 | 0 | 0 | 0 | 0 |
| 3. | Candirejo | 0 | 0 | 0 | 0 | 0 | 0 |
| 4. | Karangrejo | 0 | 0 | 0 | 0 | 0 | 0 |
| 5. | Dieng Kulon | 45,000 | 31,320.00 | 101,655.00 | 89,370.00 | 446,175.00 | 668,520.00 |
| 6. | Samiran | 285 | 198.36 | 643.82 | 566.01 | 2825.78 | 4233.96 |
| 7. | Pentingsari | 0 | 0 | 0 | 0 | 0 | 0 |
| No. | Tourism Village | Emission Factor-Inorganic Waste | Emission Factor-Organic Waste | Solid Waste Carbon Emission Produced by Visitor | |
|---|---|---|---|---|---|
| Before Pandemic | During Pandemic | ||||
| (kg CO2/kg) | (kg CO2/kg) | ||||
| 1. | Kandri | 0.668 | 0.450 | 7118.15 | 711.81 |
| 2. | Lerep | 0.668 | 0.450 | 35,177.89 | 0.00 |
| 3. | Candirejo | 0.668 | 0.450 | 5338.61 | 0.00 |
| 4. | Karangrejo | 0.668 | 0.450 | 28,472.59 | 0.00 |
| 5. | Dieng Kulon | 0.668 | 0.450 | 437,766.10 | 320,316.66 |
| 6. | Samiran | 0.668 | 0.450 | 7331.69 | 2028.67 |
| 7. | Pentingsari | 0.668 | 0.450 | 14,827.10 | 0.00 |
| No. | Tourism Village | Type of Building | Total Number of Buildings | |||||
|---|---|---|---|---|---|---|---|---|
| Office | Hall | Home Stay | Public Toilet | Mosque | Shop | |||
| 1. | Kandri | 1 | 4 | 90 | 3 | 4 | 3 | 105 |
| 2. | Lerep | 1 | 3 | 50 | 4 | 13 | 20 | 91 |
| 3. | Candirejo | 1 | 3 | 80 | 8 | 15 | 5 | 112 |
| 4. | Karangrejo | 10 | 3 | 50 | 6 | 6 | 7 | 82 |
| 5. | Dieng Kulon | 1 | 3 | 265 | 0 | 11 | 60 | 340 |
| 6. | Samiran | 2 | 2 | 45 | 6 | 3 | 15 | 73 |
| 7. | Pentingsari | 1 | 6 | 50 | 40 | 2 | 6 | 105 |
| No. | Tourism Village | Area | Number of Buildings | Average Building’s Area | Total Building’s Area | Ratio of Building’s Number to Area |
|---|---|---|---|---|---|---|
| (ha) | (pcs) | (m2) | (m3) | (Building/m2) | ||
| 1. | Kandri | 320 | 105 | 133.33 | 14,000.00 | 0.33 |
| 2. | Lerep | 682 | 91 | 100.00 | 9100.00 | 0.13 |
| 3. | Candirejo | 301 | 112 | 83.33 | 9333.33 | 0.37 |
| 4. | Karangrejo | 174 | 82 | 90.00 | 7380.00 | 0.47 |
| 5. | Dieng Kulon | 210 | 340 | 70.00 | 23,800.00 | 1.62 |
| 6. | Samiran | 631 | 73 | 76.67 | 5596.67 | 0.12 |
| 7. | Pentingsari | 103 | 105 | 76.67 | 8050.00 | 1.02 |
| No. | Tourism Village | Building’s CO2 Emission (kg CO2/m2) | Total Building’s CO2 Emission (kg CO2/m2) | |||||
|---|---|---|---|---|---|---|---|---|
| Office | Hall | Home Stay | Public Toilet | Mosque | Shops | |||
| 1. | Kandri | 893 | 3573 | 80,398 | 2680 | 3573 | 2680 | 93,797.66 |
| 2. | Lerep | 670 | 2010 | 33,500 | 2680 | 8710 | 13,400 | 60,970.00 |
| 3. | Candirejo | 558 | 1675 | 44,665 | 4466 | 8375 | 2792 | 62,530.83 |
| 4. | Karangrejo | 6030 | 1809 | 30,150 | 3618 | 3618 | 4221 | 49,446.00 |
| 5. | Dieng Kulon | 469 | 1407 | 124,285 | 0 | 5159 | 28,140 | 159,460.00 |
| 6. | Samiran | 1027 | 1027 | 23,116 | 3082 | 1541 | 7705 | 37,499.30 |
| 7. | Pentingsari | 514 | 3082 | 25,684 | 20,548 | 1027 | 3082 | 53,937.35 |
| Location | Area (km2) | Population (Person) | Population Density (Person/km2) | Solid Waste Composition | Total Volume of Solid Waste | Average Emission Factor | CO2 Emission (kg CO2/kg) |
|---|---|---|---|---|---|---|---|
| Kandri | 319.64 | 3797 | 11.88 | Food, paper, plastic, organic waste | 14,856 | 0.559 | 8304.50 |
| Lerep | 682 | 9000 | 13.20 | 73,418 | 0.559 | 41,040.66 | |
| Candirejo | 300.63 | 4700 | 15.63 | 11,142 | 0.559 | 6228.38 | |
| Karangrejo | 174 | 3016 | 17.33 | 59,424 | 0.559 | 33,218.02 | |
| Dieng Kulon | 210 | 5300 | 25.24 | 913,644 | 0.559 | 510,727.00 | |
| Samiran | 631.11 | 3715 | 5.89 | 15,302 | 0.559 | 8553.82 | |
| Pentingsari | 103 | 390 | 3.79 | 30,945 | 0.559 | 17,298.26 | |
| Nusa Penida * | 202.17 | 38,421 | 190.04 | Food, wood and garden waste, paper, textile, rubber and leather, plastic, glass, metal, hazardous waste, etc. | 4112.70 | 0.559 | 2299.00 |
| Nusa Lembongan * | 800 | 5163 | 6.45 | 764.40 | 0.559 | 427.30 | |
| Nusa Ceningan * | 300.9 | 1992 | 6.62 | 331.20 | 0.559 | 185.14 |
| No. | Types of Carbon Emission | Maximum (Tourism Village, Amount) | Minimum (Tourism Village, Amount) |
|---|---|---|---|
| 1. | Solid waste CO2 emission produced by visitors before the pandemic | Dieng Kulon | Candirejo |
| 437,766.10 kg CO2/kg | 5338.61 kg CO2/kg | ||
| 2. | Solid waste CO2 emission produced by visitors during the pandemic | Dieng Kulon | Kandri |
| 320,316.66 kg CO2/kg | 711.81 kg CO2/kg | ||
| 3. | Solid waste CO2 emission produced by the population | Dieng Kulon | Candirejo |
| 510,727.00 kg CO2/kg | 6228.38 kg CO2/kg | ||
| 4. | Building’s CO2 emission | Dieng Kulon | Samiran |
| 159,460.00 kg CO2/m2 | 37,499.30 kg CO2/m2 |
Publisher’s Note: MDPI stays neutral with regard to jurisdictional claims in published maps and institutional affiliations. |
© 2022 by the authors. Licensee MDPI, Basel, Switzerland. This article is an open access article distributed under the terms and conditions of the Creative Commons Attribution (CC BY) license (https://creativecommons.org/licenses/by/4.0/).
Share and Cite
Susilorini, R.M.I.R.; Ismail, A.; Wastunimpuna, B.Y.A.; Wardhani, D.K.; Prameswari, L.L.N.; Amasto, A.H.; Suryono, A. Tourism Village Carbon Footprint after COVID-19 Pandemic: A Challenge to Sustainability. Sustainability 2022, 14, 2400. https://doi.org/10.3390/su14042400
Susilorini RMIR, Ismail A, Wastunimpuna BYA, Wardhani DK, Prameswari LLN, Amasto AH, Suryono A. Tourism Village Carbon Footprint after COVID-19 Pandemic: A Challenge to Sustainability. Sustainability. 2022; 14(4):2400. https://doi.org/10.3390/su14042400
Chicago/Turabian StyleSusilorini, Rr. M. I. Retno, Amrizarois Ismail, B. Y. Arya Wastunimpuna, Dhiyan Krishna Wardhani, Laurel Lia Nola Prameswari, Ardhito Hayyu Amasto, and Agus Suryono. 2022. "Tourism Village Carbon Footprint after COVID-19 Pandemic: A Challenge to Sustainability" Sustainability 14, no. 4: 2400. https://doi.org/10.3390/su14042400