An Evaluation of the Impact of Pandemic Driven Lockdown on the Phytoplankton Biomass Over the North Indian Ocean Using Observations and Model
 Vivek Seelanki
 Vimlesh Pant
- Centre for Atmospheric Sciences, Indian Institute of Technology Delhi, New Delhi, India
The unprecedented nationwide lockdown due to the ‘coronavirus disease 2019’ (COVID-19) affected humans and the environment in different ways. It provided an opportunity to examine the effect of reduced transportation and other anthropogenic activities on the environment. In the current study, the impact of lockdown on chlorophyll-a (Chl-a) concentration, an index of primary productivity, over the northern Indian Ocean (IO), is investigated using the observations and a physical-biogeochemical model. The statistics of model validation against observations shows a correlation coefficient of 0.85 (0.89), index of agreement as 0.90 (0.91). Root mean square error of 0.45°C (0.50°C) for sea surface temperature over the Bay of Bengal (BoB) (Arabian Sea, AS) is observed. The model results are analyzed to understand the upper-oceanic physical and biological processes during the lockdown. A comparison of the observed and model-simulated data during the lockdown period (March–June, 2020) and pre-pandemic period (March–June, 2019) shows significant differences in the physical (temperature and salinity) and biogeochemical (Chl-a concentration, nutrient concentration, and dissolved oxygen) parameters over the western AS, western BoB, and regions of Sri Lanka. During the pandemic, the reduced anthropogenic activities lead to a decrease in Chl-a concentration in the coastal regions of western AS and BoB. The enhanced aerosol/dust transport due to stronger westerly winds enhanced phytoplankton biomass in the western Arabian Sea (WAS) in May–June of the pandemic period.
Introduction
Severe acute respiratory syndrome coronavirus 2 (SARS-CoV-2), officially named coronavirus disease 2019 (COVID-19), is a global pandemic that started in late 2019. This pandemic affected almost all the countries and territories around the world. The WHO declared the COVID-19 outbreak a global health emergency in January 2020. As of August 31, 2021, worldwide, 218,213,889 confirmed cases of COVID-19 are being reported. Out of these cases, 18,595,281 are active cases, and 4,528,115 deaths have been reported due to COVID-19 (Worldometers.info, 2020). Considering the seriousness of the disease, the government of India implemented a nationwide lockdown in four phases starting from March 25, 2020. In the first phase of the lockdown (March 25 to April 14, 2020), strict restrictions were imposed on physical gatherings for the cultural, religious, political, academic, sports, and academic events. Most industrial operations, construction works, and markets were shut down, and only emergency or essential services were allowed in the first phase of lockdown. The subsequent three phases of lockdown in India were imposed as phase 2: April 15 to May 3, 2020; phase 3: May 4–17, 2020; and phase 4: May 18–31, 2020. The restrictions on the industrial and agricultural activities were mostly lifted after the first phase. After that, to restart the Indian economy, two unlock phases were announced (unlock 1: June 1–30, 2020; unlock 2: July 1–31, 2020), which allowed the opening of markets and physical gathering in a phased manner.
In addition, the countries adjoining the western Arabian Sea (WAS) had lockdown restrictions. Most of the countries around the WAS imposed the pandemic restrictions from the mid-March 2020 by closing the borders, schools, physical gatherings, and international travel. Oman implemented a lockdown from April 10–22, 2020, which was extended further until May 29, 2020. Yemen imposed partial restrictions in May–June 2020. In Somalia, the authorities responded with drastic measures after the first confirmed COVID-19 case on March 16, 2020. They decided to close the borders, schools, limiting travel, and prohibiting most group functions. Due to the imposed restrictions during the lockdown in various countries, there was a significant reduction in the air pollution level in the living environment (Chimurkar et al., 2020).
Oceans play a crucial role in the global climate system. Life on the Earth in terms of productivity is directly influenced by ocean characteristics (Morel and Antoine, 1994). The changes in ocean surface properties affect the life on Earth as oceans produce more than 50–80% of the oxygen on the Earth (NOAA, 2020). Several studies are conducted to study the effect of COVID-19 on air and water quality (Chimurkar et al., 2020; Navinya et al., 2020; Madineni et al., 2021; Pandey and Vinoj, 2021). But the impact of lockdown on the upper-oceanic physical and biogeochemical parameters is not explored. The pandemic has also affected oceanic in situ measurements as several research cruises were postponed. It affected the data collection and maintenance of existing observational instruments in the ocean.
Due to COVID-19, the governments have imposed restrictions on several industrial and human activities. The consequences of such lockdowns have been remarkable as the pollution levels have dropped significantly. For instance, the emissions of greenhouse gases, nitrogen dioxide, black carbon have decreased drastically (Zambrano-Monserrate et al., 2020). It has been reported that the lockdown due to pandemics has improved the coastal ocean water and atmospheric air quality (Chauhan and Singh, 2020; Paital, 2020). A significant reduction in CO2 concentration is noticed due to the imposed pandemic and reduced human activities (Le Quéré et al., 2020). The primary productivity is an estimation of oceans plant biomass and, the Chl-a concentration represents the phytoplankton distribution (Morin et al., 1999). Many parameters influence ocean productivity, such as ocean temperature, nutrients, and carbon cycle (Behrenfeld et al., 2006; Gerecht et al., 2014).
Before the COVID-19 pandemic, in recent decades, a significant increase in the sea surface temperature (SST) is apparent in the global ocean directly influencing the ocean (Yeh et al., 2009; Knutson et al., 2010). However, the reduction in global atmospheric CO2 concentration by about 7% during the pandemic (Le Quéré et al., 2020) has influenced the air-sea flux of carbon and ocean biogeochemistry. The impact of lockdown on the marine ecosystem could be associated with several factors, such as the changes in SST, aerosol optical depth (AOD), dust mass concentration at the sea surface, and nitrogen dioxide. The WAS receives a large influx of dust particles through westerly winds from the desert regions (Clemens, 1998; Patra et al., 2005; Ramaswamy et al., 2017), which makes it worth investigating the influences of the lockdown-induced factors, particulate matter/aerosols, and dust loading on the Chl-a concentration in the Arabian Sea (AS).
Aerosol particles, both natural and anthropogenic, span over a wide range of sizes from a few nanometers to hundreds of micrometers. These aerosols can be produced locally or be transported long distances (thousands of kilometers) by winds. Depending on their generating source characteristics and long-range transport pathway in the atmosphere, these particles possess different chemical compositions. The gravitational settling, scavenging, and wet removal are the major sinks for aerosols. Once settled over the ocean surface, these particles add their constituents to the seawater and alter the mixing ratio of various dissolved gases and nutrients in the upper ocean (few tens of meters). These aerosol particles are known to be an important source of macronutrients, e.g., nitrogen (N), and phosphate (P), and micronutrients. The most prominent micronutrient is iron (Fe). Other micronutrients, such as zinc and cobalt, are also essential for the biological processes. The macronutrients and micronutrients are essential building blocks for the phytoplankton growth (Duce and Tindale, 1991; Mahowald et al., 2005; Meskhidze et al., 2005; Gallisai et al., 2014). The mechanical disruption of the sea surface by winds lead to the formation of sea-spray and sea-salt aerosols (O’Dowd et al., 1997; Satheesh et al., 2006; Mulcahy et al., 2008; Pant et al., 2008; Glantz et al., 2009; Meskhidze and Nenes, 2010). Such sea-salt aerosols remain suspended in the atmosphere, undergo a transformation during long-range transport, and a large fraction of it settles back to the ocean surface. The emissions from industry, transport, and power plants, etc., contribute to the concentration and characteristics of marine aerosols. Globally, the anthropogenic emissions are largely reduced during the pandemic driven lockdown. This reduction in aerosol concentration is expected to influence the biogeochemistry of the upper ocean, particularly near the coastal regions. Further, the decline in NO2 emissions reduced nitrogen concentration, particularly in the coastal regions (Mishra et al., 2020).
Typically, the AS and the Bay of Bengal (BoB) receive up to 20 and 10 g m–2 year–1 mineral dust from the adjacent land regions, respectively, with a peak deposition during the June, July, August (JJA) period (Patra et al., 2007). The dust bearing northwesterly winds prevail close to the sea surface around 45°E but rise to 3 km around 70°E (Clemens, 1998) with a gradient of about 0.1 km degree–1 longitude. Jin et al. (2018) reported that tons of dust aerosols emitted from the Arabian Peninsula (AP) and its surrounding areas are transported to the AS by the strong northwesterly “Shamal” winds during boreal summer. From the absorbing aerosol index (AAI) distribution and tracer transport modeling, Patra et al. (2005) concluded that a large amount of aerosols is transported to the AS from northern Africa and the Gulf region during JJA months, and a major fraction of these aerosols are deposited on the AS surface. Over the AP and the northwestern AS, more than 50% of the AOD is contributed by mineral dust (Jin et al., 2018).
Jickells et al. (2005) emphasized the significance of atmospheric inputs of nutrients and micro-nutrients to the surface ocean. Patra et al. (2005) ascribed northern Africa and the Gulf as the source regions of aerosols found over the AS during the southwest monsoon. This observation is consistent with the higher sinking fluxes of lithogenic and dolomite materials in the AS, derived from the Arabian region and transported by north-westerly winds during the southwest monsoon (Nair, 2006). These mineral dust aerosols deposited on the AS surface are found to be rich in nutrients and micro-nutrients (Measures and Vink, 1999; Tindale and Pease, 1999; Rengarajan and Sarin, 2004). Measures and Vink (1999) have shown that the supply of Fe through aeolian dust is a requirement for biological production in the nutrient-rich upwelled water in the WAS, and more prominently in the water that advects offshore.
In the current study, an ocean bio-physical model together with the available observations is used to understand the impact of lockdown on phytoplankton biomass (Chl-a concentration) over the north Indian Ocean (NIO), particularly in the coastal regions. The model data are useful in the absence of in situ and satellite observations. The temperature, Chl-a concentration data are available from the satellites but, there are large gaps owing to the presence of clouds. Most of the earlier studies based on the satellite measurements of ocean color provided the spatiotemporal evolution of Chl-a concentration over large oceanic areas (Jayaram et al., 2018; Mandal et al., 2021). However, ocean color monitors (primarily visible and infrared band) on satellites are incapable of observing through clouds and below the ocean surface. The in situ measurements from autonomous profiling or ship-based observations (e.g., Thushara et al., 2019) can provide high-quality information on the subsurface physical and biogeochemical variables but these observations have limited spatial coverage and, often, sampling location changes from one profile to another. Further, several ocean expeditions and observational cruises were postponed due to the pandemic, which affected the data collection and maintenance of existing in situ data platforms. To overcome these limitations of satellite and in situ data, the bio-physical model is used to study the evolution of subsurface features. The objectives of the current study are to assess the changes in upper-ocean physical and biogeochemical parameters during COVID-19 driven lockdown period with respect to the pre-pandemic period and to examine the causative atmospheric and oceanic processes leading to the observed differences. The Chl-a concentration simulated by the eco-system model and observed from in situ and remote sensing methods is analyzed to infer the impact on the biogeochemistry during the pandemic lockdown compared with the non-pandemic period.
Data and Model Description
In situ Data
The ocean temperature and salinity profiles are derived using in situ observations from the moored buoy array program, consisting of the Research Moored Array for African–Asian–Australian Monsoon Analysis and Prediction (RAMA) buoy (at 90°E, 12°N) (McPhaden et al., 2009). The RAMA buoys were deployed for the improved description, understanding, and prediction of the African, Asian, and Australian monsoon systems. This high resolution near real-time data of moored RAMA buoy obtained from the Tropical Atmosphere Ocean Project Office of the National Oceanic and Atmospheric Administration–Pacific Marine Environmental Laboratory http://www.pmel.noaa.gov/tao. The buoy gauges represent the open-ocean conditions and are not affected by the neighboring land orography and surface heating (Bowman et al., 2003; Bowman, 2005; McPhaden et al., 2009). Additionally, the Bio-Argo float (WMO ID: 2902264) deployed in the central BoB (CBoB) (83.85°E, 13.4°N) is used1 for validation and analysis. This Bio-Argo float provides measurement/estimate of temperature, salinity, Chl-a concentration, dissolved oxygen with respect to depth in the ocean. This profiling float was equipped with a temperature, conductivity, and depth sensor of Seabird (SBE41CP), dissolved oxygen sensor (Aanderra Optode 4330), and chlorophyll fluorescence sensor (WET Labs FLBB). These floats are used in the Indian ARGO project managed by the Indian National Centre for Ocean Information Services (INCOIS) and were manufactured by Sea-Bird Electronics. In the present study, in situ observations from RAMA and Bio-Argo in the upper 100 m of the water column are used for the duration from January 1, 2019 to June 30, 2020. The Bio-Argo float trajectory and location of RAMA buoy used in this study are shown on the map in Figure 1.
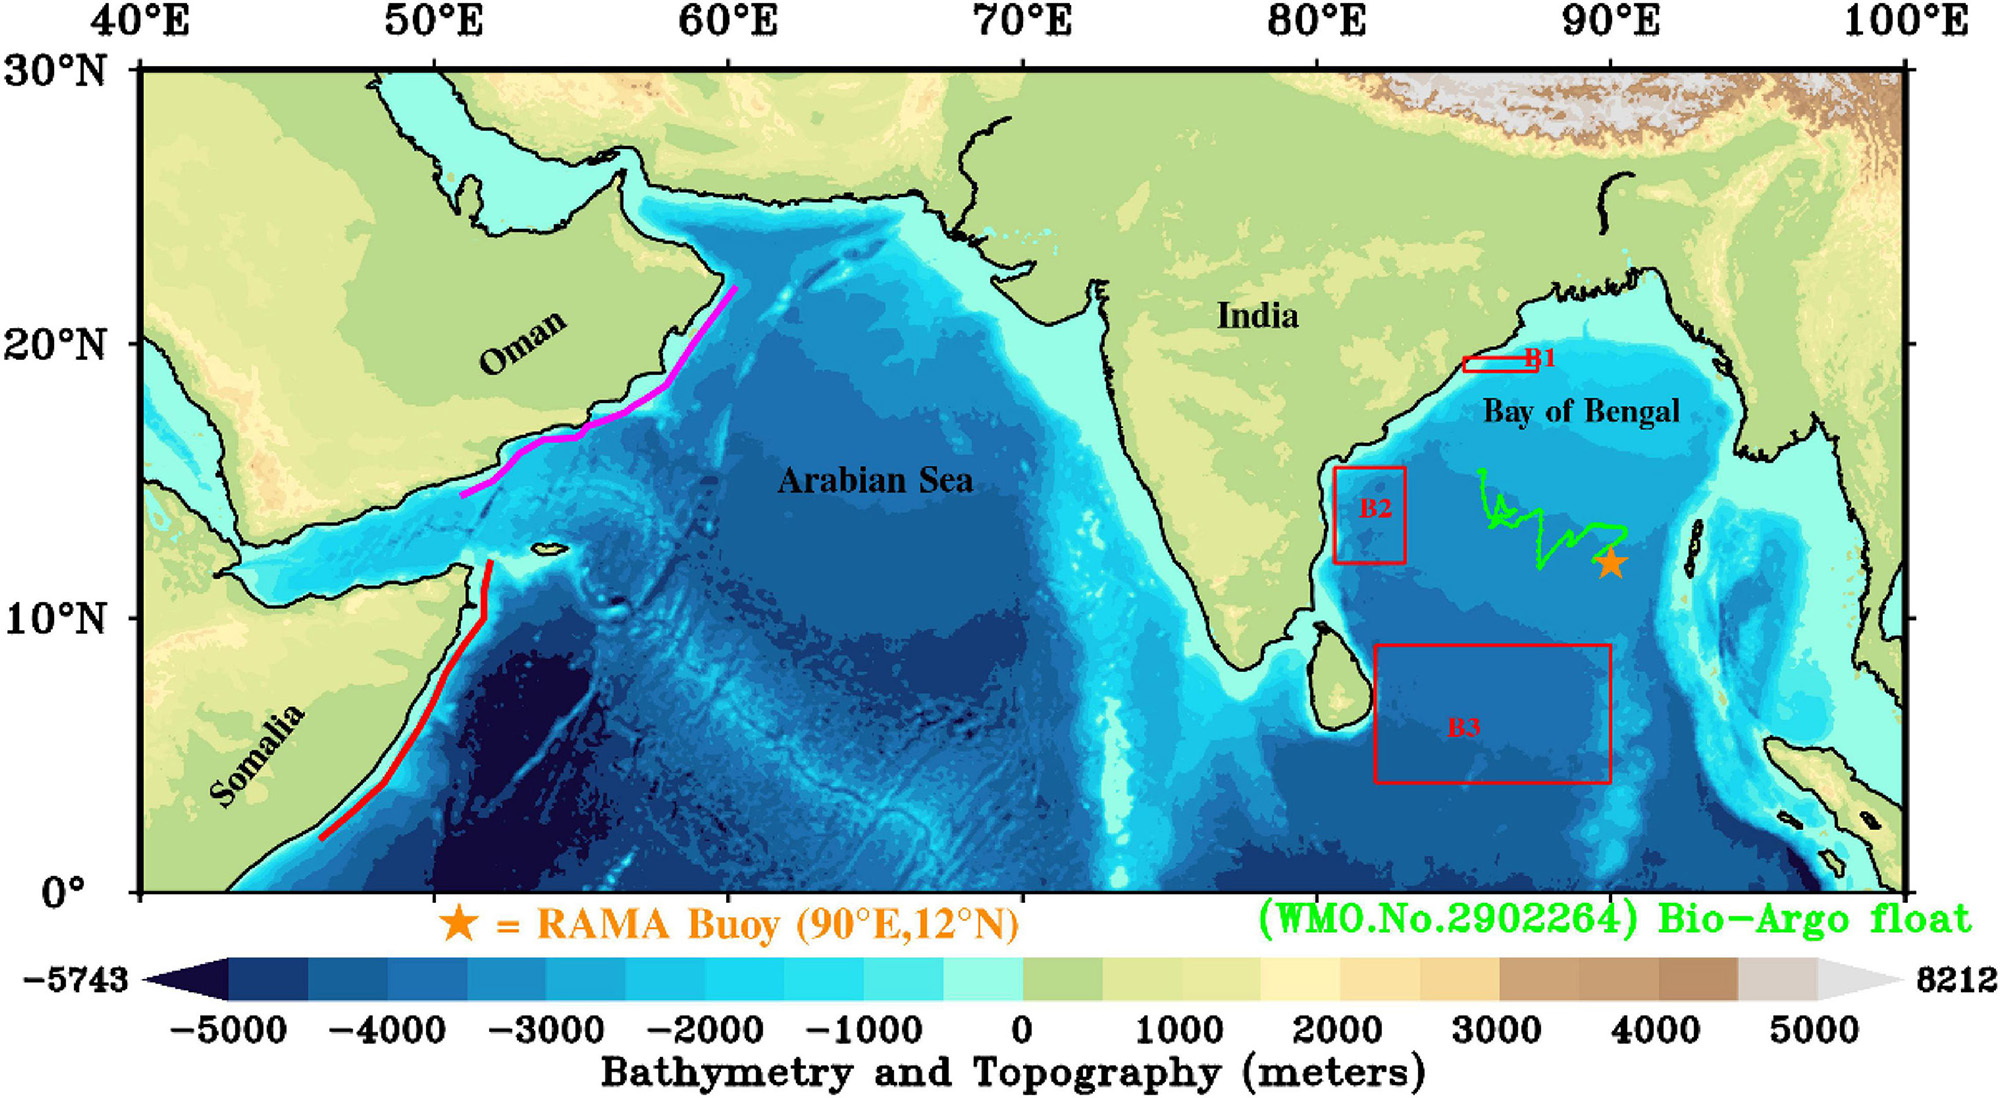
Figure 1. The study domain of the North Indian Ocean (NIO) with the bathymetry and topography in shades (in meters). The continuous contour lines off the Somalia and Oman coasts and red boxes (B1, B2, and B3) in the Bay of Bengal (BoB) show the regions of vertical profile analysis. The location of the Research Moored Array for African–Asian–Australian Monsoon Analysis and Prediction (RAMA) buoy is marked with a star and the trajectory of Bio-Argo float is shown with a green curve.
Satellite Data
The Chl-a concentration data were obtained from the European Space Agency Ocean Color-Climate Change Initiative project (ESA-OC-CCI).2 The Chl-a concentration daily data were downloaded for the COVID-19 pandemic (March–June 2020) and pre-pandemic (March–June 2019) periods. Version 5.0 of this dataset is produced using the processing chain software developed by ESA-OC-CCI. This dataset contains global daily composites of merged sensor products: SeaWiFS, MERIS, MODIS Aqua, VIIRS, and OLCI. This dataset provides global ocean surface Chl-a concentration from the different satellite sensors with 4 km horizontal and daily temporal resolution. The SST data were obtained from Advanced Microwave Scanning Radiometer (AMSR2)3 for the same period. The 3-day composite blended SST of AMSR2 has a spatial resolution of 0.25° × 0.25°. The daily surface winds at 10 m were taken from the European Centre for Medium Range Weather Forecast’s (ECMWF) reanalysis, ERA5 data of 25 km × 25 km resolution for the period from 2019 to 2020. For the atmospheric aerosol loading, the Moderate Resolution Imaging Spectro-radiometer Aqua (MODIS Aqua) derived AOD is utilized. The AOD data are from the level 3 of MOD08_D3_v6.1 with 1° spatial resolution. The combined dark target and deep blue AOD at 550 nm are used. Nitrogen dioxide (NO2) data are obtained from the ozone monitoring instrument (OMI) within tropospheric column of 30% cloud screened level 3 product (OMNO2d.v003) with 0.25° × 0.25° horizontal resolution. These datasets are downloaded from the NASA website https://giovanni.gsfc.nasa.gov/giovanni/. Dust surface mass concentration (DUSMASS) and sea salt surface mass concentration (SSSMASS) are downloaded from https://gmao.gsfc.nasa.gov/reanalysis/MERRA-2 of Modern-Era Retrospective Analysis for Research and Applications, version 2 (MERRA-2) with a resolution of 0.5° × 0.625°. A summary of datasets that are used and their resolution and sources are provided in Table 1.
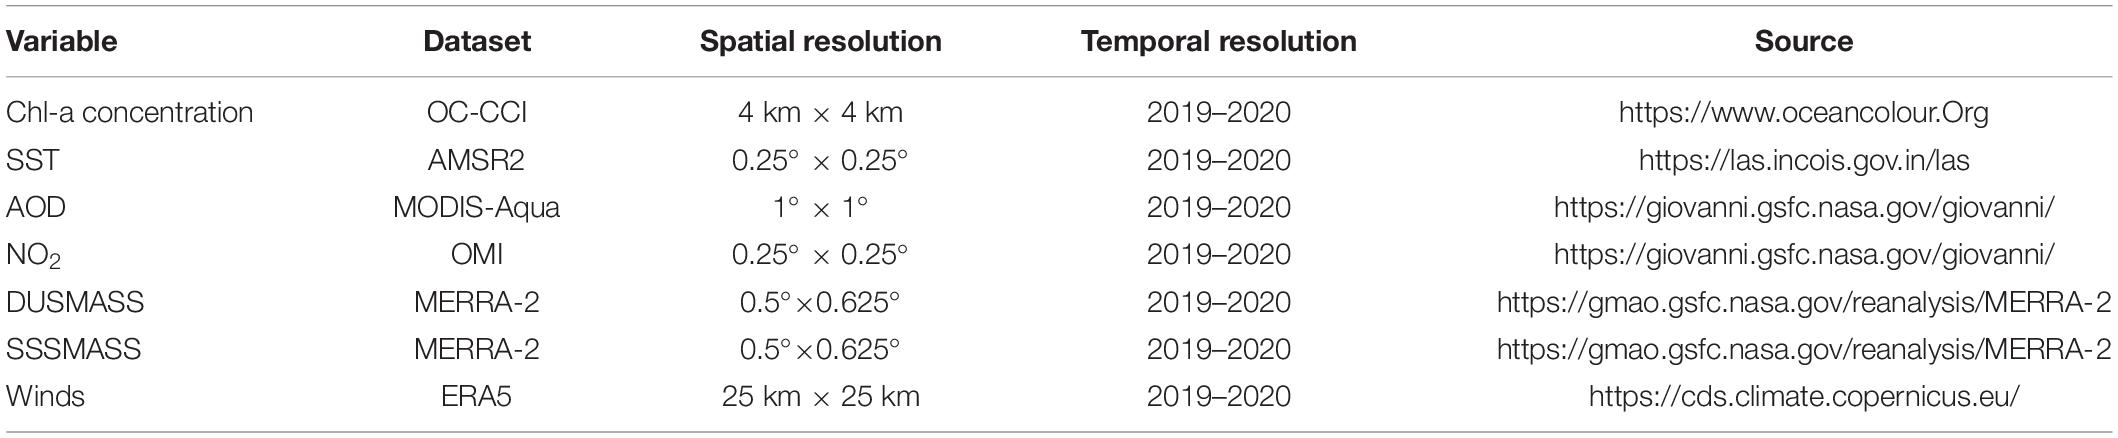
Table 1. Summary of datasets used in the study.
Model
The coupled physical-biogeochemical model has been set-up over the Indian Ocean (IO) basin (30°N-30°S and 30°E-120°E) (Seelanki et al., 2021) with a 1/4° horizontal grid resolution and 40 vertical sigma layers using a Regional Ocean Modelling System (ROMS) version 3.7 (Haidvogel et al., 2008). Many studies (Jana et al., 2015; Chakraborty et al., 2018; Nigam et al., 2018; Sandeep and Pant, 2018; Dandapat et al., 2020) used the ROMS model to understand the processes and temporal and spatial variability over the NIO (such as, AS and BoB) region. The bathymetry in the model domain is adopted from the 2-min Gridded Global Relief Data (ETOPO2) (Smith and Sandwell, 1997). The model initial conditions of temperature and salinity are derived from the World Ocean Atlas (WOA13) based on the Levitus data (Levitus, 1983). The daily climatological surface forcing of precipitation data used from tropical rainfall measuring mission (TRMM),4 surface winds adopted from QuikScat scatterometer,5 and other meteorological parameters (air temperature, specific humidity, sea level pressure, and net longwave, shortwave radiation) obtained from the National Centre for Environmental Prediction (NCEP) reanalysis data (Kalnay et al., 1996). River discharges from major rivers draining into the BoB (i.e., Ganga, Brahmaputra, Mahanadi, Irrawaddy, Krishna, and Godavari) are incorporated in the model using point-source method with the monthly climatological runoff (Fekete and Vörösmarty, 2007). The physical ROMS model was started from a state of rest and spun-up for 10 years using daily climatological forcing for the period 2000–2008. After the physical model stabilized, the ecosystem model (Bio-fennel) was coupled with the physical model and the coupled model run was executed for another 10 years with same daily climatological forcing. The 10th-year output of coupled biophysical simulation used as the initial condition for the interannual simulations. Further details of this model configuration are described in Seelanki et al. (2021). The simulations with actual observed surface forcing were performed with QuikScat daily winds from January 1, 2000 to December 31, 2008 and then used ASCAT winds up to September 31, 2020, precipitation data from TRMM, air temperature, specific humidity, sea level pressure, and net longwave, shortwave radiation data from NCEP reanalysis (Kalnay et al., 1996).
The Bio-Fennel is a biogeochemical component (Fennel et al., 2006, 2008, 2011) of the ROMS model. The biogeochemical variables of nitrogen and oxygen were taken from WOA13 for model initialization and boundary conditions. In view of the lack of spatial information over the IO, the rest of the biogeochemical variables are initially set to a small homogenous value of 0.1 mmol N m–3.
Results and Discussion
Model Validation and Impact of Lockdown on Surface Chl-a Concentration
The capability of the model in reproducing the physical and biogeochemical features over the NIO is analyzed with a special emphasis on the coastal BoB and WAS. The analysis was carried out for a period of March 1–June 30 for both 2019 and 2020. An inter-comparison of the simulations of 2 years provides a quantitative relative change in the upper-ocean properties during COVID-19 pandemic 2020 as compared with the pre-pandemic condition prevailed in 2019. The study region is selected as the NIO because the BoB experienced severe tropical cyclones during this period (Pentakota et al., 2018) whereas, over the AS, March to June usually accompanied with dust storms (Middleton, 1986; Pease et al., 1998; Léon and Legrand, 2003; Gautam et al., 2009). The period of study is chosen such that the summer monsoon (June-September) is not included to avoid the precipitation driven wash-out of aerosols in either pandemic or non-pandemic years.
In the BoB region, the model-simulated SST has a positive correlation coefficient (CC) of 0.85, index of agreement (IOA) as 0.90, and root mean square error (RMSE) of 0.45°C with respect to AMSR2 observations. The simulated surface Chl-a concentration is compared with a merged satellite product (OC-CCI). A positive CC of 0.57 and IOA = 0.50 with RMSE = 0.10 mg m–3 between model simulation and observation of Chl-a concentration over BoB region is observed, which indicates that the model reasonably captures the Chl-a concentration pattern.
The Chl-a concentration of 2019 (pre-pandemic) is subtracted from that of 2020 (pandemic) for the respective months over the BoB and AS (Figure 2). In addition, the model-simulated difference (2020 minus 2019) of surface Chl-a concentration is compared against the observed difference of Chl-a concentration for the same from OC-CCI observations. It can be inferred from the figure that the Chl-a concentration differences are reasonably well captured by the model over both the regions. In the coastal regions along the east coast of India, the Chl-a concentration found to decrease in both the model and observations during the pandemic period (2020) as compared with the non-pandemic period (2019). On the other hand, the Sri Lanka dome observes higher Chl-a concentration during the pandemic period as compared with 2019. In the CBoB, high Chl-a was observed in May during the pandemic time. This increase in Chl-a concentration is associated with the tropical cyclone Amphan in the BoB from May 16 to 21, 2020. With the wind speed of 130 Knots, it was one of the most severe cyclones in the BoB after the Odisha super cyclone. The cyclonic wind stress leads to surface Ekman mass divergence, which supports the supply of nutrients to the euphotic zone and enhances the primary productivity. The high Chl-a concentration is noticed in both the model and observations during May 2020 (Figures 2A–H) over the northern parts of the BoB.
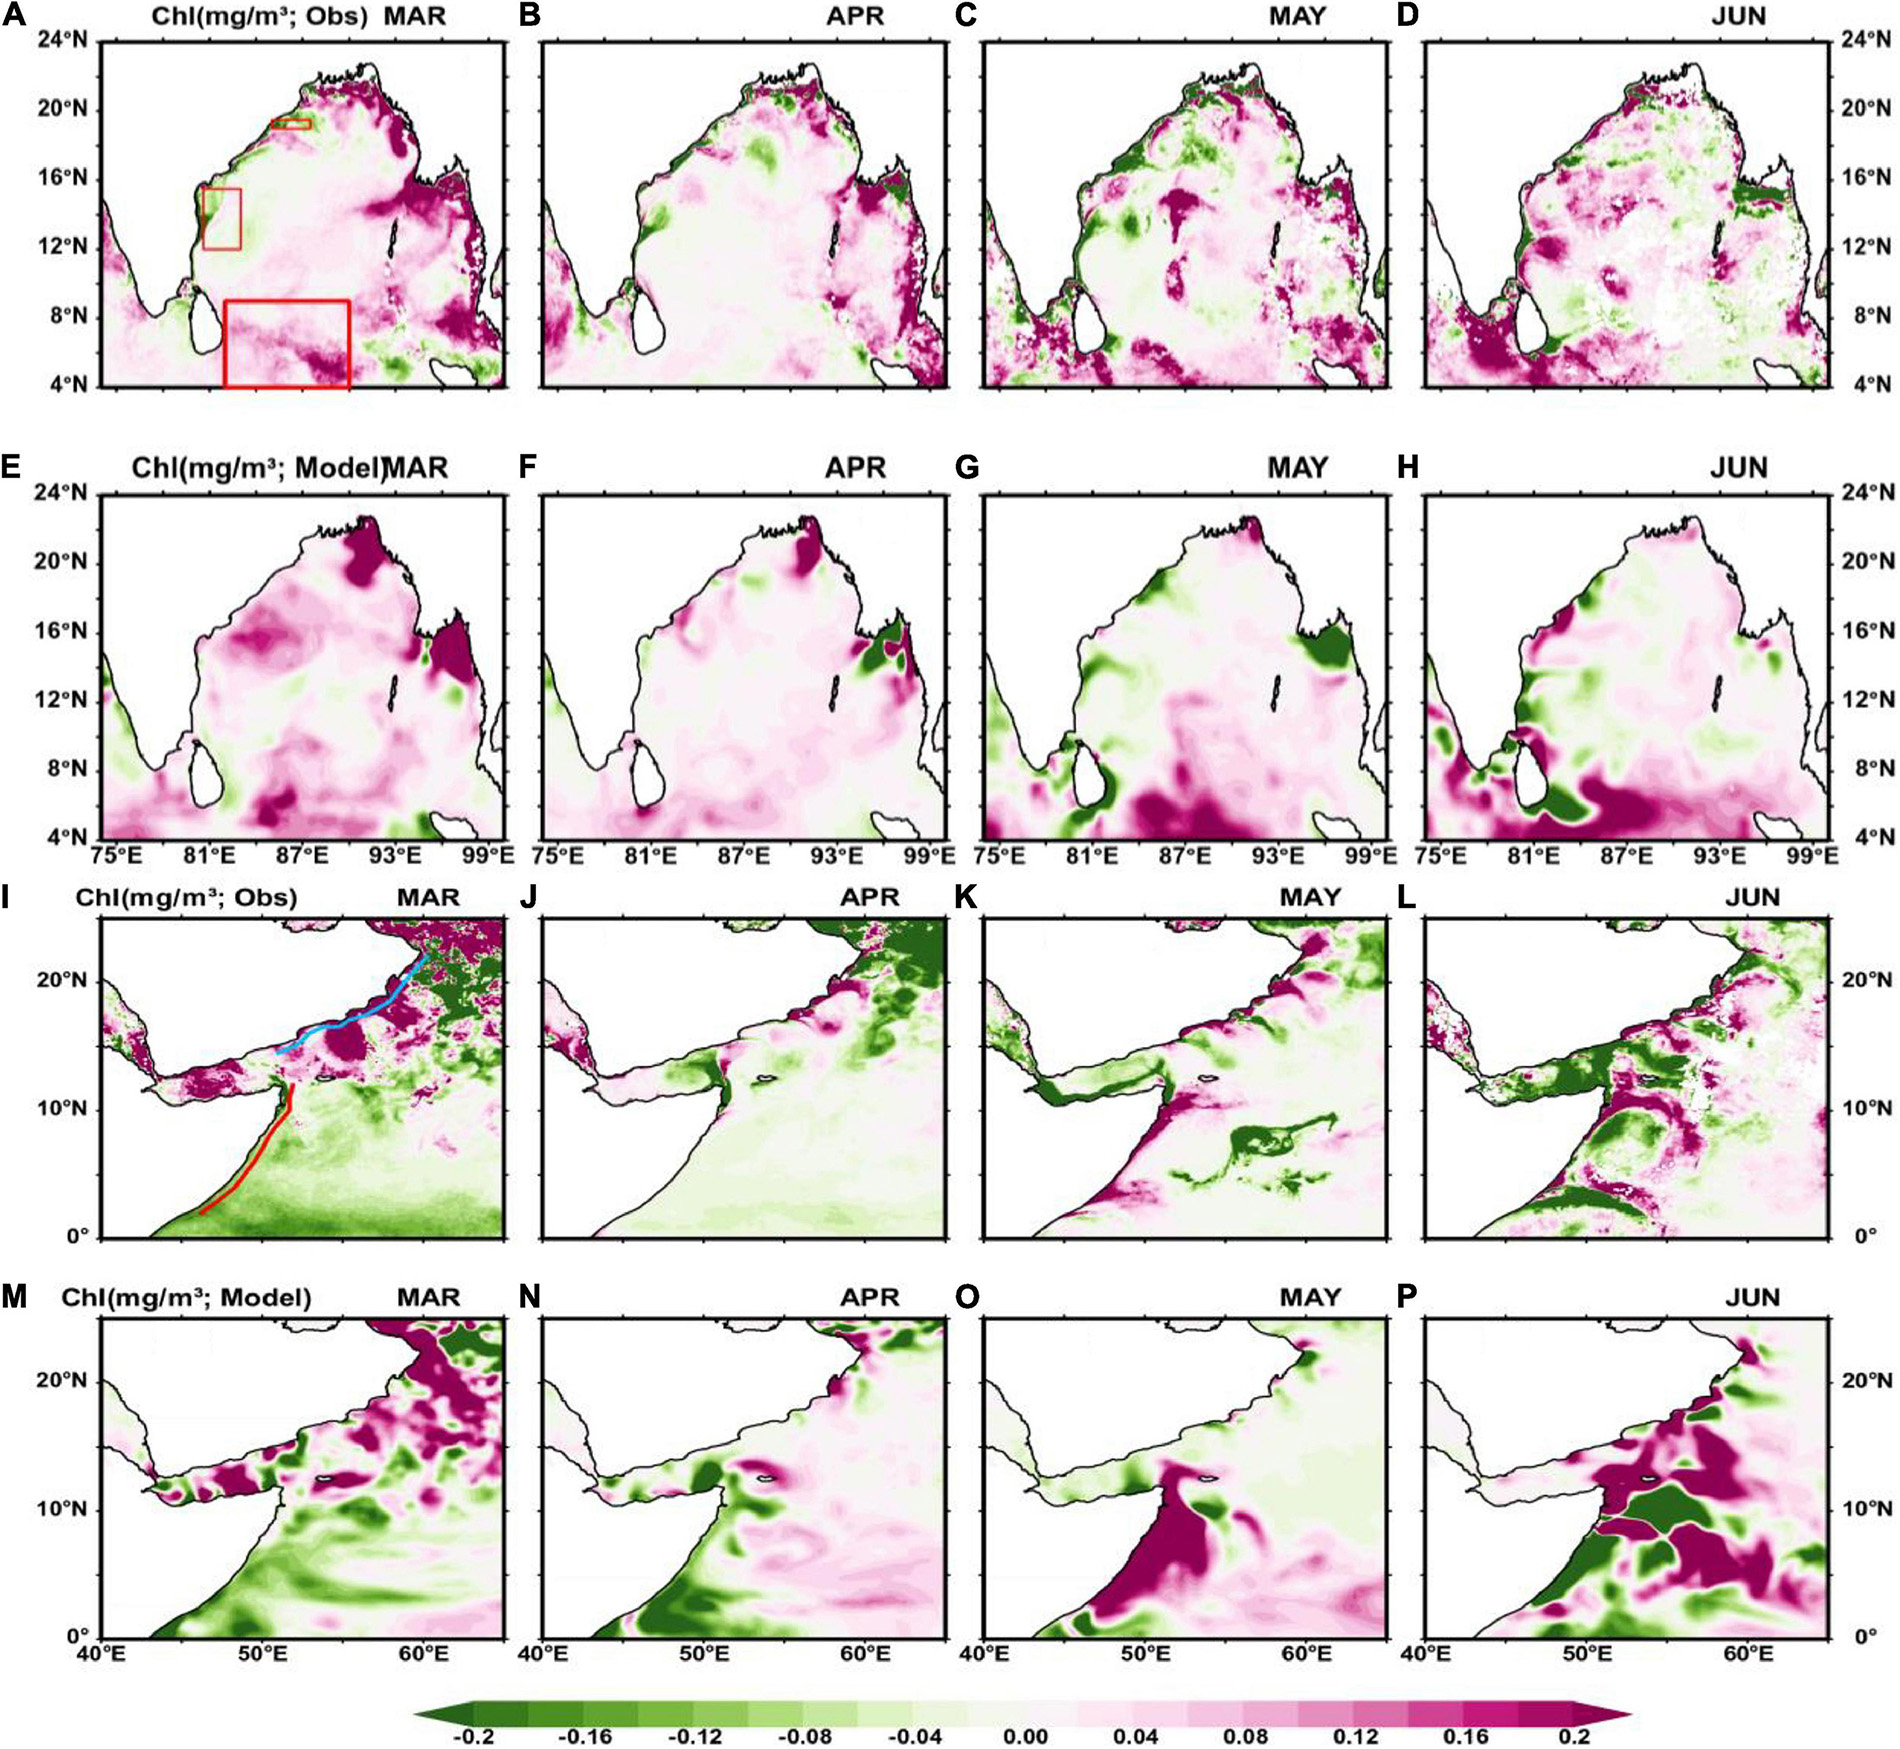
Figure 2. Chlorophyll-a (Chl-a) concentration difference (milligram per cubic meter) from pandemic period (March–June of 2020) to pre-pandemic period (March–June of 2019) from the observations (rows 1 and 3) and model simulations (rows 2 and 4) over the BoB (rows 1 and 2) and western Arabian Sea (WAS) (rows 3 and 4). The red rectangular boxes [in panel (A)] are chosen for the vertical profile analysis, and the red (sky blue) continuous line [in panel (I)] represents the 1,000 m isobath section in Somalia (Oman) coast used to study the vertical profiles.
Changes in the Arabian Sea
The model-simulated SST and Chl-a concentration compared well with the observations over the AS domain. The model-simulated SST has a positive CC of 0.89 with IOA = 0.91 and RMSE = 0.5∘C. Whereas the statistics for surface Chl-a concentration over the AS were found to be CC = 0.49, IOA = 0.58 with an RMSE of 0.18 mg m–3. Given the complexity of simulating the coupled physical-biogeochemical processes, the statistics of Chl-a concentration against observations are reasonably good in the current study. Particularly, the phytoplankton biomass regions are well simulated. Moreover, the results presented in this study are based on the inter-comparison of the model-simulated Chl-a concentration during the pandemic-time against the non-pandemic period. The OC-CCI observations show a decrease in Chl-a concentration in the WAS during March–April of the pandemic period as compared with normal (2019) (Figures 2I–P). The model simulations also resemble this decrease in Chl-a concentration in the WAS. However, the Chl-a concentration increased in the May–June period of the pandemic. Offshore along the Oman coastline, the Chl-a bloom (i.e., the high concentration of Chl-a) persisted throughout the March–June period of the pandemic.
There is an impact of the pandemic on the SST in the NIO. The SST is found to be 0.5°C lower in the pandemic period than the non-pandemic period in both the observations and model (Figure 3). This reduction in SST could be due to multiple factors, such as a change in the cloud cover, changes in surface and advective heat fluxes, and changes in atmospheric CO2 and aerosol loading during the pandemic year (Al Shehhi and Abdul Samad, 2021). These regions are found to have high rapid warming trends (Reid et al., 2009; Roxy et al., 2016). Comparing the Chl-a concentration (Figure 2) and SST (Figure 3), the SST reduction coincides with an increase in Chl-a concentration over both the regions in the NIO. This could be associated with the oceanic uptake of atmospheric CO2 and enhancement of photosynthesis process due to the reduction in SST. Along the coastal regions of Somalia, warmer SST was observed in March–April during the pandemic year. However, with the reversal of winds, the SST reduced over WAS along Somalia coastline during May–June. This reduction in SST could be associated with the initiation of the coastal upwelling process at the Somalia coast. On the other hand, colder than normal SST (Figures 3I–P) observed along the Oman coast during March–April of the pandemic year, which is accompanied with high Chl-a concentration off the Oman coast (Figures 2I–P).
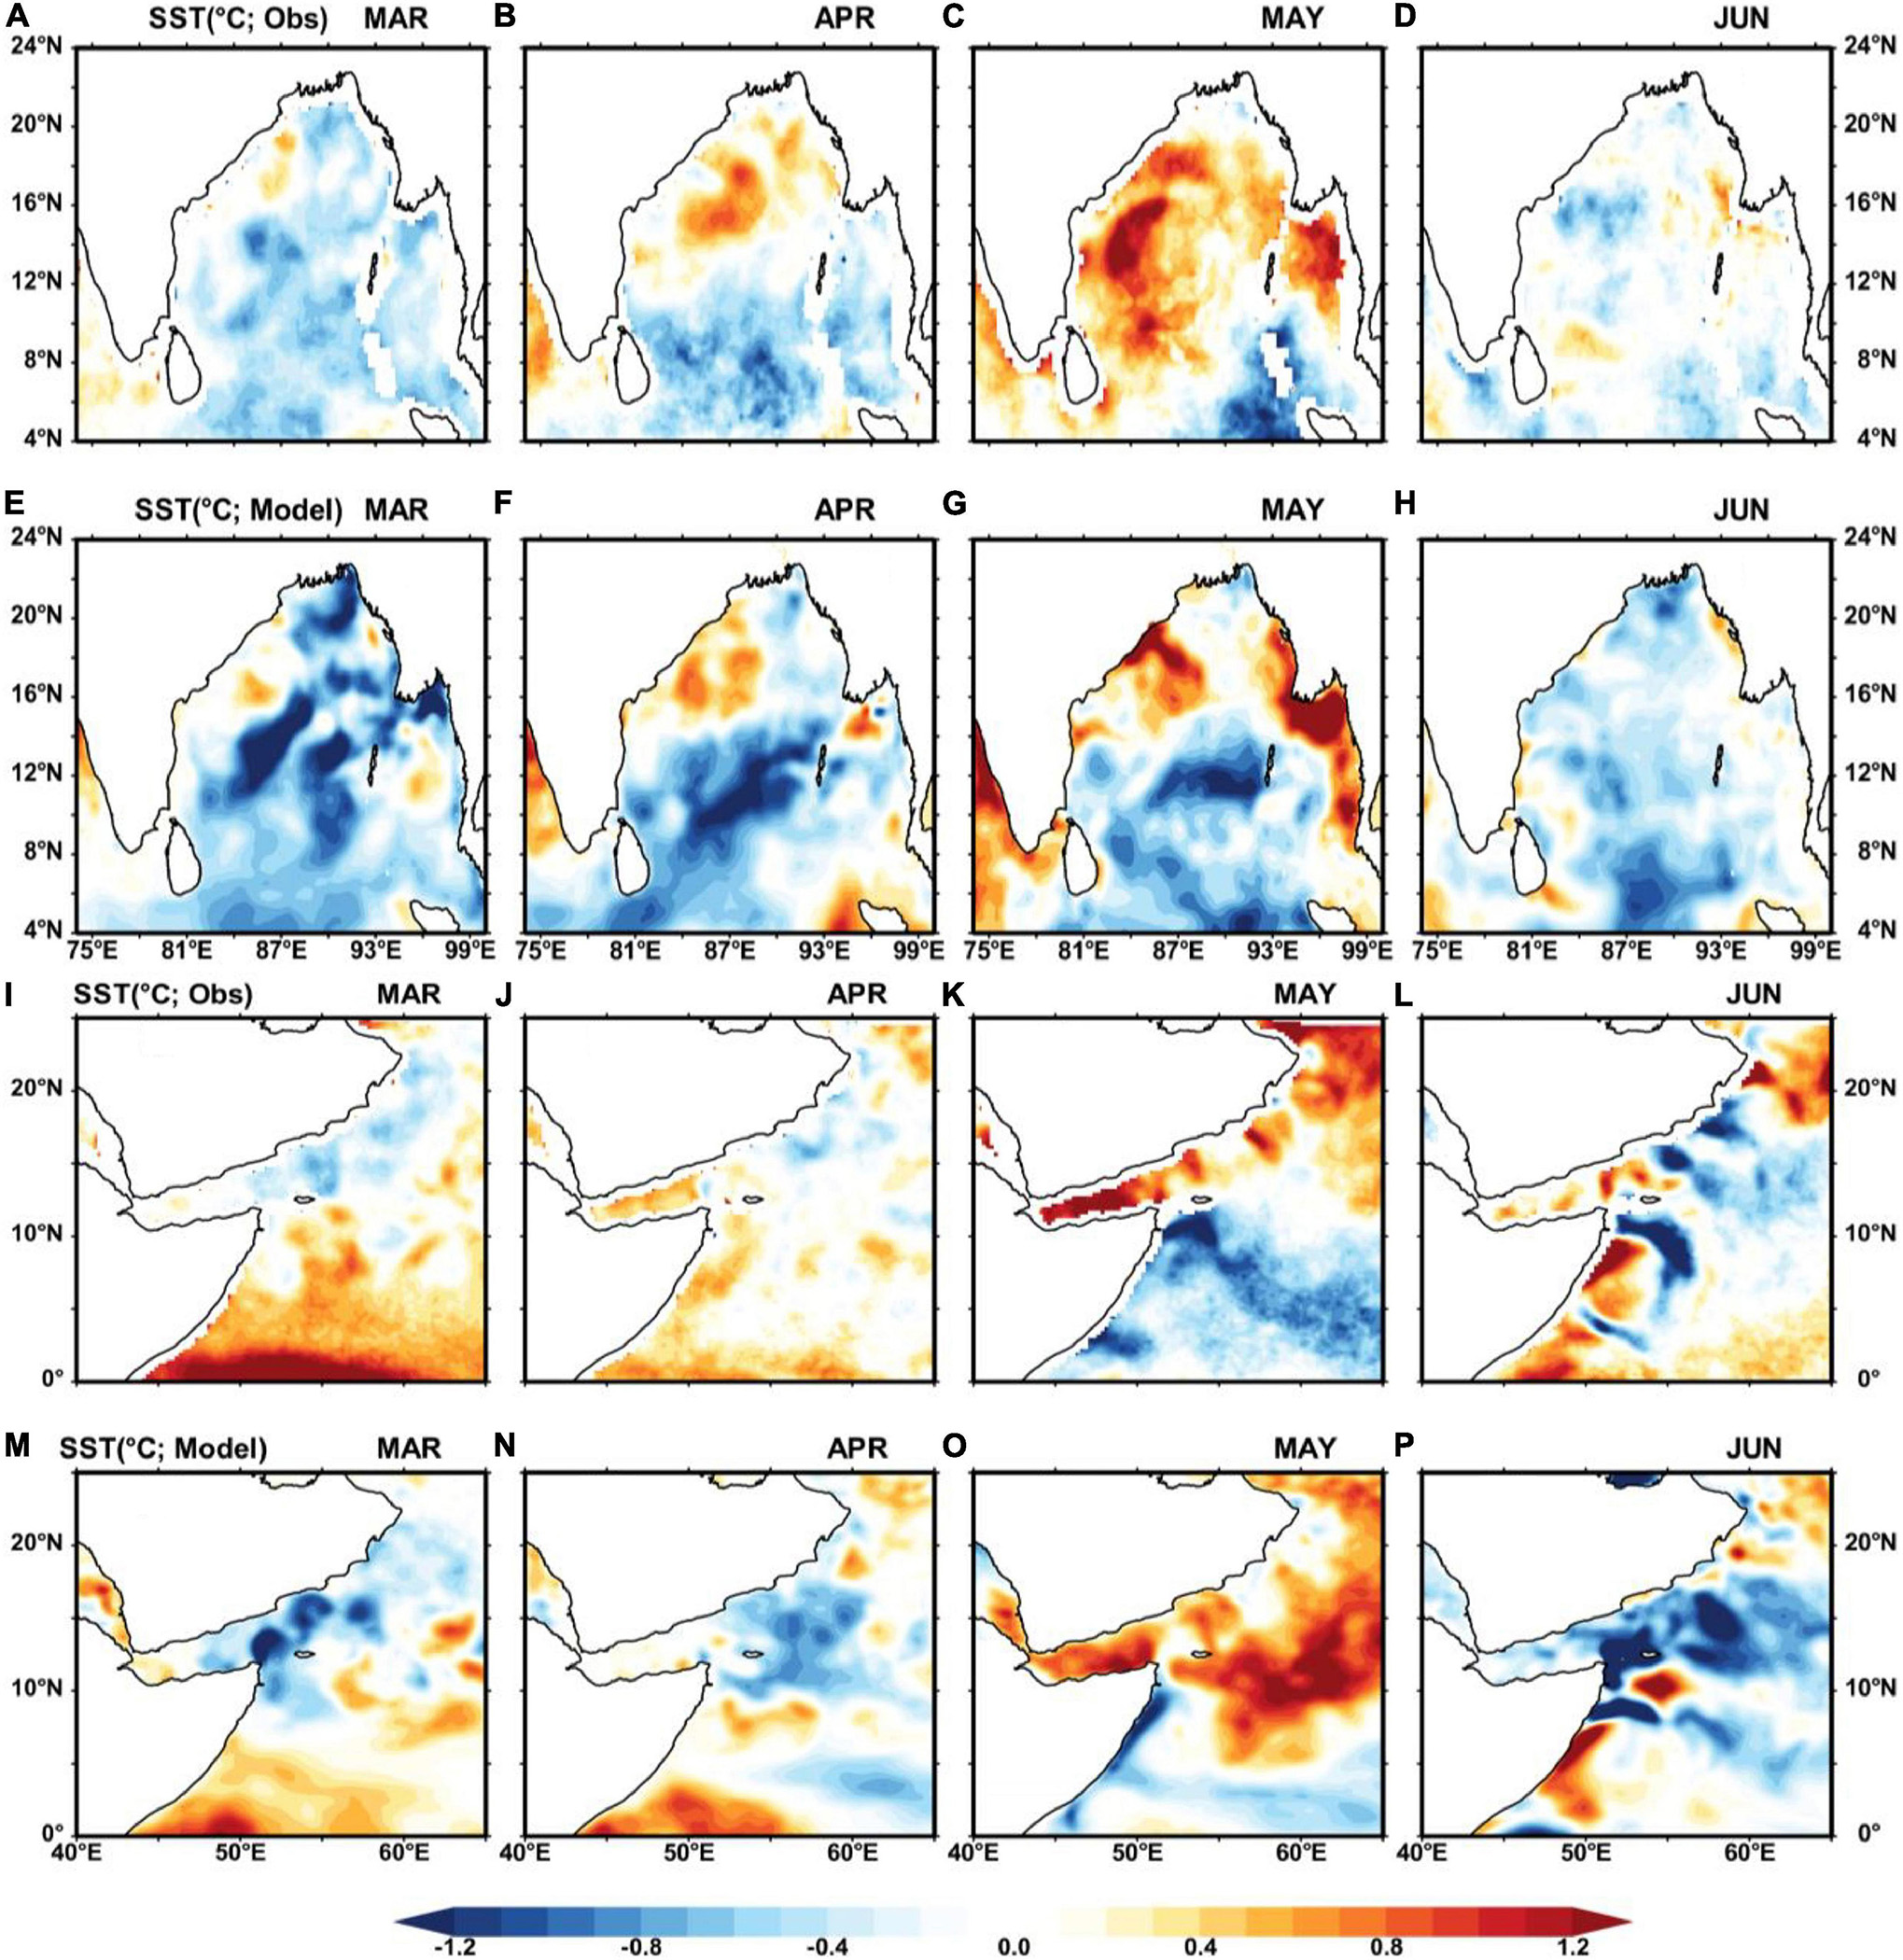
Figure 3. Sea surface temperature (SST) difference (degree centigrade) from pandemic period (March–June of 2020) to pre-pandemic period (March–June of 2019) from the observations (rows 1 and 3) and model simulations (rows 2 and 4) over the BoB (rows 1 and 2) and WAS (rows 3 and 4).
Signatures of the Pandemic Impact From in situ Observations
Figures 4A–D shows the time-depth vertical profiles measured from the RAMA moored buoy (90°E, 12°N) in the BoB. Additionally, the model-simulated profiles are shown for comparison. The model-simulated temperature and salinity profiles agree well with the buoy measurements (statistics of model validation is provided in Table 2). During the non-pandemic period, higher temperature and salinity are noticed in the upper-oceanic layers as compared with the pandemic period. Figures 4E–L) shows the time-depth validation of upper ocean temperature, salinity, Chl-a concentration, and dissolved oxygen are from the in situ measurements of a Bio-Argo float (WMO ID: 2902264) deployed in the CBoB. A comparison is made between the model simulations and the bio-Argo observations (Figures 4F,H,J,L). It can be seen from the figure that the model-simulated parameters along the trajectory of the Bio-Argo float are well reproduced (as shown in Table 2 for statistics). During the pre-pandemic period, the upper ocean was warmer up to a depth of 50 m as compared with the pandemic time.
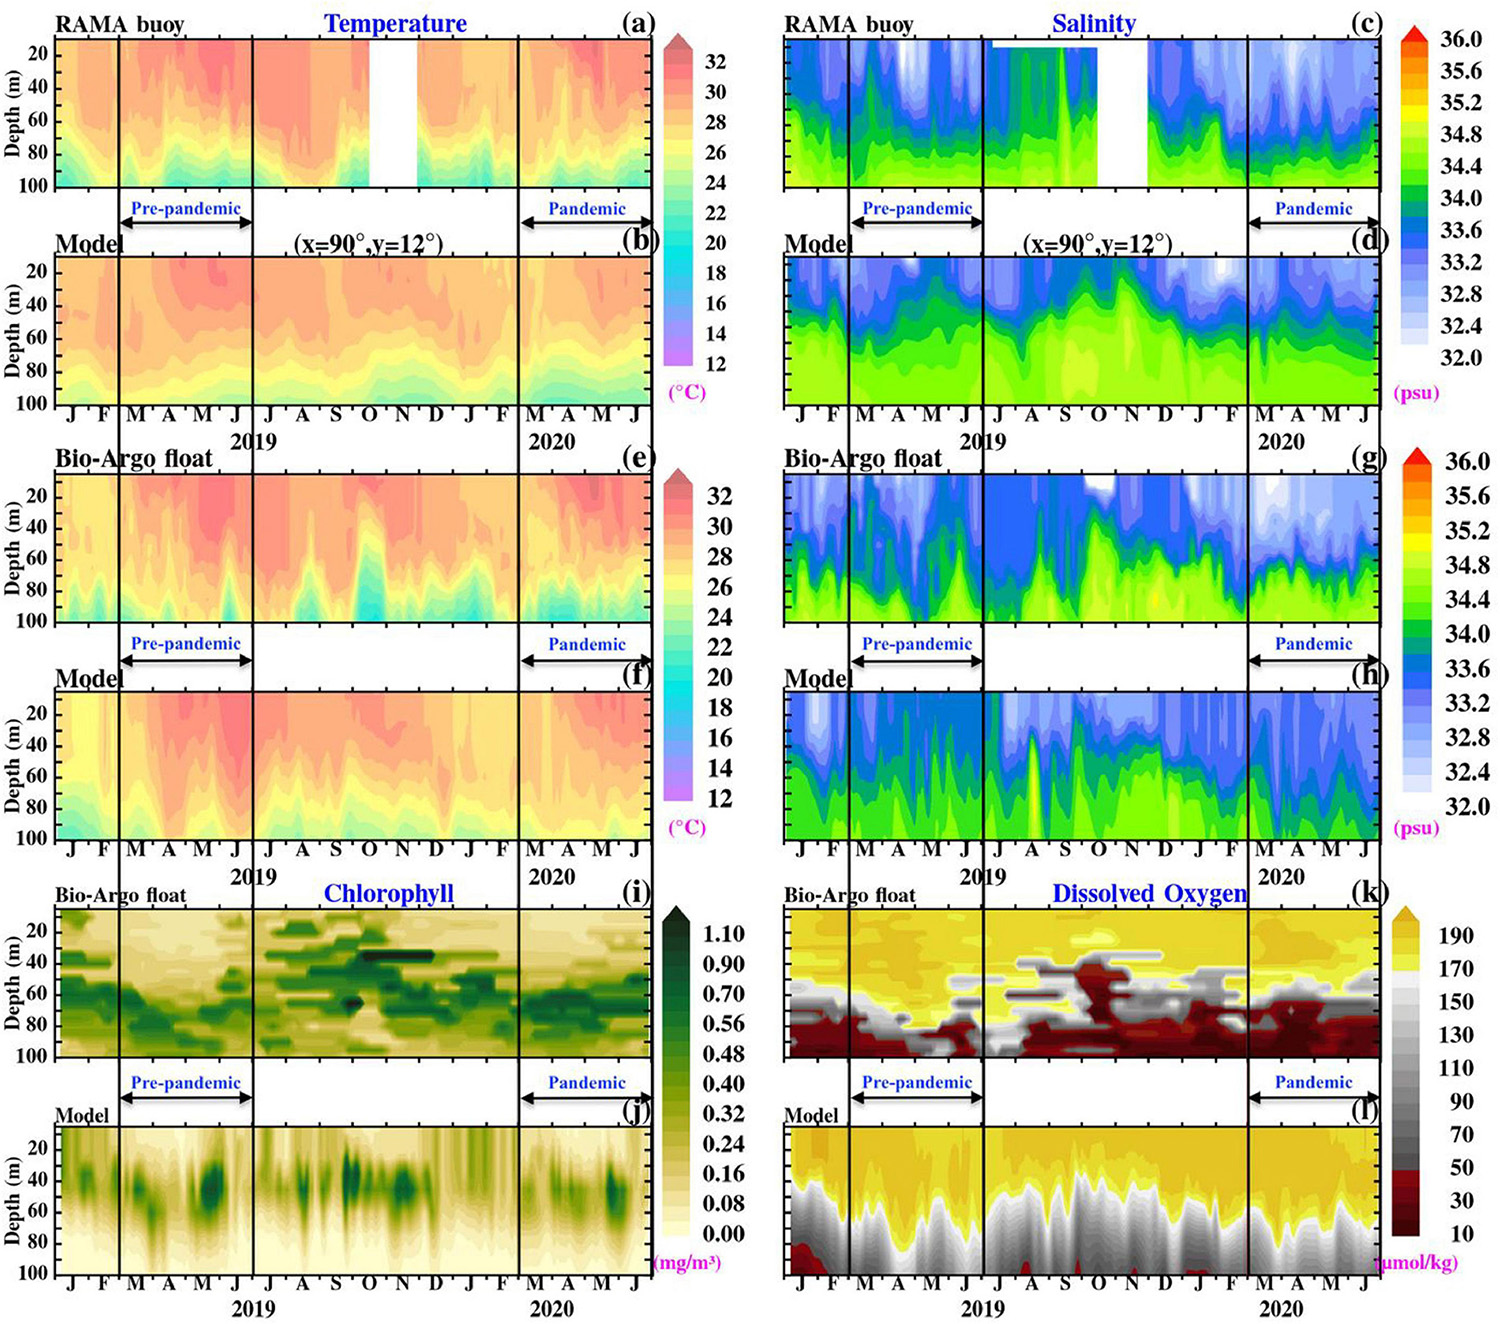
Figure 4. Time-depth section of temperature and salinity from RAMA buoy location at 90°E, 12°N (A,C) in the BoB compared with model-simulated temperature and salinity over the same location (B,D). The observed temperature, salinity, Chl-a concentration, and dissolved Oxygen (E,G,I,K) from the Bio-Argo float (WMO ID. 2902264) in the central BoB compared with the model-simulated parameters along the trajectory of float (F,H,J,L).
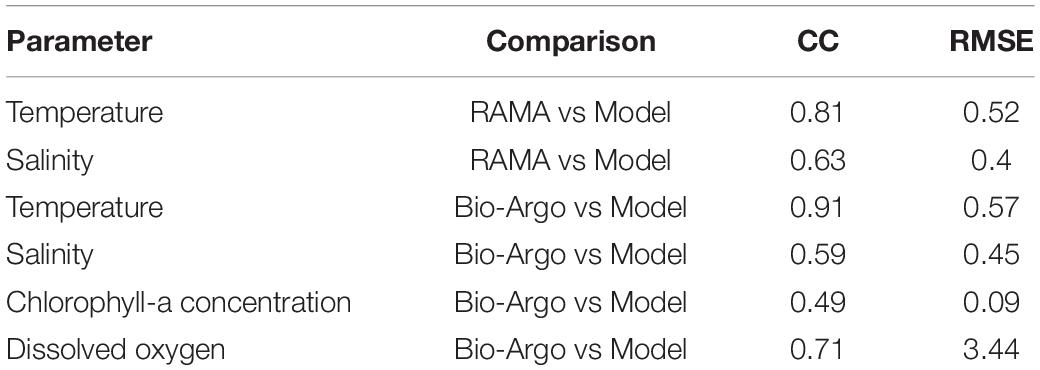
Table 2. The correlation coefficient (CC) and root mean square error (RMSE) for model-simulated parameters against in situ measurements (shown in Figure 4).
Impact of Atmospheric Aerosols/Dust and Ocean Processes
Figures 5A–D shows the difference of AOD over the BoB for the pandemic and non-pandemic periods. The AOD difference along the east coast of India shows a slight decrease during March–April of the pandemic period. Further, the effect of tropical cyclone Amphan on the aerosol loading is noticed in terms of a negative value in the difference plots. Figures 5E–H shows the difference (pandemic – pre-pandemic) of aerosol loading from the AP region in March–June which is associated with the stronger wind speed and dust storms in this region. Except in March, the rest of the pandemic shows a high AOD due to this wind-driven aerosol loading. These aerosols settle on the ocean surface which is favorable for the supply of nutrients in the upper ocean. This could be a reason for the observed high Chl-a concentration (Figures 2I–P) over this region during the pandemic period. To demonstrate the role of winds in dust transport, the difference in surface wind speed from pandemic to pre-pandemic period is shown in Figure 6. The wind vectors in the figure show the climatological (2013–2020) winds for the respective months over the BoB, and AS derived from ERA5 reanalyssis data. The figure shows stronger than normal westerly winds from desert regions to the AS in May of the pandemic period.
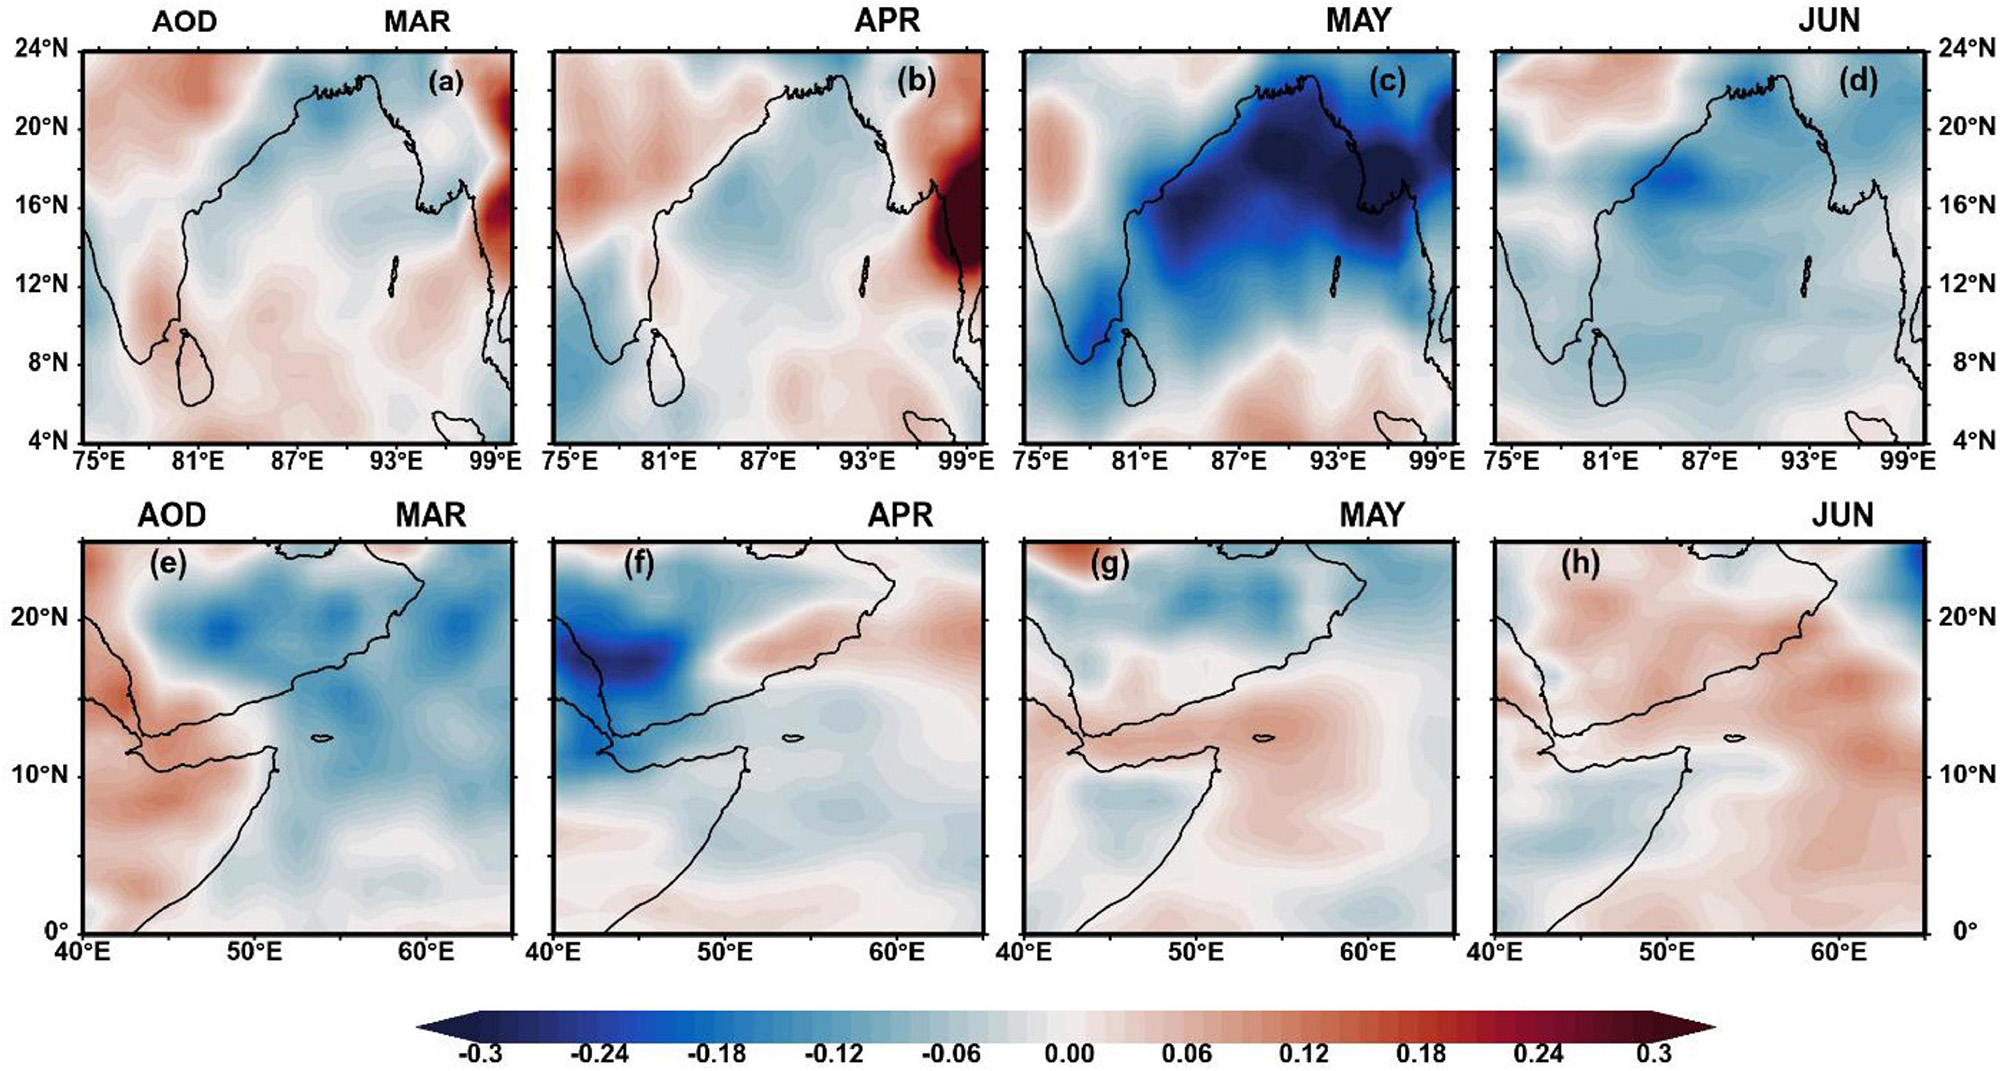
Figure 5. Difference (pandemic – pre-pandemic) in aerosol optical depth over the BoB (A–D) and WAS (E–H).
Figure 6. Difference of wind speed (shaded, in meter per second) over the BoB (A–D) and WAS (E–H) for the year 2020 to 2019 (i.e., pandemic – pre-pandemic period) overlaid with climatological mean (2013 to 2020) wind vectors for respective months derived from ERA5 reanalysis data.
The atmospheric aerosols (dust) deposition is responsible for providing macronutrients and micronutrients to the open ocean (Fung et al., 2000; Gabric et al., 2002; Jickells et al., 2005). The phytoplankton growth is observed in heavy dust event time due to the availability of micronutrients content in the dust (Wang et al., 2012). Figures 7A–D shows the low dust amount deposition along the coast during March of the pandemic. This is also one of the reasons for the lack of supply of nutrients in the ocean over the WAS in March (Figures 7E–H). The dust deposition increased during April–June which supplied nutrients to the open ocean favoring high Chl-a concentration. The sea salt surface concentration along the east coast of India (WBoB) is shown in Figure 8. It shows negative values from March–June. Over the CBoB, a high concentration of sea salt is observed in May, which could be due to strong winds prevailed during the passage of cyclone Amphan. The AS also observed a high concentration of sea salt during May–June of the pandemic year (Figures 8E,F).
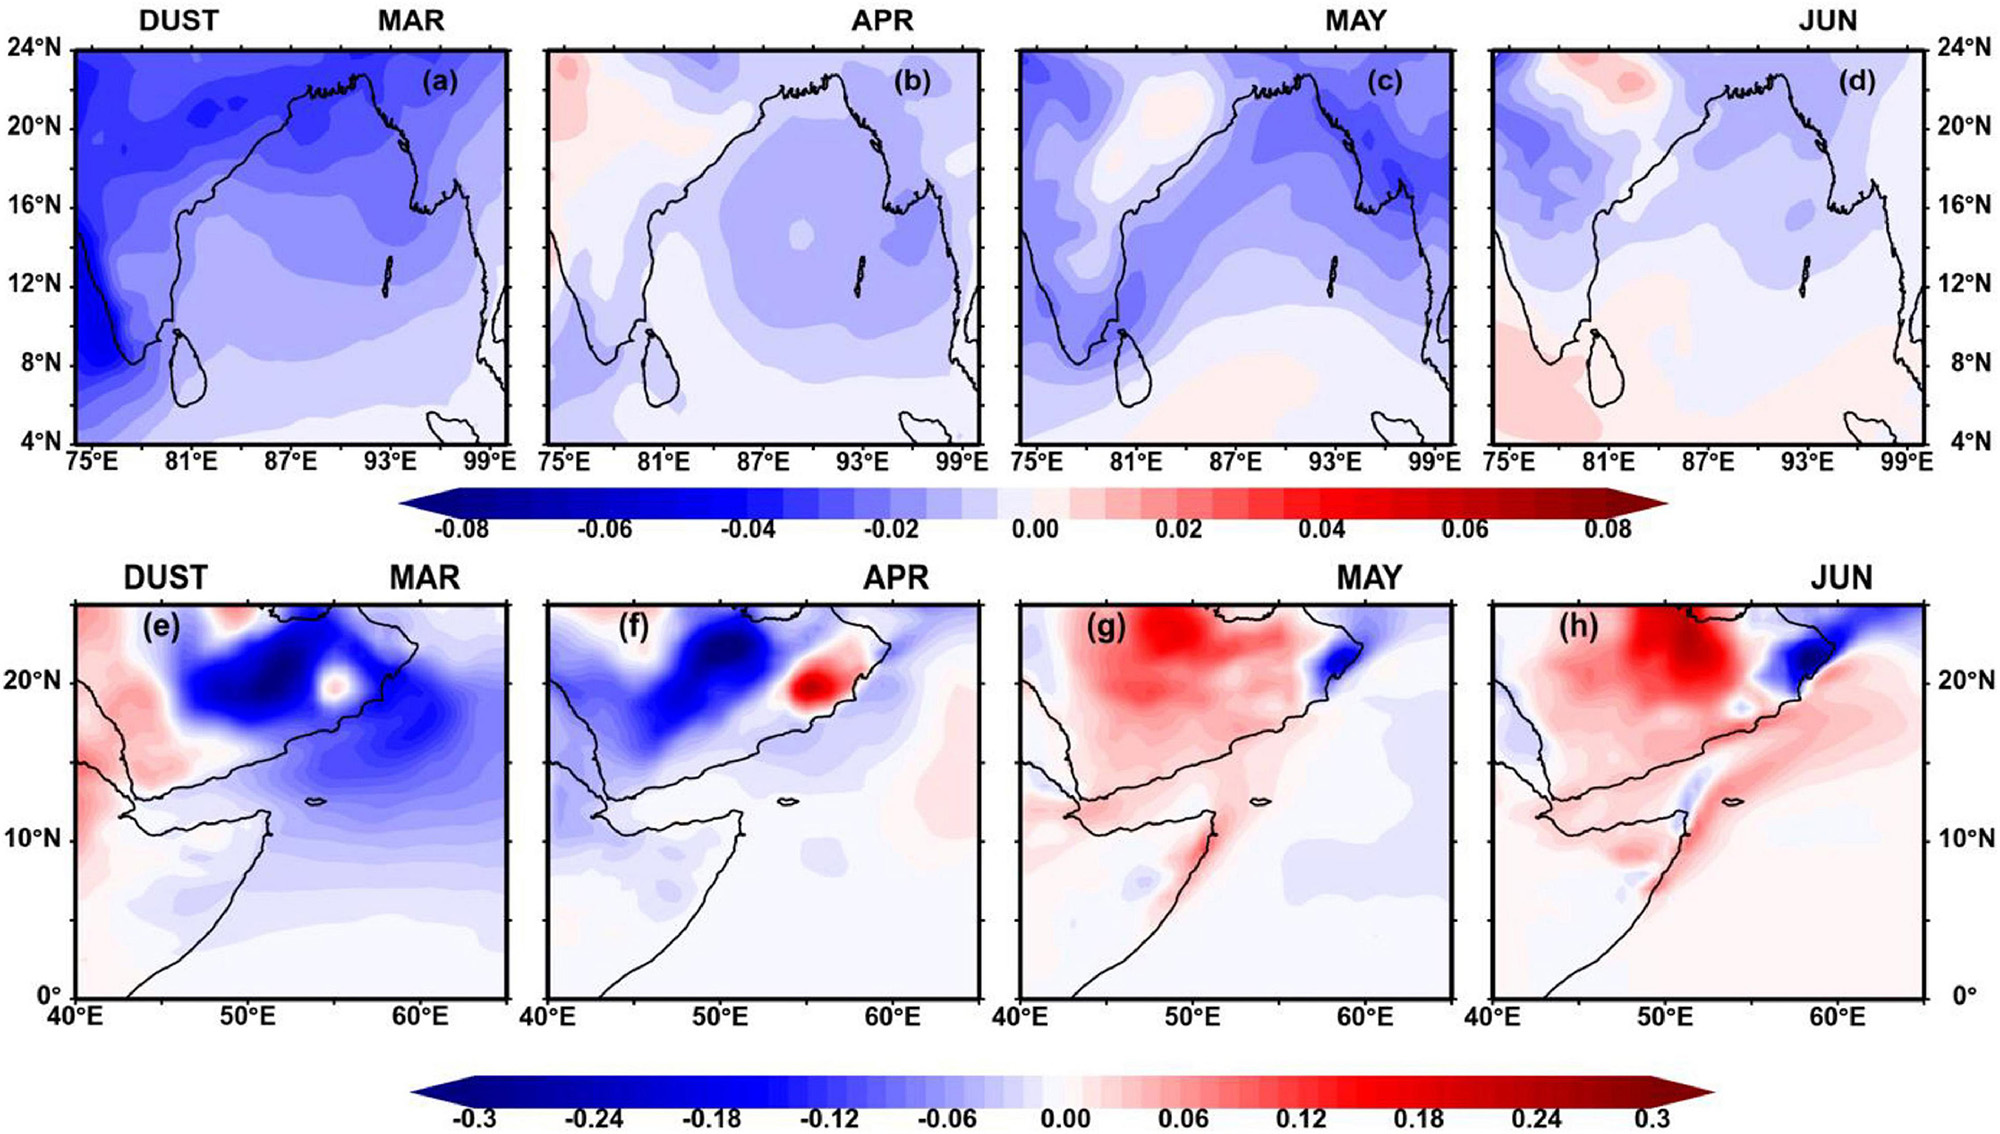
Figure 7. Difference (pandemic – pre-pandemic) in dust mass concentration (×10– 6 kg m– 3) over the BoB (A–D) and WAS (E–H).
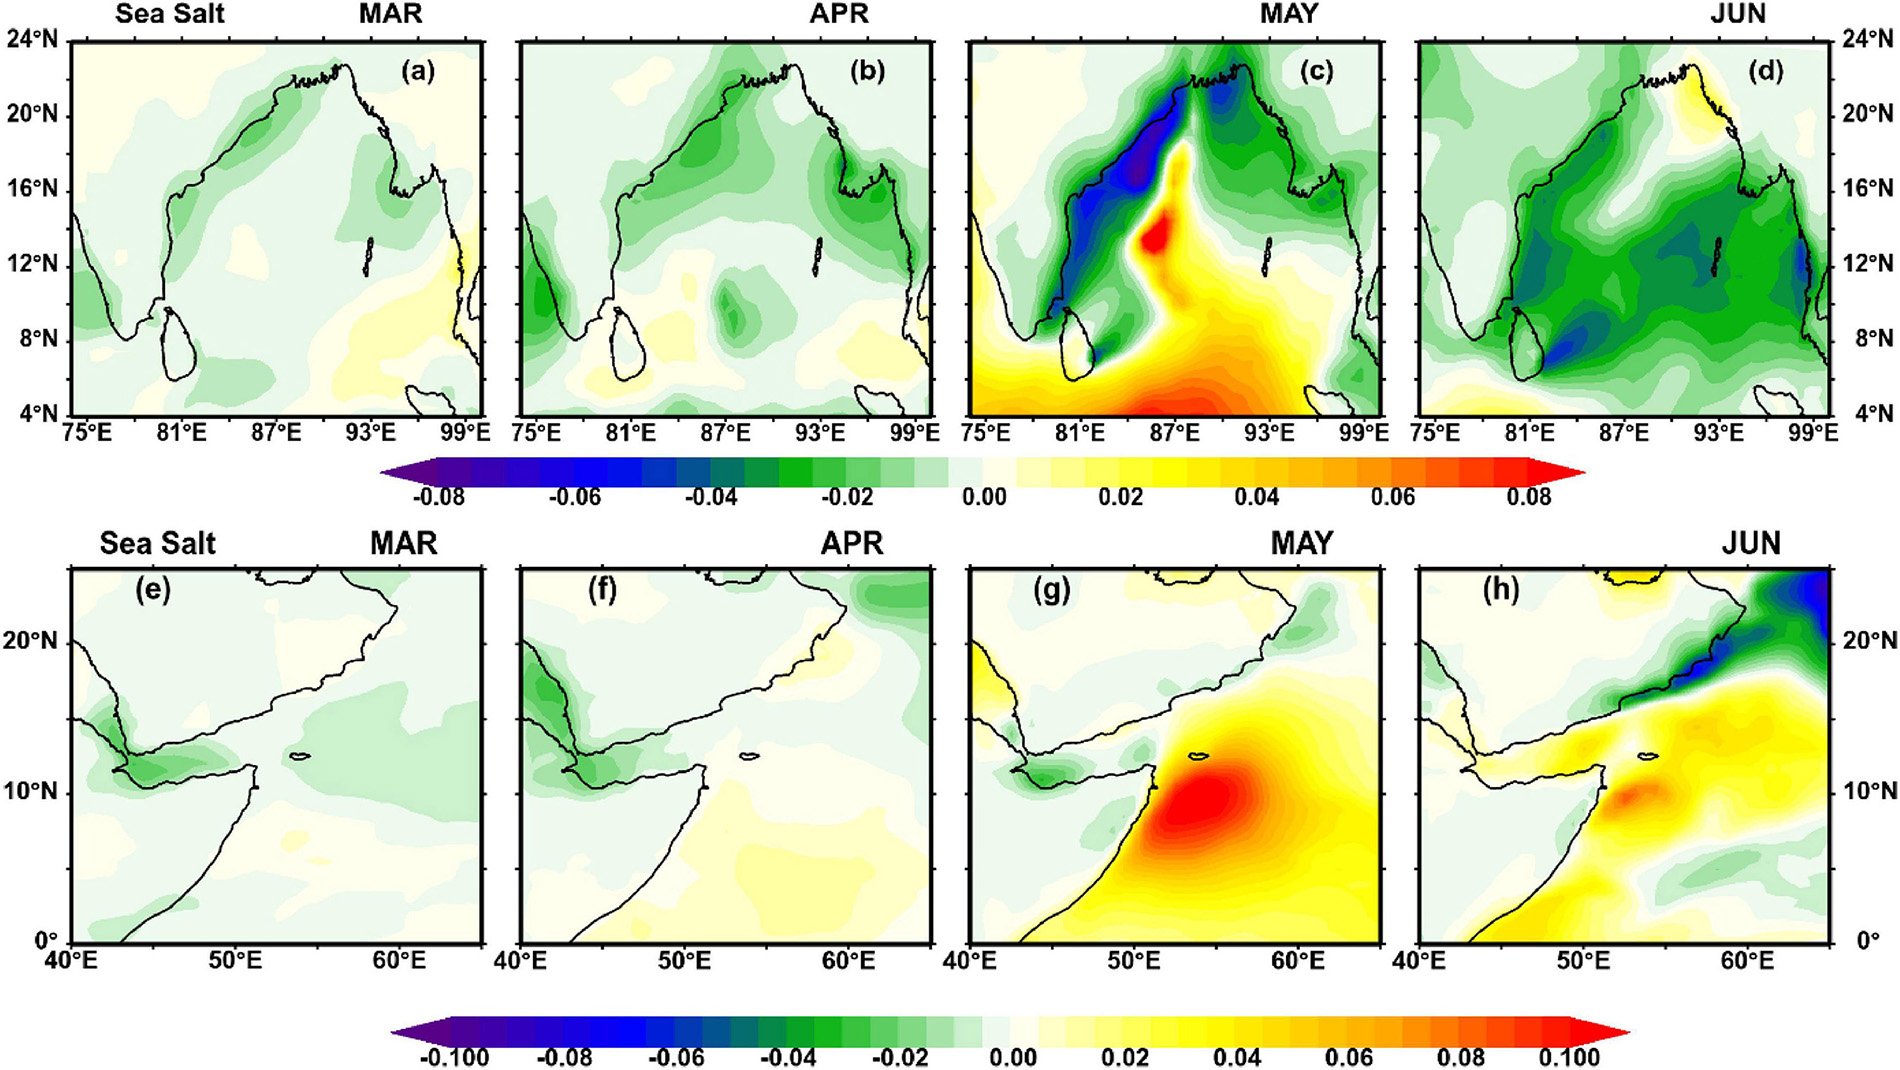
Figure 8. Difference (pandemic – pre-pandemic) in sea salt concentration (×10– 6 kg m– 3) over the BoB (A–D) and WAS (E–H).
Figures 9A–D shows a decline in NO2 concentration along the east coast of India during the pandemic which altered coastal nitrogen inputs (Mishra et al., 2020). This reduction in NO2 is attributed to the reduced anthropogenic activities which could be a reason for the drop of Chl-a concentration in the WBoB coastal region (Figure 2A–H). Figures 9E–H shows positive values of NO2 over the AP during the pandemic time which contributed to nitrogen input in the ocean. Figure 10 shows model-simulated nitrate concentration averaged from 0 to 75 m. Nitrate is the primary nutrient for the growth of phytoplankton. During March–June along the east coast of India, low nitrate availability results in low Chl-a concentration (as noticed in Figures 2A–H). At the same time, Sri Lanka dome and CBoB have high nitrate which is conducive for the high Chl-a concentration over these regions.
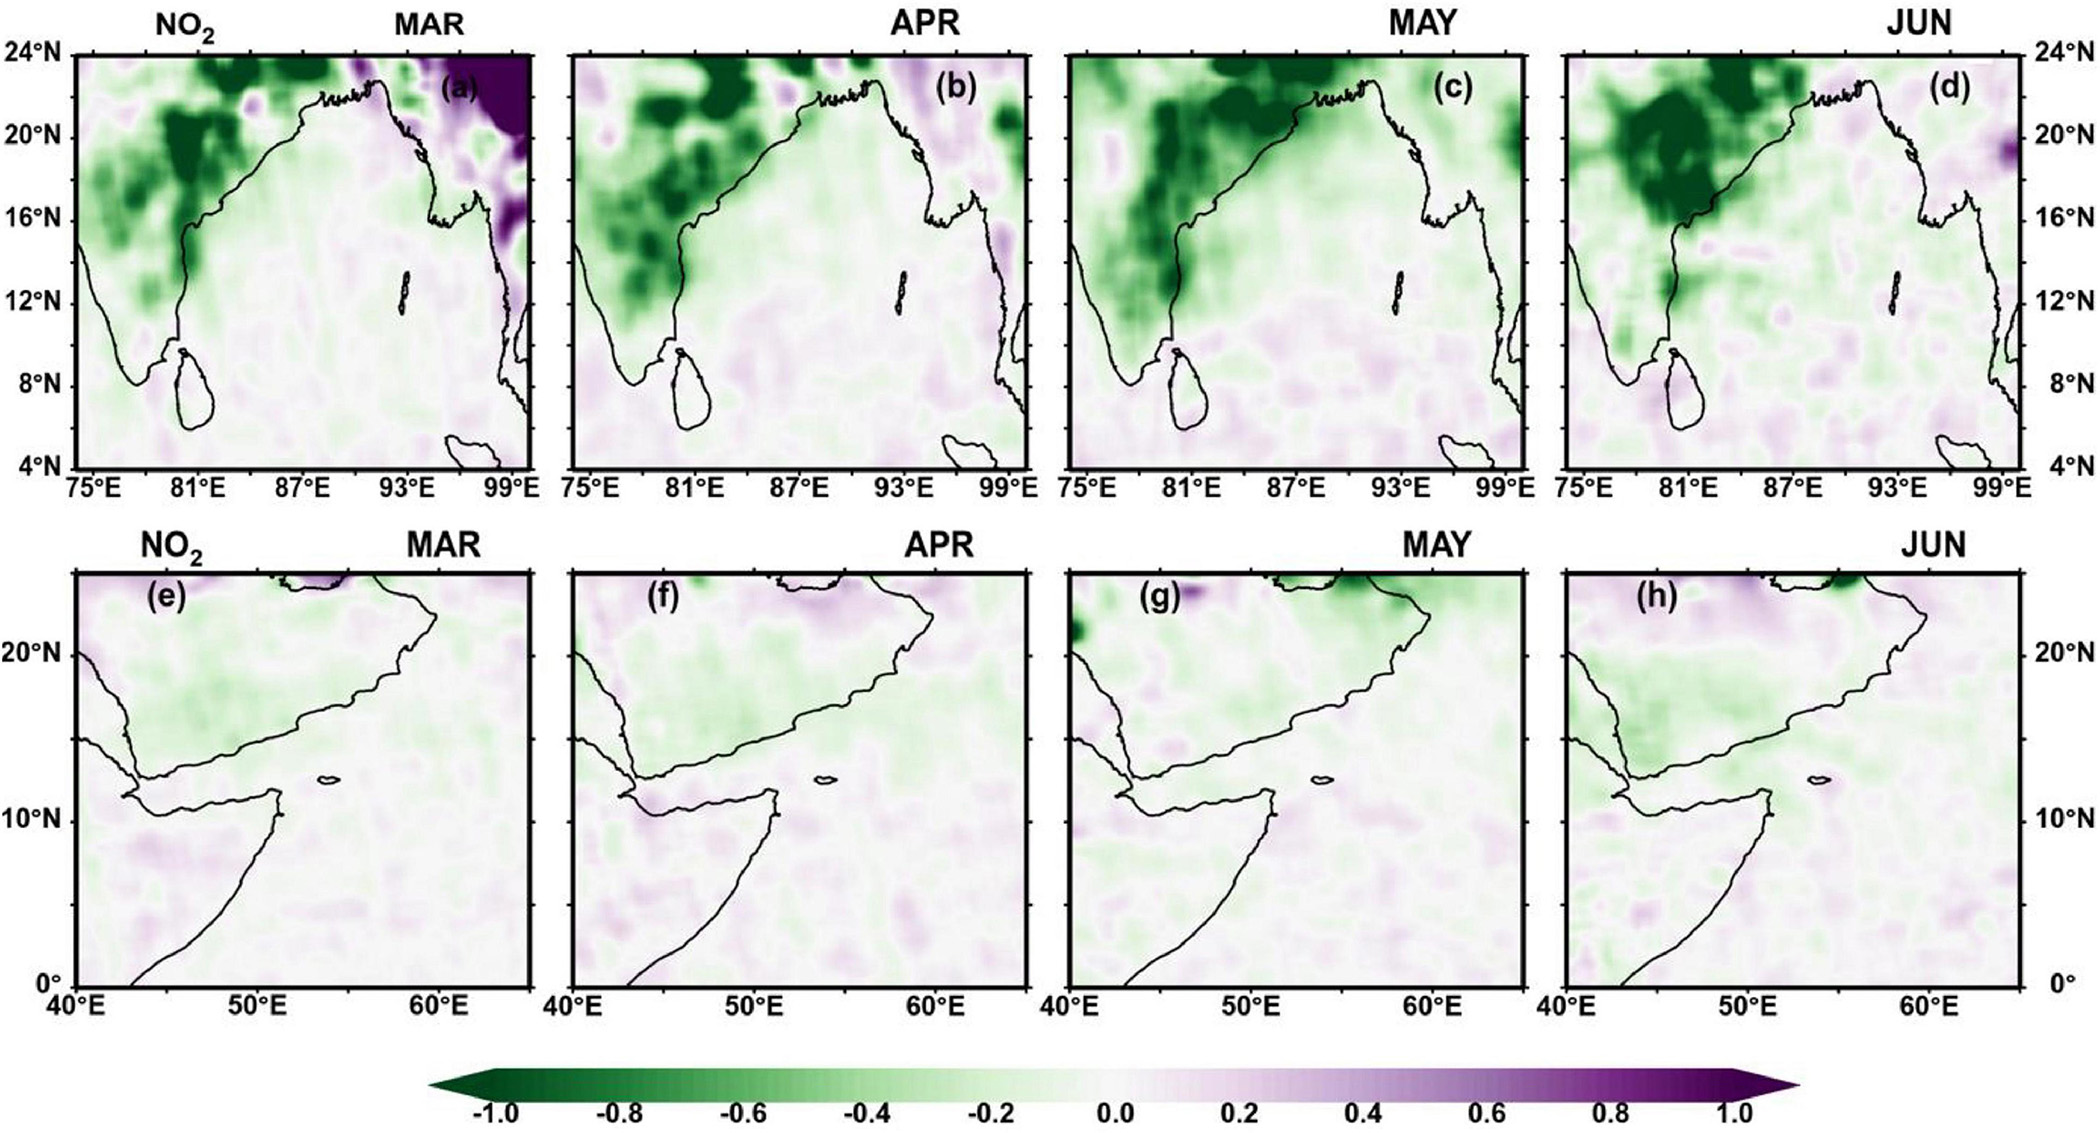
Figure 9. Difference (pandemic – pre-pandemic) in NO2 concentration (×1015 mole cm– 2) over the BoB (A–D) and WAS (E–H).
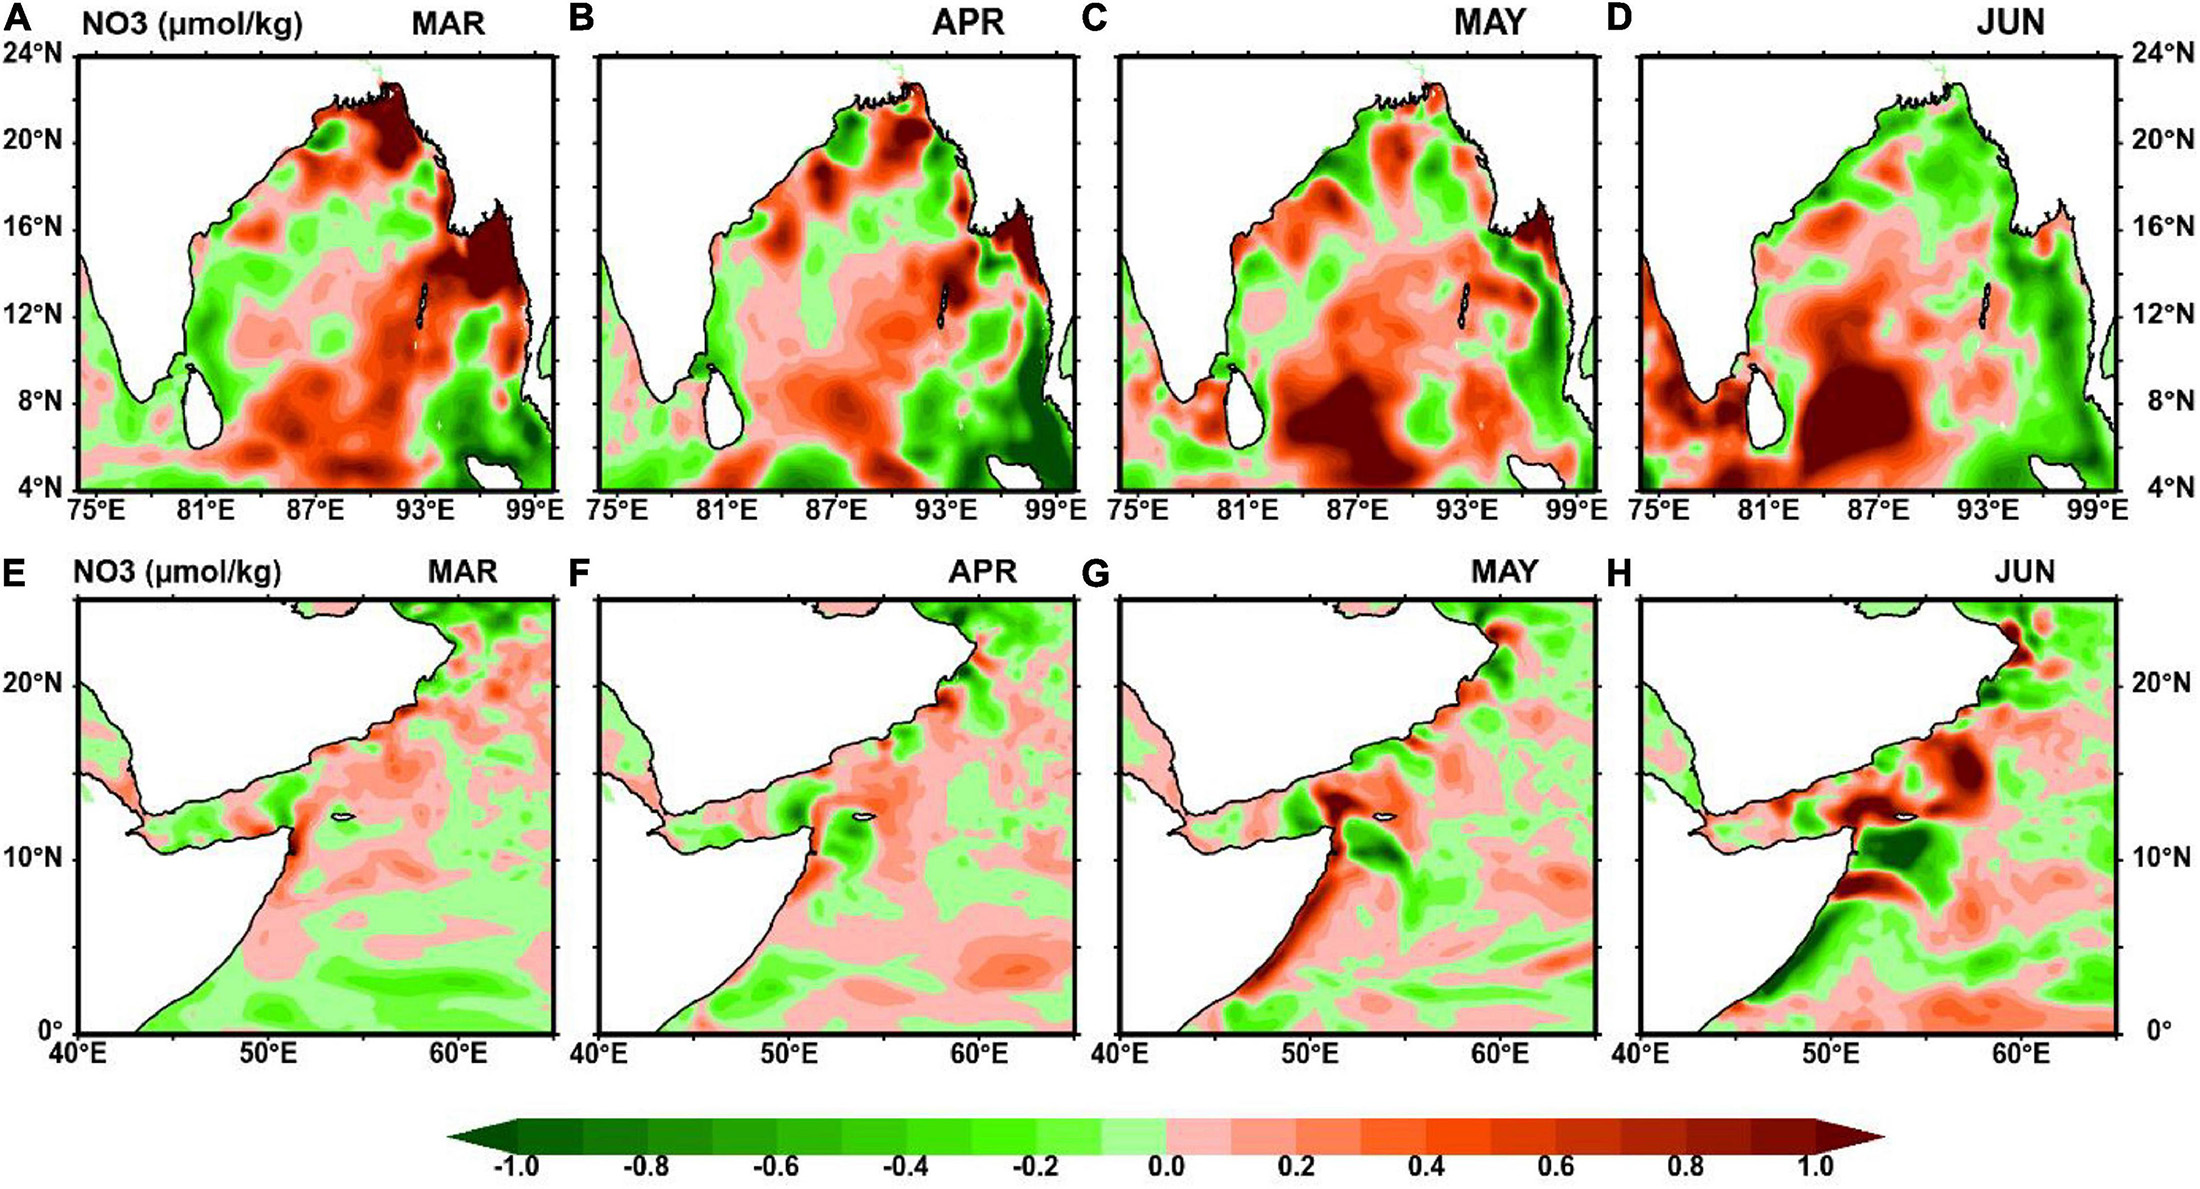
Figure 10. Difference (pandemic – pre-pandemic) in model-simulated Nitrate (NO3) concentration (micromolperkilogram) averaged from surface to 75 m depth over the BoB (A–D) and WAS (E–H).
Since the lockdown-driven reduced anthropogenic inputs primarily affect the coastal ocean, three analyses regions in the BoB are selected as Box1 (85°-87.5°E, 19°-19.5°N), Box-2 (80.6°-83°E, 12°-15°N), and Box3 (82°-90°E, 4°-9°N). The locations of these analyses regions are marked by red boxes in Figure 1. Figure 11 shows the time-depth section of the difference of pandemic to pre-pandemic period (year 2020 minus 2019) of model-simulated Chl-a, temperature, and nitrate in the BoB averaged over Box1, Box2, and Box3 regions in the BoB. In the Box1 region (northwestern coastal BoB), warmer temperature and negative anomaly of subsurface Chl-a concentration observed during April–June of pandemic. Similarly, the Box2 region in western coastal BoB shows a decrement in Chl-a concentration during the pandemic period with respect to pre-pandemic conditions. This decrease in Chl-a concentration is attributed to the reduced anthropogenic emissions during the lockdown and, hence, a lack of micronutrients in the upper ocean. In the Box3 region (in southern BoB off Sri Lanka), Chl-a concentration was abundant at a depth of 20–50 m during pandemic. In May, a reduction in SST and increase in Chl-a concentration (by more than 0.5 mg m–3) were observed due to Amphan cyclone-induced upwelling in the Box3 region. The Sri Lanka dome experiences upwelling by early May due to change in wind direction. A Chl-a bloom can be seen in mid-May to the end of June over the dome region in Box3.
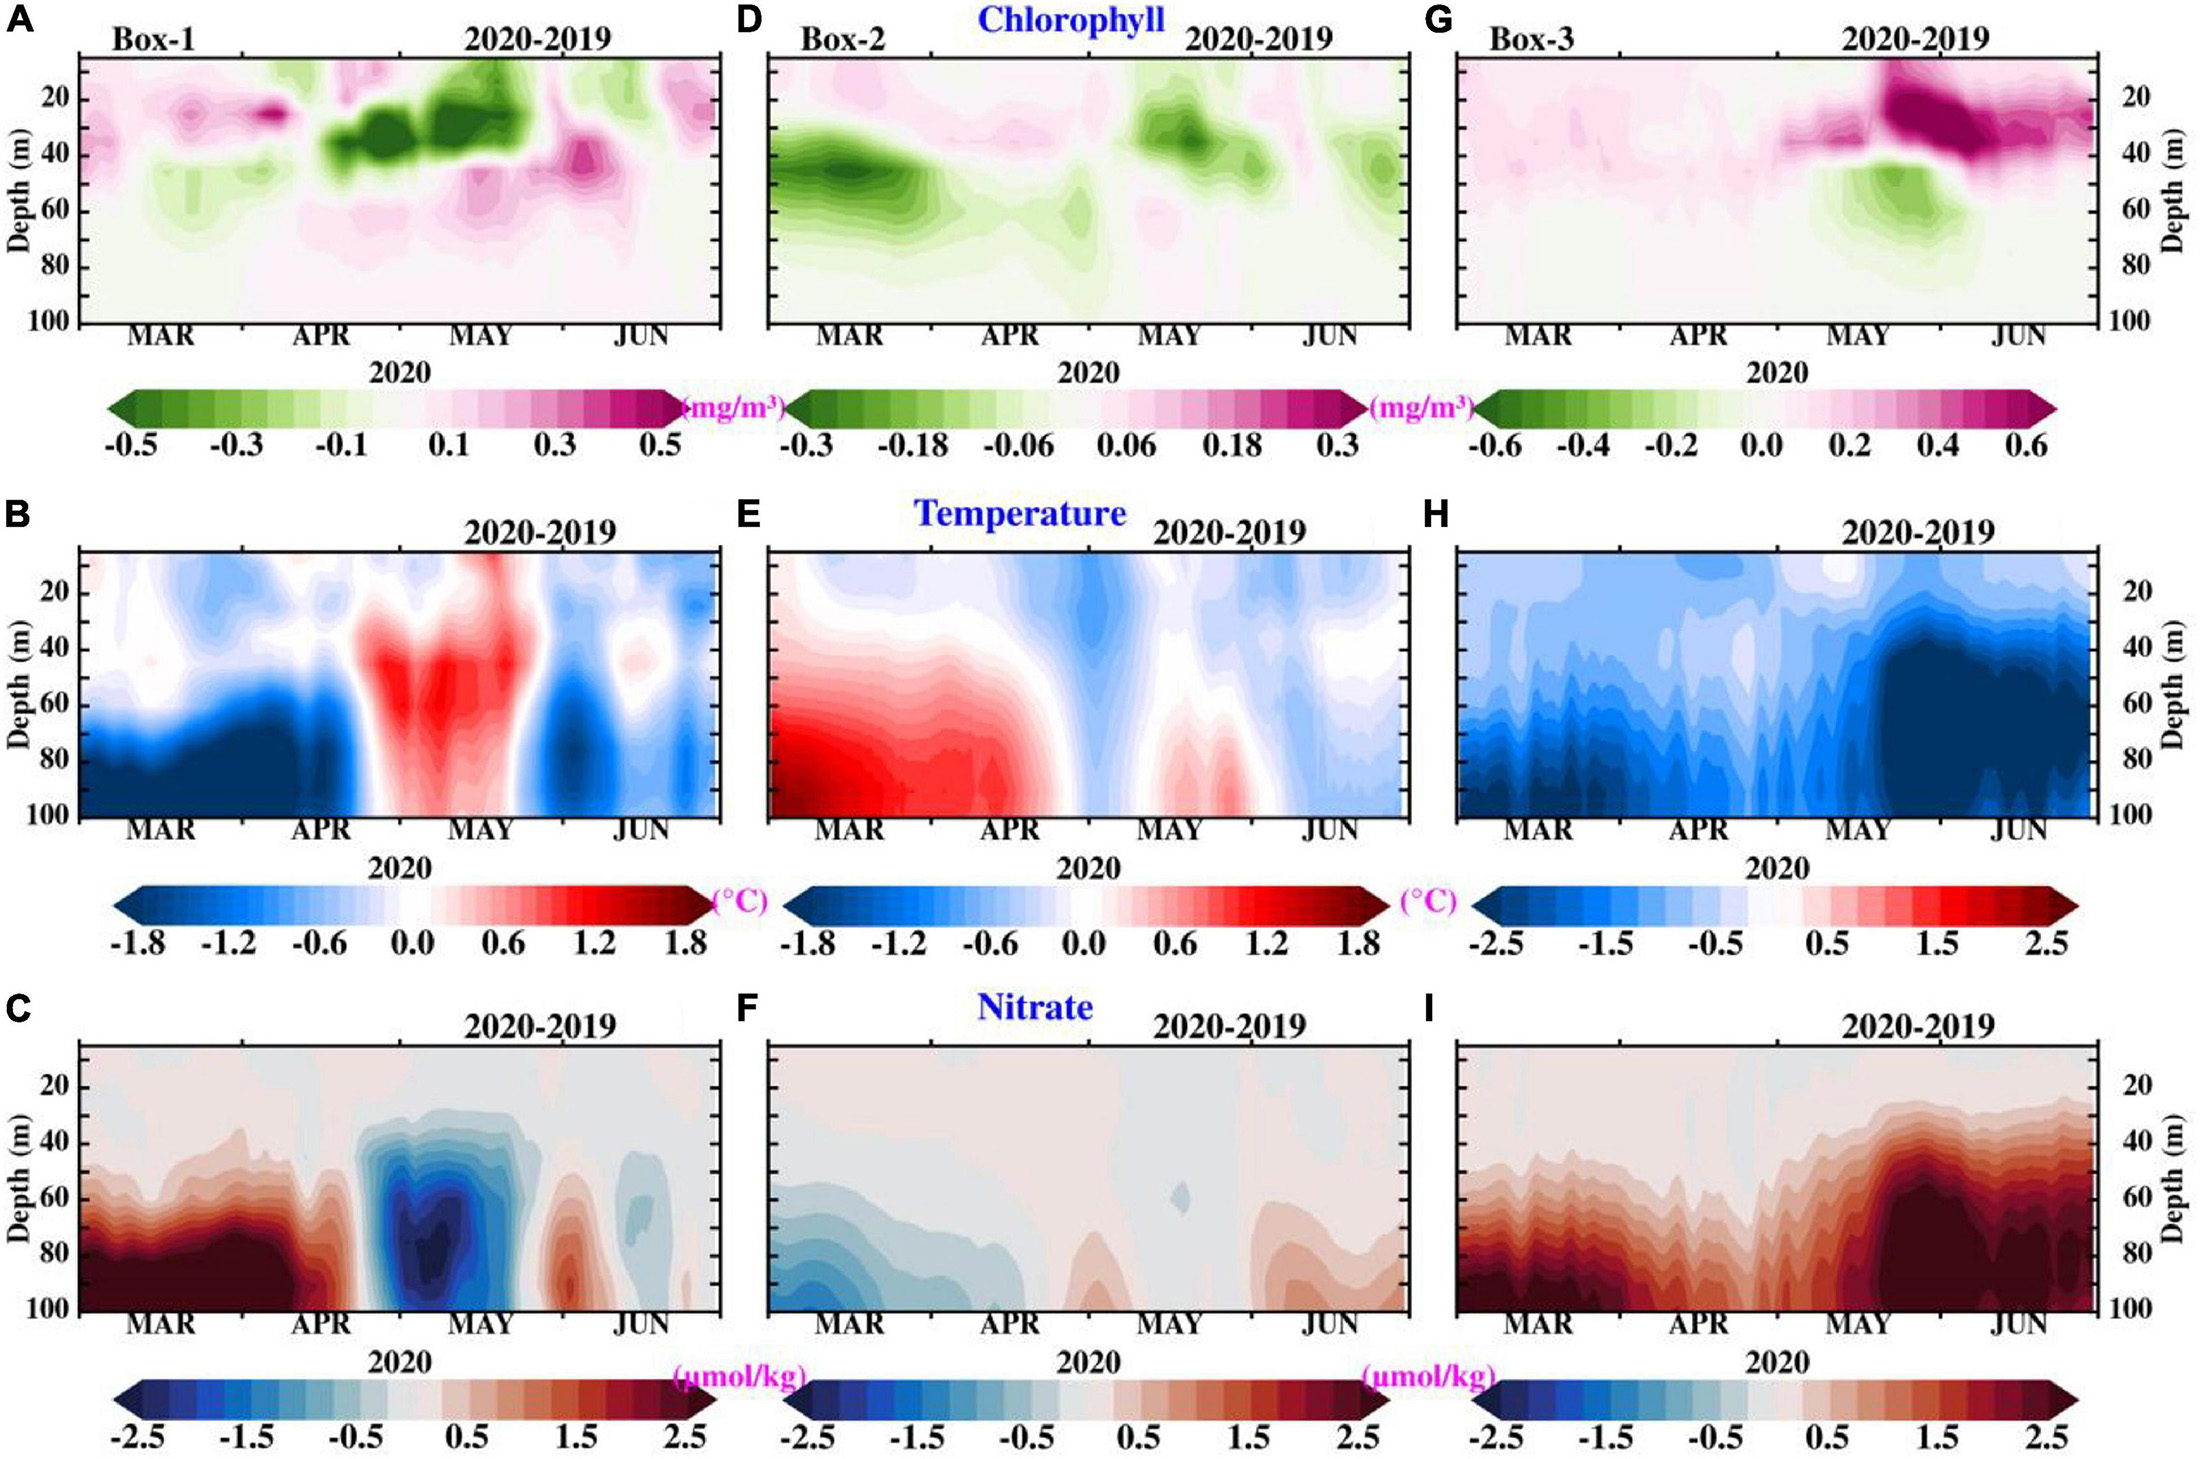
Figure 11. Time-depth section of the difference of pandemic to the pre-pandemic period (the year 2020 – 2019) of model-simulated Chl-a concentration, temperature, and nitrate in the BoB averaged over (A–C) Box1 (85°E-87.5°E, 19°N-19.5°N), (D–F) Box2 (80.6°E-83°E, 12°N-15.5°N), and (G–I) Box3 (82°E-90°E, 4°N-9°N) regions. Box1, Box2, and Box3 are marked in Figure 1.
The latitudinal sections across the Oman coast (as shown in Figure 1 as blue contour) for the model-simulated Chl-a concentration, temperature, and nitrate are shown in Figures 12–14, respectively. At the northern part of the Oman coast, intense Chl-a blooms are observed in the pre-monsoon. In the northern Oman coast during March of the pandemic, the upper ocean Chl-a concentration shows a positive difference with respect to normal (Figure 12I), low warming (Figure 13I), and enough nutrient supply (Figure 14I). In April–May, the Oman coast experienced low productivity due to weaker winds and increase in SST. The weaker winds reduced the convective mixing leading to a reduction of nitrate concentration. During May–June, the reversal of monsoon winds triggers the mixing and at the same time, the coastal upwelling supports the supply of nutrients from the subsurface to the surface leading to Chl-a bloom.
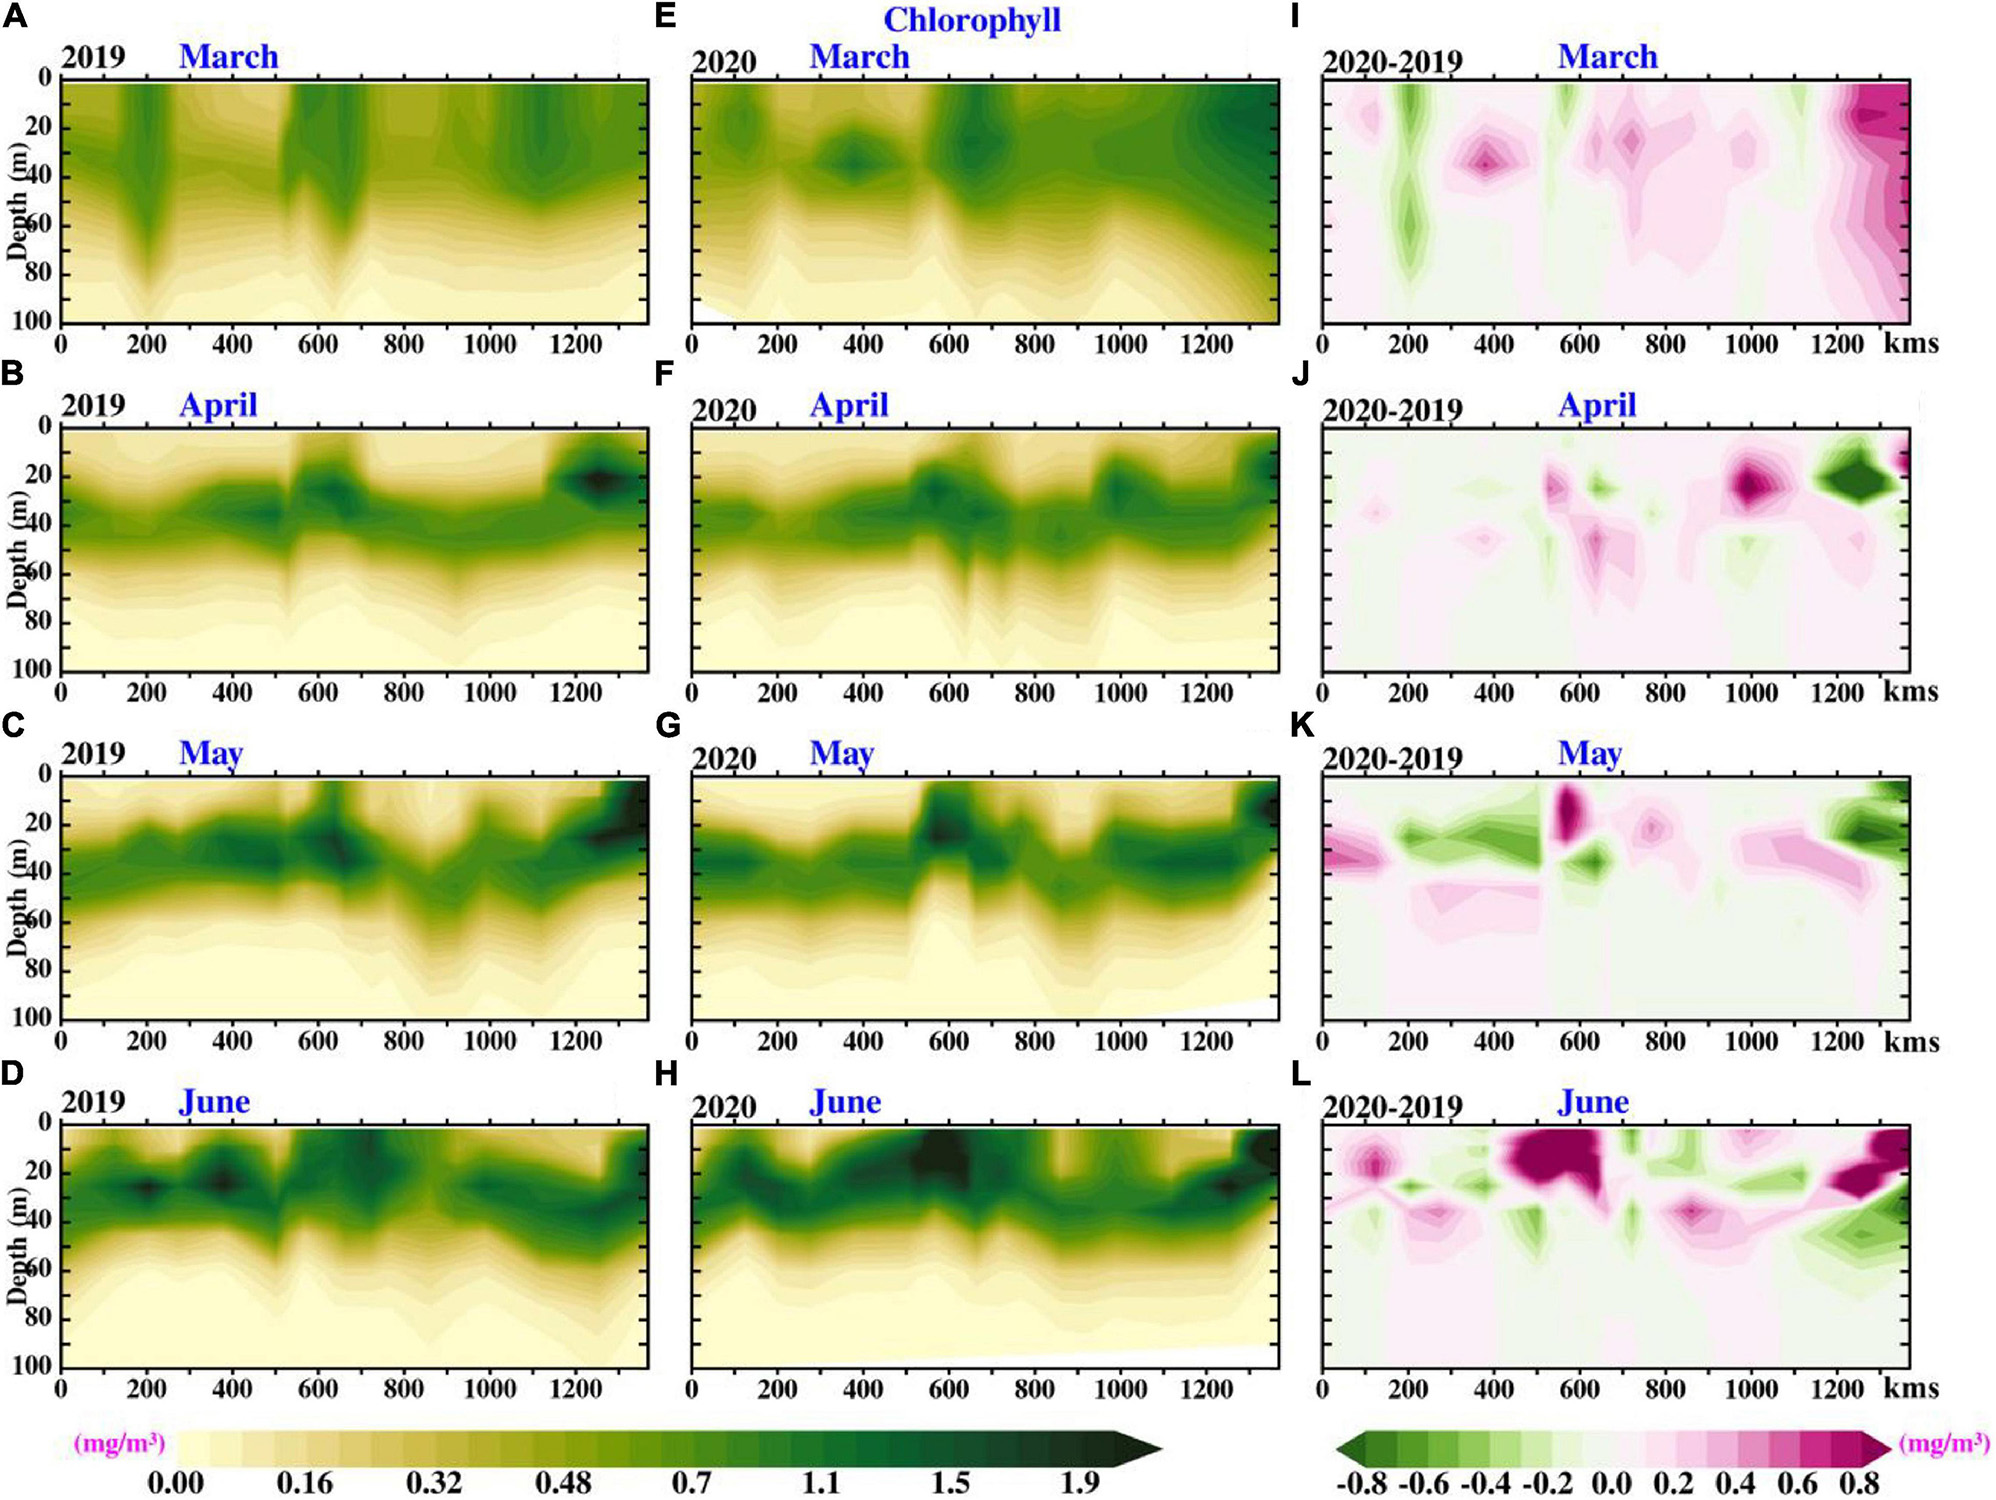
Figure 12. Evolution of model-simulated Chl-a concentration along the 1,000 m isobath off Oman coast (as shown in Figure 1): (A–D) during the pre-pandemic period (March–June, 2019), (E–H) pandemic period (March–June, 2020), and (I–L) Chl-a concentration difference (pandemic–pre-pandemic period).
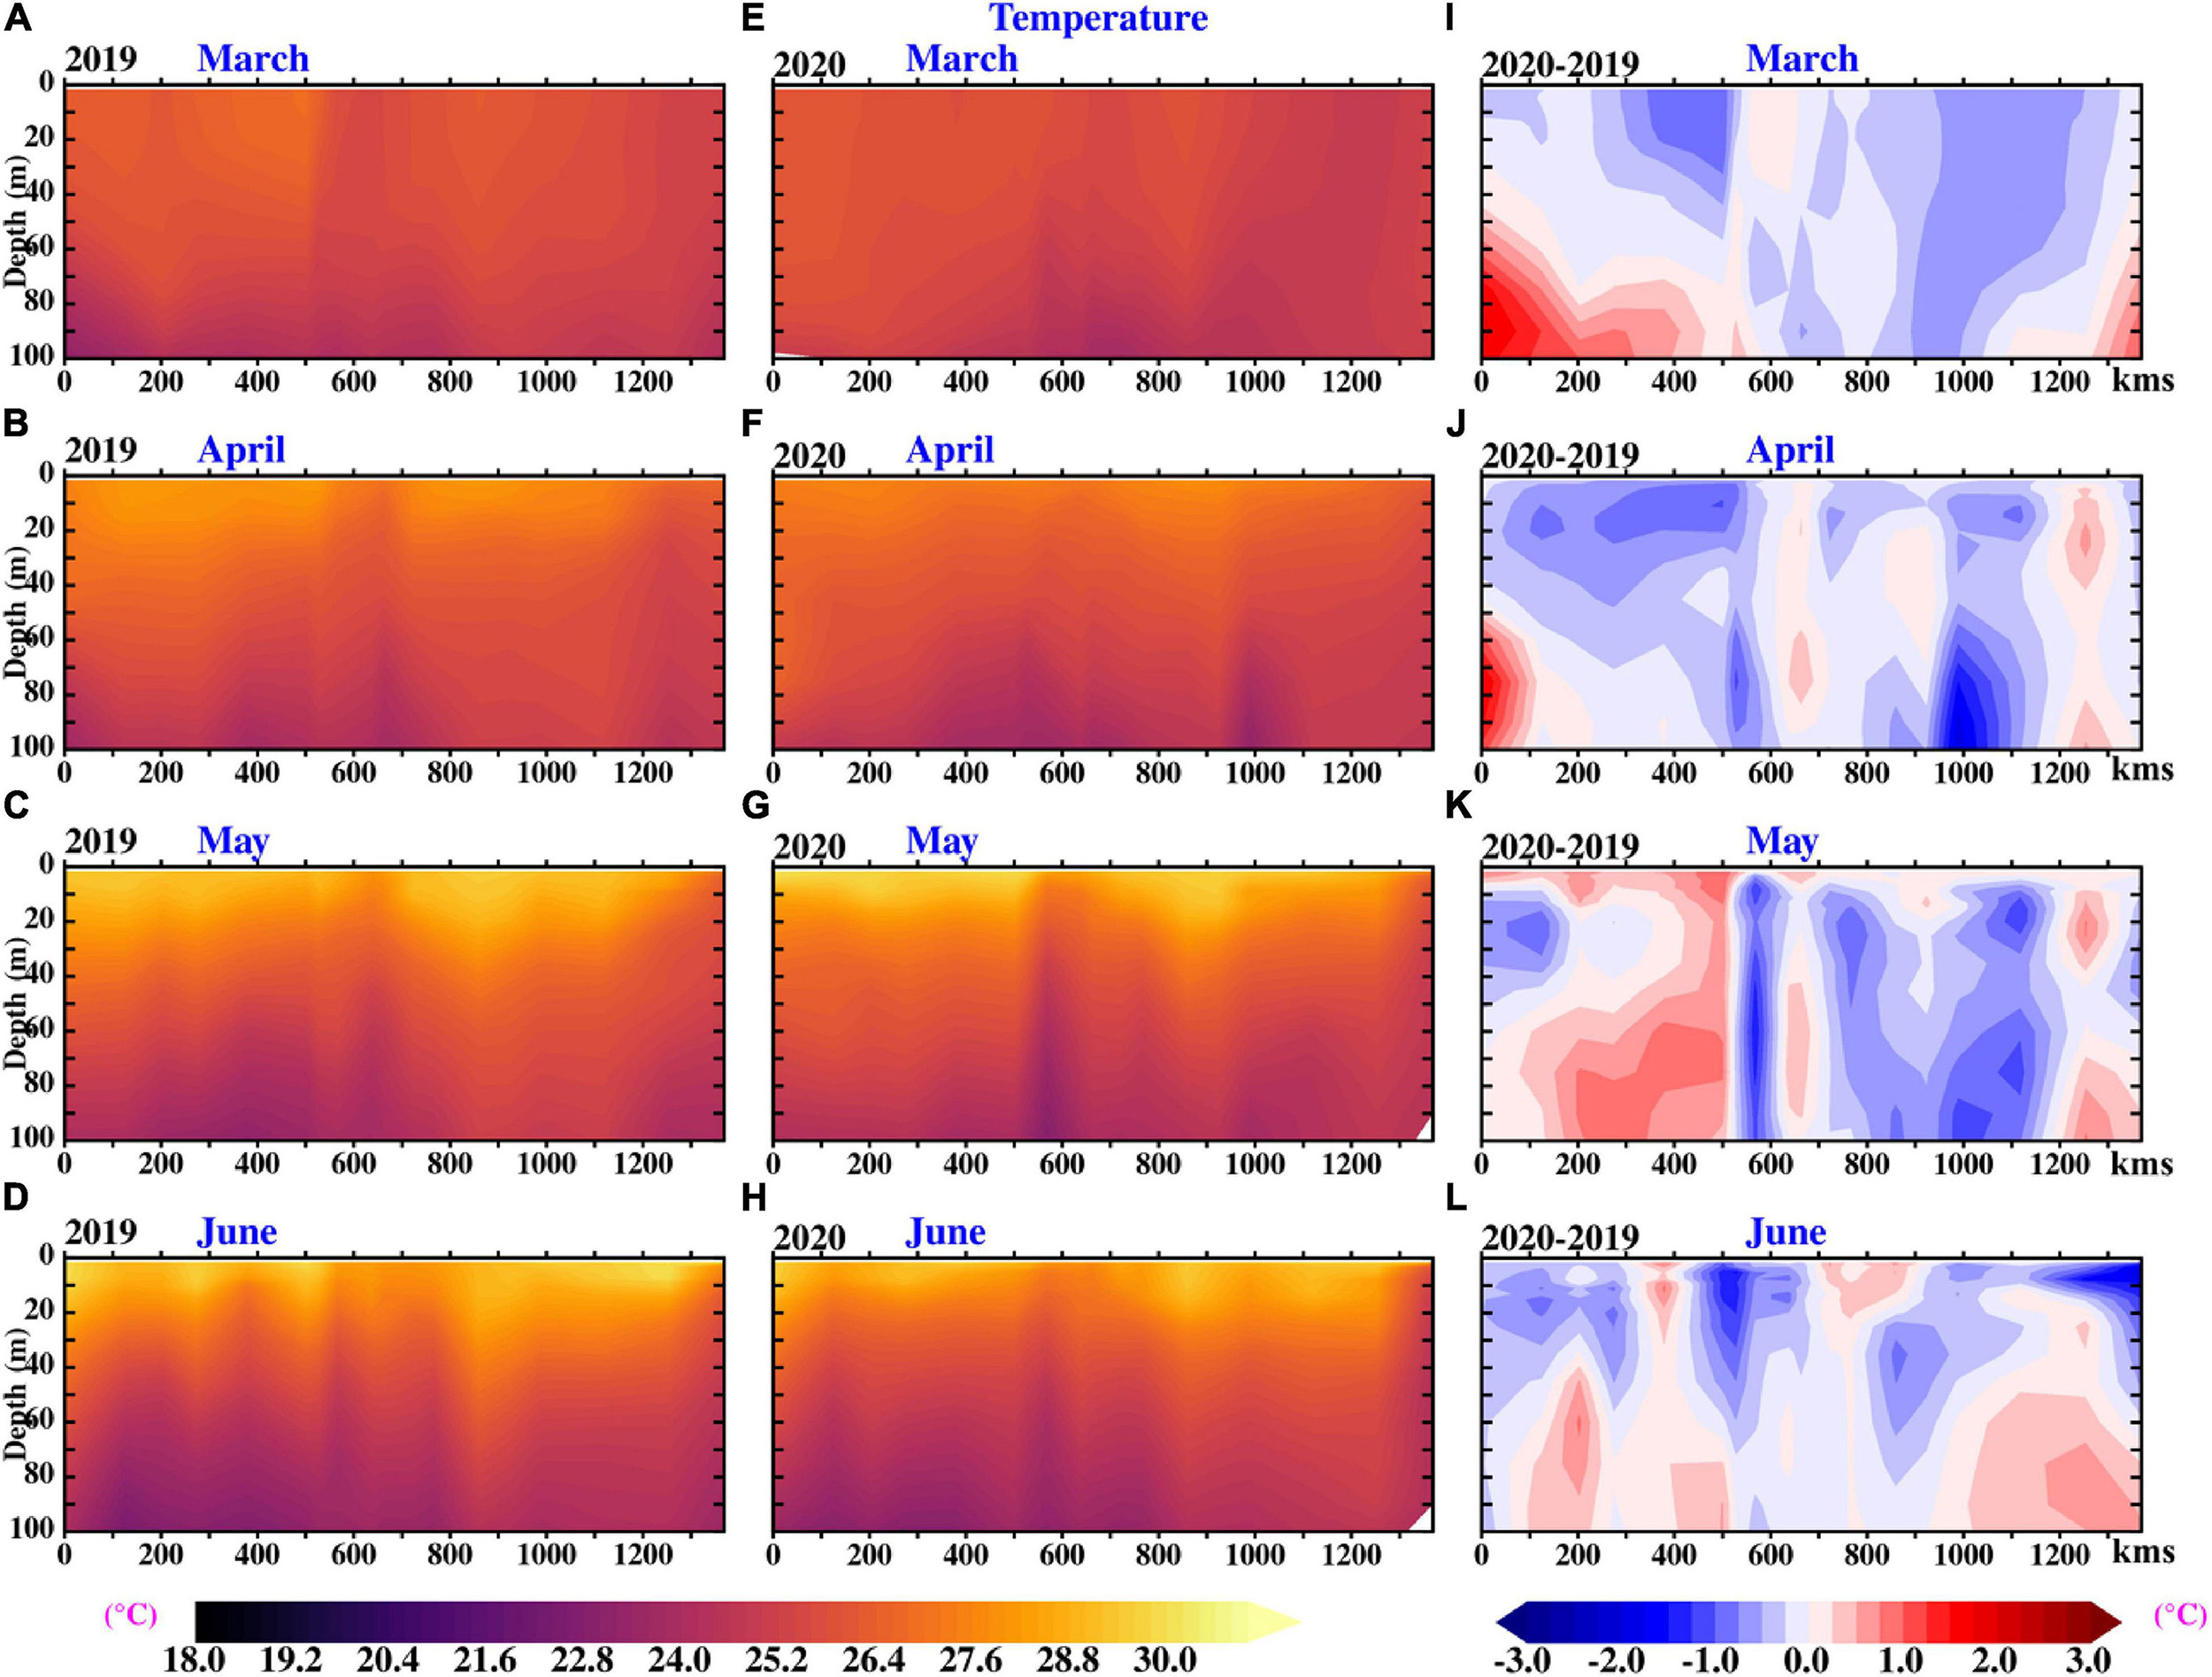
Figure 13. Evolution of model-simulated temperature profile along 1,000 m isobath off Oman coast (as shown in Figure 1): (A–D) during the pre-pandemic period (March–June, 2019), (E–H) pandemic period (March–June, 2020), and (I–L) temperature difference (pandemic–pre-pandemic period).
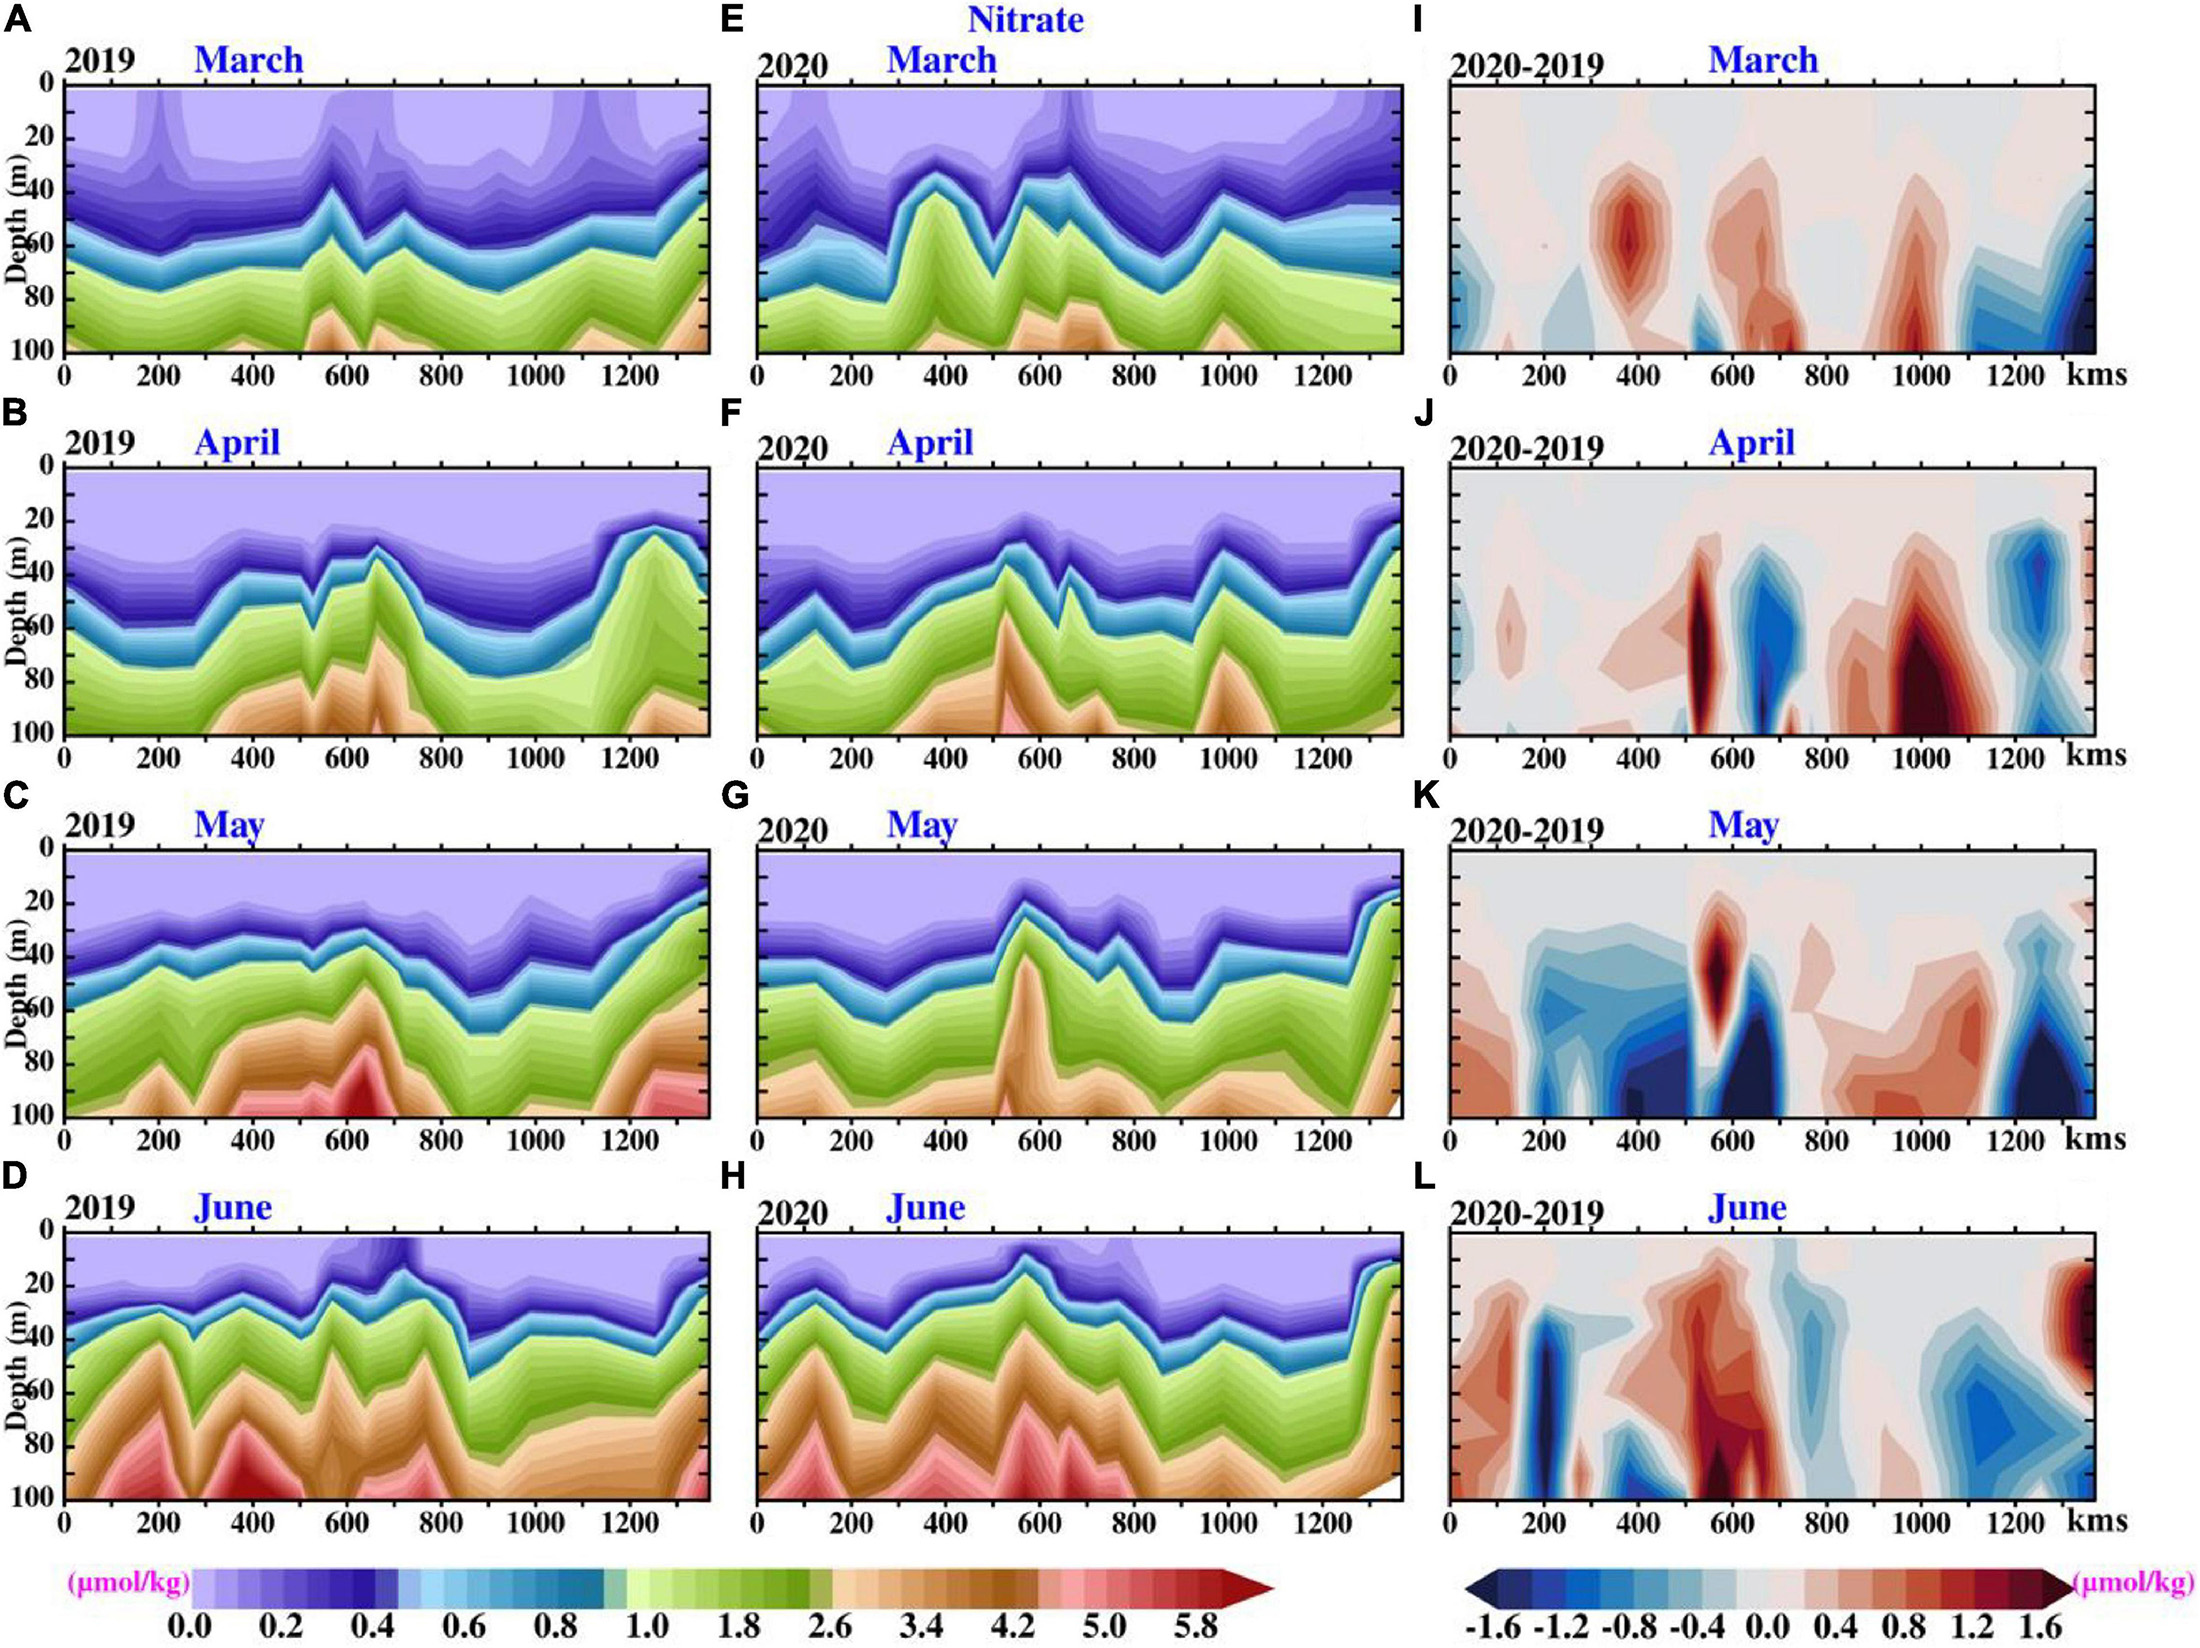
Figure 14. Evolution of model-simulated nitrate profile along 1,000 m isobath off Oman coast (as shown in Figure 1): (A–D) during the pre-pandemic period (March–June, 2019), (E–H) pandemic period (March–June, 2020), and (I–L) nitrate concentration difference (pandemic – pre-pandemic period).
The model-simulated Chl-a concentration, temperature, and nitrate across the latitudinal cross-sections along the Somalia coast (as shown by a red contour in Figure 1) are shown in Figures 15–17, respectively. The summer-time strong coastal upwelling in the northern part of the Somalia coast led to the intense phytoplankton bloom (high Chl-a concentration) present in the northern part of the transect (Figure 15I). However, the Chl-a concentration drops in the region of the Southern Gyre. This reduction in Chl-a concentration could be due to the weaker frontal system (Smith and Codispoti, 1980; Chatterjee et al., 2019). In May along the Somalia coast, high Chl-a concentration (Figure 15K), negative temperatures difference (Figure 16K), and the presence of nutrient-rich waters in the upper ocean (Figure 17K) were observed. Overall, during the COVID-19 pandemic, the northern part of the Somalia coast showed high productivity in the upper ocean water column due to low temperatures, high aerosol/dust deposition, and a sufficient supply of nutrients.
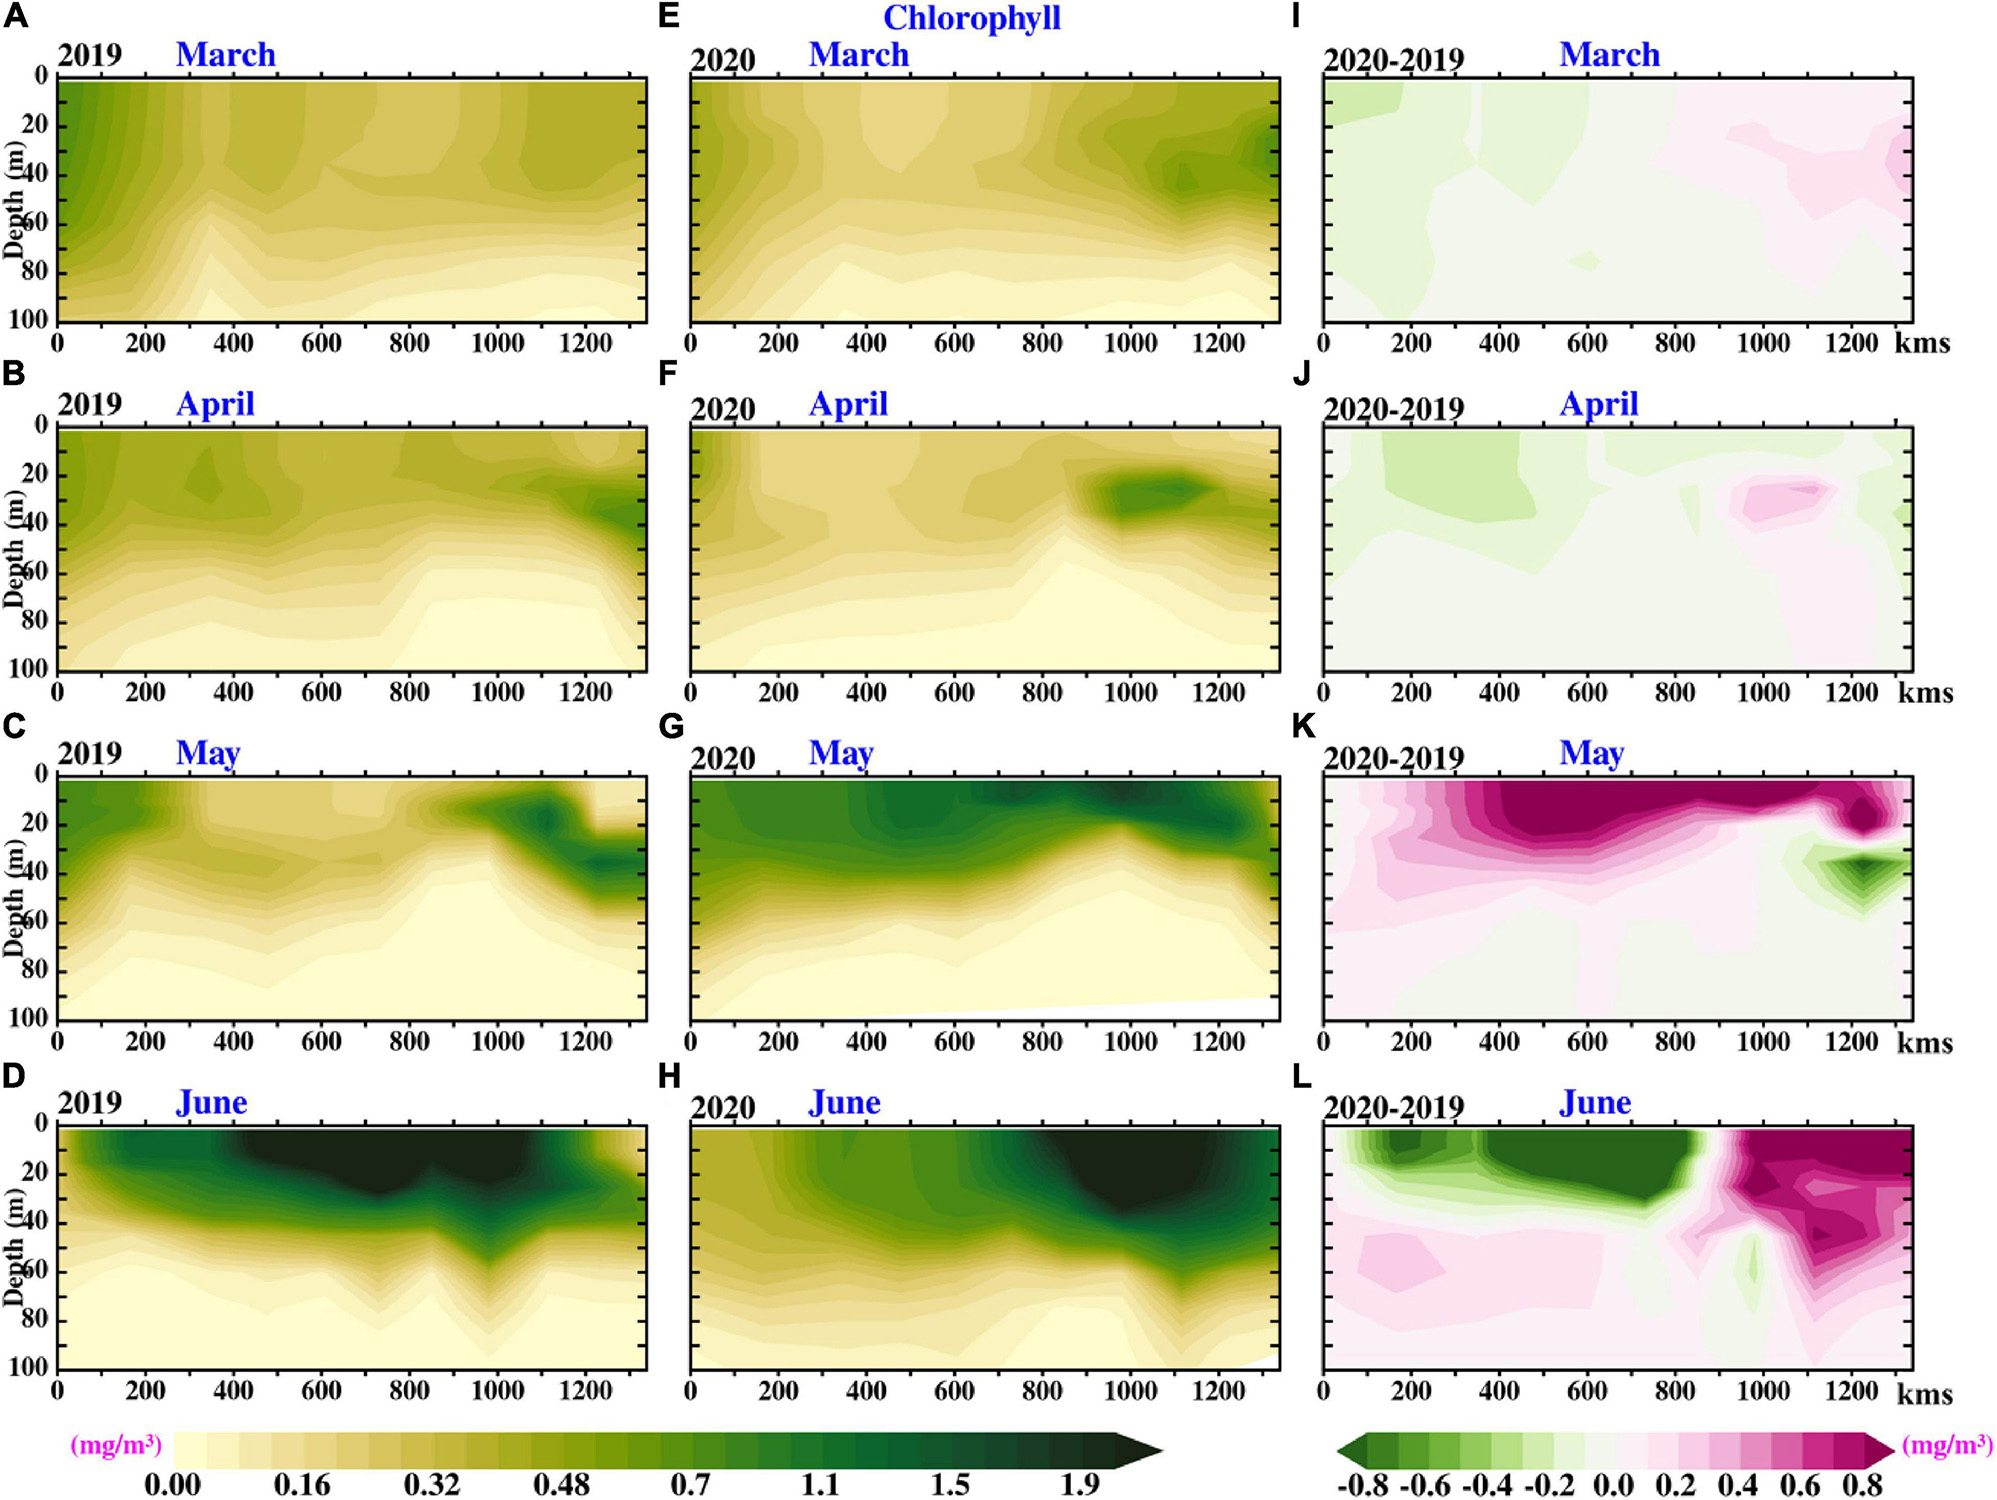
Figure 15. Evolution of model-simulated Chl-a concentration along the 1,000 m isobath off Somalia coast (as shown in Figure 1), (A–D) during the pre-pandemic period (March–June 2019), (E–H) pandemic period (March–June, 2020), and (I–L) Chl-a concentration of 2019 are subtracted from 2020 with respected months (March–June).
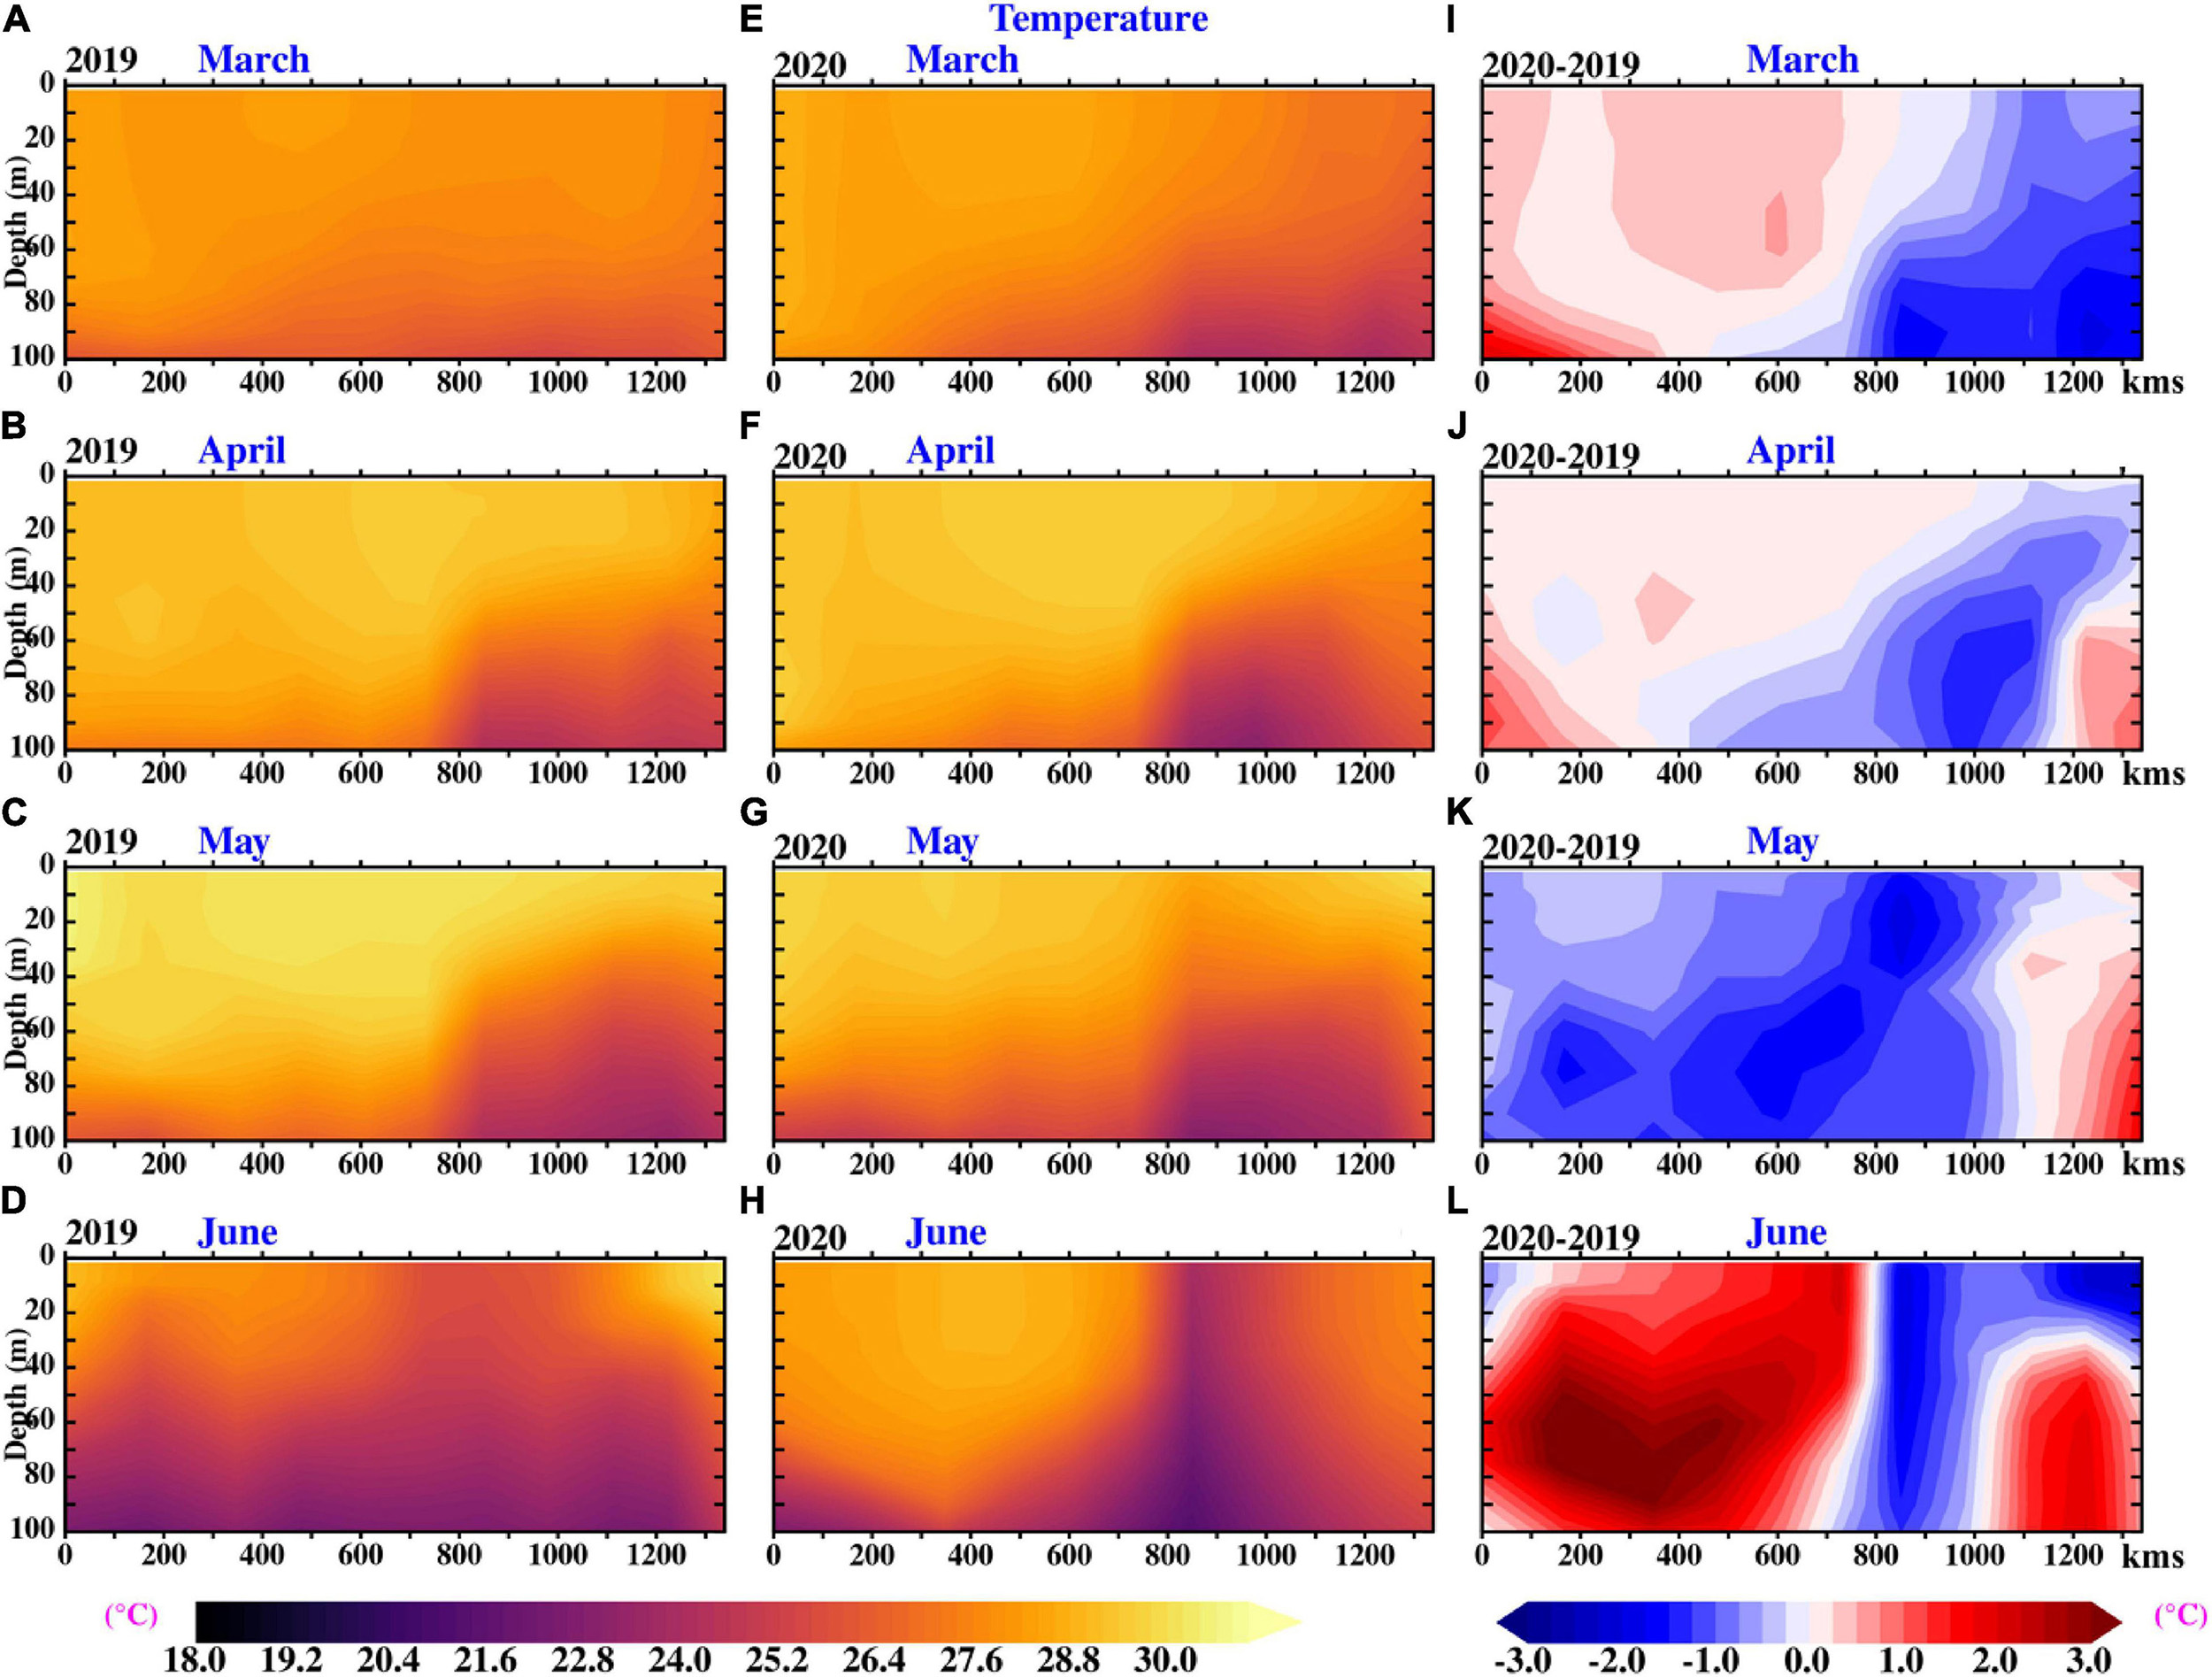
Figure 16. Evolution of model-simulated temperature along the 1,000 m isobath off Somalia coast (as shown in Figure 1), (A–D) during the pre-pandemic period (March–June 2019), (E–H) pandemic period (March–June, 2020), and (I–L) difference in temperature (2020–2019) for respected months from March to June.
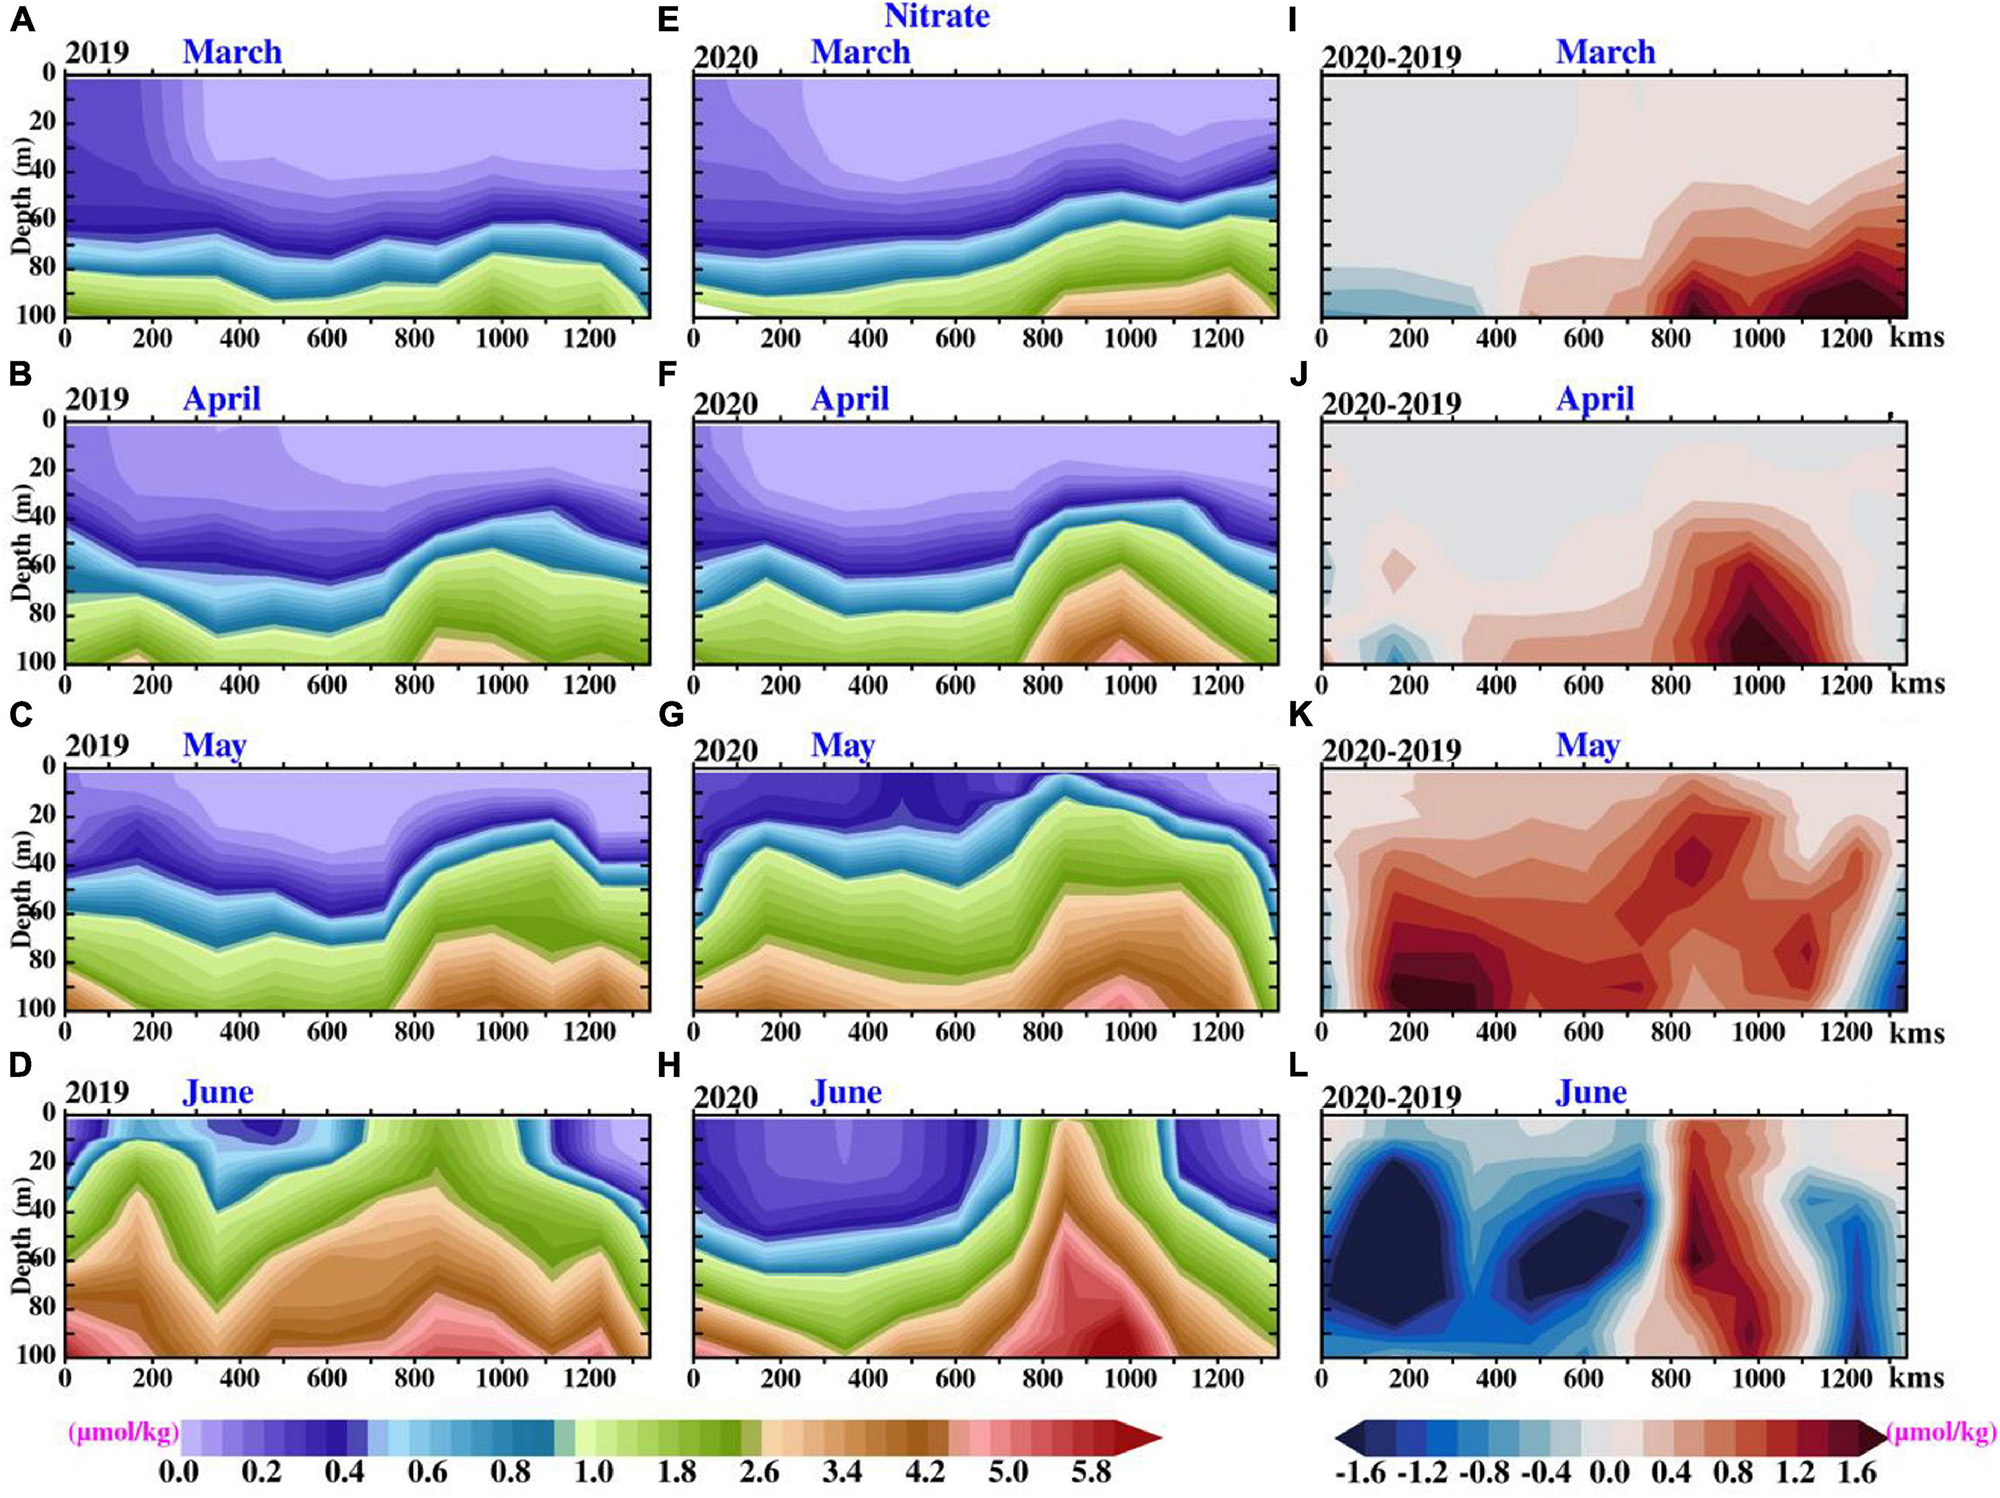
Figure 17. Evolution of model-simulated nitrate along the 1,000 m isobath off Somalia coast (as shown in Figure 1), (A–D) during the pre-pandemic period (March–June 2019), (E–H) pandemic period (March–June, 2020), and (I–L) difference in nitrate concentration (2020 – 2019) for respected months from March to June.
A schematic diagram shown in Figure 18 summarizes various atmospheric and oceanic processes involved in the formation of phytoplankton biomass leading to a high Chl-a concentration. The wind-blown dust from the desert regions and its long-range transport, mineral dust, and other aerosols in the marine boundary layer gets deposited on the sea surface. These aerosol and dust particles provide essential nutrients in the upper ocean, resulting in phytoplankton biomass. The wind-driven mixing, ocean subsurface processes (i.e., coastal upwelling), and cycling of dissolved gases and nutrients from one form to another constitute and regulate the overall primary productivity of the ocean.
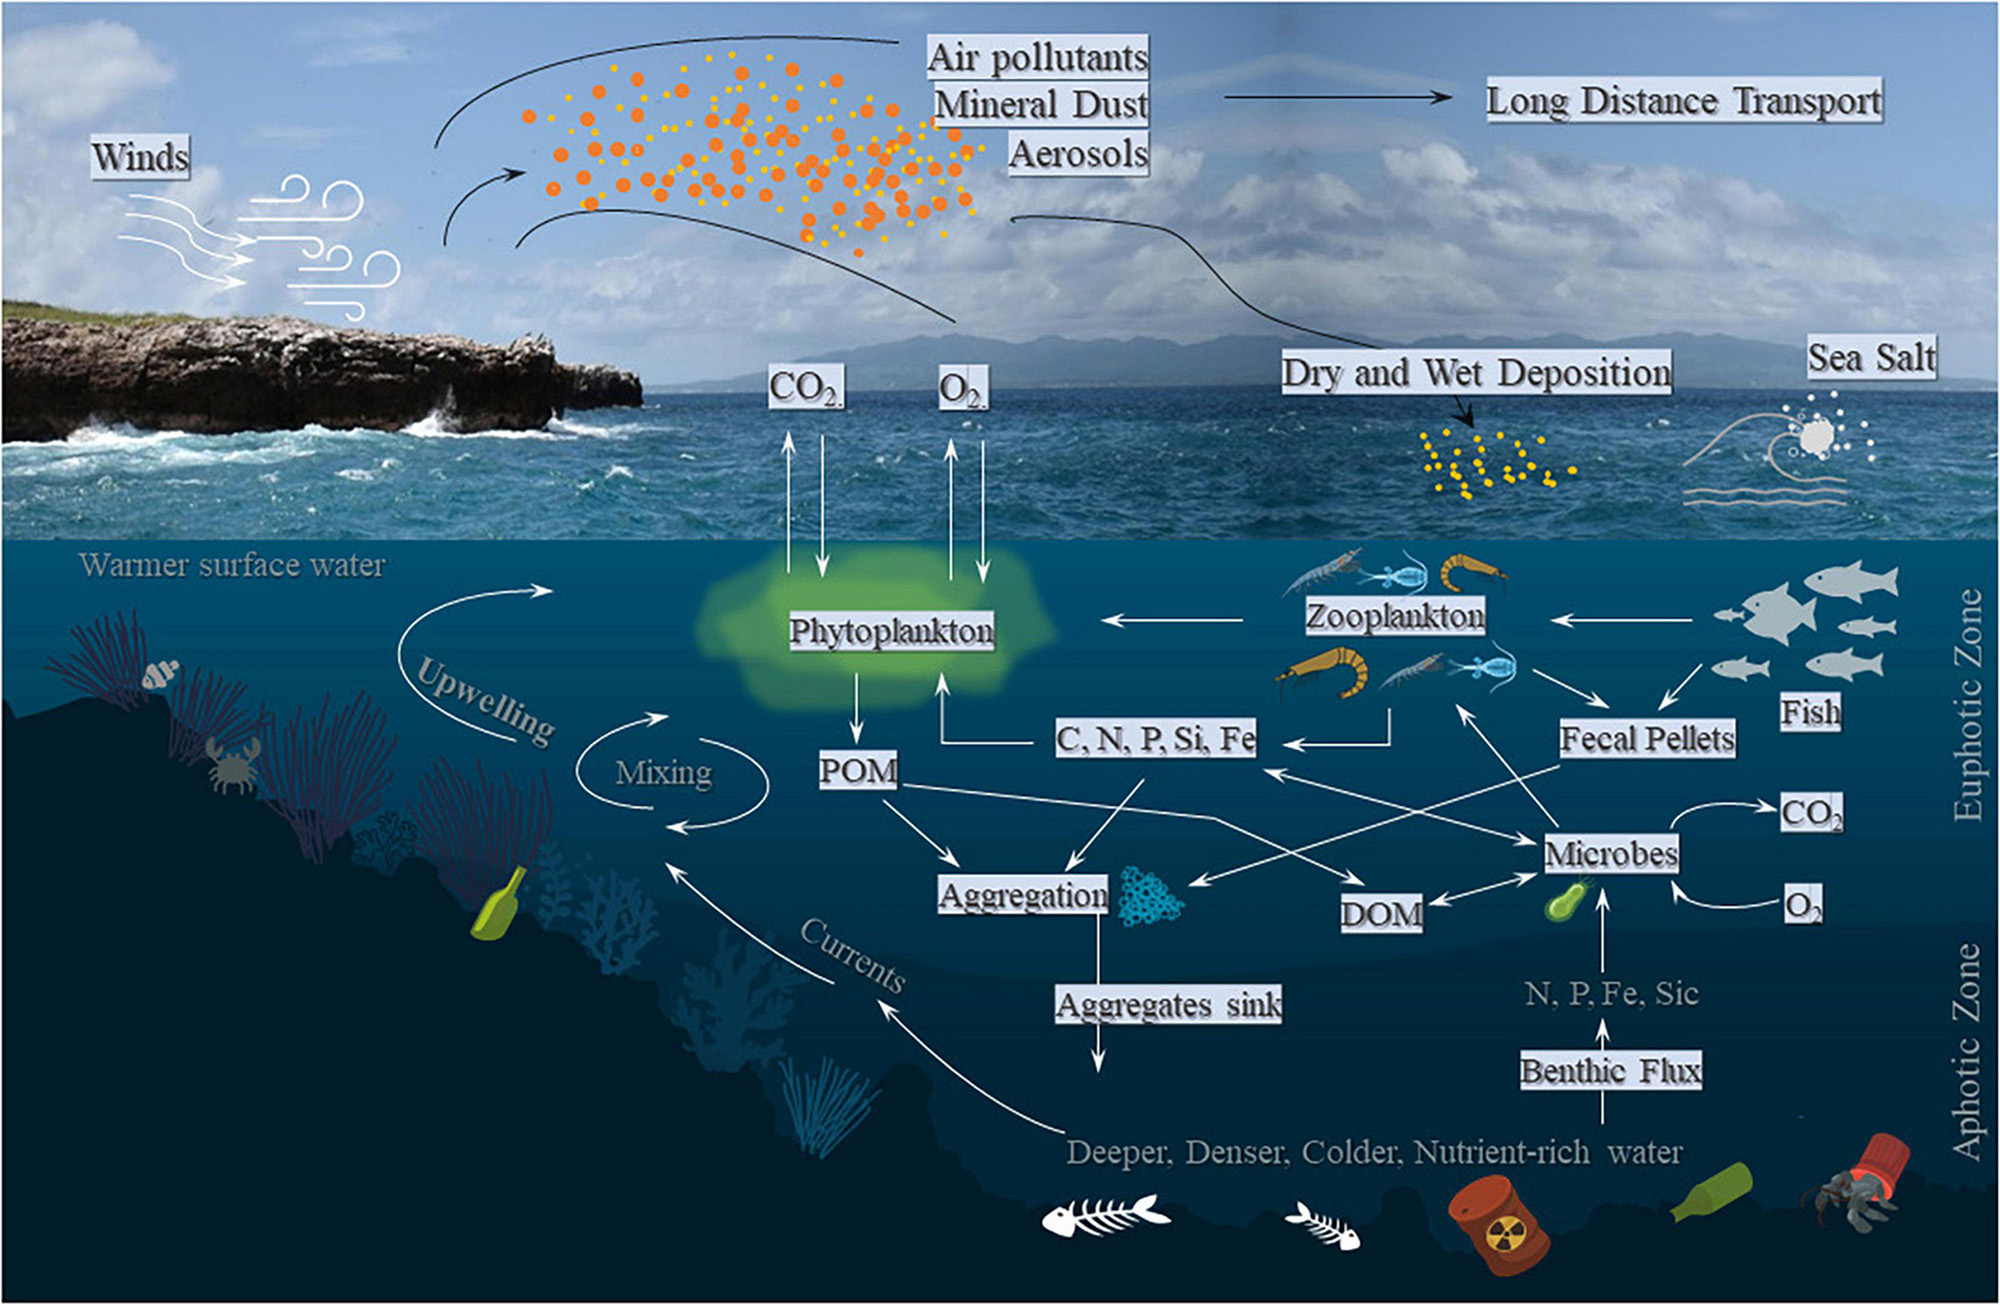
Figure 18. Schematic diagram showing various physical and biogeochemical processes governing the oceanic phytoplankton biomass. The transport and deposition of aerosol and dust on the sea surface and its influence on the biogeochemical processes in the ocean are also shown.
Conclusion
An ocean physical-biological coupled model along with available satellite and in situ observations is used to access the impact of the lockdown due to the COVID-19 pandemic on the upper-ocean characteristics in the NIO. The differences observed in oceanic physical parameters (temperature and salinity) and biogeochemical parameters (Chl-a concentration, nutrients, dissolved oxygen, etc.) in the COVID-19 pandemic period of March–June 2020 as compared with the non-pandemic reference period of March–June 2019 are examined. The model shows a good comparison with the satellite-derived Chl-a concentration (CC = 0.57 and RMSE = 0.10 mg m–3 in BoB; CC = 0.49 and RMSE = 0.18 mg m–3 in the AS) and in situ measurements from a moored RAMA buoy and a bio-Argo float in the BoB (statistics shown in Table 2). Larger differences between the pandemic and pre-pandemic conditions are observed in the coastal regions of the north-western AS, in the Sri Lanka dome region, and along the east coast of India. In the WBoB, the Chl-a concentration decreased during March–April of the pandemic period. The coastal BoB regions along the east coast of India show a decrement in Chl-a concentration associated with the reduced anthropogenic activities during the pandemic period. Similarly, there was a decrease in Chl-a concentration in the WAS during March–April of the pandemic year, which increased thereafter when the aerosol/dust loading increased due to dust storms over this region (supported by wind anomaly and AOD analysis). The SST is found to be 0.5°C lower in the pandemic period than in the non-pandemic period. The enhanced AOD and dust deposition during May 2020 was found to enhance the ocean phytoplankton biomass through an increased supply of nutrients in the surface waters of WAS. The high Chl-a concentration (increment by > 0.5 mg m–3) over the Sri Lanka dome is associated with the change in wind direction in May. During March of the pandemic year, there was a positive difference (with respect to normal year) in Chl-a concentration associated with ample supply of nutrients in the northern Oman coast. The coastal waters along northern Somalia experienced high phytoplankton biomass during the pandemic period.
Data Availability Statement
The original contributions presented in the study are included in the article/Supplementary Material, further inquiries can be directed to the corresponding author.
Author Contributions
VS and VP conceptualized the study, analyzed the results, and wrote the manuscript. VS performed model simulations and analysis. Both authors contributed to the article and approved the submitted version.
Conflict of Interest
The authors declare that the research was conducted in the absence of any commercial or financial relationships that could be construed as a potential conflict of interest.
Publisher’s Note
All claims expressed in this article are solely those of the authors and do not necessarily represent those of their affiliated organizations, or those of the publisher, the editors and the reviewers. Any product that may be evaluated in this article, or claim that may be made by its manufacturer, is not guaranteed or endorsed by the publisher.
Acknowledgments
The authors acknowledge the Ocean Color Climate Change Initiative (OC-CCI) dataset used in this study made available by the European Space Agency through the link https://www.oceancolour.org/. The dust and sea salt mass concentration data obtained from MERRA2 are acknowledged. The SST data provided by AMSR2 and AOD data derived from MODIS-Aqua are thankfully acknowledged. The High-Performance Computing (HPC) facility provided by IIT Delhi and supported by the Department of Science and Technology (DST-FIST, 2014), Govt. of India are thankfully acknowledged.
Supplementary Material
The Supplementary Material for this article can be found online at: https://www.frontiersin.org/articles/10.3389/fmars.2021.722401/full#supplementary-material
Footnotes
- ^ http://www.coriolis.eu.org/
- ^ https://www.oceancolour.org
- ^ https://las.incois.gov.in/las
- ^ http://daac.gsfc.nasa.gov/precipitation
- ^ https://las.incois.gov.in/las
References
Al Shehhi, M. R., and Abdul Samad, Y. (2021). Effects of the Covid-19 pandemic on the oceans. Rem. Sens. Lett. 12, 325–334. doi: 10.1080/2150704x.2021.1880658
Behrenfeld, M. J., O’Malley, R. T., Siegel, D. A., McClain, C. R., Sarmiento, J. L., Feldman, G. C., et al. (2006). Climate-driven trends in contemporary ocean productivity. Nature 444, 752–755. doi: 10.1038/nature05317
Bowman, K. P. (2005). Comparison of TRMM Precipitation Retrievals with Rain Gauge Data from Ocean Buoys. J. Clim. 18, 178–190. doi: 10.1175/jcli3259.1
Bowman, K. P., Phillips, A. B., and North, G. R. (2003). Comparison of TRMM rainfall retrievals with rain gauge data from the TAO/TRITON buoy array. Geophys. Res. Lett. 30:1757. doi: 10.1029/2003GL017552
Chakraborty, K., Valsala, V., Gupta, G. V. M., and Sarma, V. V. S. S. (2018). Dominant Biological Control Over Upwelling on pCO2 in Sea East of Sri Lanka. J. Geophys. Res. Biogeosci. 123, 3250–3261. doi: 10.1029/2018jg004446
Chatterjee, A., Kumar, B. P., Prakash, S., and Singh, P. (2019). Annihilation of the Somali upwelling system during summer monsoon. Sci. Rep. 9, 1–14. doi: 10.1038/s41598-019-44099-1
Chauhan, A., and Singh, R. P. (2020). Decline in PM2. 5 concentrations over major cities around the world associated with COVID-19. Environ. Res. 187:109634. doi: 10.1016/j.envres.2020.109634
Chimurkar, N. D., Patidar, G., and Phuleria, H. C. (2020). Changes in air quality during the COVID-19 lockdown in India. ISEE Confer. Abstracts 2020:648. doi: 10.1289/isee.2020.virtual.o-os-648
Clemens, C. S. (1998). Dust response to seasonal atmospheric forcing: Proxy evaluation and calibration. Paleoceanography 13, 471–490. doi: 10.1029/98pa02131
Dandapat, S., Gnanaseelan, C., and Parekh, A. (2020). Impact of excess and deficit river runoff on Bay of Bengal upper ocean characteristics using an ocean general circulation model. Deep Sea Res. Part II Topical Stud. Oceanogr. 172:104714. doi: 10.1016/j.dsr2.2019.104714
Duce, R. A., and Tindale, N. W. (1991). Atmospheric transport of iron and its deposition in the ocean. Limnol. Oceanogr. 36, 1715–1726. doi: 10.4319/lo.1991.36.8.1715
Fekete, B. M., and Vörösmarty, C. J. (2007). The current status of global river discharge monitoring and potential new technologies complementing traditional discharge measurements. IAHS Publ. 309, 129–136.
Fennel, K., Hetland, R., Feng, Y., and DiMarco, S. (2011). A coupled physical-biological model of the Northern Gulf of Mexico shelf: model description, validation and analysis of phytoplankton variability. Biogeosciences 8, 1881–1899. doi: 10.5194/bg-8-1881-2011
Fennel, K., Wilkin, J., Levin, J., Moisan, J., O’Reilly, J., and Haidvogel, D. (2006). Nitrogen cycling in the Middle Atlantic Bight: Results from a three−dimensional model and implications for the North Atlantic nitrogen budget. Glob. Biogeochem. Cycles 20:2005GB002456. doi: 10.1029/2005GB002456
Fennel, K., Wilkin, J., Previdi, M., and Najjar, R. (2008). Denitrification effects on air−sea CO2 flux in the coastal ocean: Simulations for the northwest North Atlantic. Geophys. Res. Lett. 35:2008GL036147. doi: 10.1029/2008GL036147
Fung, I. Y., Meyn, S. K., Tegen, I., Doney, S. C., John, J. G., and Bishop, J. K. (2000). Iron supply and demand in the upper ocean. Glob. Biogeochem. Cycles 14, 281–295. doi: 10.1002/(ISSN)1944-9224
Gabric, A. J., Cropp, R., Ayers, G. P., McTainsh, G., and Braddock, R. (2002). Coupling between cycles of phytoplankton biomass and aerosol optical depth as derived from SeaWiFS time series in the Subantarctic Southern Ocean. Geophys. Res. Lett. 29, 16–11. doi: 10.1029/2001GL013545
Gallisai, R., Peters, F., Volpe, G., Basart, S., and Baldasano, J. M. (2014). Saharan dust deposition may affect phytoplankton growth in the Mediterranean sea at ecological time scales. PLoS One 9:e110762. doi: 10.1371/journal.pone.0110762
Gautam, R., Liu, Z., Singh, R. P., and Hsu, N. C. (2009). Two contrasting dust−dominant periods over India observed from MODIS and CALIPSO data. Geophys. Res. Lett. 36:2008GL036967. doi: 10.1029/2008GL036967
Gerecht, A. C., Šupraha, L., Edvardsen, B., Probert, I., and Henderiks, J. (2014). High temperature decreases the PIC/POC ratio and increases phosphorus requirements in Coccolithus pelagicus (Haptophyta). Biogeosciences 11, 3531–3545. doi: 10.5194/bg-11-3531-2014
Glantz, P., Nilsson, E. D., and von Hoyningen-Huene, W. (2009). Estimating a relationship between aerosol optical thickness and surface wind speed over the ocean. Atmos. Res. 92, 58–68. doi: 10.1016/j.atmosres.2008.08.010
Haidvogel, D. B., Arango, H., Budgell, W. P., Cornuelle, B. D., Curchitser, E., Di Lorenzo, E., et al. (2008). Ocean forecasting in terrain-following coordinates: Formulation and skill assessment of the Regional Ocean Modeling System. J. Computat. Phys. 227, 3595–3624. doi: 10.1016/j.jcp.2007.06.016
Jana, S., Gangopadhyay, A., and Chakraborty, A. (2015). Impact of seasonal river input on the Bay of Bengal simulation. Continental Shelf Res. 104, 45–62. doi: 10.1016/j.csr.2015.05.001
Jayaram, C., Priyadarshi, N., Pavan Kumar, J., Udaya Bhaskar, T. V. S., Raju, D., and Kochuparampil, A. J. (2018). Analysis of gap-free chlorophyll-a data from MODIS in Arabian Sea, reconstructed using DINEOF. Int. J. Rem. Sens. 39, 7506–7522. doi: 10.1080/01431161.2018.1471540
Jickells, T. D., An, Z. S., Andersen, K. K., Baker, A. R., Bergametti, G., Brooks, N., et al. (2005). Global iron connections between desert dust, ocean biogeochemistry, and climate. Science 308, 67–71. doi: 10.1126/science.1105959
Jin, Q., Wei, J., Pu, B., Yang, Z., and Parajuli, S. P. (2018). High Summertime Aerosol Loadings Over the Arabian Sea and Their Transport Pathways. J. Geophys. Res. Atmospheres 123:2018jd028588. doi: 10.1029/2018jd028588
Kalnay, E., Kanamitsu, M., Kistler, R., Collins, W., Deaven, D., Gandin, L., et al. (1996). The NCEP/NCAR 40-year reanalysis project. Bull. Am. Meteorol. Soc. 77, 437–472. doi: 10.1175/1520-04771996077<0437:TNYRP<2.0.CO;2
Knutson, T. R., McBride, J. L., Chan, J., Emanuel, K., Holland, G., Landsea, C., et al. (2010). Tropical cyclones and climate change. Nat. Geosci. 3, 157–163. doi: 10.1175/BAMS-D-18-0189.1
Le Quéré, C., Jackson, R. B., Jones, M. W., Smith, A. J., Abernethy, S., Andrew, R. M., et al. (2020). Temporary reduction in daily global CO 2 emissions during the COVID-19 forced confinement. Nat. Clim. Change 10, 647–653. doi: 10.1038/s41558-020-0797-x
Léon, J. F., and Legrand, M. (2003). Mineral dust sources in the surroundings of the north Indian Ocean. Geophys. Res. Lett. 30:2002GL016690. doi: 10.1029/2002GL016690
Levitus, S (1983). “Climatological Atlas of the World Ocean.”. EOS Transact. Am. Geophys. Union 64, 962–963. doi: 10.1029/EO064i049p00962-02
Madineni, V. R., Dasari, H. P., Karumuri, R., Viswanadhapalli, Y., Perumal, P., and Hoteit, I. (2021). Natural processes dominate the pollution levels during COVID-19 lockdown over India. Sci. Rep. 11:4. doi: 10.1038/s41598-021-94373-4
Mahowald, N. M., Baker, A. R., Bergametti, G., Brooks, N., Duce, R. A., Jickells, T. D., et al. (2005). Atmospheric global dust cycle and iron inputs to the ocean. Glob. Biogeochem. Cycles 19:GB4025. doi: 10.1029/2004GB002402
Mandal, S., Behera, N., Gangopadhyay, A., Susanto, R. D., and Pandey, P. C. (2021). Evidence of a chlorophyll “tongue” in the Malacca Strait from satellite observations. J. Mar. Syst. 223:103610. doi: 10.1016/j.jmarsys.2021.103610
McPhaden, M. J., Meyers, G., Ando, K., Masumoto, Y., Murty, V. S. N., Ravichandran, M., et al. (2009). RAMA The Research Moored Array for African–Asian–Australian Monsoon Analysis and Prediction. Bull. Am. Meteorol. Soc. 90, 459–480. doi: 10.1175/2008BAMS2608.1
Measures, C. I., and Vink, S. (1999). Seasonal variations in the distribution of Fe and Al in the surface waters of the Arabian Sea. Deep Sea Res. Part II Topical Stud. Oceanogr. 46, 1597–1622. doi: 10.1016/s0967-0645(99)00037-5
Meskhidze, N., and Nenes, A. (2010). Effects of ocean ecosystem on marine aerosol-cloud interaction. Adv. Meteorol. 2010:239808. doi: 10.1155/2010/239808
Meskhidze, N., Chameides, W. L., and Nenes, A. (2005). Dust and pollution: a recipe for enhanced ocean fertilization? J. Geophys. Res. Atmos. 110:D03301. doi: 10.1029/2004JD005082
Middleton, N. J. (1986). A geography of dust storms in South−west Asia. J. Climatol. 6, 183–196. doi: 10.1002/joc.3370060207
Mishra, D. R., Kumar, A., Muduli, P. R., Equeenuddin, S., Rastogi, G., Acharyya, T., et al. (2020). Decline in Phytoplankton Biomass along Indian Coastal Waters due to COVID-19 Lockdown. Rem. Sens. 12:2584. doi: 10.3390/RS12162584
Morel, A., and Antoine, D. (1994). Heating rate within the upper ocean in relation to its bio–optical state. J. Physical Oceanogr. 24, 1652–1665. doi: 10.1175/1520-04851994024<1652:HRWTUO<2.0.CO;2
Morin, A., Lamoureux, W., and Busnarda, J. (1999). Empirical models predicting primary productivity from Chlorophyll a and water temperature for stream periphyton and lake and ocean phytoplankton. J. North Am. Benthol. Soc. 18, 299–307. doi: 10.2307/1468446
Mulcahy, J. P., O’Dowd, C. D., Jennings, S. G., and Ceburnis, D. (2008). Significant enhancement of aerosol optical depth in marine air under high wind conditions. Geophys. Res. Lett. 35:L16810. doi: 10.1029/2008GL034303
Nair, T. M. B. (2006). Monsoon control on trace metal fluxes in the deep Arabian Sea. J. Earth Syst. Sci. 115, 461–472. doi: 10.1007/bf02702874
Navinya, C., Patidar, G., and Phuleria, H. C. (2020). Examining Effects of the COVID-19 National Lockdown on Ambient Air Quality across Urban India. Aerosol Air Qual. Res. 20, 1759–1771. doi: 10.4209/aaqr.2020.05.02568
Nigam, T., Pant, V., and Prakash, K. R. (2018). Impact of Indian ocean dipole on the coastal upwelling features off the southwest coast of India. Ocean Dynam. 68, 663–676. doi: 10.1007/s10236-018-1152-x
O’Dowd, C. D., Smith, M. H., Consterdine, I. E., and Lowe, J. A. (1997). Marine aerosol, sea-salt, and the marine sulphur cycle: a short review. Atmos. Environ. 31, 73–80. doi: 10.1016/S1352-2310(96)00106-9
Paital, B. (2020). Nurture to nature via COVID-19, a self-regenerating environmental strategy of environment in global context. Sci. Total Environ. 2020:139088. doi: 10.1016/j.scitotenv.2020.139088
Pandey, S. K., and Vinoj, V. (2021). Surprising Changes in Aerosol Loading over India amid COVID-19 Lockdown. Aerosol Air Qual. Res. 21:200466. doi: 10.4209/aaqr.2020.07.0466
Pant, V., Deshpande, C. G., and Kamra, A. K. (2008). On the aerosol number concentration–wind speed relationship during a severe cyclonic storm over south Indian Ocean. J. Geophys. Res. 113:D02206. doi: 10.1029/2006JD008035
Patra, P. K., Behera, S. K., Herman, J. R., Maksyutov, S., Akimoto, H., and Yamagata, Y. (2005). The Indian summer monsoon rainfall: interplay of coupled dynamics, radiation and cloud microphysics. Atmos. Chem. Phys. 5, 2181–2188. doi: 10.5194/acp-5-2181-2005
Patra, P. K., Kumar, M. D., Mahowald, N., and Sarma, V. V. S. S. (2007). Atmospheric deposition and surface stratification as controls of contrasting chlorophyll abundance in the North Indian Ocean. J. Geophys. Res. 112:C05029. doi: 10.1029/2006JC003885
Pease, P. P., Tchakerian, V. P., and Tindale, N. W. (1998). Aerosols over the Arabian Sea: geochemistry and source areas for aeolian desert dust. J. Arid Environ. 39, 477–496. doi: 10.1006/jare.1997.0368
Pentakota, S., Vivek, S., and Rao, K. S. (2018). Role of Andaman Sea in the intensification of cyclones over Bay of Bengal. Nat. Hazards 91, 1113–1125. doi: 10.1007/s11069-018-3170-x
Ramaswamy, V., Muraleedharan, P. M., and Babu, C. P. (2017). Mid-troposphere transport of Middle-East dust over the Arabian Sea and its effect on rainwater composition and sensitive ecosystems over India. Sci. Rep. 7:1. doi: 10.1038/s41598-017-13652-1
Reid, P. C., Fischer, A. C., Lewis-Brown, E., Meredith, M. P., Sparrow, M., Andersson, A. J., et al. (2009). Impacts of the oceans on climate change. Adv. Mar. Biol. 56, 1–150. doi: 10.1016/S0065-2881(09)56001-4
Rengarajan, R., and Sarin, M. M. (2004). Atmospheric deposition fluxes of 7Be, 210Pb and chemical species to the Arabian Sea and Bay of Bengal. Ind. J. Mar. Sci. 33, 56–64.
Roxy, M. K., Modi, A., Murtugudde, R., Valsala, V., Panickal, S., Prasanna Kumar, S., et al. (2016). A reduction in marine primary productivity driven by rapid warming over the tropical Indian Ocean. Geophys. Res. Lett. 43, 826–833. doi: 10.1002/2015GL066979
Sandeep, K. K., and Pant, V. (2018). Evaluation of Interannual Simulations and Indian Ocean Dipole Events During 2000–2014 from a Basin Scale General Circulation Model. Pure Appl. Geophys. 175, 4579–4603. doi: 10.1007/s00024-018-1915-9
Satheesh, S. K., Srinivasan, J., and Moorthy, K. K. (2006). Contribution of sea-salt to aerosol optical depth over the Arabian Sea derived from MODIS observations. Geophys. Res. Lett. 33:L03809. doi: 10.1029/2005GL024856
Seelanki, V., Nigam, T., and Pant, V. (2021). Upper-ocean physical and biological features associated with Hudhud cyclone: A bio-physical modelling study. J. Mar. Syst. 215:103499. doi: 10.1016/j.jmarsys.2020.103499
Smith, S. L., and Codispoti, L. A. (1980). Southwest monsoon of 1979: chemical and biological response of Somali coastal waters. Science 209, 597–600. doi: 10.1126/science.209.4456.597
Smith, W. H., and Sandwell, D. T. (1997). Global sea floor topography from satellite altimetry and ship depth soundings. Science 277, 1956–1962. doi: 10.1126/science.277.5334.1956
Thushara, V., Vinayachandran, P. N. M., Matthews, A. J., Webber, B. G. M., and Queste, B. Y. (2019). Vertical distribution of chlorophyll in dynamically distinct regions of the southern Bay of Bengal. Biogeosciences 16, 1447–1468. doi: 10.5194/bg-16-1447-2019
Tindale, N. W., and Pease, P. P. (1999). Aerosols over the Arabian Sea: Atmospheric transport pathways and concentrations of dust and sea salt. Deep Sea Res. Part II Topical Stud. Oceanogr. 46, 1577–1595. doi: 10.1016/s0967-0645(99)00036-3
Wang, S. H., Hsu, N. C., Tsay, S. C., Lin, N. H., Sayer, A. M., Huang, S. J., et al. (2012). Can Asian dust trigger phytoplankton blooms in the oligotrophic northern South China Sea? Geophys. Res. Lett. 39:2011GL050415. doi: 10.1029/2011GL050415
Yeh, S. W., Kug, J. S., Dewitte, B., Kirtman, B., and Jin, F. F. (2009). Recent changes in El Niño and its projection under global warming. Nature 461, 511–515. doi: 10.1038/nature08316
Keywords: COVID-19, lockdown, chlorophyll, ocean temperature, primary productivity
Citation: Seelanki V and Pant V (2021) An Evaluation of the Impact of Pandemic Driven Lockdown on the Phytoplankton Biomass Over the North Indian Ocean Using Observations and Model. Front. Mar. Sci. 8:722401. doi: 10.3389/fmars.2021.722401
Received: 08 June 2021; Accepted: 03 November 2021;
Published: 02 December 2021.
Edited by:
Deepak R. Mishra, University of Georgia, United StatesReviewed by:
Samiran Mandal, Indian Institute of Technology Bombay, IndiaAneesh Anandrao Lotliker, Indian National Centre for Ocean Information Services, India
Copyright © 2021 Seelanki and Pant. This is an open-access article distributed under the terms of the Creative Commons Attribution License (CC BY). The use, distribution or reproduction in other forums is permitted, provided the original author(s) and the copyright owner(s) are credited and that the original publication in this journal is cited, in accordance with accepted academic practice. No use, distribution or reproduction is permitted which does not comply with these terms.
*Correspondence: Vimlesh Pant, vimlesh@cas.iitd.ac.in