
Does the COVID-19 Pandemic Change Human Mobility Equally Worldwide? Cross-Country Cluster Analysis


1
Department of Econometrics and Statistics, Institute of Economics and Finance, Warsaw University of Life Sciences, Nowoursynowska 166, 02-787 Warsaw, Poland
2
My Data Lab, 05-816 Michałowice, Poland
3
Department of Economics and Economic Policy, Institute of Economics and Finance, Warsaw University of Life Sciences, Nowoursynowska 166, 02-787 Warsaw, Poland
*
Author to whom correspondence should be addressed.
Economies 2021, 9(4), 182; https://doi.org/10.3390/economies9040182
Submission received: 27 September 2021
/
Revised: 9 November 2021
/
Accepted: 12 November 2021
/
Published: 17 November 2021
(This article belongs to the Special Issue Emerging Economies and Sustainable Growth)
Abstract
:The paper aims to identify groups of countries characterised by a similar human mobility reaction to COVID-19 and investigate whether the differences between distinguished clusters result from the stringency of government anti-COVID-19 policy or are linked to another macroeconomic factor. We study how COVID-19 affects human mobility patterns, employing daily data of 124 countries. The analysis is conducted for the first and second waves of the novel coronavirus pandemic separately. We group the countries into four clusters in terms of stringency level of government anti-COVID-19 policy and six mobility categories, using k-means clustering. Moreover, by applying the Kruskal–Wallis test and Wilcoxon rank-sum pairwise comparison test, we assess the existence of significant differences between the distinguished clusters. We confirm that the pandemic has caused significant human mobility changes. The study shows that a more stringent anti-COVID-19 policy is related to the greater decline in mobility. Moreover, we reveal that COVID-19-driven mobility changes are also triggered by other factors not related to the pandemic. We find the Human Development Index (HDI) and its components as driving factors of the magnitude of mobility changes during COVID-19. The greater human mobility reaction to COVID-19 refers to the country groups representing higher HDI levels.
1. Introduction
COVID-19, an infectious disease caused by the severe acute respiratory syndrome coronavirus 2, is the seventh coronavirus to spread between humans (Andersen et al. 2020). However, its impact on the world economy (Nicola et al. 2020; Zayed et al. 2021) and the epidemic status of humankind (Van Bavel et al. 2020; Tandon 2020) is unprecedented. The rapidly increasing numbers of infections and deaths caused by COVID-19 have forced national governments worldwide to introduce various types of restrictions and lockdowns (De Vos 2020; Koh 2020). Various stringency policies have affected ca. 90% of the world’s population, contributing to a general, massive reduction in mobility (Gössling et al. 2021). Restrictions and fear of contagion have influenced mobility patterns worldwide (Beria and Lunkar 2021; Bonaccorsi et al. 2020; Cartenì et al. 2020; Corazza and Musso 2021; Kartal et al. 2021; Mendolia et al. 2021; Yilmazkuday 2021). This indicates that the COVID-19 pandemic has caused the immobility phenomenon to occur (Freudendal-Pedersen and Kesselring 2021; Cairns et al. 2021; De Sá and Gastal 2021; Martin and Bergmann 2021; Di Martino 2021). Adiga et al. (2020) observe the interplay of human mobility, epidemic status changes and anti-COVID-19 public policies on a global scale.
Sigler et al. (2021) claim that due to increased interpersonal and trade globalisation processes, human mobility should be treated as the key indicator explaining pandemic diffusion. A number of studies focus on the effects of human mobility on the spread of COVID-19 (Badr et al. 2020; Chinazzi et al. 2020; Gargoum and Gargoum 2021; V. Lee et al. 2020; Wang et al. 2020a; Zhu et al. 2020). McGrail et al. (2020), based on data from 134 world countries, prove that implementing social policies substantially reduced the novel coronavirus spread rate worldwide in new COVID-19 cases over a two-week period. Nouvellet et al. (2021), based on 52 countries around the world, confirm that mobility reduction significantly decreased the novel coronavirus pandemic transmission. Sulyok and Walker (2020) observed a negative relationship between Google Community Mobility Reports data and COVID-19 cases for Western European and North American prominent industrialised countries. Moreover, by providing continent-wide examination, they found a negative correlation for all continents, except South America. Kraemer et al. (2020), based on the early stage of COVID-19 in China, show that human mobility changes and control measures implementation explain the epidemic status. Lai et al. (2020), based on daily travel networks in China during the first quarter of 2020, show that the effect of non-pharmaceutical interventions to contain the novel coronavirus varies. Kartal et al. (2021), based on data for Turkey, observe a cointegration between human mobility and COVID-19 indicators from a long-term perspective, particularly between changes in grocery and pharmacy, parks, residential, retail and recreation, and workplace and the number of infections and deaths related to the novel coronavirus pandemic. Borkowski et al. (2021), using a CATI survey on Polish society, reveal substantial changes in everyday mobility in reaction to lockdown implementation and confirm the effectiveness of social distancing restrictions.
Our article examines the impact of the COVID-19 pandemic on human mobility, not the impact of the human mobility reduction on the spread of the coronavirus. Two main COVID-19-driven categories of determinants of changes in human mobility patterns can be distinguished, i.e., factors related to people’s awareness and fear of contagion and factors linked to mandatory anti-COVID-19 policy. Chan et al. (2020) observe that changes in human mobility are country-specific and linked to a country’s risk attitude. Some studies indicate that apart from government restrictions implementation, a population mobility decrease can be potentially triggered by personal behavioural choices made in reaction to infectious disease threats (Lau et al. 2003; Sadique et al. 2007; SteelFisher et al. 2010). Wang et al. (2020a), based on the mobility data from a Multiscale Dynamic Human Mobility Flow Dataset for the US, find that the changes of mobility patterns correlate to people’s awareness of COVID-19. Yabe et al. (2020) reveal the impact of non-compulsory measures on human mobility patterns. They show that one week before the official state of emergency, human mobility decreased by around 50% due to reduced social contact resulting from non-compulsory incentives.
In our study, we focused on the impact of COVID-19-driven government policy on human mobility. Santamaria et al. (2020), using anonymised and aggregated mobile positioning data of European Mobile Network Operators for European countries at a NUTS3 level, revealed that confinement measures were responsible for ca. 90% of human mobility patterns during COVID-19. Li et al. (2021), based on a spatiotemporal perspective from the US, show that COVID-19-driven stay-at-home policies and workplace closures were related to significant decreases in human mobility. Saha et al. (2020), based on India during the first phase of the novel coronavirus pandemic, found a substantial decrease in community mobility, except residential mobility, due to lockdown. Pullano et al. (2020), analysing the first phase of the pandemic in France, reveal that the lockdown of the country cut the displacement of people across the country by almost two-thirds. Pan et al. (2020), based on data involving 100 million devices in the contiguous US, found that the stringency of anti-COVID-19 policy affected the strength of social distancing. They also reveal people were more likely to reduce their social distancing immediately after the mitigation of restrictions. Hadjidemetriou et al. (2020), analysing the initial stage of the pandemic in the UK, found that human mobility gradually decreased as anti-COVID-19 measures were imposed and stabilized at 80% of initial mobility after the lockdown implementation. Bao et al. (2020) proposed a spatiotemporal network to estimate mobility responses under COVID-19 severity and local policy stringency, and to assist policy-making during economy reopening.
Moreover, the magnitude of COVID-19-driven human mobility changes seem to differ across countries and regions. Wielechowski et al. (2020) found that government restrictions, rather than a local epidemic status, induced a greater decrease in mobility, and the changes in mobility were regional-specific. Nagata et al. (2021), based on a mobile big data analysis of locations of infections in Japan during the first wave of the pandemic, found regional differences in intensity of mobility changes among each metropolitan area and categories of places. Galeazzi et al. (2021), based on France, Italy and the UK, found that lockdown influenced national mobility, however, the impact varied across countries due to the differences in mobility infrastructure. Surprisingly, Maloney and Taskin (2020) suggest that social distancing measured by human mobility changes is independent of the stringency level of anti-COVID-19 government interventions and restrictions.
Long and Ren (2022), based on the first year of COVID-19, found that human mobility was associated with socio-economic indicators, and changed throughout the year 2020. W. D. Lee et al. (2021), based on the early stages of England’s COVID-19 pandemic, confirm that socioeconomic status was strongly related to human mobility reductions, but varied across England. Atchison et al. (2020), based on a cross-sectional survey of UK adults in March 2020, found that older people were more likely to adopt social-distancing measures than younger adults. Moreover, they observed that people with the lowest household income were less able to adapt and comply with those stringency measures. Chand et al. (2021), using Google Mobility Data of several countries and sub-regions, found that household income belongs to the key determinants of reduction in mobility to work and increased time spent at home. Weill et al. (2020) and Jay et al. (2020), based on the US data from the first wave of the pandemic, found a strong relationship between neighbourhood income and physical distancing and human mobility, i.e., low-income neighbourhoods faced barriers to implement stay-at-home policies and recommendations due to the risk of losing their jobs. Chiou and Tucker (2020) suggest that income and home internet access affected people’s ability to self-isolate during the novel coronavirus pandemic.
Herren et al. (2020), using data for 130 countries, find that the decrease in human mobility in the first phase of the pandemic is linked to country-specific outbreak trajectory, economic development, and democracy. Moreover, they observe a positive relationship between mobility increase with GDP per capita growth. Chand et al. (2021) reveal that greater GDP per capita reduces mobility to workplace but increases residential mobility. Frey et al. (2020), based on the data of 111 countries, revealed that collectivist and democratic countries were more effective in reducing people’s movement in response to the COVID-19 pandemic. Gunawan (2021), analysing all 34 Indonesian provinces, revealed the statistically significant relationship between human mobility changes and macroeconomic indicators, including the HDI and labour for participation.
Our paper aims to identify groups of countries characterised by a similar human mobility reaction to COVID-19 and investigate whether the differences between distinguished clusters resulted from the stringency of government anti-COVID-19 policy or were linked to other macroeconomic factors. The paper focuses on countries’ development status measured by the Human Development Index and its components. There are no other studies that assess the impact of the HDI level on COVID-19-driven human mobility patterns worldwide. We use data on human mobility changes from COVID-19 Community Mobility Reports developed by Google, a new daily database covering almost all countries worldwide. Google started to collect the data in the aftermath of COVID-19, allowing researchers to study human mobility patterns in a much more precise way from a global perspective. Not many studies use this entire database. Moreover, research results published so far mainly focus on panel analysis, while we apply another method, i.e., clustering. To our knowledge, similar studies have not yet been conducted.
The outline of this paper is as follows. The next section presents the methodology. The posterior section sets out the empirical findings and discussion. The final section offers conclusions.
2. Methodology
We identified the groups of countries characterised by similar human mobility changes and a similar level of national government anti-COVID-19 policy stringency (stringency) during the first and second phases of the pandemic. Various methods and data sources were used to study changes in human mobility during the COVID-19 pandemic, including mobility data collected from mobile phone users, e.g., Google Community Mobility Reports (Sulyok and Walker 2020) and anonymised and aggregated mobile positioning data of European Mobile Network Operators for European countries (Santamaria et al. 2020), local databases (Yabe et al. 2020; Pan et al. 2020), and survey data (Borkowski et al. 2021).
In the analysis, we used human mobility changes data from COVID-19 Community Mobility Reports developed by Google (Google 2021). The data concerned six place categories, i.e., retail and recreation, grocery and pharmacy, parks, public transport, workplaces, and residential. The reports reflected the human mobility changes in the number of visits and time spent in the above-mentioned specific categories of places during the pandemic in relation to the baseline period prior to the COVID-19 outbreak, i.e., period between 3 January and 6 February 2020. To prepare reports, Google uses human mobility tracking data from mobile devices, primarily mobile phones. Google uses the same type of aggregated and anonymous data to display the popularity of places on Google Maps, i.e., number of people and time spent. Table 1 presents the list of places included in mobility trends in each of the six categories of the COVID-19 Community Mobility Reports.
The stringency of the government response to the outbreak of COVID-19 is characterised by the Stringency index from the Oxford COVID-19 Government Response Tracker developed by the Blavatnik School of Government. The index provides a systematic cross-national and cross-temporal measure of tracking the severity level of government responses to the novel coronavirus pandemic. The index is composed of 24 individual measures of national authorities’ anti-COVID-19 responses relating to containment and closure (i.e., school and workplace closing, cancelation of public events and restrictions on gathering size, restrictions on public transport, internal and international movements, stay at home requirements), economic response (i.e., income support, debt/contract relief for households, fiscal measures, international support), health system (i.e., public information campaign, testing policy, contact tracking, investment in healthcare), vaccine policy (i.e., vaccine availability, prioritisation and financial support), and other responses. Data are collected in real-time. The index takes values from 0 to 100 (Hale et al. 2020).
An analysis was conducted for the biweekly averages of daily data of stringency level of government anti-COVID- policy and six human mobility categories. In the clustering, we used data from the highest two-weeks average stringency level of the anti-COVID-19 policy period for each country. The applied data on stringency index and human mobility changes are daily data. To face the challenges related to the different pace of human mobility adaptation to the introduced restrictions and the part of a day of introducing the restrictions (e.g., there is a fundamental difference between the announcement of changes in anti-COVID-19 policy in the morning and the afternoon), we used biweekly average data. We used biweekly averages instead of weekly averages to mitigate the effect of the day of the week (weekly averages would be more affected by day of the week in which restrictions are tightened or moderated) and to minimise the effect of individual national holidays. In the analysis, we chose the two-week periods with the highest severity of anti-COVID-19 policy, as we believe that the stringency of the government policy determines human mobility changes during the COVID-19 pandemic. Since one out of six human mobility categories refers to workplaces, we estimated averages only on data for weekdays, i.e., Monday-Friday.
To group countries, we applied k-means clustering developed by Linde et al. (1980). We group countries into four clusters regarding seven determinants, i.e., stringency level of government anti-COVID- policy and six human mobility categories.
Moreover, by applying the Kruskal–Wallis test (Kruskal 1952; Kruskal and Wallis 1952) and Wilcoxon rank-sum pairwise comparison test (Wilcoxon 1992) with Benjamini and Hochberg (1995) adjustment, we assess the existence of significant differences between the distinguished clusters. Additionally, we investigate whether the selected clusters significantly differ in terms of country development status measured by the Human Development Index (HDI). We employ 2019 HDI level data from UNDP Human Development Reports.
The research covers the first and second waves of the COVID-19 pandemic, i.e., 2 January 2020 to 12 October 2020, and 13 October 2020 to 28 February 2021.
The division into two waves is based on the Global Stringency Index developed by Czech and Wielechowski (Czech and Wielechowski 2021). The formula of the index is as follows:
where is a single-country Stringency Index at time t, where , is a single-country annual gross domestic product in constant prices at time , and is the number of countries. In the study, we assume that reflects the date—2 January 2020, and represents 28 February 2020. We use data on annual 2019 GDP values at constant 2010 USD. The index is based on country-level Stringency Indices and GDPs, covering the countries included in World Bank statistics, the Oxford COVID-19 Government Response Tracker data, and COVID-19 Community Mobility Reports.
We are aware that the exact time period for the first and second waves of the COVID-19 pandemic vary across countries. Nevertheless, due to the global perspective of the study, we have to adopt a uniform timeframe for the first and second waves of the novel coronavirus pandemic for all analysed countries. However, our study considers the peak period of the first and second waves of the pandemic in each analysed country separately as we include the biweekly periods with the most stringent level of the anti-COVID-19 restrictions in each country. Thus, distinguished biweekly periods vary from country to country and reflect the country-specific time of pandemic waves.
The index is based on country-level Stringency Indices and GDPs, covering the countries included in World Bank statistics, the Oxford COVID-19 Government Response Tracker data, and COVID-19 Community Mobility Reports.
We employ data for 124 countries worldwide, i.e., all countries included in World Bank statistics, the Oxford COVID-19 Government Response Tracker, and Google COVID-19 Community Mobility Reports simultaneously. To identify biweekly periods characterised by the most stringent level of anti-COVID-19 restrictions based on a big database, we use Python. In a further analysis, we apply Python and R.
3. Results
In this paper, we assess the COVID-19-driven human mobility changes. The novel coronavirus pandemic, as previous ones, has been characterised by waves of activity spread over time. The COVID-19 outbreak, and its rapid spread triggered government reaction reflected in social distancing restrictions or country lockdowns worldwide. Every wave was accompanied by an increase in the stringency of anti-COVID-19 policy, and thus we apply the global stringency index to distinguish the waves from the entire analysed period. Figure 1 depicts the global stringency index calculated based on the formula (1).
Based on the global stringency index level, we observe two waves of the COVID-19 pandemic. The first wave lasted from 2 January till 12 October 2020, while the span of the second wave is limited to the end of February 2021 (Figure 1). The selection of 12 October 2020, as the last day of the first wave of the pandemic, was due to the fact that this day marked the end of the declining trend of the analysed index and thus marked the last day of the first wave of the pandemic from a global perspective. We believe that different patterns of human mobility changes characterise each wave of the novel coronavirus pandemic. Hence, the study is conducted for the two waves separately.
3.1. The First Wave of the COVID-19 Pandemic
We performed a clustering analysis based on the k-means algorithm. The analysis aimed to classify the countries into one of four groups, considering stringency level and six human mobility categories during the first wave of the COVID-19 pandemic. The list of countries belonging to each of the four groups is presented in Figure 2 and included in Table A1 in the Appendix A.
Table 2 presents the basic descriptive statistics concerning four distinguished clusters for the first wave of the novel coronavirus pandemic. The results reveal visible differences in mobility changes among four groups of countries. The first distinguished group, LS1(I), representing the lowest stringency level, is characterised by the slightest changes in all six mobility categories. LS2(I) group, which represents a similar level of stringency as LS1(I), is characterised by a higher mobility reaction than LS1(I). We see a greater decline in mobility in four human mobility categories of places, i.e., retail and recreation, grocery and pharmacy workplaces, and the growth in residential and surprisingly in parks. HS(I) group represents the highest stringency levels and the greatest decrease of mobility in five human mobility categories. MS(I) group takes medium values of stringency and all analysed mobility categories, i.e., values between LS2(I) and HS(I) groups. Table 2 results reveal a negative relationship between the stringency level of anti-COVID-19 government policy and human mobility changes in all categories, apart from residential, where the relationship is positive.
In the next step, we verified whether the significant differences between the four analyzed clusters apply to both stringency and six mobility categories or only to selected variables. We verified the joint distribution of analyzed variables’ normality with the Shapiro–Wilk test. To check the heteroscedasticity, we applied the Breusch–Pagan test. These tests indicate the validity of the non-parametric method application, i.e., the Kruskal–Wallis test. In the study, four distinguished country groups, i.e., LS1(I), LS2(I), MS(I), and HS(I), represent the independent qualitative variable, while the dependent variable is the stringency level and each of the six human mobility categories, respectively. The results presented in Table 3 imply significant differences in median values of stringency level and all six human mobility changes between at least two out of four distinguished clusters at the 1% significance level.
Additionally, we conducted a pairwise comparison based on the Wilcoxon rank-sum test to verify whether the significant differences in median values refer to all four distinguished country groups or selected ones. The study results implied significant differences in the median level of stringency between all clusters, apart from LS1(I) and LS2(I) groups. Moreover, all clusters apart from LS2(I) and MS(I) groups differ significantly, at a 5% significance level, regarding all six categories of human mobility changes. The obtained results indicate that three groups, i.e., LS1(I), MS(I), and HS(I), significantly differ, considering both stringency level and human mobility changes. Moreover, Table 2 reveals that the more stringent a policy is, the higher is the reaction of human mobility is. It implies that the stringency level is a key factor determining human mobility changes during the COVID-19 pandemic. However, our study shows that there is a group of countries, i.e., LS2(I), that is characterised by a similar level of stringency policy as the LS1(I) group, but a significantly higher level of mobility changes than LS1(I) and similar to the MS(I) group. That implies there must be other both COVID-19- and non-COVID-19-driven factors affecting human mobility changes during the pandemic. Finding these factors should play an important role in research related to human mobility behaviour during the novel coronavirus pandemic. In the paper, we assume that one of these factors may be the HDI, an aggregate measure of a country’s social development. The HDI may reflect human mobility behaviour and changes. Thus, we checked whether distinguished clusters differ significantly regarding the HDI level and its four components, i.e., life expectancy at birth, expected years of schooling, mean years of schooling, and Gross National Income (GNI) per capita.
The research results confirmed that two groups of countries with a similar level of stringency (LS1(I) and LS2(I)), but significantly different mobility, differ significantly regarding both the HDI and all four its components (Table 4). A higher HDI characterises countries with larger mobility changes (LS2) than countries with smaller changes in mobility categories (LS1(I)) (see Table 2 and Table A1 in the Appendix A). This may suggest that people have restricted their mobility in more developed countries to a greater degree than in less developed ones, despite the similar level of imposed anti-COVID-19 restrictions. The MS(I) and HS clusters, which differ significantly in terms of both stringency and six categories of human mobility, do not differ significantly regarding both the HDI and its four components. It implies that for MS(I) and HS(I) clusters, the stringency of anti-COVID-19 government policy constitutes the key factor of human mobility changes. The stronger the restrictions, the greater magnitude of human mobility changes are observed in these groups. It is worth adding that the LS2(I) group is characterised by the highest mean values of human development indicators among all four groups. In LS2(I), the mean HDI level equals 0.94 in comparison to 0.56, 0.79, and 0.79 LS1(I), MS(I), and HS(I), respectively (see descriptive statistics presented in Table A2 in the Appendix A).
Based on the first wave of the pandemic, we observed that, in the case of LS1(I), MS(I), and HS(I), the higher stringency level of anti-COVID-19 policy leads to a stronger mobility reaction. LS2(I) group does not differ significantly from LS1(I) regarding stringency level, but the mobility changes are similar to MS(I) group. LS2(I) represents a relatively small group of European countries characterised by a very high level of human development (measured by the HDI). It shows that during the first wave of the pandemic, some very-high-developed countries did not impose very severe social distancing measures, but their residents’ ability and willingness to self-isolation and work from home were greater than in less-developed countries worldwide.
3.2. The Second Wave of the COVID-19 Pandemic
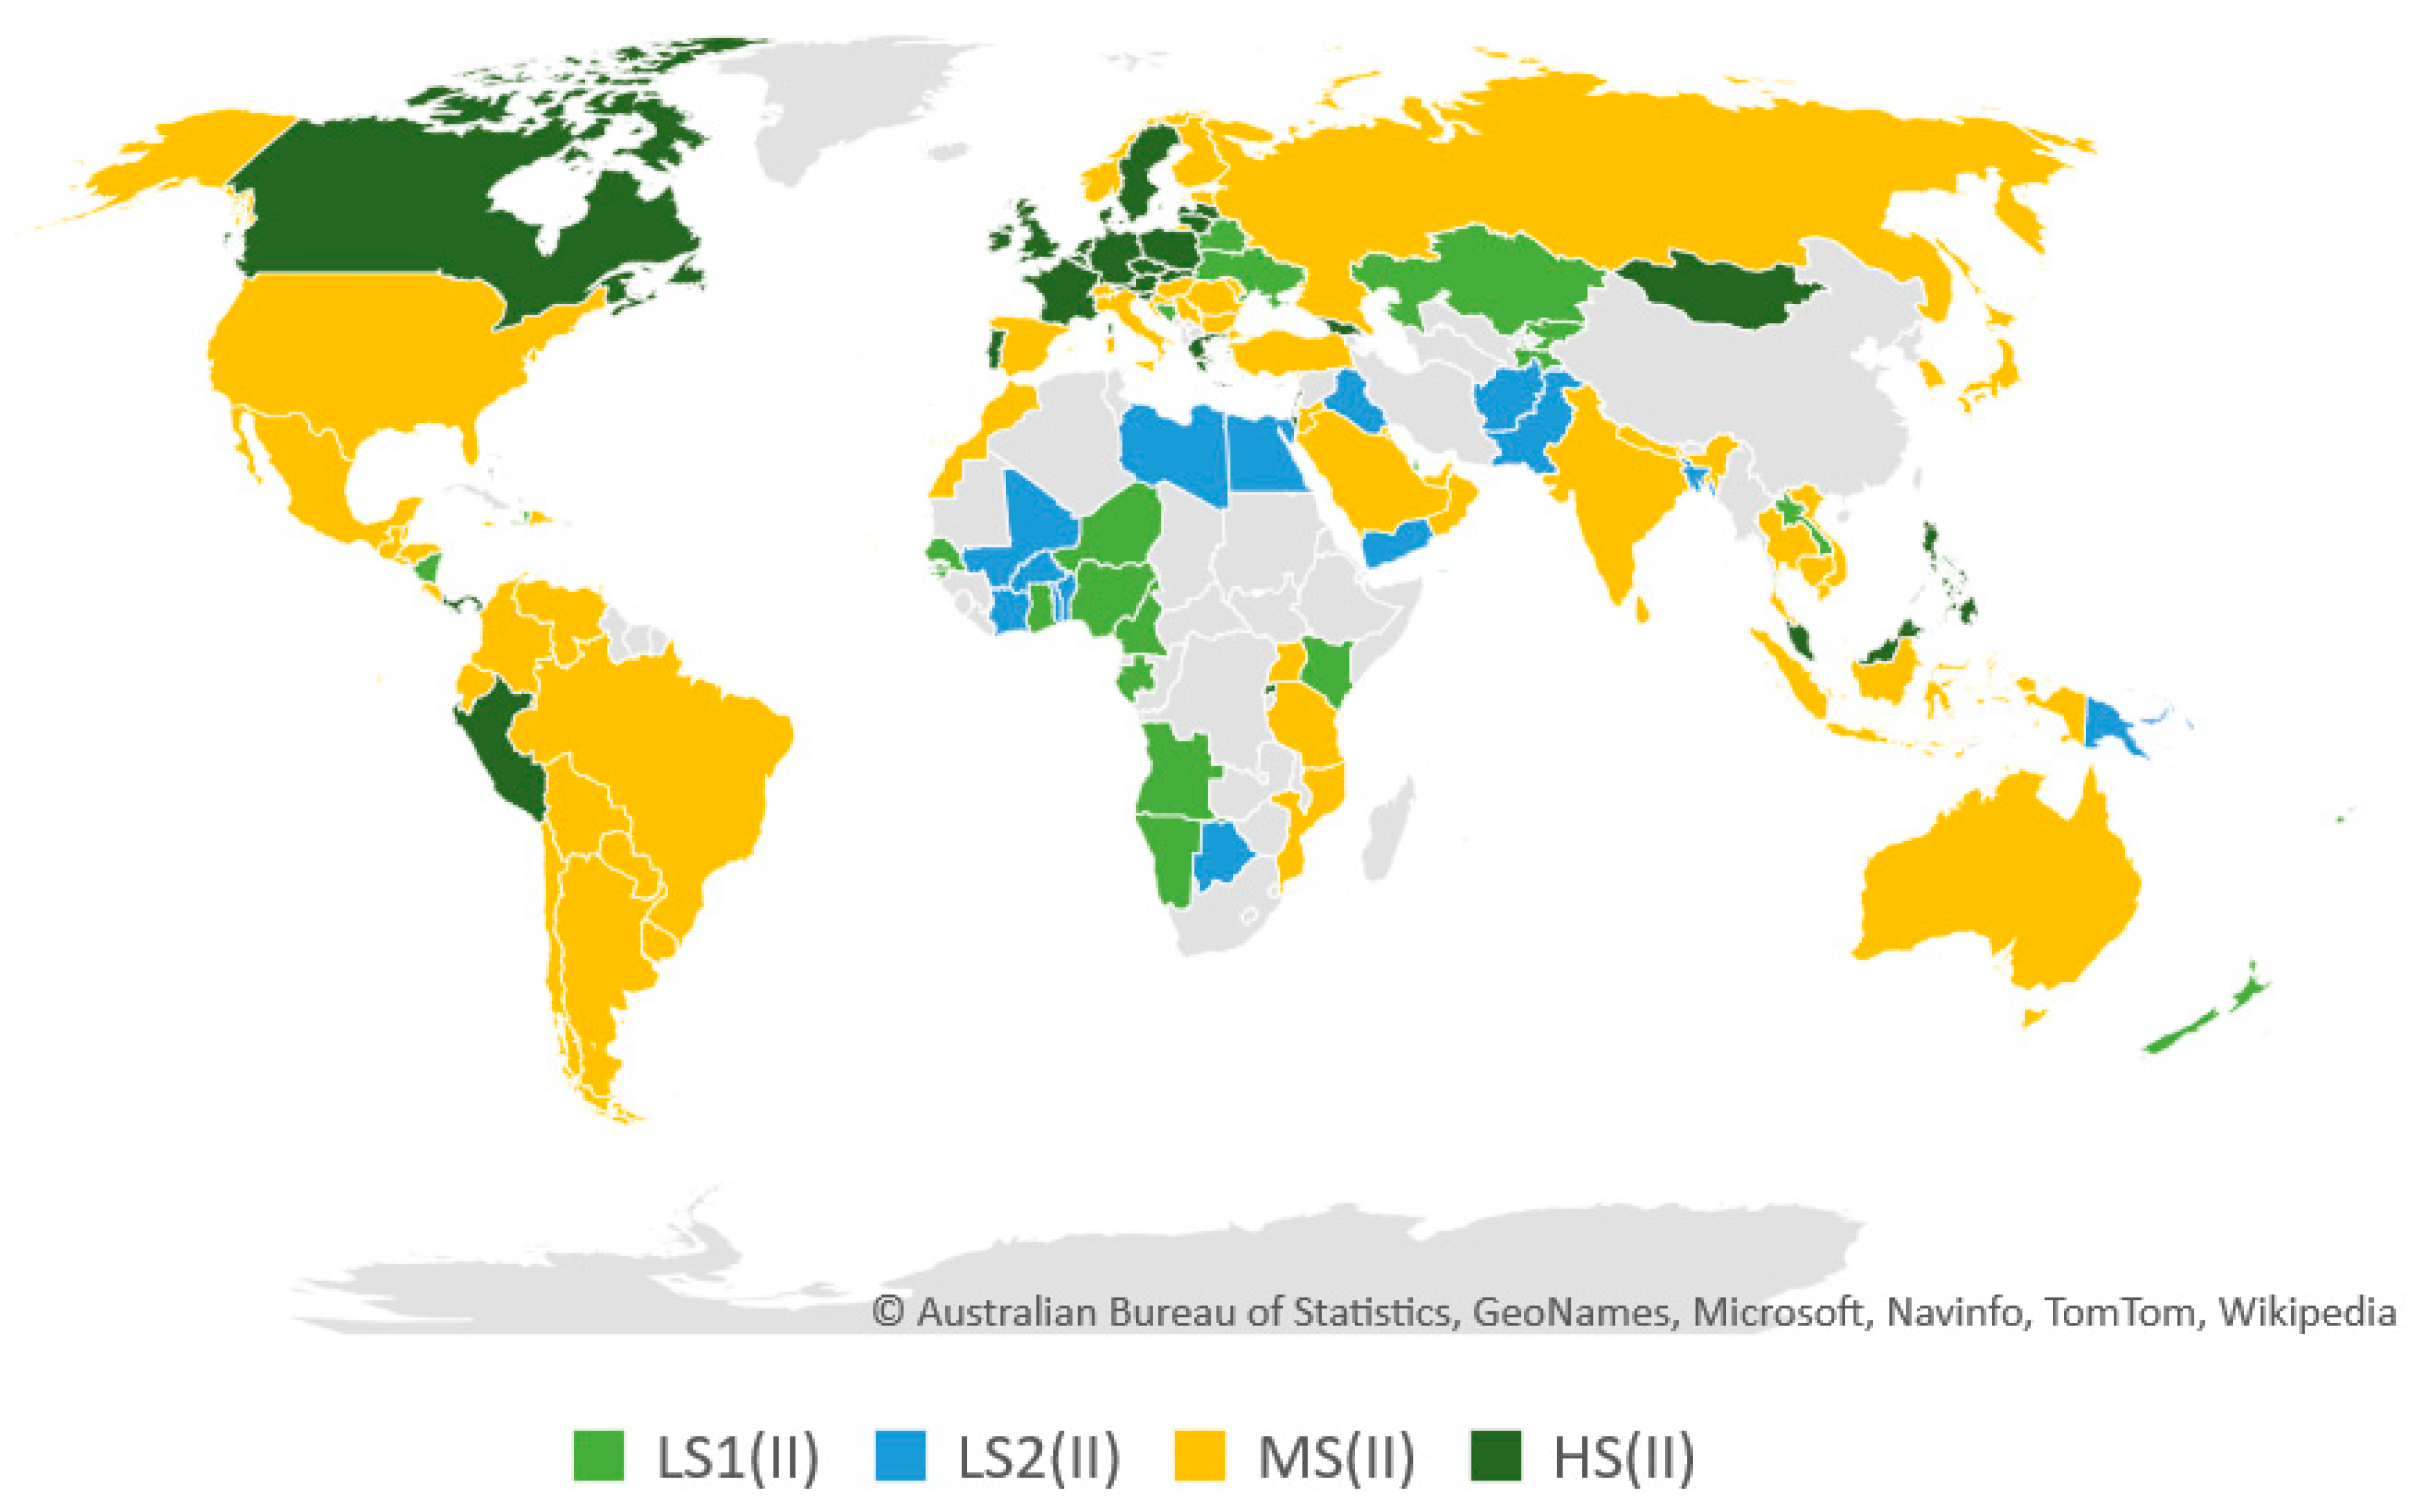
As carried out regarding the first wave of the COVID-19 pandemic, based on the k-means clustering algorithm, we distinguished four country groups, considering stringency level and six human mobility categories during the second wave of the novel coronavirus pandemic. Figure 3 and Table A3 in the Appendix A presents the content of each from four distinguished country group.
Table 5 presents the basic descriptive statistics for distinguished clusters.
The same as for the first wave of the pandemic, we distinguished two country groups (LS1(II) and LS2(II)), which represented the lowest and similar mean stringency level of anti-COVID-19 policy. However, comparing the mobility of people in these two groups, we observed the negative changes in five mobility categories in LS1(II) and positive changes in five mobility categories in LS2(II). We considered the observed increase in mobility in LS2(II) group surprising, especially in the grocery and pharmacy category. HS(II) represented the highest stringency levels and the greatest mobility changes in five human mobility categories. MS(II) group is characterised by the medium stringency level of anti-COVID-19 policy and medium changes in human mobility categories, i.e., values between LS1(II) and HS(II) groups. Table 5 results for LS1(II), MS(II), and HS(II) groups indicate a a negative relationship between the stringency level of anti-COVID-19 government policy and human mobility changes in all categories, apart from residential, where the relationship is positive. We emphasized that, similarly to the first wave of the pandemic, we distinguished two groups representing the lowest stringency level (LS1(II) and LS2(II), one median group, MS(II), and the group characterised by the highest level of stringency but the country-content of each distinguished group is different.
Same as in the case of the first wave of the pandemic, based on the Kruskal–Wallis test, we verified the existence of significant differences between the analysed four groups regarding both stringency and six mobility categories. The results presented in Table 6 indicate significant differences in median values of stringency level of anti-COVID-19 policy and changes in six analysed human mobility categories between at least two out of four distinguished clusters at the 1% level of significance.
Moreover, we conduct a pairwise comparison Wilcoxon rank-sum test. Table 6 test results reveal significant differences in the median stringency level of anti-COVID-19 policy between distinguished groups, apart from LS1(II) and LS2(II). Furthermore, at a 5% significance level, all groups differ significantly regarding all six categories of human mobility changes. We did not observe significant differences only in the case of LS1(II) and LS2(II) in the residential category, and LS1(II)-HS(II) and MS(II)-HS(II) in the parks category only. Similar to the first wave, Table 5 and Table 6 results reveal that the stringency level was a key factor determining human mobility changes during the second wave of the novel coronavirus pandemic. However, again we observed that country group, i.e., LS2(II), represents a similar stringency level of anti-COVID-19 policy as the LS1(II) but is characterised by significantly different and surprisingly positive mobility changes. This indicates other COVID-19- and non-COVID-19-driven factors influencing human mobility changes during the second wave of the pandemic. Similarly, as in the previous part of the analysis, we assume that the HDI level and its components might constitute key factors affecting human mobility behaviour and changes.
Table 7 results confirm that country groups differ significantly regarding the HDI and its components median values at a 10% significance level. However, the pairwise comparison test indicates that LS1(II) and LS2(II) country groups, similar in the case of the level of anti-COVID-19 policy and different regarding changes in human mobility categories, differ significantly in respect of the HDI. Surprisingly, education factors (mean and expected years of schooling), rather than economic factors (GNI per capita) and lifespan, better explain the differences between these two country groups. Table A4 in the Appendix A shows that LS2(II) represents the lowest average levels of both the HDI and its components.
Similar to the first wave of the pandemic, the study results for the second wave reveal that in the case of LS1(II), MS(I), and HS(II) higher stringency level of anti-COVID-19 policy is related to greater human mobility changes. LS2(II) group, which does not differ significantly from LS1(II) regarding stringency level, definitely differs from another distinguished group in terms of human behaviour reflected in mobility changes. LS2(II) represents a relatively small group of less-developed countries. This implies that people in these countries were less likely to comply with social-distancing measures than in more developed countries.
4. Discussion
We confirm that the novel coronavirus pandemic and accompanying anti-COVID-19 government regulations and restrictions substantially affected human mobility behaviour. This finding is consistent with Li et al. (2020), Pullano et al. (2020), Wielechowski et al. (2020), and Yilmazkuday (2021), but is opposed to Maloney and Taskin (2020). However, we reveal that human mobility changes during the first and second pandemic waves are country group specific. This may correspond to Li et al. (2020), Rafiq et al. (2020), Wynants et al. (2020), and Galeazzi et al. (2021), who show that novel coronavirus epidemic status is related to different geographic levels.
By analysing human mobility changes, our research results highlight the differences among people worldwide for COVID-19-driven social-distancing measures adaptation and compliance, particularly social distancing behaviour, people’s ability, and willingness to self-isolation, and working from home. Based on the first and second waves of the COVID-19 pandemic, the results indicate that perception and behaviour change over pandemic time, which is in line with Bults et al. (2015). It is worth understanding the changes in human mobility patterns to assist policy-making during the reopening of the economy, which is in line with Bao et al. (2020).
We observed that, from a long term perspective, it might have been more difficult for people to comply with those anti-COVID-19 stringency policies in countries with lower HDI levels. Our study reveals that the HDI level might play an important role in shaping human mobility patterns. Moreover, the effect of the analysed socio-economic determinants on human mobility varied throughout the pandemic periods. This is in line with Long and Ren (2022), who show that human mobility was associated with socio-economic indicators and changed throughout 2020. Our results also correspond to Gunawan (2021), who reveals a significant relationship between human mobility changes and macroeconomic indicators, i.e., the HDI and labour force participation. However, his study is based on Indonesia and has a regional perspective. Our study indirectly confirms Weill et al. (2020), Jay et al. (2020), W. D. Lee et al. (2021), Chand et al. (2021), Atchison et al. (2020), and Herren et al. (2020) findings. Similarly to us, Herren et al. (2020) investigate country economic development impact on human mobility changes. However, they focus on the first phase of the pandemic and apply only GDP per capita growth to measure economic development. Moreover, Chand et al. apply the Google mobility data for regions from several countries and confirm that GDP per capita and household income belong to the crucial determinant of reduction in mobility to work and increased residential mobility. In comparison to the above-mentioned studies, our paper concerns the global perspective and considers both the HDI and all its components, not only GDP per capita. Moreover, we compare a group of countries that are similar regarding the COVID-19-driven human mobility changes, rather than the regions from several countries
Looking at the list of countries in the distinguished groups, we strongly believe that other socio-economic factors not included in the analysis also determined human mobility behaviour changes during the COVID-19 pandemic. Chan et al. (2020) indicate that attitudes towards risk shaped human mobility patterns during the novel coronavirus pandemic and reveal that regions with risk-averse attitudes are more likely to change their mobility due to a novel coronavirus pandemic’ outbreak. Moreover, changes in mobility might be related to other personal behaviour, including threats (Wang et al. 2020b).
Recent studies confirm that human mobility reductions led to a substantial loss of aggregate economic output and contraction of consumer expenditures (Fernández-Villaverde and Jones 2020; Sheridan et al. 2020). Our study shows that human mobility changes varied across countries. This might imply that the effect of mobility changes on the country’s economic situation might be country- or country group-specific. Thus, this issue is worth more profound research.
5. Conclusions
From a global long-term perspective, human mobility is constantly increasing. Due to globalization, the number and severity of infectious diseases is also growing. Issues of human mobility changes in the face of current and future pandemics represent a global problem of great importance. The novel coronavirus pandemic has significantly affected the mobility patterns of humans. Our study shows that mobility changes are country group-specific and presents differences in mobility changes worldwide.
We indicate that the stringency of government anti-COVID-19 policy was a key factor influencing human behaviour during the pandemic. The research results imply the existence of a negative relationship between the stringency of anti-COVID-19 government policy and human mobility changes. However, interestingly, the study shows that there are country-groups that do not differ significantly in terms of stringency of anti-COVID-19 restrictions but show significant differences in COVID-19-driven human mobility changes.
We recognize the importance of the HDI in better explaining human mobility changes. We reveal that the HDI and its components represent the additional factors affecting human mobility changes. We observe that more developed country groups, i.e., groups of countries marked by the higher average level of the HDI, are characterised by a greater magnitude of human mobility changes than less developed country groups, despite the similar level of imposed anti-COVID-19 restrictions. During the first wave of the pandemic, some very-high-developed countries did not impose very severe social distancing measures, but their residents’ ability and willingness to self-isolate and work from home were greater than in less-developed countries characterised by similar stringency levels of anti-COVID-19 policy. The second wave of the pandemic, on the other hand, reveals a lower propensity and ability of people from less developed countries to comply with the restrictions. During the second wave of the novel coronavirus pandemic, a group characterised by the lowest average level of the HDI showed positive human mobility changes.
We observe that the HDI and its components differentiate human mobility patterns worldwide and are country group specific. This may suggest that a country’s socio-economic development could also determine the country group-specific spread and pace of the novel coronavirus pandemic and future pandemics, taking into account, e.g., healthcare and vaccination availability. This issue serves as a challenge for further research.
We are fully aware of the limitations of our study. We do not consider COVID-19-related factors linked to people’s awareness and fear of contagion. Finding and explaining other country group and country-specific drivers of COVID-19-driven human mobility changes will be explored in the future. Another limitation of our study is that the rate of active mobile users with internet access varies among analysed countries, which might affect the obtained results.
Our study could help governments and other policymakers implement more effective anti-pandemic policies adjusted to country-specific human mobility patterns associated with the country’s socio-economic development level and assist policy-making during the economy post-pandemic reopening. Moreover, the research results should be considered useful both from the current pandemic’s perspective and potential future pandemics that may hit societies worldwide.
Author Contributions
Conceptualization, K.C., A.D. and M.W.; methodology, K.C., A.D. and M.W.; software, K.C. and A.D.; validation, K.C., A.D. and M.W.; formal analysis, K.C., A.D. and M.W.; investigation, K.C., A.D. and M.W.; resources, K.C., A.D. and M.W.; data curation, K.C., A.D. and M.W.; writing—original draft preparation, K.C., A.D. and M.W.; writing—review and editing, K.C., A.D. and M.W.; visualization, K.C., A.D. and M.W.; supervision, K.C., A.D. and M.W.; project administration, K.C. and M.W.; funding acquisition, K.C., A.D. and M.W. All authors have read and agreed to the published version of the manuscript.
Funding
This research received no external funding.
Institutional Review Board Statement
Not applicable.
Informed Consent Statement
Not applicable.
Data Availability Statement
The study does not report any data.
Conflicts of Interest
The authors declare no conflict of interest.
Appendix A

Table A1.
Country groups content for the first wave of the COVID-19 pandemic.
| LS1(I) | LS2(I) | MS(I) | HS(I) | ||
|---|---|---|---|---|---|
| Australia | Denmark | Afghanistan | Kenya | Argentina | Malaysia |
| Belarus | Estonia | Angola | Laos | Austria | Mauritius |
| Benin | Finland | Bahrain | Malta | Bahamas | Morocco |
| Burkina Faso | Germany | Belgium | Mexico | Bangladesh | Nepal |
| Cameroon | Latvia | Belize | Moldova | Barbados | New Zealand |
| Cote d’Ivoire | Lithuania | Bosnia and Herzegovina | Namibia | Bolivia | Pakistan |
| Guinea | Netherlands | Brazil | Nigeria | Botswana | Panama |
| Hong Kong | Norway | Bulgaria | Oman | Cape Verde | Paraguay |
| Japan | Slovak Republic | Cambodia | Poland | Colombia | Peru |
| Libya | Sweden | Canada | Qatar | Croatia | Philippines |
| Mali | - | Chile | Romania | Dominicana | Portugal |
| Mongolia | - | Costa Rica | Russia | Ecuador | Saudi Arabia |
| Mozambique | - | Czech Republic | Rwanda | El Salvador | Serbia |
| Nicaragua | - | Egypt | Senegal | France | Singapore |
| Niger | - | Fiji | Slovenia | Greece | Spain |
| Papua New Guinea | - | Gabon | Switzerland | Honduras | Sri Lanka |
| South Korea | - | Georgia | Thailand | India | Uganda |
| Tajikistan | - | Ghana | Trinidad and Tobago | Israel | UAE |
| Tanzania | - | Guatemala | Turkey | Italy | - |
| Togo | - | Haiti | Ukraine | Jordan | - |
| Yemen | - | Hungary | United Kingdom | Kuwait | - |
| - | - | Indonesia | United States | Kyrgyz Republic | - |
| - | - | Iraq | Uruguay | Lebanon | - |
| - | - | Ireland | Venezuela | Luxembourg | - |
| - | - | Jamaica | Vietnam | - | - |
| - | - | Kazakhstan | - | - | - |
Source: own calculation based on COVID-19 Community Mobility Reports and the Oxford COVID-19 Government Response Tracker.
Table A2.
Descriptive statistics of the Human Development Index and its components in distinguished country groups: the first wave of the COVID-19 pandemic.
Table A2.
Descriptive statistics of the Human Development Index and its components in distinguished country groups: the first wave of the COVID-19 pandemic.
| Cluster | LS1(I) | LS2(I) | MS(I) | HS(I) | |||||
|---|---|---|---|---|---|---|---|---|---|
| Average measure | Median | Mean | Median | Mean | Median | Mean | Median | Mean | |
| HDI | 0.56 | 0.63 | 0.94 | 0.92 | 0.78 | 0.76 | 0.79 | 0.78 | |
| HDI components | Life expectancy at birth | 65.5 | 68.5 | 81.1 | 79.9 | 74.6 | 73.9 | 76.5 | 76.3 |
| Expected years of schooling | 12.1 | 12.2 | 17.6 | 17.5 | 14.3 | 14.0 | 14.2 | 14.1 | |
| Mean years of schooling | 6.1 | 6.9 | 12.9 | 12.9 | 9.7 | 9.4 | 10.0 | 9.4 | |
| GNI per capita | 38.0 | 45.8 | 91.0 | 83.4 | 54.0 | 60.8 | 74.0 | 67.9 | |
Source: own calculation based on COVID-19 Community Mobility Reports and the Oxford COVID-19 Government Response Tracker.
Table A3.
Country groups content for the second wave of the COVID-19 pandemic.
| LS1(II) | LS2(II) | MS(II) | HS(II) | |
|---|---|---|---|---|
| Angola | Afghanistan | Argentina | Mexico | Austria |
| Belarus | Bangladesh | Australia | Moldova | Bahamas |
| Bosnia and Herzegovina | Benin | Bahrain | Morocco | Barbados |
| Cameroon | Botswana | Belize | Mozambique | Belgium |
| Fiji | Burkina Faso | Bolivia | Nepal | Canada |
| Gabon | Cote d’Ivoire | Brazil | Norway | Czech Republic |
| Ghana | Egypt | Bulgaria | Oman | Denmark |
| Guinea | Iraq | Cambodia | Paraguay | France |
| Haiti | Libya | Cape Verde | Romania | Georgia |
| Kazakhstan | Mali | Chile | Russia | Germany |
| Kenya | Pakistan | Colombia | Saudi Arabia | Greece |
| Kyrgyz Republic | Papua New Guinea | Costa Rica | Serbia | Ireland |
| Laos | Togo | Croatia | South Korea | Israel |
| Mauritius | Yemen | Dominican Republic | Spain | Latvia |
| Namibia | - | Ecuador | Sri Lanka | Lebanon |
| New Zealand | - | El Salvador | Switzerland | Lithuania |
| Nicaragua | - | Estonia | Tanzania | Luxembourg |
| Niger | - | Finland | Thailand | Malaysia |
| Nigeria | - | Guatemala | Trinidad and Tobago | Mongolia |
| Qatar | - | Honduras | Turkey | Netherlands |
| Senegal | - | Hong Kong | Uganda | Panama |
| Singapore | - | Hungary | United Arab Emirates | Peru |
| Tajikistan | - | India | United States | Philippines |
| Ukraine | - | Indonesia | Uruguay | Poland |
| - | - | Italy | Venezuela | Portugal |
| - | - | Jamaica | Vietnam | Rwanda |
| - | - | Japan | - | Slovak Republic |
| - | - | Jordan | - | Slovenia |
| - | - | Kuwait | - | Sweden |
| - | - | Malta | - | United Kingdom |
Source: own calculation based on COVID-19 Community Mobility Reports and the Oxford COVID-19 Government Response Tracker.
Table A4.
Descriptive statistics of the Human Development Index and its components in distinguished country groups: the second wave of the COVID-19 pandemic.
Table A4.
Descriptive statistics of the Human Development Index and its components in distinguished country groups: the second wave of the COVID-19 pandemic.
| Cluster | LS1(II) | LS2(II) | MS(II) | HS(II) | |||||
|---|---|---|---|---|---|---|---|---|---|
| Average measure | Median | Mean | Median | Mean | Median | Mean | Median | Mean | |
| HDI | 0.66 | 0.68 | 0.55 | 0.57 | 0.80 | 0.78 | 0.88 | 0.86 | |
| HDI components | Life expectancy at birth | 67.9 | 69.2 | 65.5 | 65.9 | 76.1 | 78.6 | 78.8 | 82.2 |
| Expected years of schooling | 12.2 | 12.6 | 10.8 | 10.8 | 14.4 | 14.5 | 16.2 | 15.9 | |
| Mean years of schooling | 8.0 | 8.2 | 5.1 | 5.2 | 9.8 | 9.6 | 12.5 | 11.6 | |
| GNI per capita | 56.5 | 59.3 | 35.0 | 40.1 | 67.5 | 66.4 | 66.0 | 68.2 | |
Source: own calculation based on COVID-19 Community Mobility Reports and the Oxford COVID-19 Government Response Tracker.
References
- Adiga, Aniruddha, Lijing Wang, Adam Sadilek, Ashish Tendulkar, Srinivasan Venkatramanan, Anil Vullikanti, Gaurav Aggarwal, Alok Talekar, Xue Ben, Jiangzhuo Chen, and et al. 2020. Interplay of Global Multi-Scale Human Mobility, Social Distancing, Government Interventions, and COVID-19 Dynamics. Preprint. Public and Global Health. Available online: http://medrxiv.org/lookup/doi/10.1101/2020.06.05.20123760 (accessed on 20 September 2021).
- Andersen, Kristian, Andrew Rambaut, Walter Ian Lipkin, Edward Holmes, and Robert Garry. 2020. The Proximal Origin of SARS-CoV-2. Nature Medicine 26: 450–52. [Google Scholar] [CrossRef] [Green Version]
- Atchison, Chrisitna, Leigh Bowman, Charlotte Vrinten, Rozlyn Redd, Philippa Pristerà, Jeffrey Eaton, and Helen Ward. 2020. Perceptions and Behavioural Responses of the General Public during the COVID-19 Pandemic: A Cross-Sectional Survey of UK Adults. Preprint. Public and Global Health. Available online: http://medrxiv.org/lookup/doi/10.1101/2020.04.01.20050039 (accessed on 2 September 2021).
- Badr, Hamada, Hongru Du, Maximilian Marshall, Ensheng Dong, Marietta Squire, and Lauren Gardner. 2020. Association between Mobility Patterns and COVID-19 Transmission in the USA: A Mathematical Modelling Study. The Lancet Infectious Diseases 20: 1247–54. [Google Scholar] [CrossRef]
- Bao, Han, Xun Zhou, Yingxue Zhang, Yanhua Li, and Yiqun Xie. 2020. COVID-GAN: Estimating Human Mobility Responses to COVID-19 Pandemic through Spatio-Temporal Conditional Generative Adversarial Networks. In Proceedings of the 28th International Conference on Advances in Geographic Information Systems. Seattle: ACM, pp. 273–82. Available online: https://dl.acm.org/doi/10.1145/3397536.3422261 (accessed on 10 September 2021).
- Benjamini, Yoav, and Yosef Hochberg. 1995. Controlling the False Discovery Rate: A Practical and Powerful Approach to Multiple Testing. Journal of the Royal Statistical Society: Series B (Methodological) 57: 289–300. [Google Scholar] [CrossRef]
- Beria, Paulo, and Vardhman Lunkar. 2021. Presence and Mobility of the Population during the First Wave of Covid-19 Outbreak and Lockdown in Italy. Sustainable Cities and Society 65: 102616. [Google Scholar] [CrossRef] [PubMed]
- Bonaccorsi, Giovanni, Francesco Pierri, Matteo Cinelli, Andrea Flori, Alessandro Galeazzi, Francesco Porcelli, Ana Lucia Schmidt, Carlo Michele Valensise, Antonio Scala, Walter Quattrociocchi, and et al. 2020. Economic and Social Consequences of Human Mobility Restrictions under COVID-19. Proceedings of the National Academy of Sciences 117: 15530–35. [Google Scholar] [CrossRef]
- Borkowski, Przemysław, Magdalena Jażdżewska-Gutta, and Agnieszka Szmelter-Jarosz. 2021. Lockdowned: Everyday Mobility Changes in Response to COVID-19. Journal of Transport Geography 90: 102906. [Google Scholar] [CrossRef]
- Bults, Marloes, Desiree Beaujean, Jan Richardus, and Helene Voeten. 2015. Perceptions and Behavioral Responses of the General Public During the 2009 Influenza A (H1N1) Pandemic: A Systematic Review. Disaster Medicine and Public Health Preparedness 9: 207–19. [Google Scholar] [CrossRef]
- Cairns, David, Thais França, Daniel Malet Calvo, and Leonardo Francisco de Azevedo. 2021. Immobility, Precarity and the Covid-19 Pandemic: The Impact of Lockdown on International Students in Portugal. Journal of Youth Studies, 1–15. [Google Scholar] [CrossRef]
- Cartenì, Armando, Luigi Di Francesco, and Maria Martino. 2020. How Mobility Habits Influenced the Spread of the COVID-19 Pandemic: Results from the Italian Case Study. Science of The Total Environment 741: 140489. [Google Scholar] [CrossRef]
- Chan, Ho Fai, Ahmed Skali, David Savage, David Stadelmann, and Benno Torgler. 2020. Risk Attitudes and Human Mobility during the COVID-19 Pandemic. Scientific Reports 10: 19931. [Google Scholar] [CrossRef] [PubMed]
- Chand, Sai, Vaibhav Dange, and Vinayak Dixit. 2021. COVID-19: Relationship between Mobility and Macroeconomic Indicator. Preprint. In Review. Available online: https://www.researchsquare.com/article/rs-483169/v1 (accessed on 10 September 2021).
- Chinazzi, Matteo, Jessica Davis, Marco Ajelli, Corrado Gioannini, Maria Litvinova, Stefano Merler, Ana Pastore y Piontti, Kunpeng Mu, Luca Rossi, Kaiyuan Sun, and et al. 2020. The Effect of Travel Restrictions on the Spread of the 2019 Novel Coronavirus (COVID-19) Outbreak. Science 368: 395–400. [Google Scholar] [CrossRef] [Green Version]
- Chiou, Lesley, and Catherine Tucker. 2020. Social Distancing, Internet Access and Inequality. NBER Working Papers 26982. Cambridge: National Bureau of Economic Research. [Google Scholar]
- Corazza, Maria Vittoria, and Antonio Musso. 2021. Urban Transport Policies in the Time of Pandemic, and after: An ARDUOUS Research Agenda. Transport Policy 103: 31–44. [Google Scholar] [CrossRef]
- Czech, Katarzyna, and Michał Wielechowski. 2021. Energy commodity price response to covid-19: Impact of epidemic status, government policy, and stock market volatility. International Journal of Energy Economics and Policy 11: 443–53. [Google Scholar] [CrossRef]
- De Sá, Felipe, and Susana de Araujo Gastal. 2021. Mobilidade, Imobilidade e a-Mobilidade: Para Discutir o Turismo Em Tempos de COVID-19. Revista Brasileira de Pesquisa Em Turismo 15: 2144. [Google Scholar] [CrossRef]
- De Vos, Jonas. 2020. The Effect of COVID-19 and Subsequent Social Distancing on Travel Behavior. Transportation Research Interdisciplinary Perspectives 5: 100121. [Google Scholar] [CrossRef]
- Di Martino, Maria Luisa. 2021. Exploring Returnee Migrant Women, COVID-19 and Sustainability in Spain. Sustainability 13: 9653. [Google Scholar] [CrossRef]
- Fernández-Villaverde, Jesus, and Charles Jones. 2020. Macroeconomic Outcomes and COVID-19: A Progress Report. Cambridge: National Bureau of Economic Research, Available online: http://www.nber.org/papers/w28004.pdf (accessed on 20 September 2021).
- Freudendal-Pedersen, Malene, and Sven Kesselring. 2021. What Is the Urban without Physical Mobilities? COVID-19-Induced Immobility in the Mobile Risk Society. Mobilities 16: 81–95. [Google Scholar] [CrossRef]
- Frey, Carl Benedikt, Chinchih Chen, and Giorgio Presidente. 2020. Democracy, Culture, and Contagion: Political Regimes and Countries Responsiveness to Covid-19. Covid Economics 18: 222–38. [Google Scholar]
- Galeazzi, Alessandro, Matteo Cinelli, Giovanni Bonaccorsi, Franceso Pierri, Ana Lucia Schmidt, Antonio Scala, Fabio Pammolli, and Walter Quattrociocchi. 2021. Human Mobility in Response to COVID-19 in France, Italy and UK. Scientific Reports 11: 13141. [Google Scholar] [CrossRef]
- Gargoum, Suliman, and Ali Gargoum. 2021. Limiting Mobility during COVID-19, When and to What Level? An International Comparative Study Using Change Point Analysis. Journal of Transport & Health 20: 101019. [Google Scholar]
- Google. 2021. COVID-19 Community Mobility Reports. Google. Available online: https://www.google.com/covid19/mobility/ (accessed on 2 October 2021).
- Gössling, Stefan, Daniel Scott, and Colin Michael Hall. 2021. Pandemics, Tourism and Global Change: A Rapid Assessment of COVID-19. Journal of Sustainable Tourism 29: 1–20. [Google Scholar] [CrossRef]
- Gunawan. 2021. Data Mining for Revealing Relationship Between Google Community Mobility and Macro-Economic Indicators. Paper presented at 2021 9th International Conference on Information and Communication Technology (ICoICT), Yogyakarta, Indonesia, August 3–5; Yogyakarta: IEEE, pp. 478–82. Available online: https://ieeexplore.ieee.org/document/9527431/ (accessed on 2 October 2021).
- Hadjidemetriou, Georgios, Manu Sasidharan, Georgia Kouyialis, and Ajith Parlikad. 2020. The Impact of Government Measures and Human Mobility Trend on COVID-19 Related Deaths in the UK. Transportation Research Interdisciplinary Perspectives 6: 100167. [Google Scholar] [CrossRef]
- Hale, Thomas, Samuel Webster, Anna Petherick, Toby Phillips, and Beatriz Kira. 2020. Oxford COVID-19 Government Response Tracker. Blavatnik School of Government. Available online: www.bsg.ox.ac.uk/covidtracker (accessed on 2 October 2021).
- Herren, Cristina, Tenley Brownwright, Erin Liu, Nisrine El Amiri, and Maimuna Majumder. 2020. Democracy and Mobility: A Preliminary Analysis of Global Adherence to Non-Pharmaceutical Interventions for COVID-19. SSRN Electronic Journal. Available online: https://www.ssrn.com/abstract=3570206 (accessed on 20 September 2021). [CrossRef]
- Jay, Jonathan, Jacob Bor, Elaine Nsoesie, Sarah Lipson, David Jones, Sandro Galea, and Julia Raifman. 2020. Neighbourhood Income and Physical Distancing during the COVID-19 Pandemic in the United States. Nature Human Behaviour 4: 1294–302. [Google Scholar] [CrossRef]
- Kartal, Mustafa Tevfik, Özer Depren, and Serpil Kiliç Depren. 2021. The Relationship between Mobility and COVID-19 Pandemic: Daily Evidence from an Emerging Country by Causality Analysis. Transportation Research Interdisciplinary Perspectives 10: 100366. [Google Scholar] [CrossRef]
- Koh, David. 2020. COVID-19 Lockdowns throughout the World. Occupational Medicine 70: 322–22. [Google Scholar] [CrossRef]
- Kraemer, Moritz, Chia-Hung Yang, Bernardo Gutierrez, Chieh-Hsi Wu, Brennan Klein, David Pigott, Open COVID-19 Data Working Group, Louis du Plessis, Nuno R. Faria, Ruoran Li, and et al. 2020. The Effect of Human Mobility and Control Measures on the COVID-19 Epidemic in China. Science 368: 493–97. [Google Scholar] [CrossRef] [PubMed] [Green Version]
- Kruskal, William. 1952. A Nonparametric Test for the Several Sample Problem. The Annals of Mathematical Statistics 23: 525–40. [Google Scholar] [CrossRef]
- Kruskal, William, and Wilson Allen Wallis. 1952. Use of Ranks in One-Criterion Variance Analysis. Journal of the American Statistical Association 47: 583–621. [Google Scholar] [CrossRef]
- Lai, Shengjie, Nick Ruktanonchai, Liangcai Zhou, Olivia Prosper, Wei Luo, Jessica Floyd, Amy Wesolowski, Mauricio Santillana, Chi Zhang, Xiangjun Du, and et al. 2020. Effect of Non-Pharmaceutical Interventions to Contain COVID-19 in China. Nature 585: 410–13. [Google Scholar] [CrossRef]
- Lau, Joseph, Xiao Yang, Hubert Tsui, and John Jong-Hyun Kim. 2003. Monitoring Community Responses to the SARS Epidemic in Hong Kong: From Day 10 to Day 62. Journal of Epidemiology & Community Health 57: 864–70. [Google Scholar]
- Lee, Vernon, Calvin Chiew, and Wei Xin Khong. 2020. Interrupting Transmission of COVID-19: Lessons from Containment Efforts in Singapore. Journal of Travel Medicine 27: taaa039. [Google Scholar] [CrossRef] [PubMed] [Green Version]
- Lee, Won Do, Matthias Qian, and Tim Schwanen. 2021. The Association between Socioeconomic Status and Mobility Reductions in the Early Stage of England’s COVID-19 Epidemic. Health & Place 69: 102563. [Google Scholar]
- Li, Lixiang, Zihang Yang, Zhongkai Dang, Cui Meng, Jingze Huang, Haotian Meng, Deyu Wang, Guanhua Chen, Jiaxuan Zhang, Haipeng Peng, and et al. 2020. Propagation Analysis and Prediction of the COVID-19. Infectious Disease Modelling 5: 282–92. [Google Scholar] [CrossRef]
- Li, Yun, Moming Li, Megan Rice, Haoyuan Zhang, Dexuan Sha, Mei Li, Yanfang Su, and Chaowei Yang. 2021. The Impact of Policy Measures on Human Mobility, COVID-19 Cases, and Mortality in the US: A Spatiotemporal Perspective. International Journal of Environmental Research and Public Health 18: 996. [Google Scholar] [CrossRef]
- Linde, Yoseph, Andres Buzo, and Robert Gray. 1980. An Algorithm for Vector Quantizer Design. IEEE Transactions on Communications 28: 84–95. [Google Scholar] [CrossRef] [Green Version]
- Long, Jed, and Chang Ren. 2022. Associations between Mobility and Socio-Economic Indicators Vary across the Timeline of the Covid-19 Pandemic. Computers, Environment and Urban Systems 91: 101710. [Google Scholar] [CrossRef]
- Maloney, William, and Temel Taskin. 2020. Determinants of Social Distancing and Economic Activity during COVID-19: A Global View. Washington, DC: World Bank, Available online: http://hdl.handle.net/10986/33754 (accessed on 2 October 2021).
- Martin, Susan, and Jonas Bergmann. 2021. (Im)Mobility in the Age of COVID-19. International Migration Review 55: 660–87. [Google Scholar] [CrossRef]
- McGrail, Daniel, Jianli Dai, Kathleen McAndrews, and Raghu Kalluri. 2020. Enacting National Social Distancing Policies Corresponds with Dramatic Reduction in COVID19 Infection Rates. Ed. Chris T. Bauch. PLoS ONE 15: e0236619. [Google Scholar] [CrossRef]
- Mendolia, Silvia, Olena Stavrunova, and Oleg Yerokhin. 2021. Determinants of the Community Mobility during the COVID-19 Epidemic: The Role of Government Regulations and Information. Journal of Economic Behavior & Organization 184: 199–231. [Google Scholar]
- Nagata, Shohei, Tomoki Nakaya, Yu Adachi, Toru Inamori, Kazuto Nakamura, Dai Arima, and Hiroshi Nishiura. 2021. Mobility Change and COVID-19 in Japan: Mobile Data Analysis of Locations of Infection. Journal of Epidemiology 31: 387–91. [Google Scholar] [CrossRef]
- Nicola, Maria, Zaid Alsafi, Catrin Sohrabi, Ahmed Kerwan, Ahmed Al-Jabir, Christos Iosifidis, Maliha Agha, and Riaz Agha. 2020. The Socio-Economic Implications of the Coronavirus Pandemic (COVID-19): A Review. International Journal of Surgery 78: 185–93. [Google Scholar] [CrossRef] [PubMed]
- Nouvellet, Pierre, Sangeeta Bhatia, Anne Cori, Kylie Ainslie, Marc Baguelin, Samir Bhatt, Adhiratha Boonyasiri, Nicholas F. Brazeau, Lorenzo Cattarino, Laura V. Cooper, and et al. 2021. Reduction in Mobility and COVID-19 Transmission. Nature Communications 12: 1090. [Google Scholar] [CrossRef]
- Pan, Yixuan, Aref Darzi, Aliakbar Kabiri, Guangchen Zhao, Weiyu Luo, Chenfeng Xiong, and Lei Zhang. 2020. Quantifying Human Mobility Behaviour Changes during the COVID-19 Outbreak in the United States. Scientific Reports 10: 20742. [Google Scholar] [CrossRef] [PubMed]
- Pullano, Giulia, Eugenio Valdano, Nicola Scarpa, Stefania Rubrichi, and Vittoria Colizza. 2020. Evaluating the Impact of Demographic, Socioeconomic Factors, and Risk Aversion on Mobility during COVID-19 Epidemic in France under Lockdown: A Population-Based Study. Preprint. Infectious Diseases (except HIV/AIDS). Available online: http://medrxiv.org/lookup/doi/10.1101/2020.05.29.20097097 (accessed on 2 October 2021).
- Rafiq, Danish, Suhail Ahmad Suhail, and Mohammad Abid Bazaz. 2020. Evaluation and Prediction of COVID-19 in India: A Case Study of Worst Hit States. Chaos, Solitons & Fractals 139: 110014. [Google Scholar]
- Sadique, Zia, John Edmunds, Richard Smith, William Jan Meerding, Onno de Zwart, Johannes Brug, and Philippe Beutels. 2007. Precautionary Behavior in Response to Perceived Threat of Pandemic Influenza. Emerging Infectious Diseases 13: 1307–13. [Google Scholar] [CrossRef]
- Saha, Jay, Bikash Barman, and Pradip Chouhan. 2020. Lockdown for COVID-19 and Its Impact on Community Mobility in India: An Analysis of the COVID-19 Community Mobility Reports, 2020. Children and Youth Services Review 116: 105160. [Google Scholar] [CrossRef]
- Santamaria, Carlos, Francesco Sermi, Spyridon Spyratos, Stefano Maria Iacus, Alessandro Annunziato, Dario Tarchi, and Michele Vespe. 2020. Measuring the Impact of COVID-19 Confinement Measures on Human Mobility Using Mobile Positioning Data. A European Regional Analysis. Safety Science 132: 104925. [Google Scholar] [CrossRef] [PubMed]
- Sheridan, Adam, Asger Lau Andersen, Emil Toft Hansen, and Niels Johannesen. 2020. Social Distancing Laws Cause Only Small Losses of Economic Activity during the COVID-19 Pandemic in Scandinavia. Proceedings of the National Academy of Sciences 117: 20468–73. [Google Scholar] [CrossRef] [PubMed]
- Sigler, Thomas, Sirat Mahmuda, Anthony Kimpton, Julia Loginova, Pia Wohland, Elin Charles-Edwards, and Jonathan Corcoran. 2021. The Socio-Spatial Determinants of COVID-19 Diffusion: The Impact of Globalisation, Settlement Characteristics and Population. Globalization and Health 17: 56. [Google Scholar] [CrossRef]
- SteelFisher, Gillian, Robert Blendon, Mark Bekheit, and Keri Lubell. 2010. The Public’s Response to the 2009 H1N1 Influenza Pandemic. New England Journal of Medicine 362: e65. [Google Scholar] [CrossRef] [PubMed] [Green Version]
- Sulyok, Mihaly, and Mark Walker. 2020. Community Movement and COVID-19: A Global Study Using Google’s Community Mobility Reports. Epidemiology and Infection 148: e284. [Google Scholar] [CrossRef]
- Tandon, Prakash. 2020. COVID-19: Impact on Health of People & Wealth of Nations. Indian Journal of Medical Research 151: 121–23. [Google Scholar]
- Van Bavel, Jay, Kathrine Baicker, Paulo Boggio, Valerio Capraro, Aleksandra Cichocka, Mina Cikara, Molly Crockett, Alia Crum, Karen Douglas, James Druckman, and et al. 2020. Using Social and Behavioural Science to Support COVID-19 Pandemic Response. Nature Human Behaviour 4: 460–71. [Google Scholar] [CrossRef]
- Wang, Siqin, Yan Liu, and Tao Hu. 2020a. Examining the Change of Human Mobility Adherent to Social Restriction Policies and Its Effect on COVID-19 Cases in Australia. International Journal of Environmental Research and Public Health 17: 7930. [Google Scholar] [CrossRef]
- Wang, Songhe, Kangda Wei, Lei Lin, and Weizi Li. 2020b. Spatial-Temporal Analysis of COVID-19’s Impact on Human Mobility: The Case of the United States. arXiv arXiv:2010.03707 [Physics]. Available online: http://arxiv.org/abs/2010.03707 (accessed on 2 October 2021).
- Weill, Joakim, Matthieu Stigler, Olivier Deschenes, and Michael Springborn. 2020. Social Distancing Responses to COVID-19 Emergency Declarations Strongly Differentiated by Income. Proceedings of the National Academy of Sciences 117: 19658–60. [Google Scholar] [CrossRef]
- Wielechowski, Michał, Katarzyna Czech, and Łukasz Grzęda. 2020. Decline in Mobility: Public Transport in Poland in the Time of the COVID-19 Pandemic. Economies 8: 78. [Google Scholar] [CrossRef]
- Wilcoxon, Frank. 1992. Individual Comparisons by Ranking Methods. In Breakthroughs in Statistics. Edited by Samuel Kotz and Norman Johnson. Springer Series in Statistics; New York: Springer, pp. 196–202. Available online: http://link.springer.com/10.1007/978-1-4612-4380-9_16 (accessed on 20 September 2021).
- Wynants, Laure, Ben Van Calster, Gary Collins, Richard Riley, Georg Heinze, Ewoud Schuit, Marc Bonten, Darren Dahly, Johanna Damen, Thomas Debray, and et al. 2020. Prediction Models for Diagnosis and Prognosis of Covid-19: Systematic Review and Critical Appraisal. BMJ 369: m1328. [Google Scholar] [CrossRef] [Green Version]
- Yabe, Takahiro, Kota Tsubouchi, Naoya Fujiwara, Takayuki Wada, Yoshihide Sekimoto, and Satish Ukkusuri. 2020. Non-Compulsory Measures Sufficiently Reduced Human Mobility in Tokyo during the COVID-19 Epidemic. Scientific Reports 10: 18053. [Google Scholar] [CrossRef] [PubMed]
- Yilmazkuday, Hakan. 2021. Stay-at-Home Works to Fight against COVID-19: International Evidence from Google Mobility Data. Journal of Human Behavior in the Social Environment 31: 210–20. [Google Scholar] [CrossRef]
- Zayed, Nurul Mohammad, Sunjida Khan, Shahiduzzaman Khan Shahi, and Mithila Afrin. 2021. Impact of Coronavirus (COVID-19) on the World Economy, 2020: A Conceptual Analysis. Journal of Humanities, Arts and Social Science 5: 1–5. [Google Scholar] [CrossRef]
- Zhu, Dongshan, Shiva Raj Mishra, Xikun Han, and Karla Santo. 2020. Social Distancing in Latin America during the COVID-19 Pandemic: An Analysis Using the Stringency Index and Google Community Mobility Reports. Journal of Travel Medicine 27: taaa125. [Google Scholar] [CrossRef] [PubMed]
Figure 1.
Global Stringency Index from January 2020 till February 2021: pandemic’s wave distinction. Source: own elaboration based on COVID-19 Community Mobility Reports.
Figure 1.
Global Stringency Index from January 2020 till February 2021: pandemic’s wave distinction. Source: own elaboration based on COVID-19 Community Mobility Reports.

Figure 2.
Country groups for the first wave of the pandemic. Source: own elaboration based on COVID-19 Community Mobility Reports.
Figure 2.
Country groups for the first wave of the pandemic. Source: own elaboration based on COVID-19 Community Mobility Reports.

Figure 3.
Country groups for the second wave of the pandemic. Source: own elaboration based on COVID-19 Community Mobility Reports.
Figure 3.
Country groups for the second wave of the pandemic. Source: own elaboration based on COVID-19 Community Mobility Reports.

Table 1.
Human mobility categories content based on COVID-19 Community Mobility Reports.
| Category | Retail and Recreation | Grocery and Pharmacy | Parks | Transit Stations | Workplaces | Residential |
|---|---|---|---|---|---|---|
| Places | restaurants, cafes, shopping centres, theme parks, museums, libraries, movie theatres | grocery markets, food warehouses, farmers markets, specialty food shops, drug stores, pharmacies | national parks, public beaches, marinas, dog parks, plazas, public gardens | public transport hubs, including subway, bus, and train stations, | place of work | places of residence |
Source: own elaboration based on COVID-19 Community Mobility Reports.
Table 2.
Descriptive statistics of stringency level of anti-COVID-19 government policy and human mobility changes in distinguished country groups: the first wave of the COVID-19 pandemic.
Table 2.
Descriptive statistics of stringency level of anti-COVID-19 government policy and human mobility changes in distinguished country groups: the first wave of the COVID-19 pandemic.
| Country Group | LS1(I) | LS2(I) | MS(I) | HS(I) | |||||
|---|---|---|---|---|---|---|---|---|---|
| Average measure | Median | Mean | Median | Mean | Median | Mean | Median | Mean | |
| Stringency | 72.00 | 67.24 | 77.50 | 75.10 | 85.00 | 84.12 | 94.00 | 91.74 | |
| Human mobility categories | Retail and Recreation | −22.17 | −21.63 | −43.67 | −45.02 | −54.25 | −53.80 | −76.92 | −75.93 |
| Grocery and Pharmacy | −9.42 | −7.50 | −14.67 | −14.58 | −28.42 | −27.75 | −51.04 | −49.31 | |
| Parks | −15.75 | −10.08 | 28.63 | 34.59 | −31.25 | −31.97 | −61.33 | −59.06 | |
| Transit | −29.25 | −27.35 | −55.17 | −51.88 | −56.67 | −56.54 | −76.29 | −76.18 | |
| Workplaces | −19.75 | −17.82 | −48.63 | −47.71 | −44.33 | −44.67 | −65.88 | −65.59 | |
| Residential | 11.00 | 10.67 | 17.33 | 16.79 | 19.50 | 20.44 | 30.38 | 30.83 | |
Source: own calculation based on COVID-19 Community Mobility Reports and the Oxford COVID-19 Government Response Tracker.
Table 3.
Kruskal–Wallis and Wilcoxon rank-sum pairwise comparison tests: results for the first wave of the COVID-19 pandemic.
Table 3.
Kruskal–Wallis and Wilcoxon rank-sum pairwise comparison tests: results for the first wave of the COVID-19 pandemic.
| Category | Stringency | Human Mobility Categories | |||||
|---|---|---|---|---|---|---|---|
| Retail and Recreation | Grocery and Pharmacy | Parks | Public Transport | Workplaces | Residential | ||
| Kruskal-Wallis test (results) | |||||||
| chi-square | 53.57 | 94.40 | 88.37 | 85.2 | 96.55 | 94.51 | 87.02 |
| p-value | <0.001 | <0.001 | <0.001 | <0.001 | <0.001 | <0.001 | <0.001 |
| Pairwise comparison (p-value)—Wilcoxon rank-sum test | |||||||
| LS1(I)-LS2(I) | 0.374 | <0.001 | 0.040 | <0.001 | <0.001 | <0.001 | 0.005 |
| LS1(I)-MS(I) | <0.001 | <0.001 | <0.001 | <0.001 | <0.001 | <0.001 | <0.001 |
| LS1(I)-HS(I) | <0.001 | <0.001 | <0.001 | <0.001 | <0.001 | <0.001 | <0.001 |
| LS2(I)-MS(I) | 0.002 | 0.051 | <0.001 | <0.001 | 0.130 | 0.290 | 0.008 |
| LS2(I)-HS(I) | <0.001 | <0.001 | <0.001 | <0.001 | <0.001 | <0.001 | <0.001 |
| MS(I)-HS(I) | <0.001 | <0.001 | <0.001 | <0.001 | <0.001 | <0.001 | <0.001 |
Source: own calculation based on COVID-19 Community Mobility Reports and the Oxford COVID-19 Government Response Tracker.
Table 4.
Kruskal–Wallis and Wilcoxon rank-sum pairwise comparison tests: results for the HDI level and its four components: the first wave of the COVID-19 pandemic.
Table 4.
Kruskal–Wallis and Wilcoxon rank-sum pairwise comparison tests: results for the HDI level and its four components: the first wave of the COVID-19 pandemic.
| Category | HDI | HDI Components | |||
|---|---|---|---|---|---|
| Life Expectancy at Birth | Expected Years of Schooling | Mean Years of Schooling | GNI per Capita | ||
| Kruskal-Wallis (results) | |||||
| chi-square | 26.52 | 19.6 | 23.19 | 26.84 | 8.97 |
| p-value | <0.001 | <0.001 | <0.001 | <0.001 | 0.03 |
| Pairwise comparison (p-value)—Wilcoxon rank-sum test | |||||
| LS1(I)-LS2(I) | 0.001 | 0.013 | <0.001 | <0.001 | 0.013 |
| LS1(I)-MS(I) | 0.006 | 0.016 | 0.016 | 0.016 | 0.161 |
| LS1(I)-HS(I) | 0.004 | 0.005 | 0.011 | 0.022 | 0.085 |
| LS2(I)-MS(I) | <0.001 | 0.006 | <0.001 | <0.001 | 0.161 |
| LS2(I)-HS(I) | <0.001 | 0.042 | <0.001 | <0.001 | 0.306 |
| MS(I)-HS(I) | 0.605 | 0.102 | 0.951 | 0.829 | 0.329 |
Source: own calculation based on COVID-19 Community Mobility Reports, UNDP Human Development Reports and the Oxford COVID-19 Government Response Tracker.
Table 5.
Descriptive statistics of stringency level of anti-COVID-19 government policy and human mobility changes in distinguished country groups: the second wave of the COVID-19 pandemic.
Table 5.
Descriptive statistics of stringency level of anti-COVID-19 government policy and human mobility changes in distinguished country groups: the second wave of the COVID-19 pandemic.
| Cluster | LS1(II) | LS2(II) | MS(II) | HS(II) | |||||
|---|---|---|---|---|---|---|---|---|---|
| Average measure | Median | Mean | Median | Mean | Median | Mean | Median | Mean | |
| Stringency | 50.00 | 48.54 | 61.00 | 55.14 | 69.50 | 67.34 | 76.50 | 77.80 | |
| Human mobility categories | Retail and Recreation | −12.07 | −12.10 | 3.16 | 6.75 | −28.04 | −29.01 | −54.83 | −53.25 |
| Grocery and Pharmacy | −0.44 | −0.52 | 38.23 | 38.54 | −6.42 | −5.13 | −15.46 | −17.09 | |
| Parks | −15.08 | −13.88 | 12.74 | 17.13 | −24.92 | −21.73 | −16.00 | −18.86 | |
| Transit stations | −12.25 | −9.25 | 6.05 | 7.12 | −33.17 | −32.66 | −52.75 | −53.45 | |
| Workplaces | −13.39 | −15.56 | −5.14 | −4.51 | −26.00 | −27.02 | −39.03 | −43.32 | |
| Residential | 4.47 | 4.71 | 4.58 | 4.50 | 9.95 | 9.65 | 16.44 | 17.98 | |
Source: own calculation based on COVID-19 Community Mobility Reports and the Oxford COVID-19 Government Response Tracker.
Table 6.
Kruskal–Wallis and Wilcoxon rank-sum pairwise comparison tests: results for the second wave of the COVID-19 pandemic.
Table 6.
Kruskal–Wallis and Wilcoxon rank-sum pairwise comparison tests: results for the second wave of the COVID-19 pandemic.
| Category | Stringency | Human Mobility Categories | |||||
|---|---|---|---|---|---|---|---|
| Retail and Recreation | Grocery and Pharmacy | Parks | Transit | Workplaces | Residential | ||
| Kruskal-Wallis (results) | |||||||
| chi-square | 49.276 | 100.56 | 63.12 | 30.977 | 94.395 | 76.245 | 70.638 |
| p-value | <0.001 | <0.001 | <0.001 | <0.001 | <0.001 | <0.001 | <0.001 |
| Pairwise comparison (p-value)—Wilcoxon rank-sum test | |||||||
| LS1(II)-LS2(II) | 0.289 | <0.001 | <0.001 | <0.001 | 0.001 | <0.001 | 0.950 |
| LS1(II)-MS(II) | <0.001 | <0.001 | 0.009 | 0.028 | <0.001 | <0.001 | <0.001 |
| LS1(II)-HS(II) | <0.001 | <0.001 | <0.001 | 0.449 | <0.001 | <0.001 | <0.001 |
| LS2(II)-MS(II) | 0.043 | <0.001 | <0.001 | <0.001 | <0.001 | <0.001 | <0.001 |
| LS2(II)-HS(II) | <0.001 | <0.001 | <0.001 | <0.001 | <0.001 | <0.001 | <0.001 |
| MS(II)-HS(II) | <0.001 | <0.001 | <0.001 | 0.38 | <0.001 | <0.001 | <0.001 |
Source: own calculation based on COVID-19 Community Mobility Reports and the Oxford COVID-19 Government Response Tracker.
Table 7.
Kruskal–Wallis and Wilcoxon rank-sum pairwise comparison tests: results for the HDI level and its four components: the second wave of the COVID-19 pandemic.
Table 7.
Kruskal–Wallis and Wilcoxon rank-sum pairwise comparison tests: results for the HDI level and its four components: the second wave of the COVID-19 pandemic.
| Category | HDI | HDI Components | |||
|---|---|---|---|---|---|
| Life Expectancy at Birth | Expected Years of Schooling | Mean Years of Schooling | GNI per Capita | ||
| Kruskal-Wallis (results) | |||||
| chi-square | 44.39 | 46.11 | 38.05 | 42.07 | 7.04 |
| p-value | <0.001 | <0.001 | <0.001 | <0.001 | 0.071 |
| Pairwise comparison (p-value)—Wilcoxon rank-sum test | |||||
| LS1(II)-LS2(II) | 0.032 | 0.164 | 0.053 | 0.008 | 0.305 |
| LS1(II)-MS(II) | 0.003 | <0.001 | 0.007 | 0.088 | 0.551 |
| LS1(II)-HS(II) | <0.001 | <0.001 | <0.001 | <0.001 | 0.519 |
| LS2(II)-MS(II) | <0.001 | <0.001 | <0.001 | <0.001 | 0.043 |
| LS2(II)-HS(II) | <0.001 | <0.001 | <0.001 | <0.001 | 0.043 |
| MS(II)-HS(II) | 0.002 | 0.018 | 0.009 | <0.001 | 0.874 |
Source: own calculation based on COVID-19 Community Mobility Reports, UNDP Human Development Reports and the Oxford COVID-19 Government Response Tracker.
Publisher’s Note: MDPI stays neutral with regard to jurisdictional claims in published maps and institutional affiliations. |
© 2021 by the authors. Licensee MDPI, Basel, Switzerland. This article is an open access article distributed under the terms and conditions of the Creative Commons Attribution (CC BY) license (https://creativecommons.org/licenses/by/4.0/).
Share and Cite
MDPI and ACS Style
Czech, K.; Davy, A.; Wielechowski, M. Does the COVID-19 Pandemic Change Human Mobility Equally Worldwide? Cross-Country Cluster Analysis. Economies 2021, 9, 182. https://doi.org/10.3390/economies9040182
AMA Style
Czech K, Davy A, Wielechowski M. Does the COVID-19 Pandemic Change Human Mobility Equally Worldwide? Cross-Country Cluster Analysis. Economies. 2021; 9(4):182. https://doi.org/10.3390/economies9040182
Chicago/Turabian StyleCzech, Katarzyna, Anna Davy, and Michał Wielechowski. 2021. "Does the COVID-19 Pandemic Change Human Mobility Equally Worldwide? Cross-Country Cluster Analysis" Economies 9, no. 4: 182. https://doi.org/10.3390/economies9040182
Note that from the first issue of 2016, this journal uses article numbers instead of page numbers. See further details here.