
Will the COVID-19 Pandemic Outbreak Intensify the Resource Misallocation in China’s Food Production?

College of Management and Economic, Nanjing Forestry University, Nanjing 210037, China
*
Author to whom correspondence should be addressed.
Sustainability 2023, 15(6), 5255; https://doi.org/10.3390/su15065255
Submission received: 15 February 2023
/
Revised: 14 March 2023
/
Accepted: 14 March 2023
/
Published: 16 March 2023
(This article belongs to the Special Issue The Effects of COVID-19 Shock on Sustainable Regional Development and Emerging Pathways toward Economic Recovery)
Abstract
:Resource misallocation is one of the important manifestations of agricultural supply-side distortion and an important causal factor that hinders food production increase and affects food security. Did the COVID-19 pandemic intensify China’s food production misallocation? The extent and consequences require quantitative assessment and scenario analysis. In this paper, we use a combination of input-output model and computable general equilibrium (CGE) model, and further incorporate the most important input factor in agriculture—intermediate inputs—into the model. At the same time, simulation of the pandemic impact from the demand and supply sides, respectively, and scenario analysis of the impact of the COVID-19 pandemic on China’s food production. The results of the study show that: first, compared with the baseline level before the epidemic, the overall TFP growth of China’s food industry chain decreased, and the TFP growth rate of the food distribution sector decreased most significantly. Second, there are significant factor misallocation distortions of capital, labor, and intermediate inputs. Third, in the short term, the period of the COVID-19 pandemic led to a decline in the vitality of the national labor market, but the return of non-farm employed labor in rural areas instead reduced the degree of labor misallocation in the food sector. Fourth, the demand side has a greater impact on China’s food production, among which the consumer demand has a particularly strong impact on the resource allocation of food production, and the short-term shock will mainly have a more obvious impact on the allocation of labor factors and the allocation of intermediate input factors in the food industry chain. Accordingly, this paper proposes that in order to guarantee China’s food security and adapt to the short-term characteristics of the era when the COVID-19 pandemic is rampant, China should make efforts in four areas: rational allocation of food production resources and factors, solid construction of the whole food industry chain, stable guarantee of the food market system and transfer to enhance social expectations.
1. Introduction
The COVID-19 pandemic suddenly broke out at the end of 2019, causing a huge impact on global economic growth and bringing far-reaching effects to all sectors of the national economy. Among them, the impact of the imbalance between supply and demand in the food industry chain is the most extensive, involving not only the economic income of food producers, but also the income of those involved in the processing and distribution of agricultural products, and even affecting the welfare of the general consumers, bringing a major change to global food security that has not been seen in a century (Tamru, et al., 2020; Zhang, 2021; Dong, et al., 2021; Barrett, 2022) [1,2,3,4]. Domestically, China’s total food supply is sufficient, but the existence of a dualistic urban-rural structure and imperfect factor markets, as well as inherent land system in China has led to the prevalence of agricultural resource misallocation (Zhen, 2019; Chari, et al., 2021; Adamopoulos, et al., 2022) [5,6,7]. In addition, under the dramatic exogenous shock of the COVID-19 pandemic, the temporal and spatial flows of labor, capital, and other factors of production were temporarily stagnant (Zhang, et al., 2020; Tian, et al., 2023) [8,9]. More than three years COVID-19 pandemic further intensified the misallocation of food production factors that affected food security in China. Considering that the pandemic shock is a more complex and comprehensive structural shock, from the research method, the computable general equilibrium (CGE) model is one of the classical models to study the impact of exogenous shocks on the total and structure of the economy, The CGE model was first proposed by Johansen (1960) [10]. Given that the CGE model can quantitatively analyze the impact of the association between policy and changes in economic activities on a rigorous theoretical basis, the CGE model has become a relatively popular analytical tool in the research field. At present, CGE models have been widely studied in issues such as energy environment, international trade, and fiscal taxation (Barrage, 2020; Shapiro, 2021; Lin, et al., 2022; Du, et al., 2023) [11,12,13,14].
So this paper integrates the input-output model and the CGE model, further incorporates intermediate input factors in the model, and quantitatively studies the loss of resource allocation caused by the COVID-19 pandemic on the three major input factors-capital, labor, and intermediate inputs-in China’s food industry chain, and the impact simulation from the demand side and supply side, respectively, to the scenario, analyze the impact of the COVID-19 pandemic on China’s food industry chain. The specific technical route is shown in Figure 1.
The innovations of this paper: the first innovation is to compile China’s food input-output tables for 2017, 2018, and 2020, as well as China’s macro SAM and micro SAM tables for 2020, based on the data from the China Bureau of Statistics; the second innovation is to combine the input-output model and the computable general equilibrium (CGE) model, and further incorporate the most important input factor in agriculture—intermediate inputs—in the model to quantify the resource allocation losses caused by the pandemic the three major input factors—capital, labor, and intermediate inputs—in China’s food production. The paper is organized as follows: We provide a brief literature review on resource misallocation in Section 2. In Section 3, we introduce the theoretical model of the paper and the data sources. Section 4 and Section 5 show the empirical test results and give a preliminary analysis. In Section 6, we summarizes the main conclusions and suggestions. Finally, in Section 7, we compare the research results with previous research, and propose the limitations of this article and the imagination of future research.
2. Literature Review
In terms of the study of resource misallocation, it has received wide attention from researchers because of the unique idea of resource misallocation analysis and clear academic logic, especially the openness, accessibility, convenience, and interactivity of data brought by information technology and the Internet. The mapping of resource misallocation micro aggregation to explain macro disparities in TFP and income between countries and regions is regarded as one of the most novel research directions in the field of economic growth theory since the beginning of this century (Jones, 2016; Acemoglu, Azar, 2020) [15,16]. The existing studies mainly focus on the basic concepts, evaluation criteria, sources of transmission, and measurement methods. First, resource misallocation is the misallocation of factor resources, which is manifested in the misallocation of production input factors such as enterprise capital, labor, innovation, and land, thus pulling down aggregate indicators such as TFP and income in countries and regions (David, Venkateswaran, 2019; Dai, Cheng, 2019; Baqaee, Farhi, 2020) [17,18,19]. Second, the misallocation is relative to the efficient allocation of resources and involves good or bad allocation quality and efficiency, so it belongs to the normative analysis and therefore requires setting evaluation criteria. On the one hand, developed countries have set benchmarks for developing countries in terms of optimal resource allocation. For example, Hsieh & Klenow (2009) use the United States as a benchmark, and a comparative study shows that if capital and labor in China and India were reallocated to bring the marginal product equilibrium to the U.S. level, manufacturing TFP in the two countries would increase by 30–50% and 40–60%, respectively [20]. On the other hand, modern economics provides the classical theoretical explanation for whether resources are misallocated. Resources are optimally allocated when they are allocated on the production possibility frontier. Conversely, resource misallocation occurs (Romer, 2019; Maas-Clare, et al., 1995) [21,22]. Third, researchers generally analyze the sources leading to resource misallocation in terms of the input side of the production function, the intermediate processes, and the market and policy environment (Shen, Zhen, 2015; Restuccia, Rogerson, 2017; Bau, 2023) [23,24,25]. Most studies are centered on TFP measurement as the main instrument. In the measurement of TFP, intermediate inputs should be included in the accounting framework, and ignoring the resource misallocation of intermediate products will lead to the underestimation of TFP losses (Liu, Wu, 2019; Donovan, 2021) [26,27].
Throughout the existing studies, the research on agricultural resource misallocation mainly focuses on natural factors of agricultural production, such as water factor and land factors (Abolpour, 2018; Christian, et al., 2022) [28,29], and non-natural factors, such as labor factor, capital factor, financial factor and science and technology factor (Yu, et al., 2019; Farrokhi, Pellegrina, 2023) [30,31]. The misallocation of production factors not only reduces agricultural TFP but also creates an output gap in China’s food industry chain. If the causes of resource misallocation can be understood and the related distortions can be corrected, it is possible to further increase agricultural output without increasing factor inputs and to enhance the production efficiency of the sectors in the food industry chain (Amodio, Martinez-Carrasco,2018; Adamopoulos, Restuccia, 2022) [32,33].
3. Theoretical Model and Data
3.1. Estimation Method of TFP and Factor Distortion Measure of Food Industry Chain
According to the statistical caliber of sector 153 of the 2020 China Input-Output Table, the industries directly related to food involve the production equipment input, production, processing, and circulation of food. Among them, the seed industry is not listed separately in the industrial classification; livestock products (03003) use soybean, corn, and other food products as feed, so they are also listed in the food production chain, as shown in Table 1.
For the TFP growth rate measure of the food industry chain, this paper draws on Hu & Chen (2019) [34], as follows. Assuming a Hicks-neutral production function, the industry production function in period t is expressed as:
where, Y, K, L, and Z represent output, capital input, labor input, and intermediate input, respectively, and A represents Hicks-neutral technological progress.
In the discrete data case, for a given industry j, there are:
where , denotes the two-period average of the share of compensation of each factor input in nominal total output in sector j.
The shares of capital input, labor input and intermediate input in total output in the jth sector in period t can be expressed as: , , .
where is the producer output price, is the capital goods rental price, is the labor input price, and is the intermediate input price.
For the measurement of TFP loss due to resource misallocation, this paper refers to Chen & Hu (2011) [35], and considers the distortion of capital and labor prices, Equations (3)–(5) give the relative distortion coefficients of capital, labor, and intermediate input as follows:
where is the share of nominal gross output of segment j in the total value added of the whole economy.
The data used for the TFP estimation method and factor distortion measure of food production are mainly obtained from the self-prepared input-output tables of China’s food industry chain. For capital input data, the perpetual inventory method is used for calculation, and the formula is . The capital depreciation rate is borrowed from Li, et al. (2020) [36]. The capital input price is measured by the per capita expenditure on household productive fixed assets in RMB 10,000 per person. Agricultural labor input is measured by the total number of workers used in days. Labor price is measured by the cash expenditure on agricultural laborer compensation going to 10,000 yuan/day.
3.2. CGE Model Setting and Data Sources for the Food Industry
The model constructed in this paper is based on the IFPRI standardized model developed by Lofgren, et al. (2002) [37], and the CGE model of China’s food production is established using a self-compiled social accounting matrix of the food industry chain. The data inputs for the CGE model are mainly derived from the social accounting matrix (SAM). In order to study the impact of the upstream, middle and downstream of the food industry chain on the impact of the pandemic, the SAM table of the food industry chain in China was developed in-house based on the Chinese input-output table compiled by the National Bureau of Statistics. In this study, considering that the COVID-19 pandemic started in late 2019 and the 2020 SAM table is the data set affected by the impact of the COVID-19 pandemic, the 2020 China SAM table was selected as the benchmark data for data selection. The required data are obtained from the 2020 China Non-Competitive Input-Output Tables, China Statistical Yearbook, China Financial Yearbook, China Customs Yearbook and other relevant statistical information. Table A1 shows the macro social accounting matrix for China in 2020.
Model closure settings. In order to simulate the income distribution effects of technological progress shocks in the agricultural sector, it is necessary to choose the appropriate macro closure settings in the CGE model, i.e., to choose which variables are endogenously determined by the model and which variables are exogenously determined by the model. The macro closure setting involves five aspects, namely, price benchmark, government closure, external economic closure, savings and investment closure, and factor market closure. The macro closure rules of this model are set as follows: government budget equilibrium is selected as “GOV-1”, i.e., the tax rate is fixed and government savings is the equilibrium variable. Balance of payments equilibrium is selected as “ROW-2”, i.e., the exchange rate is fixed and foreign savings is the equilibrium variable. The savings-investment equilibrium is chosen as “SI-3”, where investment is driven by savings.
After the CGE model is established, parameter estimation is crucial in the CGE model analysis process. Usually, there are two main types of elasticity parameters in the CGE model that need to be set exogenously before calibration: one is the elasticity of substitution in the CES production function, and the other is the elasticity in the trade function. The elasticities of substitution of the CES production function are set and estimated by the Bayesian method in this paper, and the results are shown in Table 2.
Elasticities in the trade function. In the CGE model, it mainly includes Armington elasticity and CET elasticity, both of which represent the degree of substitution between imports and national products and the degree of substitution between exports and domestic sales of national products, respectively. In this paper, the findings of Zhai & Herter (2005) [38] are used as the base data, as detailed in Table A2.
4. Empirical Analysis
4.1. Changes in TFP of Food Industry Chain Sub-Sectors before and after the COVID-19 Pandemic
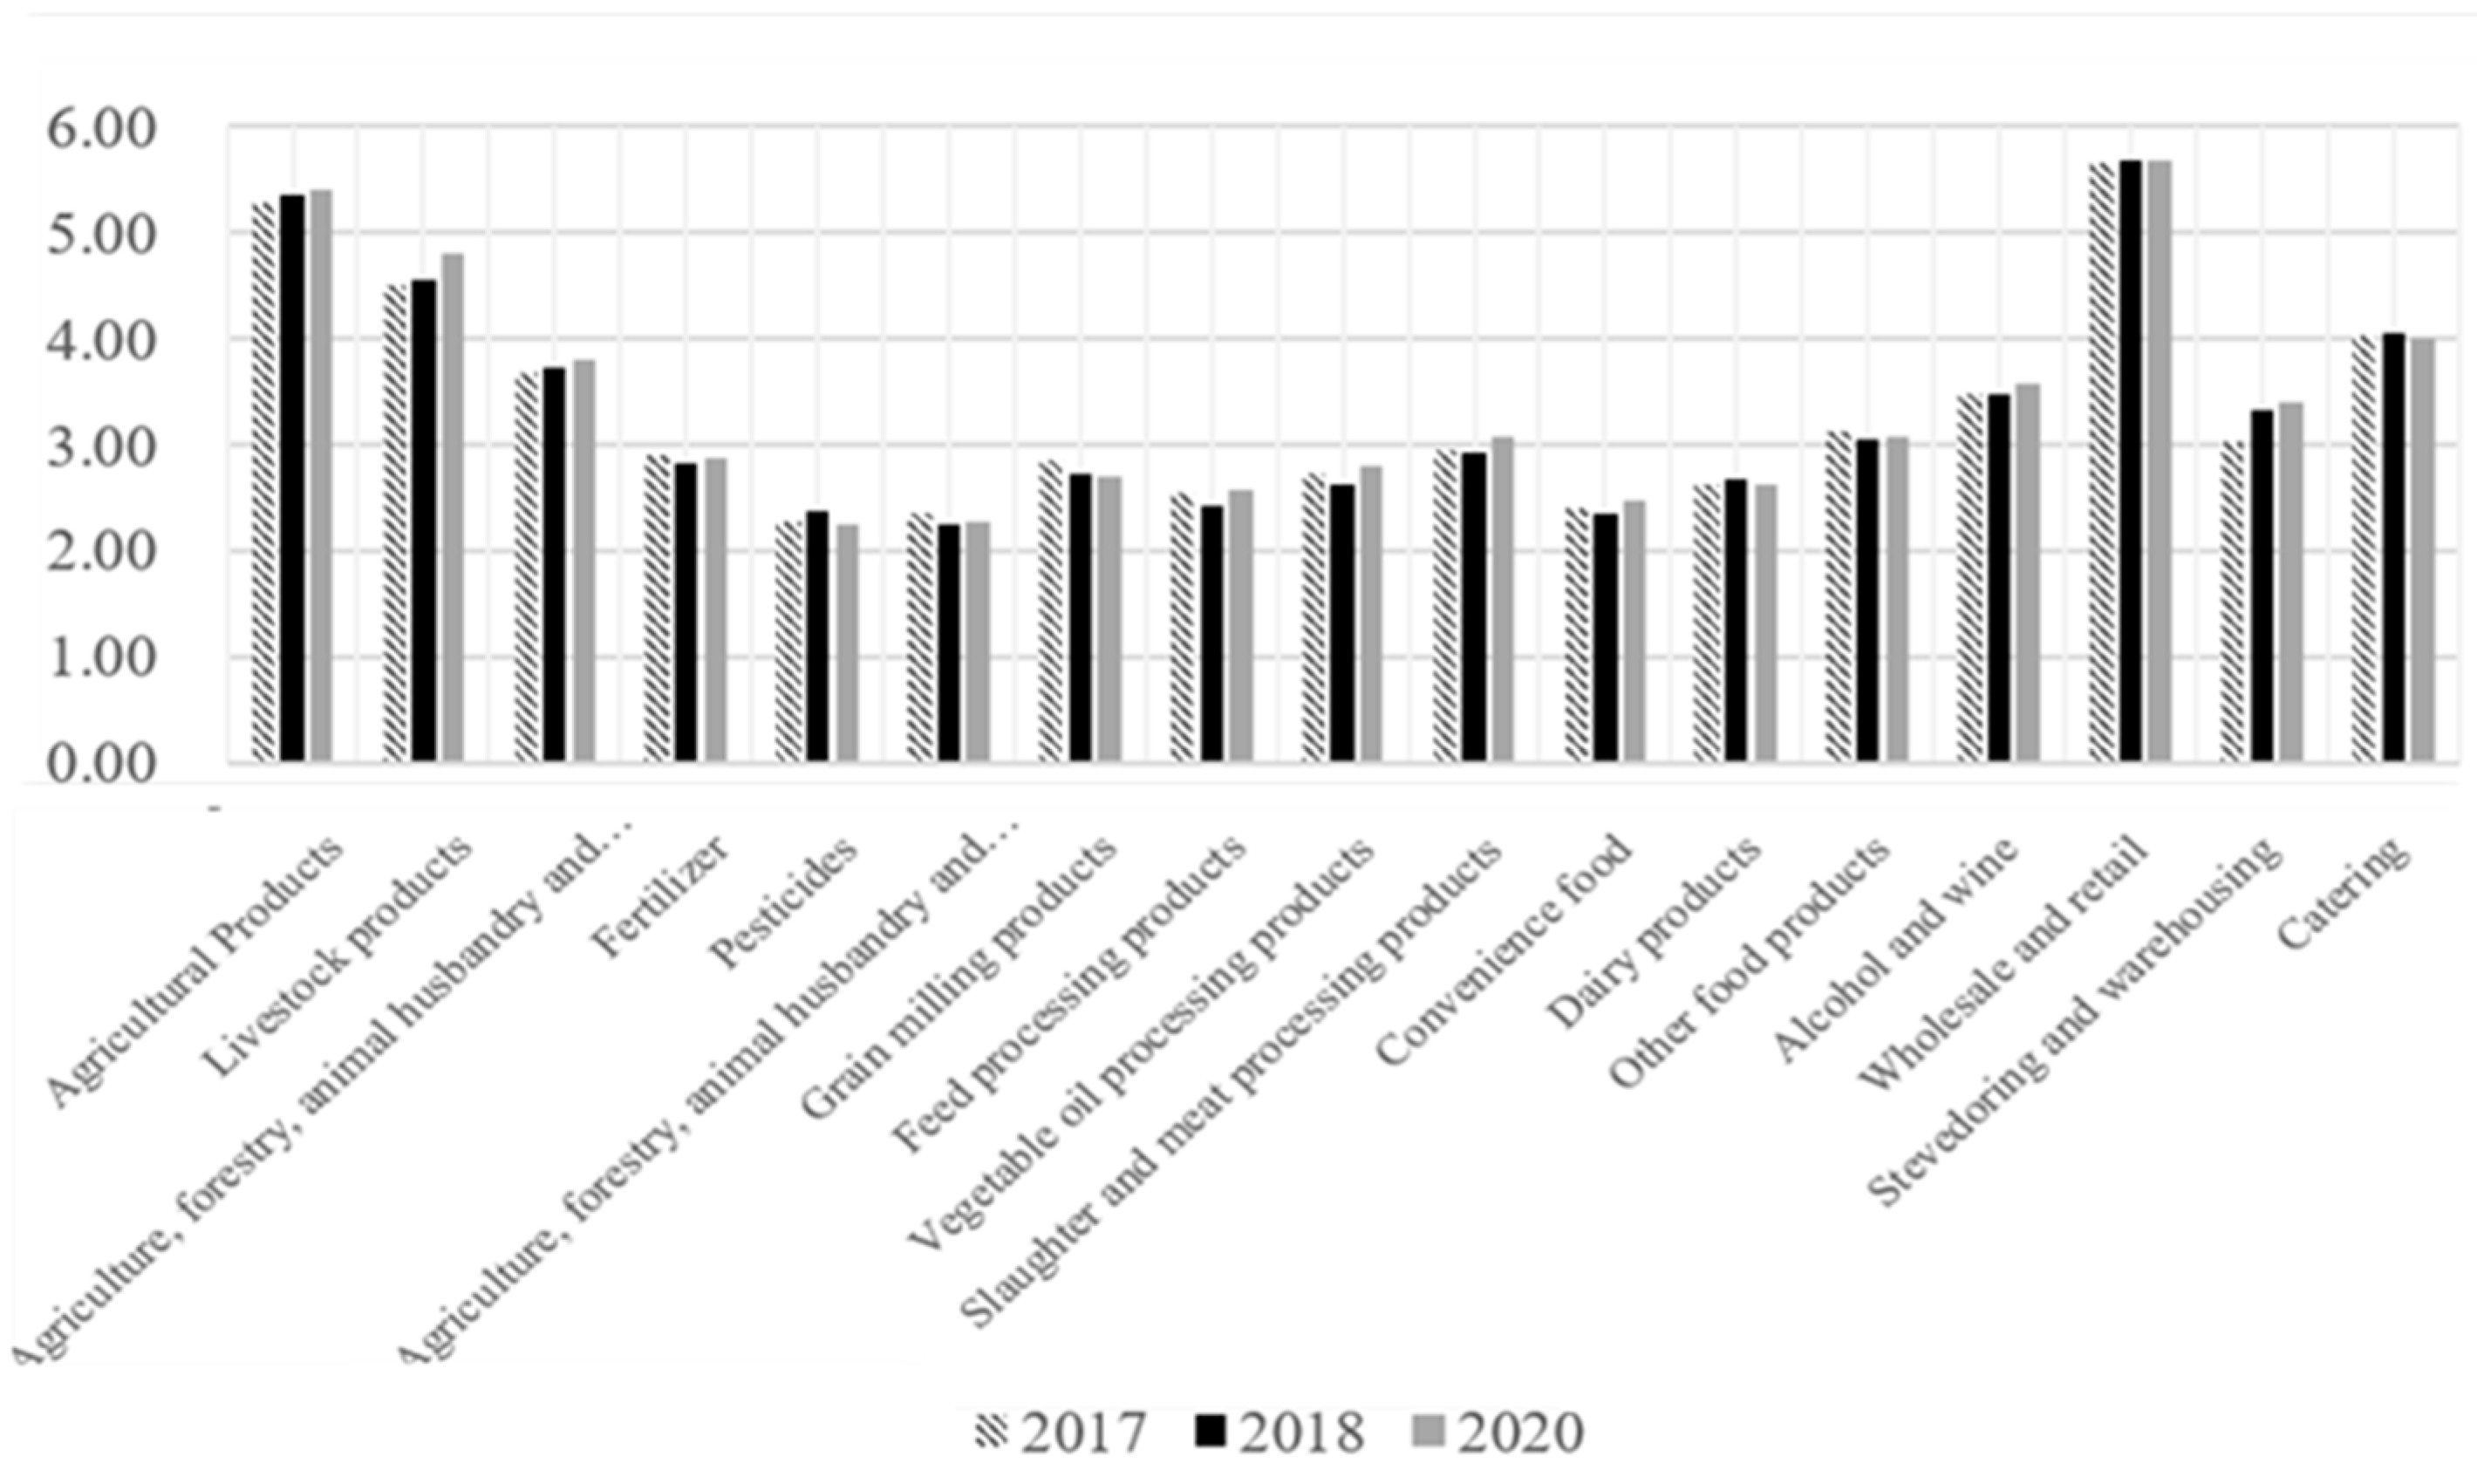
Considering that the COVID-19 pandemic occurred at the end of 2019, this paper specifically calculates the TFP of food industry chain sub-industries in 2017, 2018 and 2020, in order to show the changes of total factor productivity of food industry chain sub-industries before and after COVID-19, as shown in Figure 2.
The food industry chain revolves around the food production sector and the TFP of the agricultural products was on the growing trend until 2018. It decreases and tends to level off in 2020. The livestock products sector on the contrary grows against the trend after the pandemic for two possible reasons: first, the pandemic has a short-term impact on the hog industry, and the subsequent restoration of the supply chain of production factors and consumer demand stimulation instead to promote the growth of TFP in the hog industry. Second, China’s cattle and sheep industry imports are large, exports are small, and the impact of the pandemic is relatively small. In the upstream of the food industry chain, the input sector of food production equipment, fertilizer, agriculture, forestry, animal husbandry and fishery service products, agriculture, forestry, animal husbandry and fishery special machinery sector as a whole is relatively stable. The TFP of pesticide sector increased significantly before the pandemic and decreased significantly after the pandemic. The TFP of food milling products, dairy products and other food sectors in the food processing sector changed less while the TFP of feed processing products, vegetable oil processing products, slaughtering and meat processing products. The TFP of the food processing sector, food milling products, dairy products and other foodstuffs sector showed less changes, while the TFP of feed processing products, vegetable oil processing products, slaughtering and meat processing products, convenience foods, and alcohol and wine sector showed an increasing trend. The TFP of the handling and storage sector in the distribution sector of food products was more influenced by the new pneumonia pandemic; TFP in the restaurant sector showed a downward trend after the outbreak of the COVID-19 pandemic.
4.2. Factor Misallocation in the Food Industry Chain by Sector
Based on the factor output elasticity measured in the previous section, the relative distortion coefficients of each factor in 2017, 2018 and 2020 are calculated according to Equations (3)–(5) and their extensions, and the results are shown in Table 3. the closer the degree of distortion is to 1, the more reasonable the factor allocation is, greater than 1 indicates excessive factor allocation, and less than 1 indicates insufficient factor allocation.
From the perspective of capital factor allocation, capital input in the food production sector was insufficient and the distortion increased before and after the pandemic. Among the food production equipment input sectors, pesticides and special machinery for agriculture, forestry, animal husbandry and fishery were relatively over-invested, while the agriculture, forestry, animal husbandry and fishery service products and fertilizer sectors were relatively under-invested in capital factors in contrast. The overall degree of capital misallocation in the food production equipment input sector does not change much before and after the pandemic. Capital misallocation in the food processing and manufacturing sector first improves then intensifies, and the overall allocation is insufficient. Among the food products distribution sector, the catering sector is more affected, and the relative distortion coefficient of capital elements changes from 0.63 in 2018 to 0.71 in 2020, and the degree of capital misallocation weakens. The restaurant sector recovers relatively quickly after the pandemic.
From the perspective of labor factor allocation, the agricultural products sector in the food production sector has excessive labor factor allocation, and the distortion weakens, while on the contrary, the livestock products sector has insufficient labor factor input, and the pandemic further aggravates the distortion in the livestock products sector. The food production equipment input sectors are all under-allocated labor factors, but the distortion changes are not significant before and after the pandemic. In the food processing sector, the labor is under-allocated in the vegetable oil processing products and slaughter and meat processing products, while the rest of the sectors, such as food milling products and feed processing products, are over-allocated, and the distortions are aggravated.
From the perspective of the allocation of intermediate input factors, the allocation of intermediate input factors in the food production sector is insufficient in the agricultural products sector, while the allocation of intermediate input factors in the livestock products sector is excessive, and the distortions in the food production sector before and after the pandemic are not significant. The distribution sector has an over-allocation of intermediate input factors.
5. Analysis Based on the CGE Model
5.1. Exogenous Shock Setting of the COVID-19 Pandemic
Existing work on assessing the economic impact of the COVID-19 pandemic has focused on aggregate economic indicators such as GDP, consumption, and investment, with little in-depth analysis of industry structure. It has been argued that the imbalance between supply and demand in the food industry chain under the impact of pandemic is mainly caused by the government’s strict restrictions on the movement of vehicles and people, which forced the interruption of agricultural trade and logistics, making it difficult to realize production supply and consumer demand. The implementation of measures such as home segregation and restricting non-essential travel directly affects agricultural labor supply, supply and marketing of agricultural production equipment, as well as agricultural product sales and farmers’ income, indirectly affecting agricultural production and agricultural product supply and creating new potential food security risks (Jiang, et al. 2020) [39]. Through literature studies, scholars generally agree that the COVID-19 pandemic may impact agricultural production from both the supply side and the demand side (Cheng, et al., 2020; Duan, et al., 2021) [40,41]. Specifically, the pandemic generates shocks to the relevant variables and parameters in the CGE model through four channels from the supply-side perspective, such as reducing effective labor supply and impeding agricultural production equipment and transportation of agricultural products, and from the demand-side perspective, such as low residential consumption propensity and a decline in domestic investment demand, and transmits them within the economic system through quantitative equations among various modules, subjects, and industries in the model.
- (i).
- Reduction of effective labor supply
A number of studies have shown that under the COVID-19 pandemic, the agricultural sector in many countries experienced labor shortages due to embargo policies and restrictions on the movement of people. Similarly, the most direct impact of the pandemic on the Chinese food industry chain was labor shortages, putting the labor market across the food industry chain under unprecedented pressure. According to the National Bureau of Statistics, the cumulative working hours of employed people in China under the pandemic shock in 2020 is 2368.11 h, a decrease of 1.5% from 2019.
- (ii).
- Obstruction of transportation of agricultural production equipment and agricultural products
Under normal circumstances, various links in the food industry chain are connected through human, logistics, capital and information flow. However, the sudden outbreak of the COVID-19 pandemic has caused the transmission pathway to be blocked, and economic collaboration across regions and sectors has suffered a serious impact, ultimately leading to a decline in the production capacity of the whole society. Data from the National Bureau of Statistics show that China’s cargo turnover declined by 1.0% year-on-year in 2020. This paper measures the external shocks suffered during the transmission process of the industrial chain by the change in freight volume.
- (iii).
- Decline in propensity to consume
The pandemic can affect the propensity to consume in several ways. On the one hand, the production and operation of enterprises affected by the pandemic become increasingly difficult, and residents’ expectations of future income deteriorate, leading to an increase in precautionary savings and a decrease in the proportion of funds spent on consumption. On the other hand, constrained by the pandemic control measures, contact and aggregate consumption such as catering and accommodation, leisure and entertainment have not yet returned to the pre-pandemic level, making it difficult to effectively meet a large amount of consumer demand. Data from the National Bureau of Statistics show that the average propensity to consume of China’s residents at the end of 2020 is only 65.9%, which is a 4.2% decrease from 2019.
- (iv).
- Decline in the growth rate of domestic investment
Affected by the COVID-19 pandemic, the whole society fixed asset investment fell precipitously at the beginning of 2020, and the investment growth rate gradually rebounded after the period under the strong support of industrial investment. However, the overall impact of the pandemic, the growth rate of the whole society fixed asset investment in 2020 is the lowest level in the past six years, according to the data reality of the National Bureau of Statistics, the growth rate of China’s whole society fixed asset investment at the end of 2020 is 2.7%, a decline of 2.4% compared to 2019.
CGE shock variable assignment is a controversial focus of the model application, and this paper tries to assign values with NBS data or literature data, and the assignment results are shown in Table 5.
To ensure the validity of the research results, this paper further examines the robustness of the simulation results by conducting a sensitivity analysis of the key elasticity coefficients, i.e., increasing and decreasing each alternative elasticity coefficient by 20% and 20%, respectively. The results of the sensitivity test in this paper conclude that the changes in the relevant parameters have a relatively small impact on the changes in macroeconomic indicators. It can be seen that the changes in the CGE model results by the setting of the relevant exogenous parameters are within an acceptable range, indicating that the model is robust.
5.2. Impacts of the COVID-19 Pandemic on Employment in China’s Food Industry Chain
This paper conducts direct shock analysis for 42 industry sectors, reporting on the situation in 17 industry sectors along the food industry chain (see Table 6). The change in employment in the agricultural and livestock products sectors of the primary industry is relatively small. Among the selected sectors of the secondary industry, the overall impact of the pandemic was larger, mostly higher than the mean value of the shock, but relatively more even within the industry. Among the selected sectors of the tertiary industry, the decline in restaurant employment was larger and employment was more severely affected by the COVID-19 pandemic.
Employment in the primary sector was relatively less affected. Employment in the secondary and tertiary sectors was more severely affected by the pandemic, with the most severe employment losses occurring in the restaurant sector of the tertiary industry. Overall, the pandemic period led to a decline in labor market dynamics nationwide, but the agricultural sector showed a strong employment buffer. And the results of empirical studies based on Asian countries show that the rural labor force shifts from the nonfarm sector to the agricultural sector when facing exogenous shocks. According to China Statistical Yearbook data, 7.43% of the non-farm employed rural labor force returned to the agricultural sector after the COVID-19 pandemic, and the return of rural non-farm employed labor force instead mitigated the degree of labor misallocation in the food sector.
5.3. Resource Allocation Impact of External Shocks of the COVID-19 Pandemic on the Food Industry Chain
In the short run, capital is assumed to be exogenous, there is no change in capital formation under the shock of the pandemic, and there is no capital inflow or outflow in the short run. Table 7, Table 8 and Table 9 report the macro effects of the external shock of the COVID-19 pandemic on the output of the food industry chain and the effects of intermediate input factors and labor factors, respectively. Substituting into the total factor productivity formula, the changes in total factor productivity of the food industry chain after the external shock of the pandemic can be calculated, as shown in Table 10.
As can be seen from Table 10, the pandemic led to a significant decline in total factor productivity in China’s food production sector, with the greatest change in the impact of the decline in residential consumption on the demand side. Combined with the previous analysis, the short-term shock will mainly have a more obvious impact on the allocation of labor factors and the allocation of intermediate input factors in the food industry chain, and the decline of TFP in the food industry chain will further stimulate the misallocation of resource factors.
6. Conclusions and Suggestions
6.1. Conclusions
This paper integrates the input-output model and the computable general equilibrium (CGE) model, further incorporates the most important input factor in agriculture—intermediate inputs—in the model and quantifies the resource allocation caused by the COVID-19 pandemic on the three major input factors in China’s food production—capital, labor, and intermediate inputs Losses. At the same time, impact simulations were conducted on the demand and supply sides to analyze the impact of the COVID-19 pandemic on China’s food production. The results of this paper are as follows:
First, compared to the pre-pandemic baseline level, the pandemic led to a decrease in the overall TFP growth of the food industry chain in China, with the most significant decrease in the TFP growth rate of the food distribution sector. The food industry chain revolves around the food production sector, and the TFP of the agricultural products sector, which is at the core, is on a growth trend until 2018, and then rises at a lower rate and tends to level off in 2020. Upstream of the food industry chain, the input sector of food production materials, the pesticide sector had a significant increase in TFP before the pandemic and a larger decrease after the pandemic. The food processing sector has a smaller change in TFP in the food milling products, dairy products and other food products sectors while the feed processing products, vegetable oil processing products, slaughtering and meat processing products, convenience foods, and alcohol and wine sectors are on an upward trend. The COVID-19 pandemic has a significant impact on the distribution of food products. The TFP of the handling and storage sector in the food product distribution sector was more influenced by the pandemic and the TFP of this sector increased significantly before the pandemic and leveled off after the pandemic. The TFP of the catering sector showed a decreasing trend after the pandemic.
Second, through the calculation of the relative distortion coefficients of capital, labor, and intermediate input factors in the food industry chain, it can be seen that there are obvious distortions in the factor allocation of capital, labor, and intermediate inputs, and through the counterfactual analysis method, if the distortions can be reduced, the overall output of the food industry chain can be improved by about 30%. From the perspective of capital factor allocation, the capital input in the food production sector is insufficient and the distortion is aggravated before and after the pandemic. The capital misallocation in the food processing sector is weakened and then deepened, and the overall allocation is insufficient. Among the food product distribution sector, the restaurant sector has weakened the capital misallocation and recovered relatively quickly in a short period of time. From the perspective of labor factor allocation, the agricultural product sector in the food production sector. From the perspective of labor factor allocation, the distortion of labor factor in the agricultural products sector of the food production sector was weakened. All food production materials input sectors were under-allocated to labor factor, but the distortion changes were not significant before and after the pandemic. In the food processing sector, vegetable oil processed products and slaughter and meat processed products were under-allocated to labor. The distortion of labor factor allocation in the food distribution sector was serious, but the degree of distortion was less affected by the pandemic. From the perspective of intermediate input factor allocation. From the perspective of the allocation of intermediate input factors, the food production sector is under-allocated in the agricultural products sector while the livestock products sector is over-allocated in the intermediate input factors. The food production materials input sectors are over-allocated in the intermediate input factors. The food processing sector is under-allocated in the intermediate input factors the degree of distortion is reduced after the pandemic and the food distribution sector is over-allocated in the intermediate input factors.
Third, in the short term, the COVID-19 pandemic period leads to a decline in the dynamics of the national labor market, but the agricultural sector shows a strong employment buffer, and the return of rural non-farm employed labor instead mitigates the degree of labor misallocation in the food sector. In addition, employment in the secondary and tertiary sectors is more severely affected by the pandemic, and the most severe employment loss is in the restaurant sector of the tertiary sector.
Fourth, compared to the supply side, the demand side caused a greater impact on China’s food production, with residential consumption demand having a particularly strong impact on the allocation of resources for food production. The COVID-19 pandemic led to a significant decline in TFP in China’s food production sector, and the short-term shock will mainly have a more pronounced impact on the allocation of labor factors and the allocation of intermediate input factors in the food industry chain, and the decline in TFP in the food industry chain will further stimulate the misallocation of resource factors.
6.2. Suggestions
Based on the above findings, we propose the following policy recommendations to ensure China’s food security and adapt to the short-term features of the era when the COVID-19 pandemic is rampant.
First, rational allocation of resource factors for food production. As for the input of resource factors, they should be evaluated according to the characteristics of the industrial sector, market demand, and the level of agricultural development to develop the best input strategy and to ensure that the resource factors can be fully utilized and reduce resource misallocation. In addition, attention must be paid to the improvement of TFP and the effective use of resources in the food industry chain to ensure that food production can grow sustainably.
Second, the construction of the whole chain of the whole food industry chain is solid. Specifically, it is necessary to grasp the existing environmental conditions, the development direction of key industries, the level of economic development and other objective factors as a whole, and develop a set of perfect policy measures, which can be taken as follows: first, to establish and improve the management system of the whole chain of the food supply chain, and implement the cooperation and dynamic management of farmers, enterprises and the government. Second, to improve the input, production, processing, and circulation of food production materials food The supply chain links are interlocked and united.
Third, the stability of the food market system security. First, we should establish and implement an effective disaster relief system, strengthen the disaster warning system, early detection, early reporting, and early measures to effectively prevent the spread of disasters to food production; second, we should improve the level of food reserves, especially general reserves, to better respond to unexpected situations. In addition, it is necessary to strengthen the capacity of food production and distribution across the country to improve food supply capacity. Strengthen the construction of rural infrastructure to improve food production TFP.
Fourth, transfer to enhance social expectations. To enhance social expectations after the pandemic, it is necessary to improve people’s livelihood at the core, stimulate residents’ consumption demand, and reasonably guide their consumption tendencies and preferences. At the same time, increase basic investment, unite residents, enterprises, and the government to form stable social expectations, provide more possibilities for the development of the food industry chain, and further ensure China’s food security.
7. Discussion
Compared with previous studies, this study has important methodological significance, because it combines the input-output model with the CGE model, and makes some optimization adjustments on the basis of the previous models. In this study, the most important input factor in agriculture, namely the intermediate input factor, is included in the model. At the same time, from the perspective of supply and demand, the pandemic impact is simulated through the CGE model, and the resource allocation of the food industry chain before and after the COVID-19 pandemic is quantitatively analyzed.
The work in this paper is still preliminary, and two efforts are still necessary in future research work: First, this paper mainly examines the short-term impact of the COVID-19 pandemic on China’s food chain, and the dynamic extension of the CGE model will be considered in future studies to effectively integrate the long- and short-term analysis using the Dynamic Stochastic General Equilibrium (DSGE) model. Second, given the availability of data, this study does not further delineate the types of capital and labor in the CGE model in more detail. In fact, different types of capital and labor may have different impacts on resource misallocation, but given the limitations of data such as China’s input-output tables, further segmentation is difficult. In future research, this is a research direction that can try to break through.
Author Contributions
Conceptualization, J.F.; Methodology, Y.S.; Software, Y.S.; Formal analysis, J.F.; Investigation, Y.S. and W.J.; Resources, J.F.; Data curation, Y.S. and W.J.; Writing—original draft, Y.S.; Writing—review & editing, J.F. and W.J.; Project administration, J.F.; Funding acquisition, J.F. All authors have read and agreed to the published version of the manuscript.
Funding
Supported by grant number 21&ZD081 and financed by the major project of National Social Science Foundation of China titled “Research on the Path of Effective Prevention of Stagflation Risk in China’s Economy during the 14th Five-Year Plan Period”.
Institutional Review Board Statement
Not applicable.
Informed Consent Statement
Not applicable.
Data Availability Statement
Not applicable.
Conflicts of Interest
The authors declare no conflict of interest.
Appendix A

Table A1.
China Macro SAM (2020) (Unit: in hundreds of billions, Yuan).
| Commodities | Activities | Labor | Capital | Households | Enterprises | Government Subsidies | Extra-Budgetary Institutional | Government | The rest of the world | Savings/Investments | Stock Change | Commodities | |
|---|---|---|---|---|---|---|---|---|---|---|---|---|---|
| Commodities | 1682.61 | 384.01 | 148.01 | 173.63 | 179.28 | 407.71 | −99.02 | 2876.22 | |||||
| Activities | 2699.03 | 2699.03 | |||||||||||
| Labor | 529.57 | 529.57 | |||||||||||
| Capital | 397.28 | 397.28 | |||||||||||
| Households | 529.57 | 44.43 | 21.26 | 0.31 | 4.98 | 1.55 | 602.10 | ||||||
| Enterprises | 351.33 | 351.33 | |||||||||||
| Government Subsidies | −16.33 | 16.63 | 0.31 | ||||||||||
| Extra-Budgetary Institutional | 46.17 | 46.17 | |||||||||||
| Government | 17.10 | 59.74 | 11.57 | 42.92 | 20.30 | 149.61 | 301.23 | ||||||
| The rest of the world | 160.09 | 1.51 | 10.26 | 171.87 | |||||||||
| Savings/Investments | 206.52 | 287.15 | −101.85 | 95.73 | −29.26 | 458.30 | |||||||
| Stock Change | −99.02 | −99.02 | |||||||||||
| Total | 2876.22 | 2699.03 | 529.57 | 397.28 | 602.10 | 351.33 | 0.31 | 46.17 | 301.23 | 171.87 | 458.30 | −99.02 |
Table A2.
Values of Armington elasticity and CET elasticity of the model.
| Code | 1 | 2 | 3 | 4 | 5 | 6 | 7 |
|---|---|---|---|---|---|---|---|
| Industry | Agricultural products | Forestry products | Livestock products | Fishery products | Agriculture, forestry, animal husbandry and fishery service products | Extraction industry | Food milling products |
| Armington | 3 | 2.5 | 1.5 | 1.3 | 1.9 | 3.7 | 3.8 |
| CET | 3.6 | 3.6 | 3.6 | 3.6 | 2.8 | 4.6 | 4.6 |
| Code | 8 | 9 | 10 | 11 | 12 | 13 | 14 |
| Industry | Processed feed products | Processed vegetable oil products | Slaughtered and processed meat products | Vegetables, fruits, nuts and other processed agri-food products | Convenience foods | Dairy products | Other food products |
| Armington | 3.8 | 3.8 | 3.8 | 3.8 | 3.8 | 3.8 | 3.8 |
| CET | 4.6 | 4.6 | 4.6 | 4.6 | 4.6 | 4.6 | 4.6 |
| Code | 15 | 16 | 17 | 18 | 19 | 20 | 21 |
| Industry | Alcohol and wine | Other light manufacturing | Petroleum, coking products and processed nuclear fuel products | Fertilizer | Pesticides | Other chemical products | Non-metallic mineral products |
| Armington | 3.8 | 3.8 | 3.8 | 3.8 | 3.8 | 3.8 | 3.8 |
| CET | 4.6 | 4.6 | 4.6 | 4.6 | 4.6 | 4.6 | 4.6 |
| Code | 22 | 23 | 24 | 25 | 26 | 27 | 28 |
| Industry | Metal smelting and rolling processing | Agriculture, forestry, animal husbandry, fishery special machinery | Other machinery and other manufacturing industries | Electric fuel supply industry | Water production and supply | Construction | Wholesale and retail |
| Armington | 3.8 | 3.8 | 3.8 | 4.4 | 4.4 | 1.9 | 1.9 |
| CET | 4.6 | 4.6 | 4.6 | 4.6 | 4.6 | 3.8 | 2.8 |
| Code | 29 | 30 | 31 | 32 | 33 | 34 | 35 |
| Industry | Transportation | Loading, unloading and warehousing | Postal | Accommodation | Catering | Information transmission, software and information technology services | Finance |
| Armington | 1.9 | 1.9 | 1.9 | 1.9 | 1.9 | 1.9 | 1.9 |
| CET | 2.8 | 2.8 | 2.8 | 2.8 | 2.8 | 2.8 | 2.8 |
| Code | 36 | 37 | 38 | 39 | 40 | 41 | 42 |
| Industry | Real estate | Rental and business services | Scientific research and technical services | Residential services and water and environmental services | Education | Culture, sports and recreation | Health and social work, public administration, social security and social organizations |
| Armington | 1.9 | 1.9 | 1.9 | 1.9 | 1.9 | 1.9 | 1.9 |
| CET | 2.8 | 2.8 | 2.8 | 2.8 | 2.8 | 2.8 | 2.8 |
References
- Tamru, S.; Hirvonen, K.; Minten, B. Impacts of the COVID-19 crisis on vegetable value chains in Ethiopia. In COVID-19 and Global Food Security; International Food Policy Research Institute: Washington, DC, USA, 2020. [Google Scholar] [CrossRef]
- Zhang, J. Global food security under COVID-19: Impact path and coping strategy. World Agric. 2021, 1, 4–13. (In Chinese) [Google Scholar]
- Dong, B.; Ren, Y.; Li, Z. The impact of the COVID-19 pandemic on agricultural production: In the Case of Brazil. World Agric. 2021, 2, 62–73. (In Chinese) [Google Scholar]
- Barrett, C.B.; Reardon, T.; Swinnen, J.; Zilberman, D. Agri-food Value Chain Revolutions in Low- and Middle-Income Countries. J. Econ. Lit. 2022, 60, 1316–1377. [Google Scholar] [CrossRef]
- Zhen, H.; Li, G.; Zhou, X. Factor misallocation and the loss of agriculture output in China. J. Nanjing Agric. Univ. Soc. Sci. Ed. 2019, 5, 143–153. (In Chinese) [Google Scholar]
- Chari, A.; Liu, E.; Wang, S.-Y.; Wang, Y. Property Rights, Land Misallocation, and Agricultural Efficiency in China. Rev. Econ. Stud. 2020, 88, 1831–1862. [Google Scholar] [CrossRef]
- Adamopoulos, T.; Restuccia, D. Geography and Agricultural Productivity: Cross-Country Evidence from Micro Plot-Level Data. Rev. Econ. Stud. 2021, 89, 1629–1653. [Google Scholar] [CrossRef]
- Zhang, Y.; Diao, X.; Chen, K.; Robinson, S.; Fan, S. Impact of COVID-19 on China’s macroeconomy and agri-food system–an economy-wide multiplier model analysis. China Agric. Econ. Rev. 2020, 12, 387–407. [Google Scholar] [CrossRef]
- Tian, K.; Zhang, Z.; Zhu, L.; Yang, C.; He, J.; Li, S. Economic exposure to regional value chain disruption: Evidence from Wuhan’s lockdown in China. Reg. Stud. 2023, 57, 525–536. [Google Scholar] [CrossRef]
- Johansen, L. A Multi Sectoral Study of Economic Growth; North–Holland Publishing Company: Amsterdam, The Netherlands, 1960. [Google Scholar]
- Barrage, L. Optimal Dynamic Carbon Taxes in a Climate–Economy Model with Distortionary Fiscal Policy. Rev. Econ. Stud. 2020, 87, 1–39. [Google Scholar] [CrossRef]
- Shapiro, J.S. The Environmental Bias of Trade Policy. Q. J. Econ. 2021, 136, 831–886. [Google Scholar] [CrossRef]
- Lin, X.; Qi, L.; Pan, H.; Sharp, B. COVID-19 Pandemic, Technological Progress and Food Security Based on a Dynamic CGE Model. Sustainability 2022, 14, 1842. [Google Scholar] [CrossRef]
- Du, Q.; Pan, H.; Liang, S.; Liu, X. Can Green Credit Policies Accelerate the Realization of the Dual Carbon Goal in China? Examination Based on an Endogenous Financial CGE Model. Int. J. Environ. Res. Public Health 2023, 20, 4508. [Google Scholar] [CrossRef]
- Jones, C.I. The facts of economic growth. In Handbook of Macroeconomics; Elsevier: Amsterdam, The Netherlands, 2016; pp. 3–69. [Google Scholar]
- Acemoglu, D.; Azar, P.D. Endogenous Production Networks. Econometrica 2020, 88, 33–82. [Google Scholar] [CrossRef] [Green Version]
- David, J.M.; Venkateswaran, V. The Sources of Capital Misallocation. Am. Econ. Rev. 2019, 109, 2531–2567. [Google Scholar] [CrossRef] [Green Version]
- Dai, X.; Cheng, L. Aggregate productivity losses from factor misallocation across Chinese manufacturing firms. Econ. Syst. 2018, 43, 30–41. [Google Scholar] [CrossRef]
- Baqaee, R.D.; Farhi, E. Productivity and misallocation in general equilibrium. Q. J. Econ. 2020, 135, 105–163. [Google Scholar] [CrossRef] [Green Version]
- Hsieh, C.-T.; Klenow, P.J. Misallocation and Manufacturing TFP in China and India. Q. J. Econ. 2009, 124, 1403–1448. [Google Scholar] [CrossRef] [Green Version]
- Romer, D. Advanced Macroeconomics, 5th ed.; Ventus Publishing: Telluride, CO, USA, 2019. [Google Scholar]
- Mas-Colell, A.; Whinston, M.D.; Green, J.R. Microeconomic Theory; Oxford University Press: Oxford, UK, 1995. [Google Scholar]
- Shen, C.; Zhen, J. Review on the study of resource misallocation. Reform 2015, 4, 116–124. (In Chinese) [Google Scholar]
- Restuccia, D.; Rogerson, R. The Causes and Costs of Misallocation. J. Econ. Perspect. 2017, 31, 151–174. [Google Scholar] [CrossRef] [Green Version]
- Bau, N.; Matray, A. Misallocation and Capital Market Integration: Evidence from India. Econometrica 2023, 91, 67–106. [Google Scholar] [CrossRef]
- Liu, Z.; Wu, Z. Will intermediate product market distortion hinder the improvement of total factor productivity in energy industry—A theoretical and empirical research based on micro-enterprise data. China Ind. Econ. 2019, 8, 42–60. (In Chinese) [Google Scholar]
- Donovan, K. The equilibrium impact of agricultural risk on intermediate inputs and aggregate productivity. Rev. Econ. Stud. 2021, 88, 2275–2307. [Google Scholar] [CrossRef]
- Abolpour, B. Realistic evaluation of crop water productivity for sustainable farming of wheat in Kamin Region, Fars Province, Iran. Agric. Water Manag. 2018, 195, 94–103. [Google Scholar] [CrossRef]
- Christian, P.; Kondylis, F.; Mueller, V.; Zwager, A.; Siegfried, T. Monitoring Water for Conservation: A Proof of Concept from Mozambique. Am. J. Agric. Econ. 2021, 104, 92–110. [Google Scholar] [CrossRef]
- Sheng, Y.; Ding, J.; Huang, J. The Relationship between Farm Size and Productivity in Agriculture: Evidence from Maize Production in Northern China. Am. J. Agric. Econ. 2018, 101, 790–806. [Google Scholar] [CrossRef]
- Farrokhi, F.; Pellegrina, H.S. Trade, Technology, and Agricultural Productivity. J. Political Econ. 2023. [Google Scholar] [CrossRef]
- Amodio, F.; A Martinez-Carrasco, M. Input Allocation, Workforce Management and Productivity Spillovers: Evidence from Personnel Data. Rev. Econ. Stud. 2018, 85, 1937–1970. [Google Scholar] [CrossRef]
- Adamopoulos, T.; Brandt, L.; Leight, J.; Restuccia, D. Misallocation, Selection, and Productivity: A Quantitative Analysis With Panel Data From China. Econometrica 2022, 90, 1261–1282. [Google Scholar] [CrossRef]
- Hu, Y.; Chen, D. Decomposition of total factor productivity growth rate in China’s high–tech industries—A test for ‘the structural bonus hypotheses’. China Ind. Econ. 2019, 2, 136–154. [Google Scholar]
- Chen, Y.; Hu, W.; Chen, Y.; Hu, W. Distortions, Misallocation and Losses: Theory and Application. China Econ. Q. 2011, 10, 1401–1422. [Google Scholar]
- Li, X.; Ma, S.; Lv, Y. Research on fixed capital stock accounting of different industries in China. Stat. Decis. Mak. 2020, 22, 48–52. (In Chinese) [Google Scholar]
- Lofgren, H.; Harris, R.L.; Robinson, S. A Standard Computable General Equilibrium (CGE) Model in GAMS; International Food Policy Research Institute: Washington, DC, USA, 2002. [Google Scholar]
- Zhai, F.; Herter, T. Impacts of the Doha Development Agenda on China: The Role of Labor Markets and Complementary Education Reforms; World Bank: Washington, DC, USA, 2005. [Google Scholar]
- Jiang, H.; Yang, D.; Guo, C. Impact of the COVID-19 pandemic on agricultural development in China and its countermeasures. Reform 2020, 3, 5–13. (In Chinese) [Google Scholar]
- Cheng, G.; Zhu, M. COVID-19 Pandemic is affecting food security: Trends, impacts and recommendations. China Rural. Economy. 2020, 5, 13–20. (In Chinese) [Google Scholar]
- Duan, H.; Bao, Q.; Tian, K.; Wang, S.; Yang, C.; Cai, Z. The hit of the novel coronavirus outbreak to China’s economy. China Econ. Rev. 2021, 67, 101606. [Google Scholar] [CrossRef]
Figure 1.
Technology Roadmap.

Figure 2.
Changes in TFP by sector in the food industry chain in 2017, 2018 and 2020.

Table 1.
Sectoral division of the food industry chain.
| Food Industry Chain | Food Industry Sector |
|---|---|
| Food production material inputs | (05005) agriculture, forestry, animal husbandry, and fishery service products; (26044) fertilizers; (26045) pesticides; (35075) special equipment for agriculture, forestry, animal husbandry, and fishery |
| Food production | (01001) Agricultural products; (03003) Livestock products |
| Food processing | (13012) food milling products; (13013) processed feed products; (13014) processed vegetable oil products; (13016) slaughtered and processed meat products; 14,019 convenience foods; (14020) dairy products; (14022) other food products; (15023) alcohol and wine |
| Food Distribution | (59117) handling and storage; (51105) wholesale; (51106) retail; (62120) food and beverage |
Table 2.
Estimation results of the CES production function share parameters by sector.
| Sector | Agriculture | Extractive | Industries | Manufacturing | Electrical and Water Supply | Services |
|---|---|---|---|---|---|---|
| Estimated value | 0.31 | 0.66 | 0.75 | 0.68 | 0.62 | 0.12 |
Table 3.
Relative distortion coefficients for each element of the food industry chain.
| Relative Capital Distortion Factor | Relative Distortion Factor of Labor | Relative Distortion Factor for Intermediate Inputs | |||||||
|---|---|---|---|---|---|---|---|---|---|
| 2017 | 2018 | 2020 | 2017 | 2018 | 2020 | 2017 | 2018 | 2020 | |
| Agricultural Products | 0.73 | 0.72 | 0.61 | 3.61 | 3.67 | 3.60 | 0.55 | 0.53 | 0.55 |
| Livestock products | 0.93 | 0.87 | 0.86 | 0.35 | 0.31 | 0.27 | 1.31 | 1.34 | 1.36 |
| Agriculture, forestry, animal husbandry and fishery service products | 0.49 | 0.45 | 0.48 | 0.41 | 0.35 | 0.33 | 1.33 | 1.36 | 1.37 |
| Fertilizer | 0.65 | 0.63 | 0.71 | 0.28 | 0.25 | 0.25 | 1.30 | 1.31 | 1.29 |
| Pesticides | 4.22 | 4.68 | 4.41 | 0.59 | 0.51 | 0.51 | 1.19 | 1.23 | 1.22 |
| Agriculture, forestry, animal husbandry and fishery special machinery | 5.00 | 5.00 | 5.33 | 0.35 | 0.37 | 0.39 | 1.27 | 1.24 | 1.29 |
| Food milling products | 0.51 | 0.50 | 0.67 | 1.61 | 1.58 | 1.43 | 0.53 | 0.55 | 0.70 |
| Feed processing products | 0.31 | 4.72 | 0.19 | 1.47 | 1.44 | 1.34 | 0.74 | 0.74 | 0.80 |
| Vegetable oil processing products | 0.03 | 0.42 | 0.03 | 0.79 | 0.78 | 0.74 | 0.83 | 0.82 | 0.86 |
| Slaughter and meat processing products | 0.43 | 3.23 | 0.29 | 0.74 | 0.72 | 0.75 | 0.96 | 0.99 | 0.99 |
| Convenience food | 2.00 | 1.74 | 0.58 | 1.50 | 1.44 | 0.92 | 0.92 | 0.93 | 1.09 |
| Dairy products | 0.06 | 0.05 | 0.05 | 1.37 | 1.38 | 0.89 | 0.67 | 0.69 | 0.51 |
| Other food products | 0.32 | 0.31 | 0.30 | 1.32 | 1.29 | 1.23 | 0.94 | 0.96 | 1.00 |
| Alcohol and wine | 0.73 | 0.72 | 0.61 | 3.61 | 3.67 | 3.60 | 0.55 | 0.53 | 0.55 |
| Wholesale and retail | 0.93 | 0.87 | 0.86 | 0.35 | 0.31 | 0.27 | 1.31 | 1.34 | 1.36 |
| Stevedoring and warehousing | 0.49 | 0.45 | 0.48 | 0.41 | 0.35 | 0.33 | 1.33 | 1.36 | 1.37 |
| Catering | 0.65 | 0.63 | 0.71 | 0.28 | 0.25 | 0.25 | 1.30 | 1.31 | 1.29 |
Table 4.
Share of the impact of each factor in the food industry chain on the loss of output (Unit: %).
Table 4.
Share of the impact of each factor in the food industry chain on the loss of output (Unit: %).
| Capital | Labor | Intermediate Inputs | |
|---|---|---|---|
| Agricultural Products | 9.13 | 8.67 | 8.86 |
| Livestock products | 32.46 | 30.43 | 27.21 |
| Agriculture, forestry, animal husbandry and fishery service products | 46.42 | 46.37 | 46.41 |
| Fertilizer | 32.01 | 33.62 | 34.18 |
| Pesticides | 38.05 | 39.80 | 39.24 |
| Agriculture, forestry, animal husbandry and fishery special machinery | 31.84 | 32.25 | 29.46 |
| Food milling products | 38.70 | 38.07 | 37.06 |
| Feed processing products | 41.64 | 41.93 | 41.86 |
| Vegetable oil processing products | 38.72 | 37.44 | 37.91 |
| Slaughter and meat processing products | 40.36 | 40.86 | 40.49 |
| Convenience food | 37.33 | 36.65 | 35.09 |
| Dairy products | 36.58 | 38.19 | 36.89 |
| Other food products | 34.85 | 32.12 | 35.00 |
| Alcohol and wine | 38.45 | 38.19 | 37.67 |
| Wholesale and retail | 9.37 | 9.74 | 10.48 |
| Stevedoring and warehousing | 47.41 | 47.36 | 47.14 |
| Catering | 38.21 | 38.80 | 39.97 |
Table 5.
Shock variables for the pandemic shock simulation.
| Shock Variables | Variable Assignment |
|---|---|
| S1 (Labor Supply) | 1.5% reduction in labor supply under short-term work stoppage policy |
| S2 (Transportation productivity) | 1.0% loss of productivity in the transportation sector |
| S3 (Propensity to consume and consumption preference) S4 (Domestic Investment) | 4.2% decrease in average consumer propensity of the population Social fixed asset investment growth rate declined by 2.4% |
Table 6.
Impact of the COVID-19 pandemic Outbreak on Employment in the Food Industry Sector (Unit: %).
Table 6.
Impact of the COVID-19 pandemic Outbreak on Employment in the Food Industry Sector (Unit: %).
| Sector | Employment Impact | |
|---|---|---|
| Primary Industry | Agricultural Products | −4.2 |
| Livestock products | −6.4 | |
| Agriculture, forestry, animal husbandry and fishery service products | −8.6 | |
| Secondary Industry | Fertilizer | −13.5 |
| Pesticides | −12.8 | |
| Agriculture, forestry, animal husbandry and fishery special machinery | −7.8 | |
| Food milling products | −6.5 | |
| Feed processing products | −8.3 | |
| Vegetable oil processing products | −8.6 | |
| Slaughter and meat processing products | −7.5 | |
| Convenience food | −6.4 | |
| Dairy products | −7.2 | |
| Other food products | −8.6 | |
| Alcohol and wine | −6.5 | |
| Tertiary Industry | Wholesale and retail | −7.3 |
| Stevedoring and warehousing | −5.5 | |
| Catering | −23.1 | |
Table 7.
Macro impact of external shocks to the output of the food industry chain from the COVID-19 pandemic (Unit: in hundreds of billions, Yuan).
Table 7.
Macro impact of external shocks to the output of the food industry chain from the COVID-19 pandemic (Unit: in hundreds of billions, Yuan).
| Base Period Value | S1 | S2 | S3 | S4 | |
|---|---|---|---|---|---|
| Agricultural Products | 70.79 | 70.86 | 70.43 | 70.82 | 71.08 |
| Livestock products | 36.49 | 36.36 | 35.92 | 34.22 | 35.27 |
| Agriculture, forestry, animal husbandry and fishery service products | 7.03 | 7.00 | 6.96 | 6.73 | 6.87 |
| Fertilizer | 6.65 | 6.68 | 6.68 | 6.86 | 6.79 |
| Pesticides | 2.79 | 2.81 | 2.82 | 2.84 | 2.82 |
| Agriculture, forestry, animal husbandry and fishery special machinery | 2.38 | 2.39 | 2.43 | 2.25 | 2.31 |
| Food milling products | 10.77 | 10.70 | 10.39 | 9.51 | 10.06 |
| Feed processing products | 6.06 | 6.06 | 6.00 | 5.72 | 5.87 |
| Vegetable oil processing products | 4.96 | 4.99 | 4.95 | 4.91 | 4.92 |
| Slaughter and meat processing products | 8.34 | 8.33 | 8.12 | 7.85 | 8.06 |
| Convenience food | 13.28 | 13.22 | 12.94 | 11.96 | 12.55 |
| Dairy products | 11.05 | 11.13 | 11.02 | 10.98 | 11.00 |
| Other food products | 9.11 | 9.05 | 8.79 | 8.20 | 8.60 |
| Alcohol and wine | 1.23 | 1.23 | 1.22 | 1.14 | 1.18 |
| Wholesale and retail | 149.85 | 148.64 | 149.02 | 143.89 | 139.33 |
| Stevedoring and warehousing | 10.01 | 9.96 | 9.95 | 9.39 | 9.68 |
| Catering | 34.97 | 34.70 | 34.19 | 31.52 | 33.07 |
Table 8.
Impact of external shocks of the COVID-19 pandemic on intermediate inputs in the food industry sector (Unit: %).
Table 8.
Impact of external shocks of the COVID-19 pandemic on intermediate inputs in the food industry sector (Unit: %).
| Price of Intermediate Inputs (PINTA) | Amount of Intermediate Inputs | |||||||
|---|---|---|---|---|---|---|---|---|
| S1 | S2 | S3 | S4 | S1 | S2 | S3 | S4 | |
| Agricultural Products | −0.19 | −0.48 | −2.70 | −1.52 | −0.23 | −0.14 | −3.02 | −1.82 |
| Livestock products | −0.18 | −0.31 | −1.09 | −0.70 | −0.18 | −0.85 | −2.99 | −1.74 |
| Agriculture, forestry, animal husbandry and fishery service products | −0.12 | −0.36 | −1.95 | −1.08 | −0.12 | −0.12 | −0.42 | −0.28 |
| Fertilizer | −0.16 | −0.68 | −6.23 | −3.28 | −0.30 | −0.54 | −3.07 | −1.74 |
| Pesticides | −0.23 | −0.75 | −4.89 | −2.59 | −0.31 | −0.72 | −1.95 | −1.04 |
| Agriculture, forestry, animal husbandry and fishery special machinery | −0.24 | −0.89 | −4.64 | −2.44 | −0.33 | −1.44 | −1.15 | −0.69 |
| Food milling products | −0.14 | −0.21 | −1.18 | −0.83 | −0.17 | −1.08 | −3.36 | −1.95 |
| Feed processing products | −0.19 | −0.32 | −1.45 | −0.91 | −0.06 | −0.17 | −1.12 | −0.71 |
| Vegetable oil processing products | −0.25 | −0.45 | −1.95 | −1.19 | −0.26 | −0.17 | −0.78 | −0.29 |
| Slaughter and meat processing products | −0.14 | −0.17 | −0.41 | −0.30 | −0.05 | −0.89 | −1.21 | −0.78 |
| Convenience food | −0.21 | −0.45 | −2.00 | −1.13 | −0.17 | −1.12 | −4.21 | −2.40 |
| Dairy products | −0.24 | −0.54 | −2.20 | −1.21 | −0.50 | −0.24 | −1.46 | −0.66 |
| Other food products | −0.23 | −0.44 | −1.85 | −1.08 | −0.30 | −1.60 | −3.92 | −2.26 |
| Alcohol and wine | −0.15 | −0.34 | −1.25 | −0.75 | 0.00 | −0.18 | −1.27 | −0.78 |
| Wholesale and retail | −0.19 | −0.33 | −1.04 | −0.60 | −0.37 | −0.09 | −2.25 | −1.39 |
| Stevedoring and warehousing | −0.02 | −0.40 | −3.02 | −1.55 | −0.28 | −0.10 | −2.40 | −1.42 |
| Catering | −0.23 | −0.43 | −1.48 | −0.85 | −0.37 | −0.94 | −4.25 | −2.42 |
Table 9.
Impact of external shocks to factor income (YF) from the COVID-19 pandemic outbreak (Unit: in hundreds of billions, Yuan).
Table 9.
Impact of external shocks to factor income (YF) from the COVID-19 pandemic outbreak (Unit: in hundreds of billions, Yuan).
| Base Period Value | S1 | S2 | S3 | S4 | |
|---|---|---|---|---|---|
| Rural Labor | 27.79 | 27.64 | 27.76 | 26.62 | 25.68 |
| Skilled workers | 25.15 | 25.01 | 25.04 | 24.14 | 23.33 |
Table 10.
Changes in TFP of the food industry chain after the external shock of the COVID-19 pandemic.
Table 10.
Changes in TFP of the food industry chain after the external shock of the COVID-19 pandemic.
| Base Period Value | S1 | S2 | S3 | S4 | |
|---|---|---|---|---|---|
| Agricultural Products | 5.41 | 4.87 | 4.38 | 3.99 | 4.63 |
| Livestock products | 4.81 | 4.33 | 3.90 | 3.55 | 4.11 |
| Agriculture, forestry, animal husbandry and fishery service products | 3.80 | 3.23 | 2.91 | 2.68 | 3.00 |
| Fertilizer | 2.88 | 2.45 | 2.20 | 2.03 | 2.28 |
| Pesticides | 2.25 | 1.91 | 1.72 | 1.59 | 1.78 |
| Agriculture, forestry, animal husbandry and fishery special machinery | 2.28 | 1.94 | 1.74 | 1.61 | 1.80 |
| Food milling products | 2.71 | 2.30 | 2.07 | 1.91 | 2.14 |
| Feed processing products | 2.57 | 2.18 | 1.97 | 1.81 | 2.03 |
| Vegetable oil processing products | 2.8 | 2.38 | 2.14 | 1.98 | 2.21 |
| Slaughter and meat processing products | 3.07 | 2.61 | 2.35 | 2.17 | 2.43 |
| Convenience food | 2.46 | 2.10 | 1.89 | 1.74 | 1.95 |
| Dairy products | 2.62 | 2.23 | 2.00 | 1.85 | 2.07 |
| Other food products | 3.07 | 2.61 | 2.35 | 2.17 | 2.43 |
| Alcohol and wine | 3.57 | 3.03 | 2.73 | 2.52 | 2.82 |
| Wholesale and retail | 5.69 | 4.72 | 4.25 | 3.83 | 4.30 |
| Stevedoring and warehousing | 3.41 | 2.83 | 2.55 | 2.29 | 2.58 |
| Catering | 4.00 | 3.49 | 3.04 | 3.64 | 3.09 |
Disclaimer/Publisher’s Note: The statements, opinions and data contained in all publications are solely those of the individual author(s) and contributor(s) and not of MDPI and/or the editor(s). MDPI and/or the editor(s) disclaim responsibility for any injury to people or property resulting from any ideas, methods, instructions or products referred to in the content. |
© 2023 by the authors. Licensee MDPI, Basel, Switzerland. This article is an open access article distributed under the terms and conditions of the Creative Commons Attribution (CC BY) license (https://creativecommons.org/licenses/by/4.0/).
Share and Cite
MDPI and ACS Style
Sun, Y.; Fan, J.; Jia, W. Will the COVID-19 Pandemic Outbreak Intensify the Resource Misallocation in China’s Food Production? Sustainability 2023, 15, 5255. https://doi.org/10.3390/su15065255
AMA Style
Sun Y, Fan J, Jia W. Will the COVID-19 Pandemic Outbreak Intensify the Resource Misallocation in China’s Food Production? Sustainability. 2023; 15(6):5255. https://doi.org/10.3390/su15065255
Chicago/Turabian StyleSun, Ying, Jin Fan, and Weiguo Jia. 2023. "Will the COVID-19 Pandemic Outbreak Intensify the Resource Misallocation in China’s Food Production?" Sustainability 15, no. 6: 5255. https://doi.org/10.3390/su15065255
Note that from the first issue of 2016, this journal uses article numbers instead of page numbers. See further details here.