
Decrease in Mobility during the COVID-19 Pandemic and Its Association with Increase in Depression among Older Adults: A Longitudinal Remote Mobility Monitoring Using a Wearable Sensor

 , ,
, , 
Abstract
:1. Introduction
2. Materials and Methods
2.1. Study Population
2.2. Demographics and Clinical Data
2.3. Sensor-Derived Monitoring of Physical Activity and Sleep
2.4. Statistical Analysis
3. Results
3.1. Demographic and Clinical Characteristics
3.2. Physical Activity and Sleep Characteristics
3.3. Association between Change in Depression and Sensor-Derived Parameters
4. Discussion
5. Conclusions
Author Contributions
Funding
Institutional Review Board Statement
Informed Consent Statement
Data Availability Statement
Acknowledgments
Conflicts of Interest
References
- Berg-Weger, M.; Morley, J.E. Loneliness and Social Isolation in Older Adults during the COVID-19 Pandemic: Implications for Gerontological Social Work. J. Nutr. Health Aging 2020, 456–458. [Google Scholar] [CrossRef] [PubMed] [Green Version]
- Holt-Lunstad, J.; Smith, T.B. Loneliness and social isolation as risk factors for CVD: Implications for evidence-based patient care and scientific inquiry. Heart 2016, 987–989. [Google Scholar] [CrossRef] [PubMed] [Green Version]
- Holt-Lunstad, J.; Smith, T.B.; Baker, M.; Harris, T.; Stephenson, D. Loneliness and Social Isolation as Risk Factors for Mortality. Perspect. Psychol. Sci. 2015, 10, 227–237. [Google Scholar] [CrossRef] [Green Version]
- Tomioka, K.; Kurumatani, N.; Hosoi, H. Association Between Social Participation and 3-Year Change in Instrumental Activities of Daily Living in Community-Dwelling Elderly Adults. J. Am. Geriatr. Soc. 2017, 65, 107–113. [Google Scholar] [CrossRef] [PubMed]
- Sepúlveda-Loyola, W.; Rodríguez-Sánchez, I.; Pérez-Rodríguez, P.; Ganz, F.; Torralba, R.; Oliveira, D.V.; Rodríguez-Mañas, L. Impact of social isolation due to COVID-19 on health in older people: Mental and physical effects and recommendations. J. Nutr. Health Aging 2020, 1–10. [Google Scholar] [CrossRef]
- Antunes, R.; Frontini, R. Physical activity and mental health in Covid-19 times: An editorial. Sleep Med. 2021, 77, 295–296. [Google Scholar] [CrossRef]
- Morin, C.M.; Carrier, J. The acute effects of the COVID-19 pandemic on insomnia and psychological symptoms. Sleep Med. 2021. [Google Scholar] [CrossRef]
- Wang, C.; Patriquin, M.; Vaziri, A.; Najafi, B. Mobility Performance in Community-Dwelling Older Adults: Potential Digital Biomarkers of Concern about Falling. Gerontology 2021, 1–9. [Google Scholar] [CrossRef]
- Report: Pandemic Has Created Loneliness Epidemic, New Report Shows. 2021. Available online: https://www.aarp.org/home-family/friends-family/info-2020/isolation-survey-coronavirus/ (accessed on 8 October 2020).
- The Impact of Coronavirus on Global Activity—Fitbit Blog (23 March 2020). Available online: https://blog.fitbit.com/covid-19-global-activity/ (accessed on 21 January 2021).
- Browne, R.A.; Macêdo, G.A.; Cabral, L.L.; Oliveira, G.T.; Vivas, A.; Fontes, E.B.; Elsangedy, H.M.; Costa, E.C. Initial impact of the COVID-19 pandemic on physical activity and sedentary behavior in hypertensive older adults: An accelerometer-based analysis. Exp. Gerontol. 2020, 142, 111121. [Google Scholar] [CrossRef]
- Panchal, N.; Kamal, R.; Cox, C.; Garfield, R. The Implications of COVID-19 for Mental Health and Substance Use. Kaiser Family Foundation (2020). Available online: https://www.kff.org/coronavirus-covid-19/issue-brief/the-implications-of-covid-19-for-mental-health-and-substance-use/ (accessed on 20 April 2021).
- Taquet, M.; Luciano, S.; Geddes, J.R.; Harrison, P.J. Bidirectional associations between COVID-19 and psychiatric disorder: Retrospective cohort studies of 62 354 COVID-19 cases in the USA. Lancet Psychiatry 2021, 8, 130–140. [Google Scholar] [CrossRef]
- Seven Ways to Prevent Falls in Memory Care during COVID-19 Pandemic. 2020. Available online: https://www.safely-you.com/wp-content/uploads/2020/04/QuickTips-COVID19.Final_.pdf (accessed on 15 December 2020).
- Nasreddine, Z.S.; Phillips, N.A.; Bedirian, V.; Charbonneau, S.; Whitehead, V.; Collin, I.; Cummings, J.L.; Chertkow, H. The Montreal Cognitive Assessment, MoCA: A Brief Screening Tool For Mild Cognitive Impairment. J. Am. Geriatr. Soc. 2005, 53, 695–699. [Google Scholar] [CrossRef] [PubMed]
- Weissman, M.M.; Sholomskas, D.; Pottenger, M.; Prusoff, B.A.; Locke, B.Z. Assessing depressive symptoms in five psychiatric populations: A validation study. Am. J. Epidemiol. 1977, 106, 203–214. [Google Scholar] [CrossRef] [PubMed]
- Yardley, L.; Beyer, N.; Hauer, K.; Kempen, G.; Piot-Ziegler, C.; Todd, C. Development and initial validation of the Falls Efficacy Scale-International (FES-I). Age Ageing 2005, 34, 614–619. [Google Scholar] [CrossRef] [PubMed] [Green Version]
- Powell Lawton, M.; Brody, E.M. Assessment of older people: Self-maintaining and instrumental activities of daily living. Gerontologist 1969, 9, 179–186. [Google Scholar] [CrossRef]
- Beck, A.T.; Epstein, N.; Brown, G.; Steer, R.A. An inventory for measuring clinical anxiety: Psychometric properties. J. Consult. Clin. Psychol. 1988, 56, 893–897. [Google Scholar] [CrossRef]
- Jørstad, E.C.; Hauer, K.; Becker, C.; on behalf of the ProFaNE Group; Msc, E.C.J.; Lamb, S.E. Measuring the Psychological Outcomes of Falling: A Systematic Review. J. Am. Geriatr. Soc. 2005, 53, 501–510. [Google Scholar] [CrossRef]
- Razjouyan, J.; Naik, A.D.; Horstman, M.J.; Kunik, M.E.; Amirmazaheri, M.; Zhou, H.; Sharafkhaneh, A.; Najafi, B. Wearable Sensors and the Assessment of Frailty among Vulnerable Older Adults: An Observational Cohort Study. Sensors 2018, 18, 1336. [Google Scholar] [CrossRef] [Green Version]
- Najafi, B.; Crews, R.T.; Wrobel, J.S. Importance of Time Spent Standing for Those at Risk of Diabetic Foot Ulceration. Diabetes Care 2010, 33, 2448–2450. [Google Scholar] [CrossRef] [Green Version]
- Najafi, B.; Armstrong, D.G.; Mohler, J. Novel Wearable Technology for Assessing Spontaneous Daily Physical Activity and Risk of Falling in Older Adults with Diabetes. J. Diabetes Sci. Technol. 2013, 1147–1160. [Google Scholar] [CrossRef] [Green Version]
- Razjouyan, J.; Najafi, B.; Horstman, M.; Sharafkhaneh, A.; Amirmazaheri, M.; Zhou, H.; Kunik, M.E.; Naik, A. Toward Using Wearables to Remotely Monitor Cognitive Frailty in Community-Living Older Adults: An Observational Study. Sensors 2020, 20, 2218. [Google Scholar] [CrossRef] [Green Version]
- Lindberg, C.M.; Srinivasan, K.; Gilligan, B.; Razjouyan, J.; Lee, H.; Najafi, B.; Canada, K.J.; Mehl, M.R.; Currim, F.; Ram, S.; et al. Effects of office workstation type on physical activity and stress. Occup. Environ. Med. 2018, 75, 689–695. [Google Scholar] [CrossRef] [Green Version]
- Razjouyan, J.; Lee, H.; Parthasarathy, S.; Mohler, J.; Sharafkhaneh, A.; Najafi, B. Improving Sleep Quality Assessment Using Wearable Sensors by Including Information From Postural/Sleep Position Changes and Body Acceleration: A Comparison of Chest-Worn Sensors, Wrist Actigraphy, and Polysomnography. J. Clin. Sleep Med. 2017, 13, 1301–1310. [Google Scholar] [CrossRef] [PubMed] [Green Version]
- Najafi, B.; Aminian, K.; Paraschiv-Ionescu, A.; Loew, F.; Büla, C.J.; Robert, P. Ambulatory system for human motion analysis using a kinematic sensor: Monitoring of daily physical activity in the elderly. IEEE Trans. Biomed. Eng. 2003, 50, 711–723. [Google Scholar] [CrossRef] [PubMed]
- Parvaneh, S.; Mohler, J.; Toosizadeh, N.; Grewal, G.S.; Najafi, B. Postural Transitions during Activities of Daily Living Could Identify Frailty Status: Application of Wearable Technology to Identify Frailty during Unsupervised Condition. Gerontology 2017, 63, 479–487. [Google Scholar] [CrossRef] [Green Version]
- Cohen, J. Statistical Power Analysis for the Behavioral Sciences; Academic Press: Cambridge, MA, USA, 2013. [Google Scholar]
- Rosenthal, J.A. Qualitative Descriptors of Strength of Association and Effect Size. J. Soc. Serv. Res. 1996, 21, 37–59. [Google Scholar] [CrossRef]
- Edwards, M.K.; Loprinzi, P.D. Effects of a Sedentary Behavior-Inducing Randomized Controlled Intervention on Depression and Mood Profile in Active Young Adults. Mayo Clin. Proc. 2016, 91, 984–998. [Google Scholar] [CrossRef] [PubMed]
- Endrighi, R.; Steptoe, A.; Hamer, M. The effect of experimentally induced sedentariness on mood and psychobiological responses to mental stress. Br. J. Psychiatry 2016, 208, 245–251. [Google Scholar] [CrossRef] [Green Version]
- De Bruin, E.D.; Najafi, B.; Murer, K.; Uebelhart, D.; Aminian, K. Quantification of everyday motor function in a geriatric population. J. Rehabil. Res. Dev. 2007, 44, 417–428. [Google Scholar] [CrossRef]


| Demographics | |
|---|---|
| Age, years | 77.3 ± 1.9 |
| Sex (Female), % | 40% |
| Height, m | 1.63 ± 0.09 |
| Weight, kg | 83.4 ± 21.5 |
| Body Mass Index (BMI), kg/m2 | 27.5 ± 1.6 |
| Clinical data | |
| Had fall in last 12-month, % | 30% |
| Cancer (%) | 40% |
| Number of prescription medications, n | 2.1 ± 0.6 |
| Cognition (MoCA), score | 25.1 ± 1.6 |
| Cognitive impairment, % | 30% |
| Center for Epidemiologic Studies Depression (CES-D), score | 2.8 ± 0.7 |
| Depression, % | 0% |
| Fear of Falling (FES-I), score | 19.3 ± 1.0 |
| (High Concern) Fallers, % | 0% |
| Activities of Daily Living Scale (IADL), score | 6.6 ± 0.9 |
| Low Functional Ability, % | 20% |
| Anxiety (BAI), score | 2.1 ± 1.0 |
| High Anxiety, % | 0% |
| Time-point of assessments | |
| Average duration pre-pandemic assessment, months | 1.13 ± 0.43 |
| Average duration post-pandemic assessment, months | 5.9 ± 0.67 |
| Before | During | Mean Difference % | Cohen’s d | p-Value | |
|---|---|---|---|---|---|
| Psycho-social Behavior | |||||
| Depression, score | 3.0 ± 0.7 | 7.5 ± 2.4 | 150.0% | 0.80 | 0.046 * |
| Fear of Falling, score | 19.7 ± 1.2 | 18.7 ± 1.0 | −5.1% | 0.29 | 0.443 |
| Anxiety, score | 2.1 ± 1.0 | 2.9 ± 1.4 | 38.1% | 0.21 | 0.588 |
| Activity of daily life, score | 6.6 ± 0.9 | 6.0 ± 1.0 | −9.1% | 0.19 | 0.131 |
| Cumulated Posture | |||||
| Sitting percentage, % | 37.5 ± 4.5 | 45.2 ± 5.1 | 20.5% | 0.5 | 0.049 * |
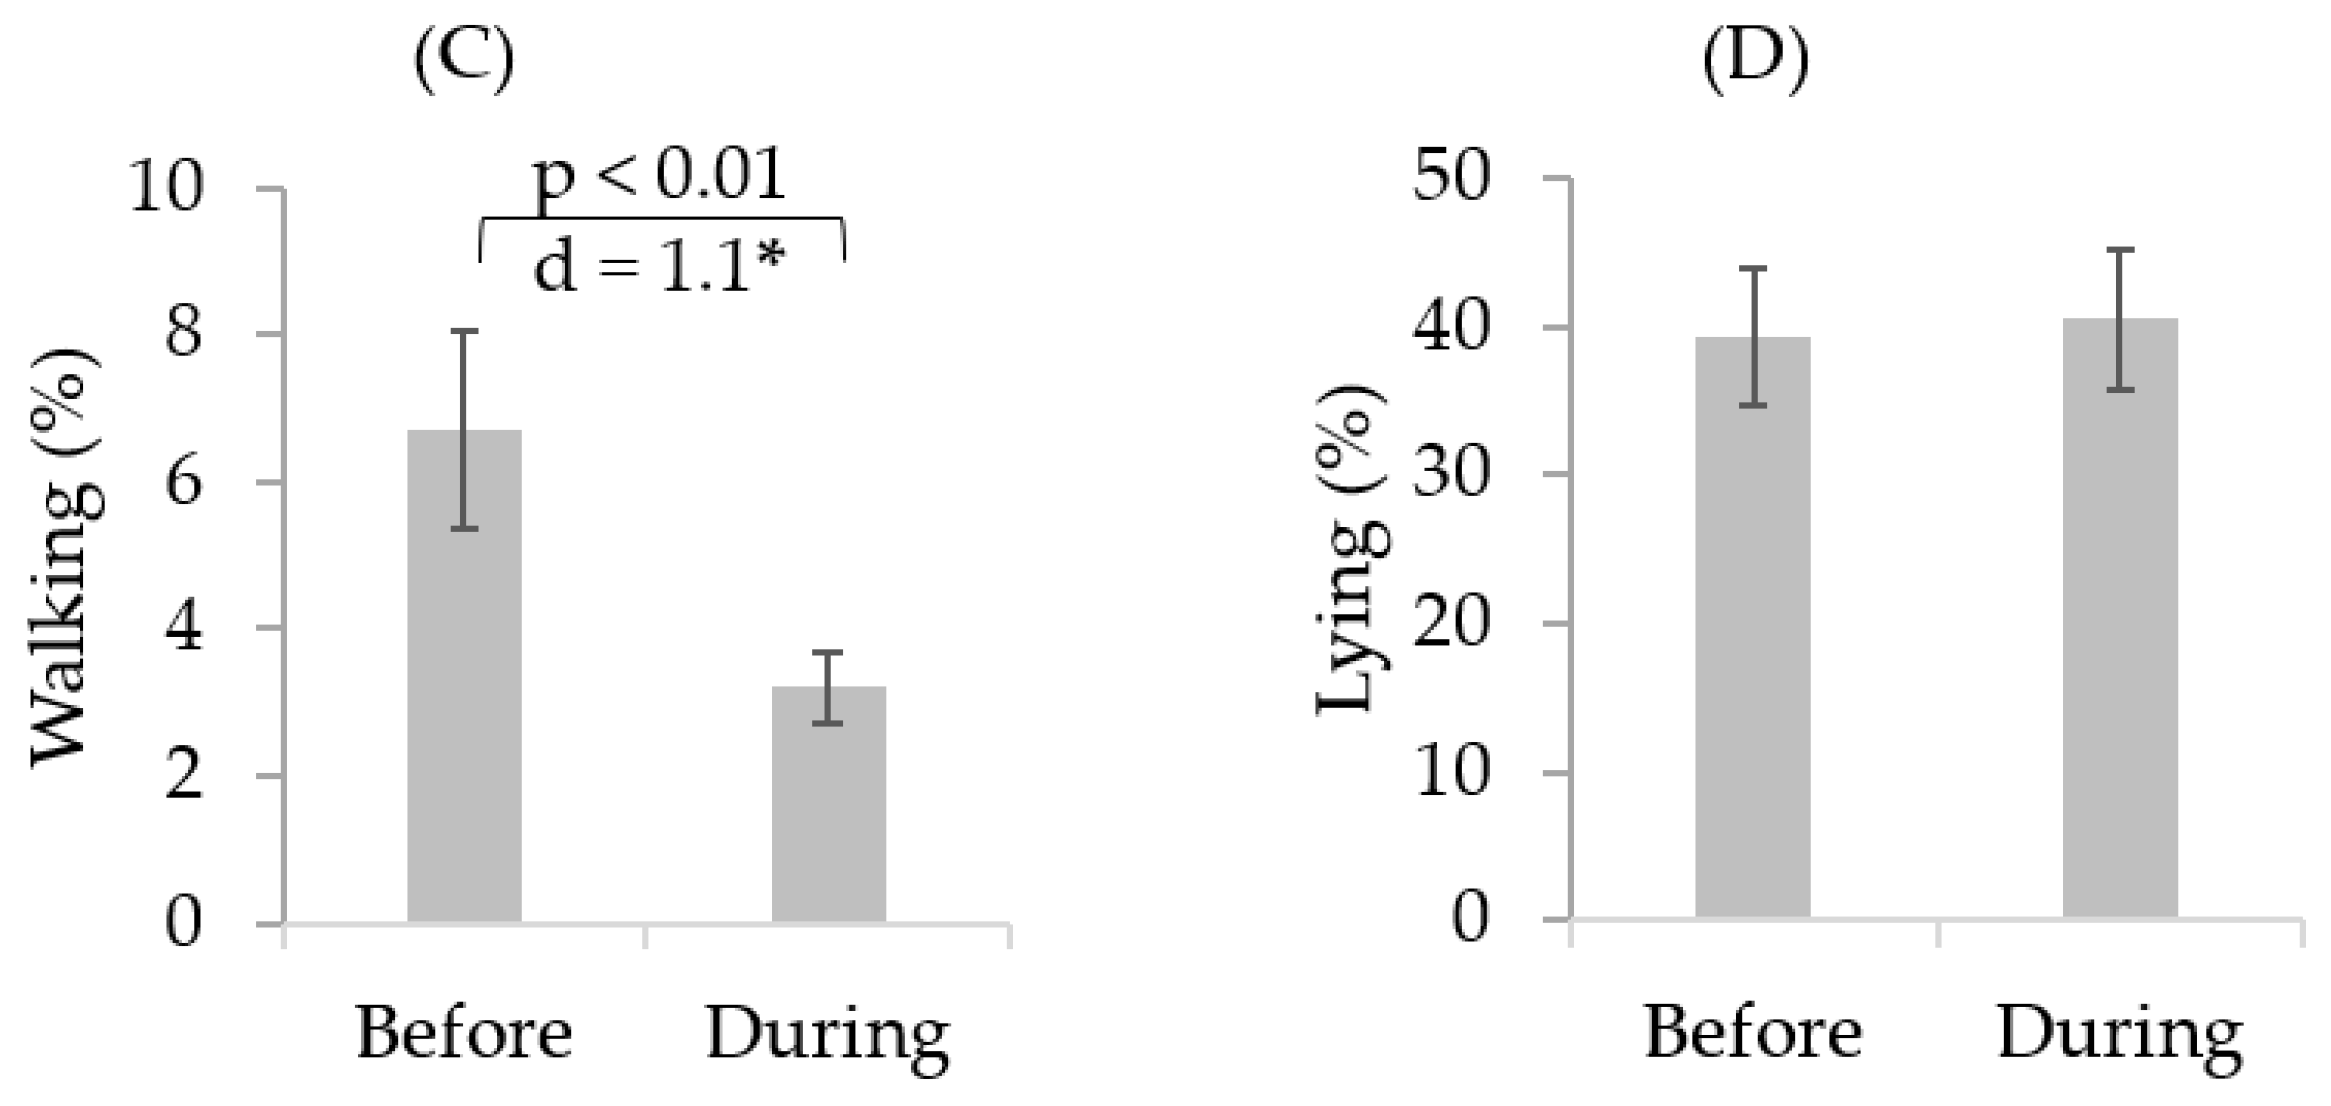
| Lying percentage, % | 39.3 ± 4.6 | 40.5 ± 4.7 | 3.1% | 0.24 | 0.768 |
| Standing percentage, % | 16.5 ± 2.3 | 11.1 ± 1.8 | −32.7% | 0.78 | <0.01 * |
| Walking percentage, % | 6.7 ± 1.3 | 3.2 ± 0.5 | −52.2% | 1.1 | <0.01 * |
| Walking Characteristics | |||||
| Daily Step count, n | 5911 ± 1193 | 2655 ± 419 | −55.1% | 1.0 | 0.016 * |
| Number of unbroken walking bout, n | 241.3 ± 56.2 | 148.6 ± 27.1 | −38.4% | 0.52 | 0.046 * |
| Cadence, steps/min | 81.1 ± 2.3 | 83.9 ± 1.7 | 3.4% | 0.4 | 0.367 |
| Postural Transition | |||||
| Number of Postural Transitions, n | 720.7 ± 162.2 | 399.4 ± 68.5 | −44.6% | 0.82 | 0.017 * |
| Average duration of stand-to-sit transition, s | 3.0 ± 0.07 | 2.7 ± 0.3 | −10.0% | 0.4 | 0.88 |
| Average duration of sit-to-stand transition, s | 3.0 ± 0.08 | 3.0 ± 0.07 | 0% | 0 | 0.57 |
| Activity Behavior | |||||
| Prolong Sitting, s | 240.9 ± 46.5 | 287.3 ± 61.6 | 19.3% | 0.26 | 0.392 |
| Average Light Activity, min | 10.8 ± 0.7 | 10.5 ± 0.8 | −2.8% | 0.13 | 0.678 |
| Average Moderate to Vigorous Activity, min | 31.0 ± 5.4 | 27.3 ± 4.6 | −11.9% | 0.23 | 0.526 |
| Sleep Quantity | |||||
| Time in Bed, s | 566.3 ± 66.2 | 583.7 ± 67.5 | 3% | 0.08 | 0.768 |
| Correlations Coefficient | Variance, R2 | p-Value | |
|---|---|---|---|
| ∆ 1 Cadence, steps/min | −0.701 * | 0.49 | 0.024 |
| ∆ Prolonged Sitting, s | 0.677 * | 0.46 | 0.032 |
| ∆ Average Light Activity, min | −0.566 | 0.32 | 0.088 |
| ∆ Average Moderate to Vigorous Activity, min | −0.409 | 0.16 | 0.241 |
| ∆ Time in Bed, s | −0.720 * | 0.52 | 0.019 |
Publisher’s Note: MDPI stays neutral with regard to jurisdictional claims in published maps and institutional affiliations. |
© 2021 by the authors. Licensee MDPI, Basel, Switzerland. This article is an open access article distributed under the terms and conditions of the Creative Commons Attribution (CC BY) license (https://creativecommons.org/licenses/by/4.0/).
Share and Cite
Mishra, R.; Park, C.; York, M.K.; Kunik, M.E.; Wung, S.-F.; Naik, A.D.; Najafi, B. Decrease in Mobility during the COVID-19 Pandemic and Its Association with Increase in Depression among Older Adults: A Longitudinal Remote Mobility Monitoring Using a Wearable Sensor. Sensors 2021, 21, 3090. https://doi.org/10.3390/s21093090
Mishra R, Park C, York MK, Kunik ME, Wung S-F, Naik AD, Najafi B. Decrease in Mobility during the COVID-19 Pandemic and Its Association with Increase in Depression among Older Adults: A Longitudinal Remote Mobility Monitoring Using a Wearable Sensor. Sensors. 2021; 21(9):3090. https://doi.org/10.3390/s21093090
Chicago/Turabian StyleMishra, Ramkinker, Catherine Park, Michele K. York, Mark E. Kunik, Shu-Fen Wung, Aanand D. Naik, and Bijan Najafi. 2021. "Decrease in Mobility during the COVID-19 Pandemic and Its Association with Increase in Depression among Older Adults: A Longitudinal Remote Mobility Monitoring Using a Wearable Sensor" Sensors 21, no. 9: 3090. https://doi.org/10.3390/s21093090