Article

Evaluating Differences in Mathematical Competencies in Middle School Students during Pandemic Conditions through Preparatec Platform

by
Blanca Estela Maldonado-García
1,
Alejandra Ocampo-Díaz
1 and
May Portuguez-Castro
2,*
1
Department of Mathematics, Tecnologico de Monterrey, Xochitepec 62790, MR, Mexico
2
Institute for the Future of Education, Tecnologico de Monterrey, Monterrey 64849, NL, Mexico
*
Author to whom correspondence should be addressed.
Educ. Sci. 2022, 12(8), 546; https://doi.org/10.3390/educsci12080546
Submission received: 27 June 2022 / Revised: 31 July 2022 / Accepted: 3 August 2022 / Published: 12 August 2022

Abstract

:
This research proposes to evaluate the difference in essential mathematical competencies of middle school students transitioning to high school level under pandemic conditions (COVID-19) using the PreparaTec platform and Programme for International Student Assessment (PISA) released items as an evaluation instrument. The study was conducted with 84 students from first semester high school at Prepa Tec (Tecnologico de Monterrey, Campus Cuernavaca) aged 14 and 15. The students were divided into three experimental groups and a control group. Three levels of mathematical competencies: reproduction, definitions, and calculations (level 1), connections and integration to solve problems (level 2), and reflection (level 3) were evaluated. We applied a pre-test at the beginning of the semester and a post-test at the end after using the PreparaTec platform. Both tests were written and applied in a face-to-face format. The study presents the findings regarding the impact of using the PreparaTec platform during the first semester in the three levels of mathematical competencies mentioned. The results obtained are presented in two analyses. The first analysis involves the results obtained per experimental group and according to the number of correct answers per group. The second analysis represents a comparison between the percentage of correct answers and the level of difficulty per question per student regarding the percentage, determined by the Organisation for Economic Cooperation and Development (OECD) and Spain in the format presented by PISA. The pre-test and post-test consisted of 23 questions from items released from PISA, which contemplated measuring the three levels of mathematical competence. The results showed an improvement of 57% in level 1 proficiency questions, 63.6% in level 2 proficiency, and 100% in level 3 proficiency. The findings indicate that new teaching strategies based on Information and Communication Technologies (ICT) and more meaningful assessment forms further develop students’ mathematical competencies.

1. Introduction

With the arrival of the COVID-19 pandemic, the teaching-learning process has been unexpectedly transformed. Education has been one of the most affected areas in human activity due to the pandemic. In this sense, almost every school worldwide went into a lockdown starting in Spring 2020, replacing academy activities with distance learning, laying the responsibility of teaching on to parents and the availability of digital devices at home. As a result, it brought less effective learning, like the case study in the province of Torino (Italy), which was the first Western European country hit by the COVID-19 pandemic. In this context, the learning loss was greater for girls and high-achieving children of low-educated parents, and the impact was harshest in schools with a disadvantaged social composition [1,2].
The Mexican government also declared a sanitary emergency during the epidemic generated by this disease, taking social isolation measures that required staying home and the emergence of “healthy distance” as preventive measures to control its expansion [3]. This measure implied that millions of students of all educational levels were affected by the closure of schools, causing a change in the way of bringing learning to learners [4]. Not only were the primary and middle schools affected by the arrival of COVID-19, but it was also the higher education that was disrupted in many ways, contrary to the detriment of the basic levels of education. In some cases, the confinement significantly positively affected higher education students’ performance, changing their learning strategies to more autonomous and continuous habits, improving their efficiency, and having better student assessment scores [5]. However, in other cases, some groups were more vulnerable to psychological effects during the pandemic lockdown. This was the case for many middle school students, where anxiety and stress were associated with mathematical tasks [6].
The pandemic lockdown has led to the transition of a pedagogical model in which the teaching-learning process is through not only virtual environments, but also through using new learning strategies, which has become a challenge for educational centers to adapt to economic and social conditions around the world [7,8,9].
The pandemic transformed the entire teaching system at all levels [10]. Not only because of the use of platforms and the need to consider different conditions [11] to those subjects of utmost importance in the student life of any child, but also because there are learning and competencies that became more relevant in the context in which they were living [12]. Combining face-to-face teaching with virtual teaching (blended learning) forces us to consider the characteristics of information communication technologies (ICTs) in more detail. The lack of access to educational technologies and innovations is challenging for educational institutions and students. At this time, computer-assisted learning helped teachers adapt to the pandemic and enhance motivation, critical thinking, and student learning, so analyzing the use of ICT and its variables is essential to identify the effects of its use during this period [8,13,14]. This situation also led to the development of digital skills in teachers, who could discover and develop new alternatives to diversify the way of learning. The COVID-19 pandemic caused the closure of schools and universities and changed the traditional teaching-learning process to online teaching, placing more responsibility for learning on parents and guardians. Mathematics teaching is traditionally strongly connected to the content and the transmission of knowledge, that is, facts to remember and skills to acquire [10,15].
Regarding teaching mathematics, it is crucial to encourage the application of concepts and that the student makes sense of what has been learned and the solution to challenges that arise [16]. However, applying mathematical knowledge is not only the use of formulas but also the use of logical reasoning for problem-solving, which requires pedagogical strategies not based solely on memorization. Although many teachers recognize the power of digital tools to motivate and encourage students to participate more in learning procedures, they do not use them in teaching practices. Teachers use digital tools to teach mathematics more as a drill-and-practice tool and less as a tool for supporting activities with real-life situations and exploration [17,18].
Mathematical competence, therefore, goes beyond just the mathematical processes of reproduction [19]. It establishes whether students can use what they have learned in typical daily situations. According to Yusupova and Skudareva [20], mathematical competence is an individual’s ability to formulate, apply, and interpret mathematics in various contexts. It helps individuals understand mathematics’ role in the world and draw well-founded conclusions and decisions for constructive, active, and reflective citizenship development.
Since the pandemic has led to a lag in student learning, this study proposes the PreparaTec platform to strengthen basic mathematical skills in first-semester high school students and contribute to developing new methodologies for distance learning. The PreparaTec platform was designed considering the flipped learning methodology, which compensates for the fact that students do not attend face-to-face classes. The intention is to use it as a technological tool to bring education closer to the students, facilitate the continuity of their education, and investigate the impact its use can have on the development of mathematical competencies.
Positive effects on math achievement occurred only when using online learning software already familiar to students. So, online learning could offer a wide range of opportunities for students to learn if they have the necessary technology, positive attitudes towards it, and prerequisite skills [21,22,23].
With the use of flipped learning, students can review the class material in their own space and at their own pace, take notes, and practice reflection and analysis of information, which favors those students who have problems with the content of the subject [24]. However, to make the most of the advantages offered using flipped learning, it is necessary that the student reviews the material before the class and performs the related activities. Otherwise, there will be no significant learning for the student [25]; in this way, in virtual sessions, it is possible to have better use of the class.
We used the Programme for International Student Assessment (PISA) [19] as an evaluation instrument for this study. The Organisation for Economic Co-operation and Development (OECD) conducted this standardized test [26], and the objective of the test is to evaluate the training of students when they reach the end of the compulsory education stage (secondary school). The use of PISA is appropriate as it focuses on the competencies that students should have developed by the age of 15, regardless of the curriculum they are studying [27,28]. This test is conducted every three years in 79 different countries. It evaluates the areas of reading, mathematics, and scientific competence, emphasizing the mastery of processes, understanding concepts, and ability to apply them in different contexts of everyday life. [29] This research aims to show an alternative to evaluate mathematical competencies in the classroom, using as an evaluation instrument the percentage of success under the PISA scheme in conjunction with the percentages suggested by the OECD and the results of the PISA tests in Spain.

1.1. Mathematics Teaching-Learning Process

When teaching mathematics to first-semester high school students, the experience of those who write this has shown that new high school students arrive with different degrees of learning in mathematics. Although the syllabus for the subject of mathematics is regulated by the Secretary of Public Education (SEP), the degree of depth in the teaching-learning process varies from school to school. Therefore, at the beginning of the first semester of high school, it is necessary to consider the leveling in learning mathematical concepts so that the following mathematics subjects are better understood [30]. The leveling of these gaps in knowledge involves using strategies that motivate the student to achieve it. However, a new way of working on learning may not be so welcome by students, especially during this period of a pandemic.
The purpose of teaching mathematics should be that students can apply and use it. Hence, the student must find the relationship between what has been learned and the challenge to be solved [16]. Likewise, as described by some authors, the change in the process of student-centered teaching involves changes in the preparation and the way of teaching the class [31]. Therefore, this innovation proposal arises from the need to improve two aspects: the development of mathematical competencies and autonomy in the learning process by the student, both using the PreparaTec platform.
Multiple factors are involved in the teaching-learning process of mathematics in the classroom. For example, the training of the teachers, their confidence in the discipline, the didactics used in the classroom, the autonomy of work, the cultural level of the parents, the school climate, and the educational proposal of the establishment [32], to mention a few. Pekrun talks about emotions, where students can experience a series of moods, such as enthusiasm, admiration, empathy, envy towards peers, boredom, persistence, etc. [33]. Taking this into account is of utmost importance; therefore, the teacher has the tools to understand and identify students’ moods.
Such is the number of factors and agents involved. So intricate is their interrelationship that it becomes difficult to explain, in simple terms, the differences in the levels observed in tests such as PISA [34]. This finding may explain why some attempts to adopt part or all of the mathematics teaching methodologies have not had the same successful results that they have had in the country of origin [32].

1.2. PISA Test to Assess Mathematical Competencies

PISA defines mathematical competence (or literacy) as “… an individual’s ability to reason mathematically and formulate, use and interpret mathematics to solve problems in various real-life contexts. This literacy includes concepts, procedures, data, and tools to describe, explain, and predict phenomena. It helps individuals learn about the role of mathematics in the world and make the informed judgments and decisions needed by thoughtful, constructive, and engaged citizens of the 21st century” [35] (p. 3).
The contents of the PISA mathematical competence assessment contemplate items that present problems of quantity, space, and form, change and relationships, and probability; located in four different contexts: personal situation, educational or work situation, public situation, and the scientific situation; which evaluate three levels of competence; the first is level 1 (reproduction, definitions, and calculations) where the student works with everyday operations, simple calculations in the context of their immediate environment or daily routine; level 2 (Connections and integration to solve problems) where they involve mathematical ideas and procedures to solve problems that are not in their immediate environment but are familiar to them, where they must elaborate models to solve them; and finally, level 3 (reflection), where they must solve complex problems where the student must conceptualize and provide a solution through an original mathematical approach [36,37,38].
Although PISA test results have been used to identify student achievement levels in different countries [39,40], most studies seek to determine how different factors impact test results at the national level or by comparing results across countries. One such study was developed by Boman [41], who analyzed the relationship of sociodemographic and socioeconomic variables on the performance of Swedish students compared to 31 countries. Another research by Basarkod [42] identified the immigration effects on the PISA test results in Italy from 2003 to 2021. In Spain, scores from the 2006–2018 PISA test were used to analyze the relationship between cell phone use with bullying and test scores [43].
In these and other studies, we did not find the application of the test questions to specific cases in a classroom or school sector. So, it is considered that this study is novel and can contribute to knowledge by presenting a methodology that uses the questions released from PISA that have to do with the achievement of different levels of learning of mathematical competencies to evaluate the results of the application of new pedagogical strategies. This study may be helpful for teachers and managers seeking to improve pedagogical mediation strategies in the classroom, using new technologies and active pedagogies such as flipped learning.

1.3. Flipped Learning

During the COVID-19 pandemic, technological tools generated a large amount of online teaching, giving rise to teaching-learning basic knowledge. Therefore, it is necessary to develop new strategies for students to create learning outcomes coherently with the latest social conditions beyond superficial learning. Quality education in online environments is broad and have become essential, allowing for variability in implementing activities inside and outside the classroom [44].
According to Ospina Espinal and Galvis López [45], “education based on virtual environments allows having elements and tools that contribute to the performance of the student as the protagonist of his training process” [45] (p. 11), hence the importance of using strategies such as flipped learning to generate the learning environment and encourage the student to be this protagonist.
Nederveld comments that flipped learning is a pedagogical approach where the teaching-learning process is “inverted,” i.e., what the student did as homework is now done in class, and what they did in class is now done at home [46]. Flipped learning refers to the fact that students learn the class topics independently, i.e., they review videos or other material proposed by the teacher before the class. Then, the teaching-learning process will involve student participation in solving problems using the previously learned concepts in the classroom. The teacher’s role is to guide the student in solving the questions. Thus, class time is used to create, evaluate, and analyze and stop it from being only an expository space for the teacher [47]. This way, class time becomes a flexible process that does not prioritize only the contents [48].
According to a systematic review of the literature analyzing the relationship between flipped learning and mathematics teaching, studies show that using this pedagogical strategy improves students’ academic results [49,50,51]. In addition, there is an increase in the confidence and satisfaction of students who become more active as they have more time to carry out their activities and participate in class [52,53]. Mathematical competence involves these components, which is why it is essential to use standardized tests to measure the development of these skills.
For the implementation of the flipped classroom, Bergman and Sams recommended performing the following actions [54]:
  • Define the tasks to be performed by the student and encourage self-learning by introducing students to the pedagogical strategy;
  • Accompany the student in determining the educational resources’ actual content;
  • Check that students have seen the resources by asking interesting questions to help them understand the topic;
  • In the classroom, prepare the space to encourage collaboration and the development of activities;
  • Encourage the student to organize his or her time;
  • Encourage collaboration working in teams;
  • Use instruments of formative evaluation;
In recent years, there has been significant interest in developing the inverted classroom as a pedagogical strategy because it has come to complement the methodologies used for academic continuity during the pandemic [55]. In this sense, this research aimed to identify the difference in basic mathematical competencies in middle school students when moving to the high school level under pandemic conditions through the practice of PreparaTec, a technological tool designed following flipped learning as a pedagogical strategy. This study is considered novel because, as mentioned above, we found no studies using the PISA test to measure mathematical competencies in specific environments. So, this study seeks to contribute with a methodology that teachers can apply in contexts in which teachers strive to implement educational innovations in the teaching of mathematics, and to check if there are differences in the competencies of their students at different learning challenging levels.

2. Materials and Methods

The research methodology is quantitative, descriptive, quasi-experimental, and chronological. The study was carried out with 84 students between 14 and 15 years of age from the first semester of high school at Prepa Tec of Tecnológico de Monterrey campus in Cuernavaca, organized into three experimental groups and a control group. The class content relates to the fundamentals of mathematics. There were 64 students in the experimental group and 20 students in the control group. It is worth mentioning that this was the first semester that the students returned to the classroom after completing the last year of high school virtually. The control group did not have access to the PreparaTec platform, whereas the experimental groups had access throughout the semester. This semester, the students attended classes twice a week in person and three days a week in virtual format.
The study contemplated 108 students enrolled in the Bicultural program in PrepaTec in Cuernavaca. The sample selection was intentional, so researchers invited 108 students to participate in this study. However, the parents’ authorization was requested since the participants were between 14 and 15 years of age. Once the permission was obtained, the remaining sample was 84 students out of the 108 participants, representing a statistically significant sample at a 95% confidence level.
The application of the pre-test and post-test was carried out on face-to-face days. The tests were taken without a calculator, and teachers contemplated 40 min for 23 questions in the evaluation instrument. As part of the application and analysis of the results, written authorization was requested from the parents to publish the research results. After applying the pre-test, students worked on the PreparaTec platform throughout the semester, inside and outside the classroom. The data were analyzed using the Kruskal-Wallis H test and Mann-Whitney U test with a significance level of α = 0.05.
The control and test groups received the information through the teachers of each of the groups. The two teachers in charge made a short presentation about the Novus research project at the beginning of the class. Novus is an initiative of the Institute for the Future of Education that seeks to strengthen the culture of educational innovation based on evidence from the professors of the Tecnológico de Monterrey. Furthermore, teachers informed students that they would be participating in two tests at the beginning (pre-test) and the end (post-test) of the semester. Their parents signed a confidentiality and data use agreement, where the teachers can use test scores without publishing the personal data of each student.

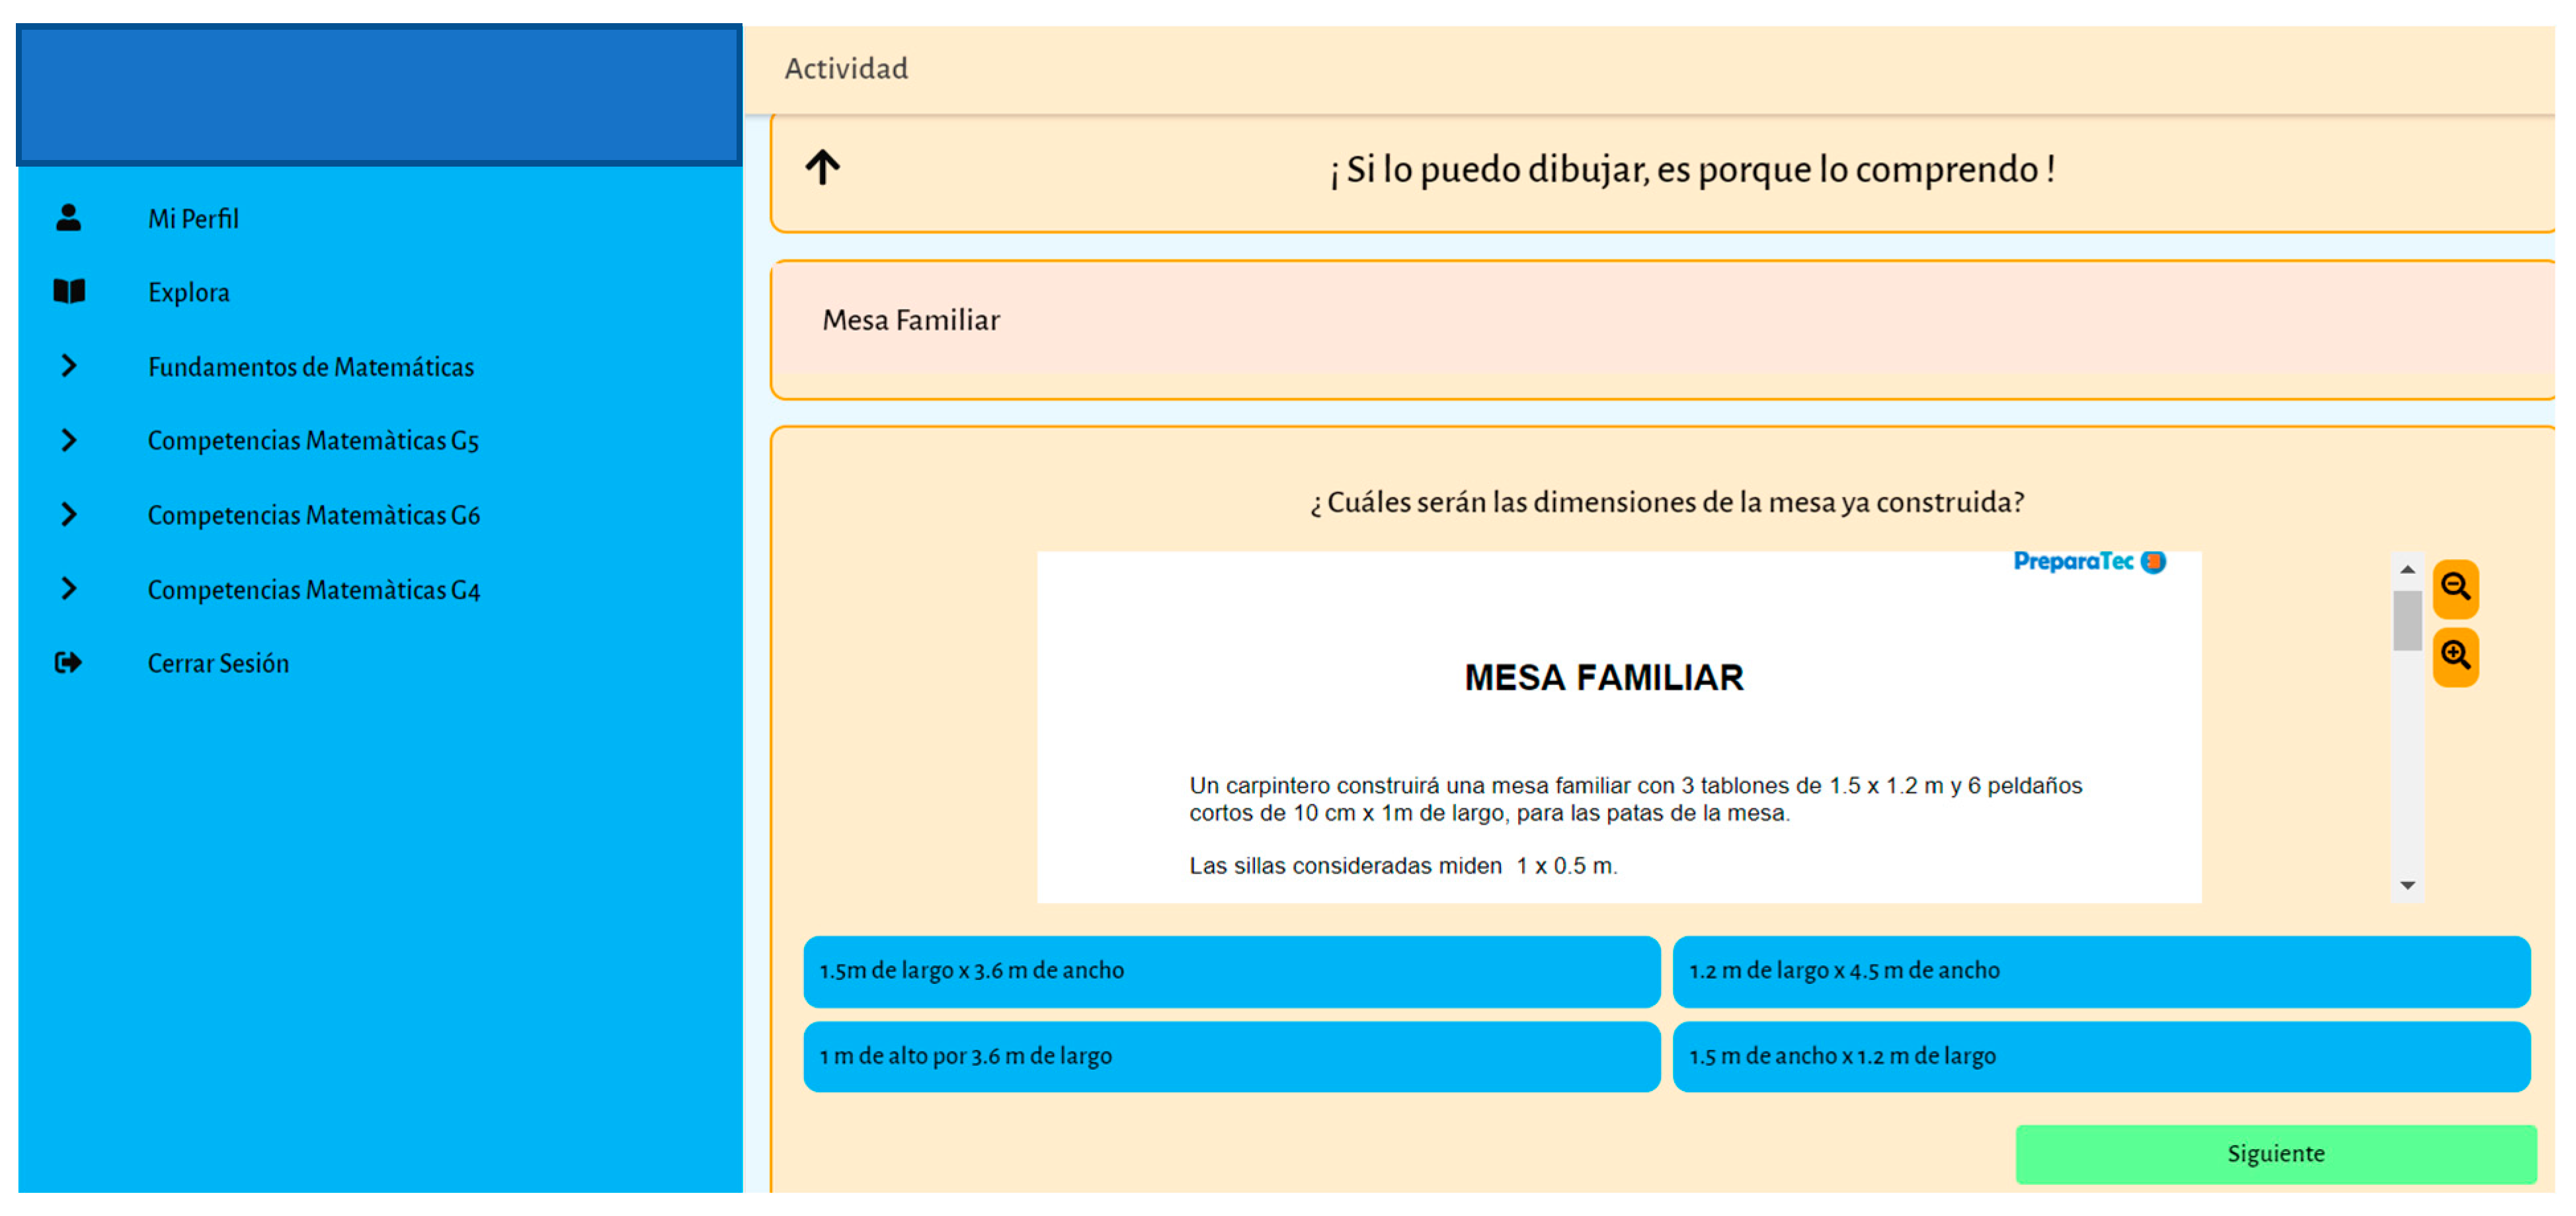
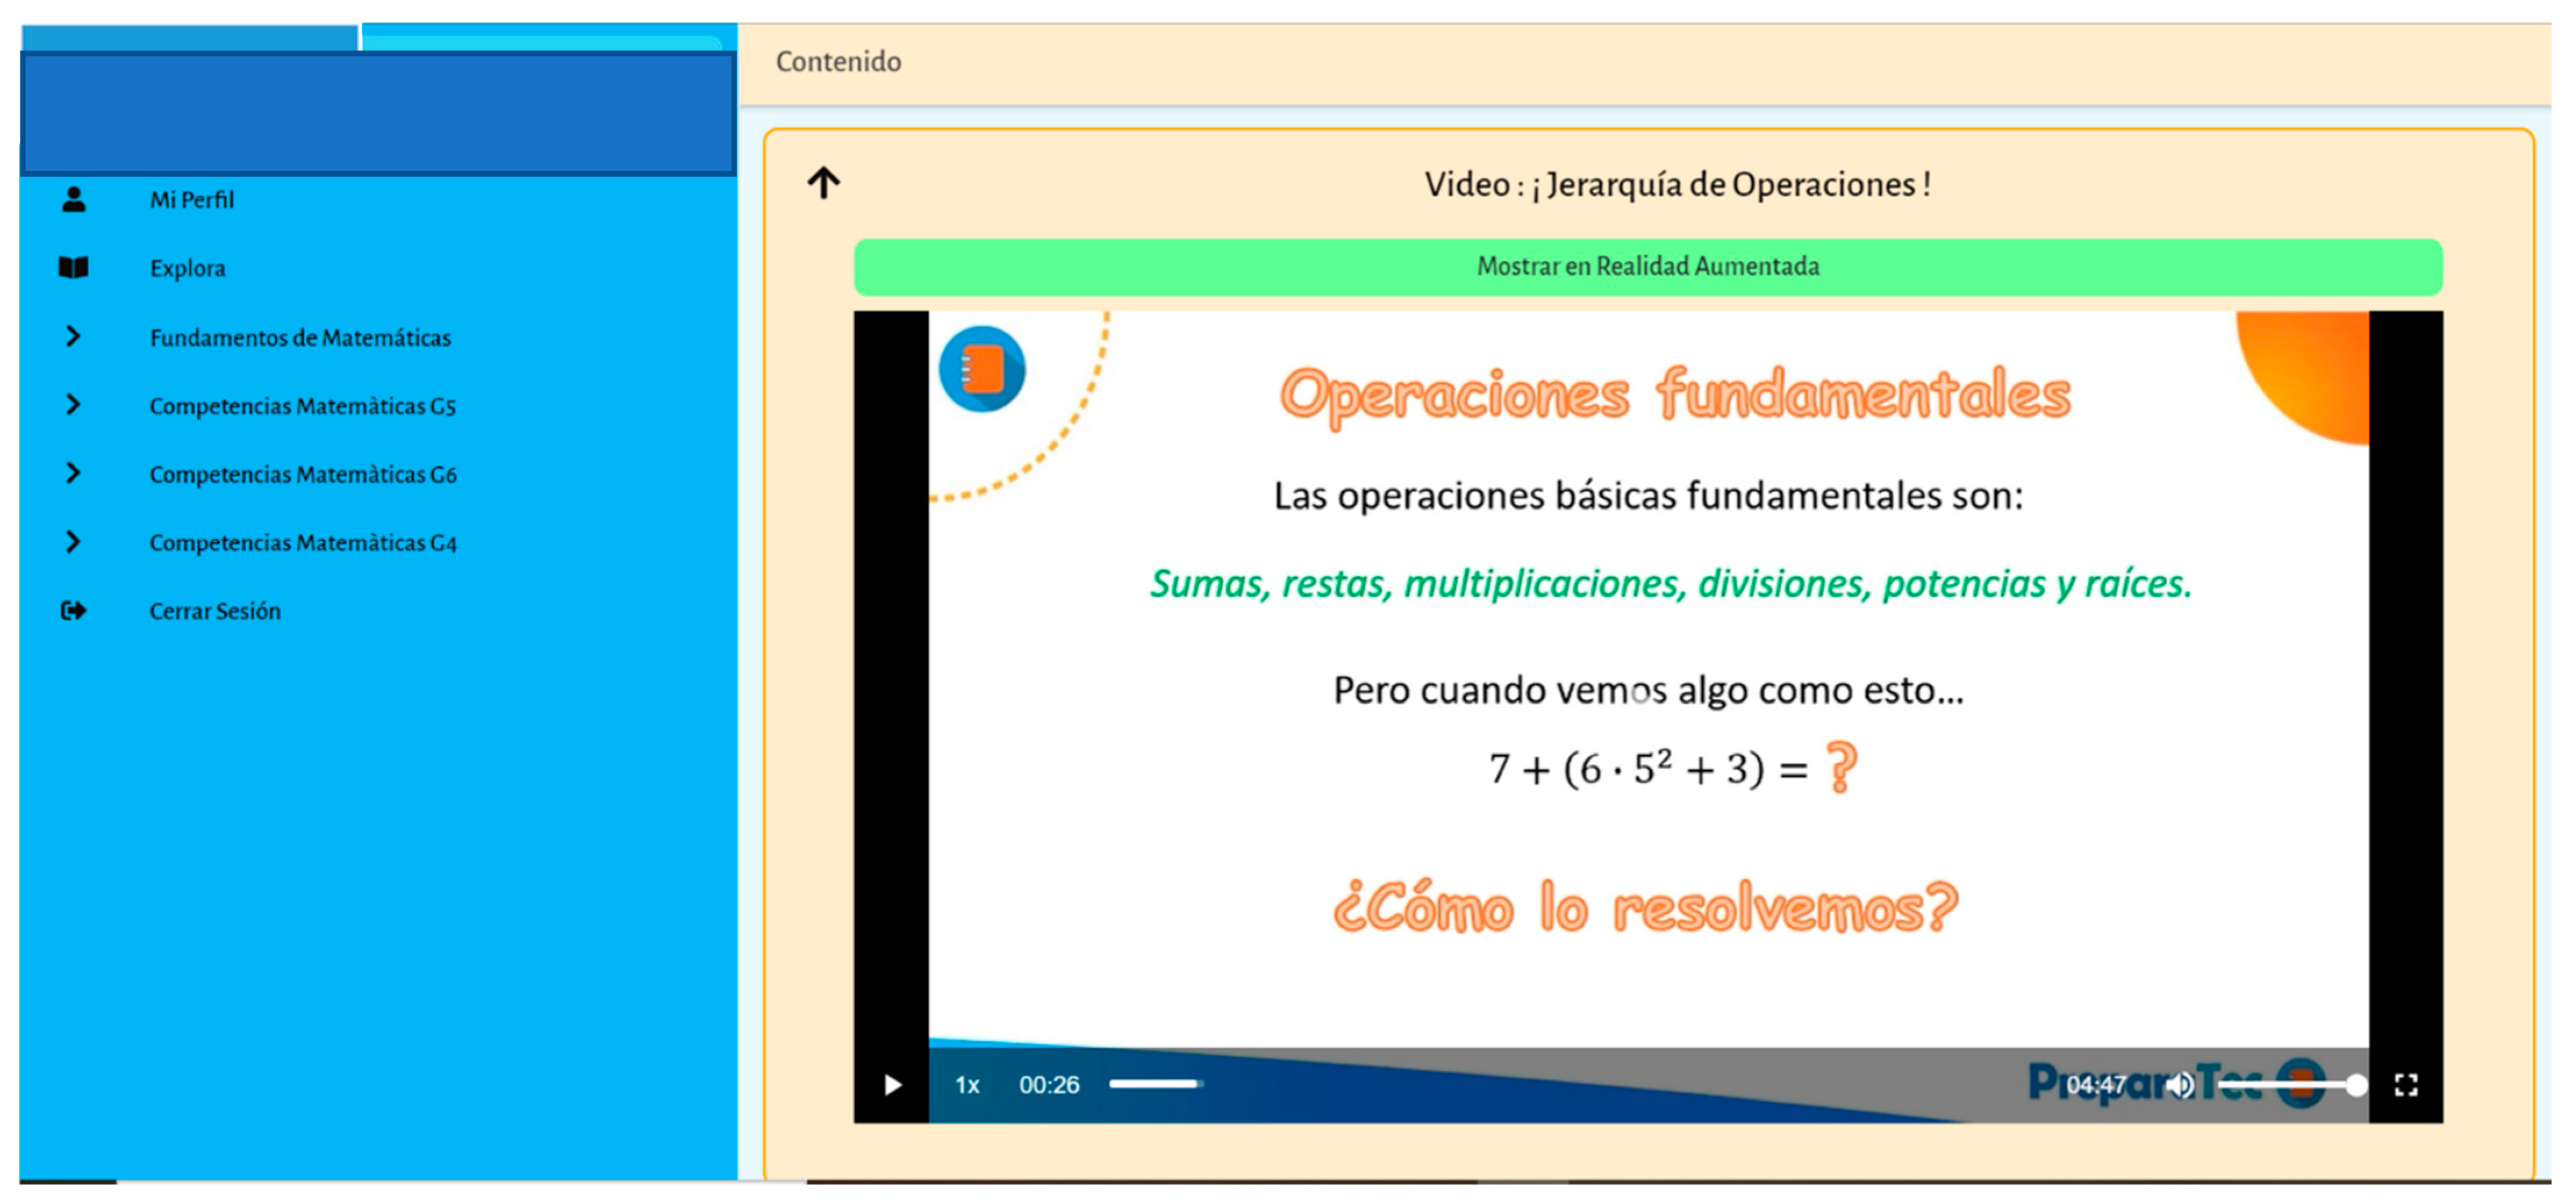
2.1. Innovation Description

PreparaTec is a platform created under the flipped learning strategy to investigate the impact that its use can have on the development of mathematical competencies. The platform consists of three modules. The first module corresponds to the organization of the semester’s topics and contains all the related subtopics. The second module contains videos explaining exercises for each topic, which students can review as often as they consider necessary. The videos have an average duration of 1.5 to 5 min and consider various problems on the same topic. The third module includes a series of activities with exercises of different degrees of difficulty. These exercises are mostly application problems related to problems of everyday life. Table 1 shows the topics, learning objectives, resources, and evaluation handled in the PreparaTec platform.
The practice material was designed by the teachers who teach the “Fundamentals of mathematics” class, considering the structure of the PISA items, contemplating levels of competencies and degrees of difficulty from levels 1 to 6. The PreparaTec platform was used throughout the semester and contemplated collaborative work sessions in class to resolve doubts and encourage discussion among students about possible ways to solve a problem. The platform’s math exercises explore a variety of real-life contexts. This involves translating mathematical solutions or reasoning into the context of the problem and determining whether the results are reasonable and make sense in the context of the problem. For example, purchase decisions, savings simulations, route planning, furniture design, exchange rate, summertime, floor tiling, etc. The videos contain mathematical concepts necessary to solve the requested problems, such as basic operations, fractions, real numbers, decimals, sequences, equations, percentages, the hierarchy of operations, etc. Students can access multiple choice exercises which have feedback for incorrect answers. Figure 1 and Figure 2 show the student’s view of both the math exercises and the videos of basic concepts.

2.2. Instrument

The research evaluation instrument was a pre-test and post-test of 23 questions taken from the items released by PISA [56]. We selected these items according to the level of competence they assess, i.e., according to level 1 (reproduction, definitions, and calculations), level 2 (connections and integration to solve problems), and level 3 (reflection). Each proficiency level has associated levels of degrees of difficulty per question. The questions can be open or closed and have an associated score per answer that can be 0, 1, 2, or 3 according to what is demanded in the question. The maximum pre-test and post-test scores are 69 points, considering complete, correct answers with a value of 3 points. Table 2 shows the 15 selected PISA items with which the test constructed the 23 questions of the evaluation instrument. Each item is related to one of the course topics, measured proficiency levels, and their associated difficulty levels.
Table 3 shows the six levels of proficiency difficulty that PISA establishes for evaluating each item. Each question is associated with a difficulty degree, representing what a student is expected to achieve at that level.

2.3. Analysis of Results

The results obtained are presented in two analyses. The first analysis involves the results of each experimental group according to the number of correct answers. The number of correct answers is the study variable of the first analysis. The number of correct answers is the study variable of the first analysis. Since some of the data are not normal, the Kruskal-Wallis H non-parametric test was used to compare the differences between the four study groups (the control group and the three experimental groups) for both the pre-test and the post-test. Likewise, each group’s pre- and post-test results will be presented using the Mann-Whitney U test.
The second analysis represents a comparison between the percentage of correct answers per item of the 84 students concerning the percentage of correct answers determined by the OECD and Spain as a reference country for being one of the first to apply the PISA tests [16]. For both analyses, 15 items released by PISA in all editions [16] were considered and designed based on closed or open questions, where each item has a score established for each correct answer.

3. Results

3.1. Sociodemographic Characteristics of Students

The study sample included 84 students starting their first semester of high school between the ages of 14 and 15, of whom 40 are male and 44 are female. The socioeconomic level of the students is upper middle class even though 35% of the students have a scholarship based on financial need. The 84 students were distributed into four groups, 64 participants in three experimental groups and 20 in the control group. Of the experimental groups, 30 are male and 34 are female, and in the control group, male and female students are evenly distributed. As a distinctive characteristic of the four groups, all the participants attended the final grade of middle school in the virtual format and the last three months of the previous grade of middle school, indicating that half of their middle school attendance was in virtual format due to the pandemic of COVID-19.
When applying for the pre-test, students showed great nervousness because it was one of the first evaluations they had to take in a face-to-face format during the pandemic. It is worth mentioning that during the experimentation period, the students were in a pandemic, with capacity restrictions in the classrooms and the protocol of healthy distance and use of masks on campus implemented.
During the high school semester where this study took place, students came to campus twice a week for face-to-face classes and continued with virtual classes three times a week. After the pre-test, the PreparaTec platform began to be used in the classroom on face-to-face format days to encourage its use so that students could find value in the information provided by the platform, and they could later practice it outside the classroom under the flipped learning methodology.
In particular, group 3 showed more enthusiasm when performing the post-test than the other experimental groups. The relationship formed in this group with their teacher was very close, so the motivation of the students to support the research had a significant impact on the group’s results. However, it was the experimental group with the lowest score in the pre-test evaluation.

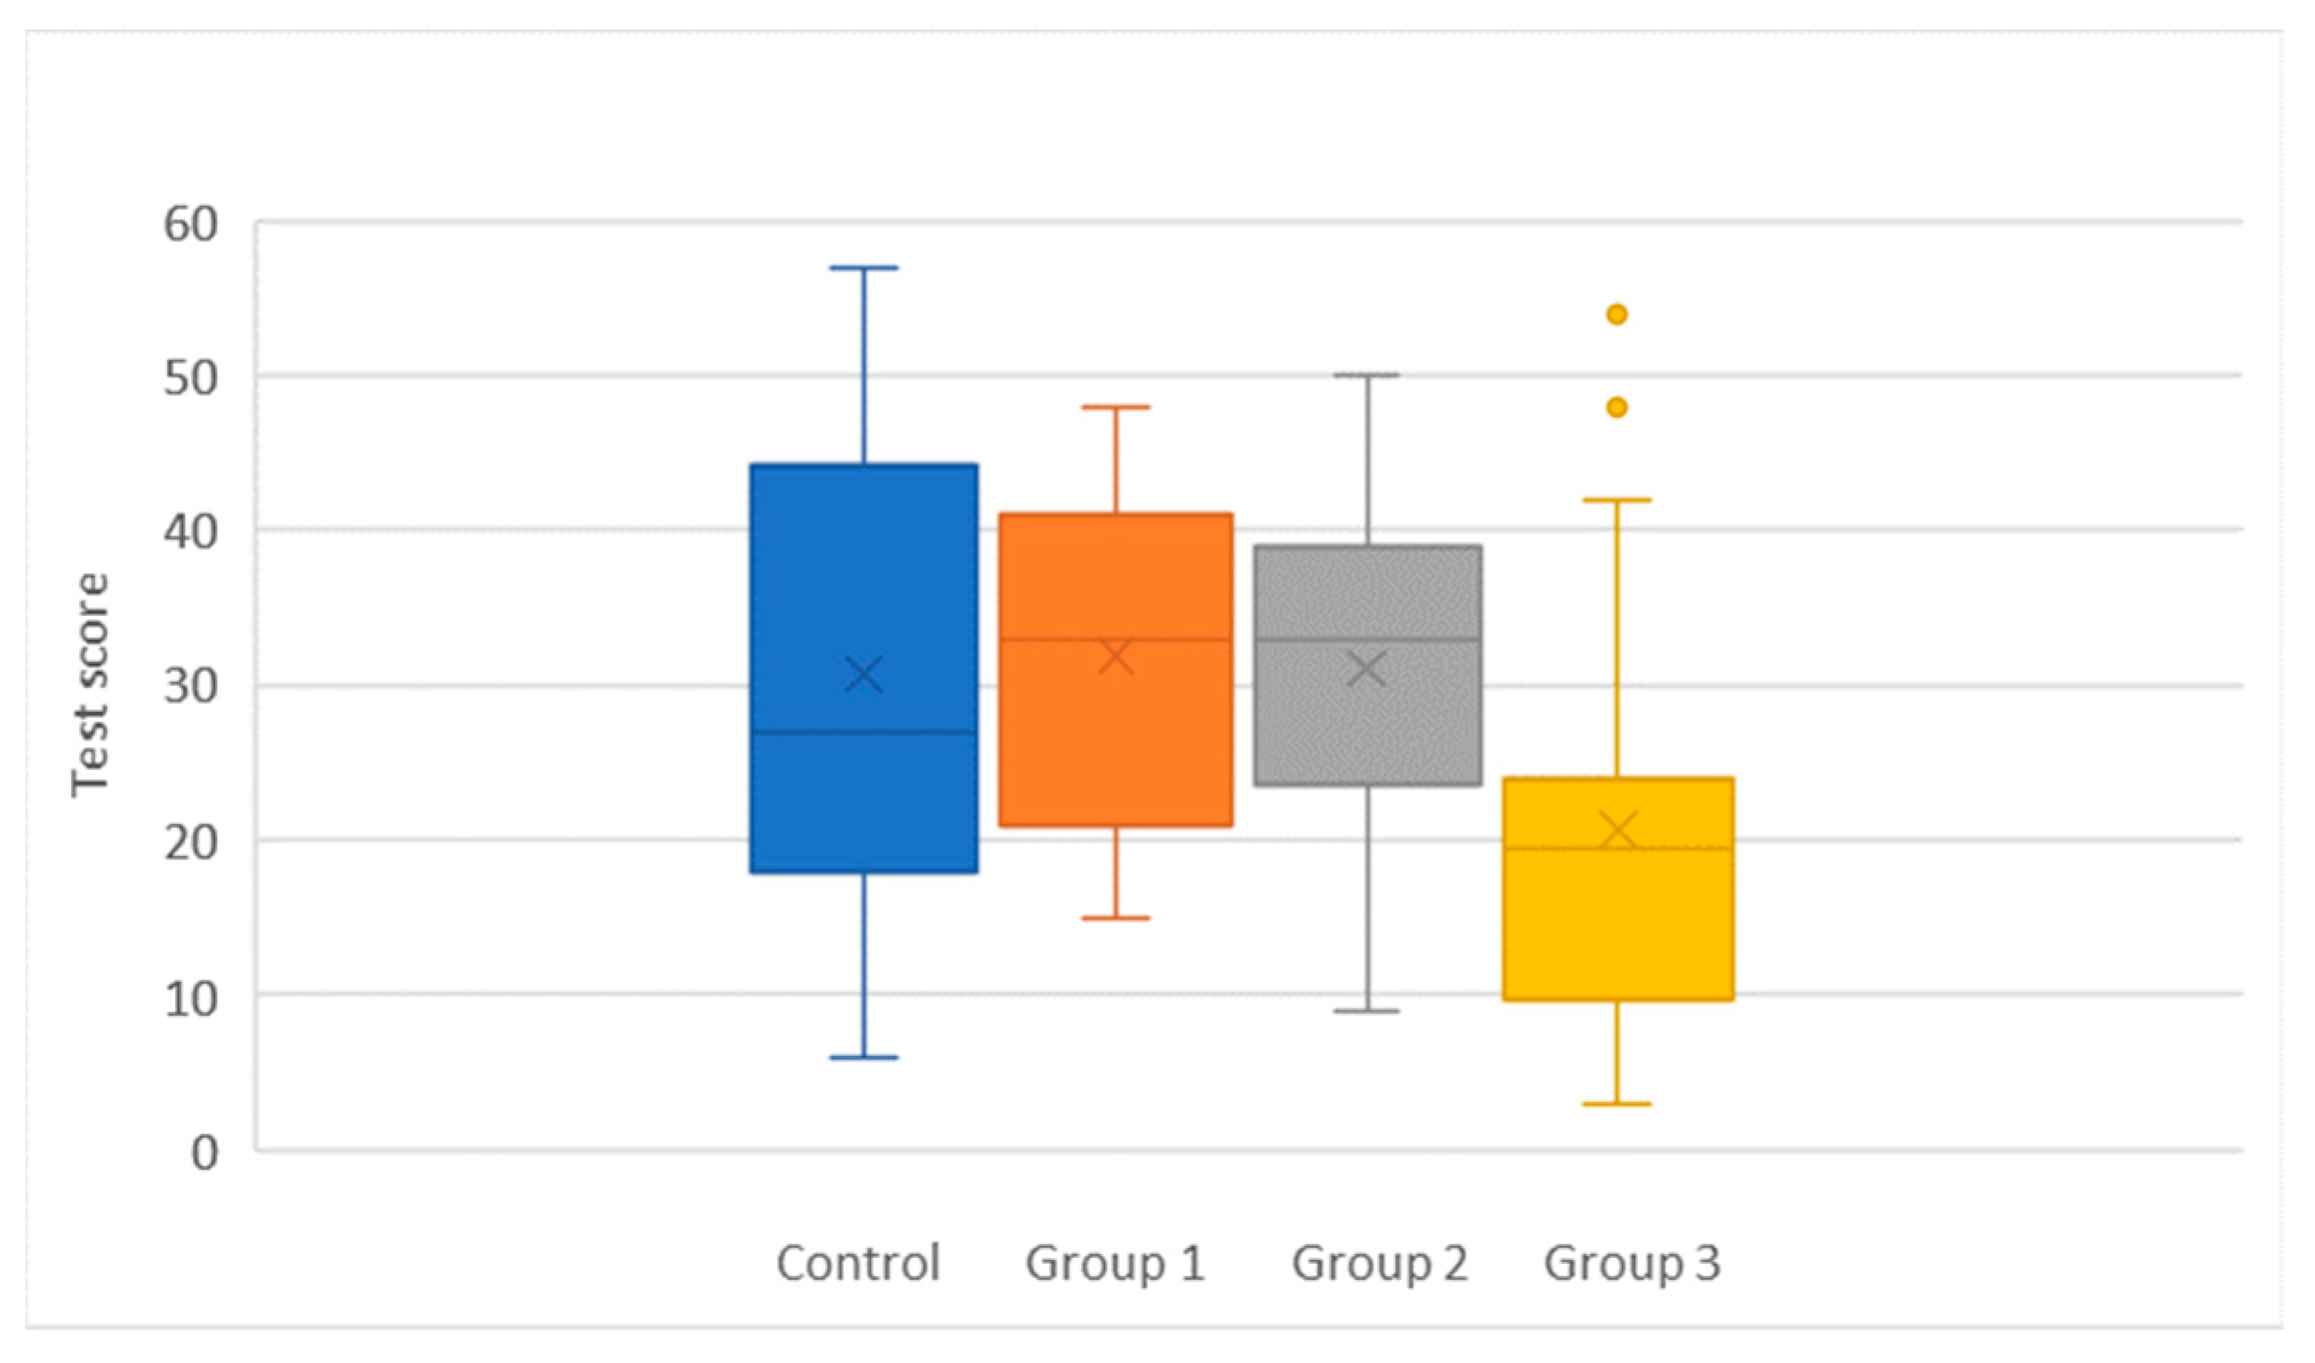
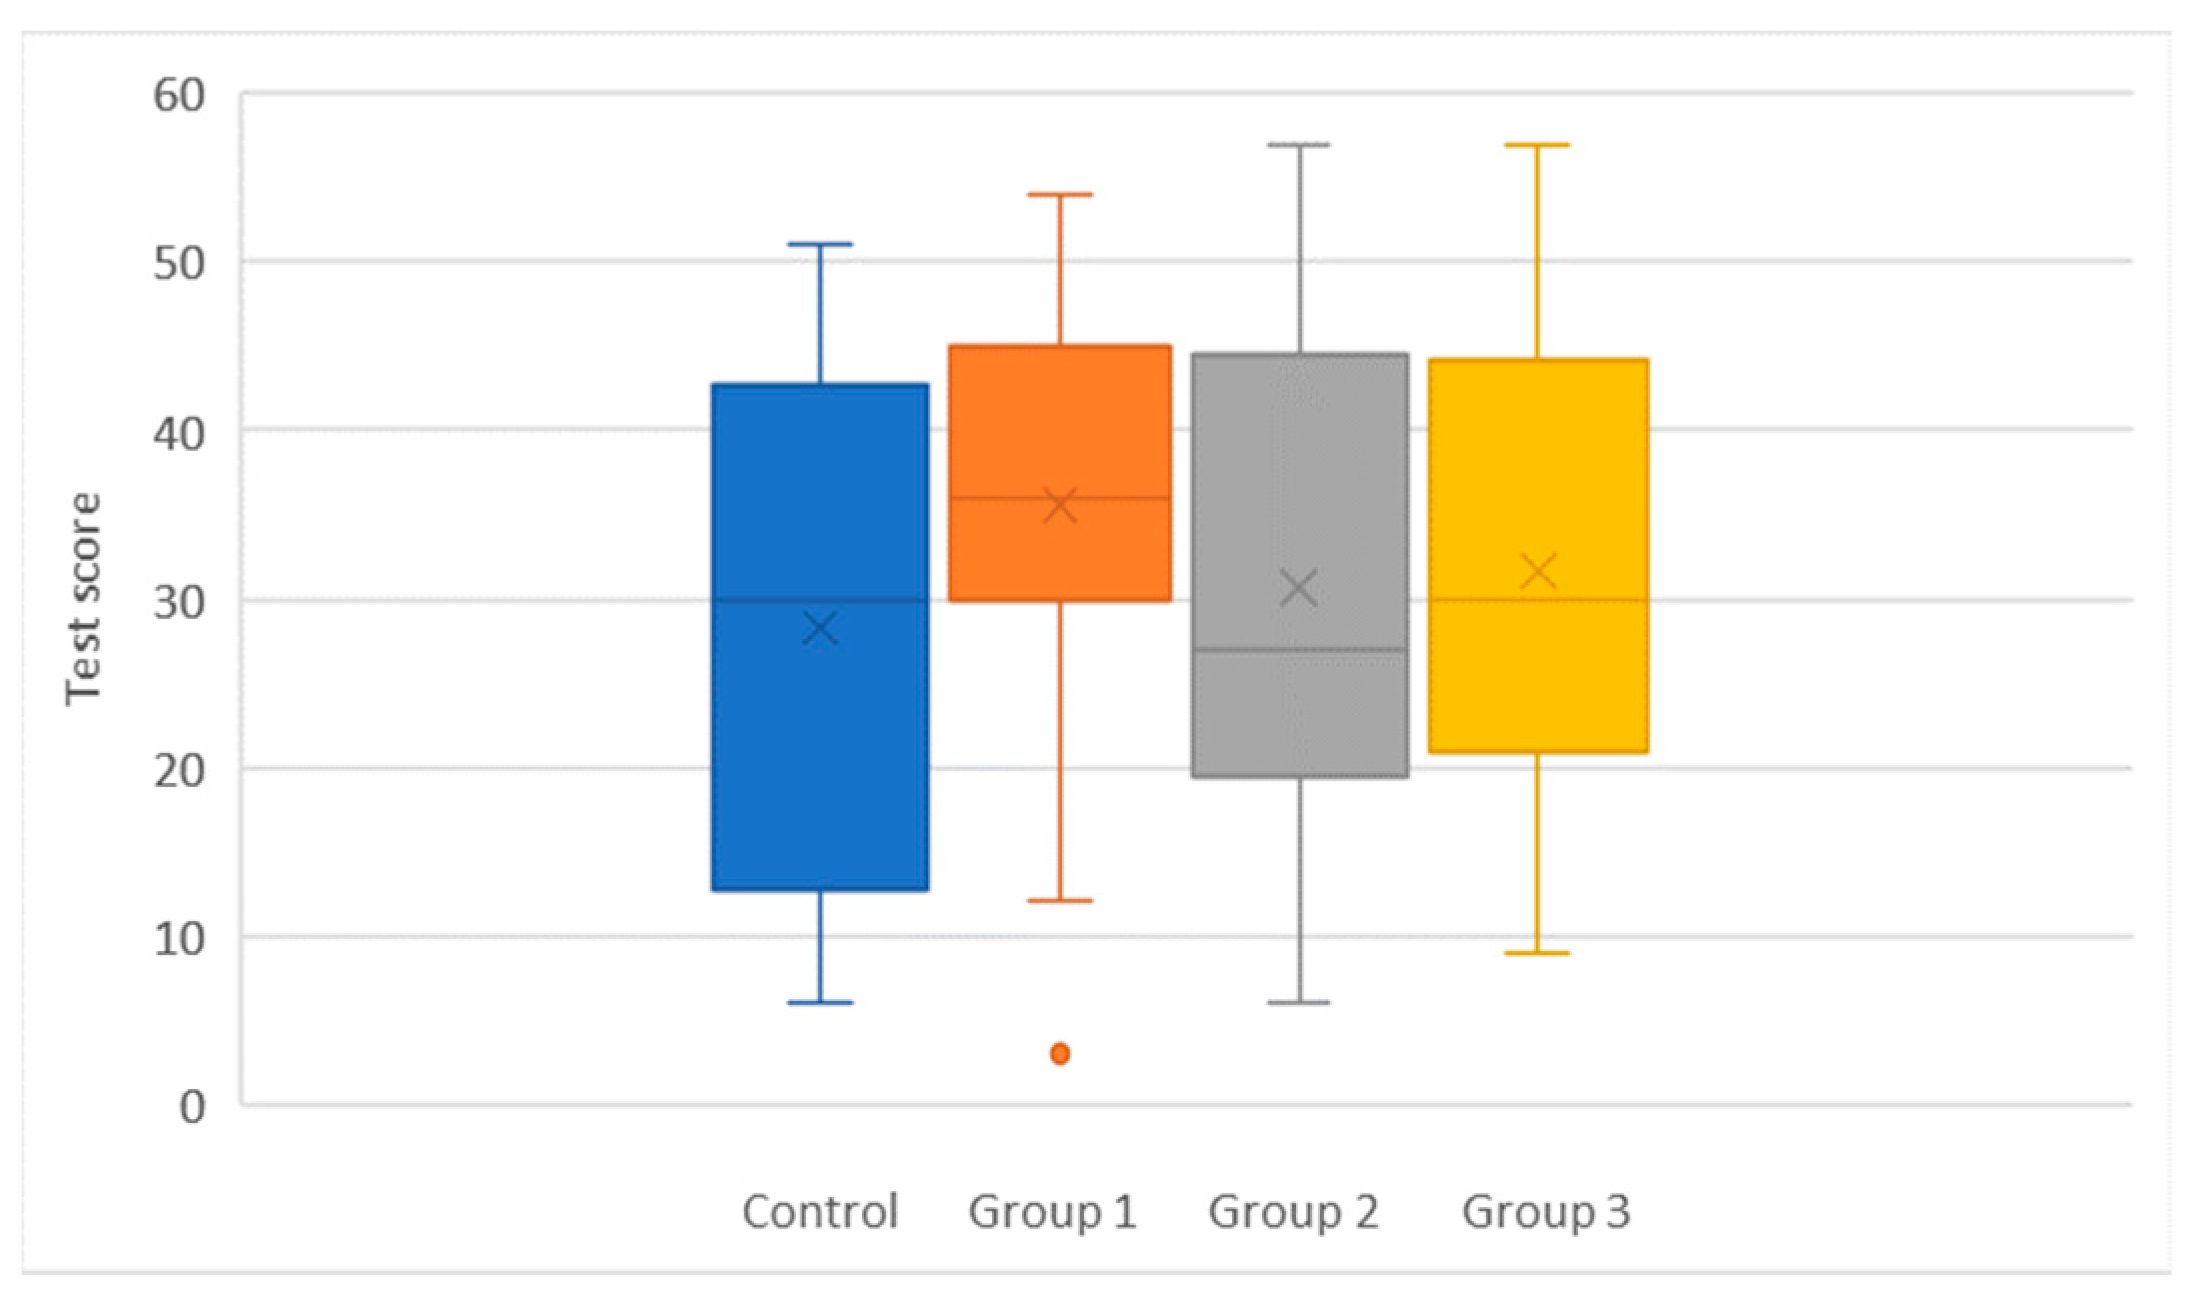
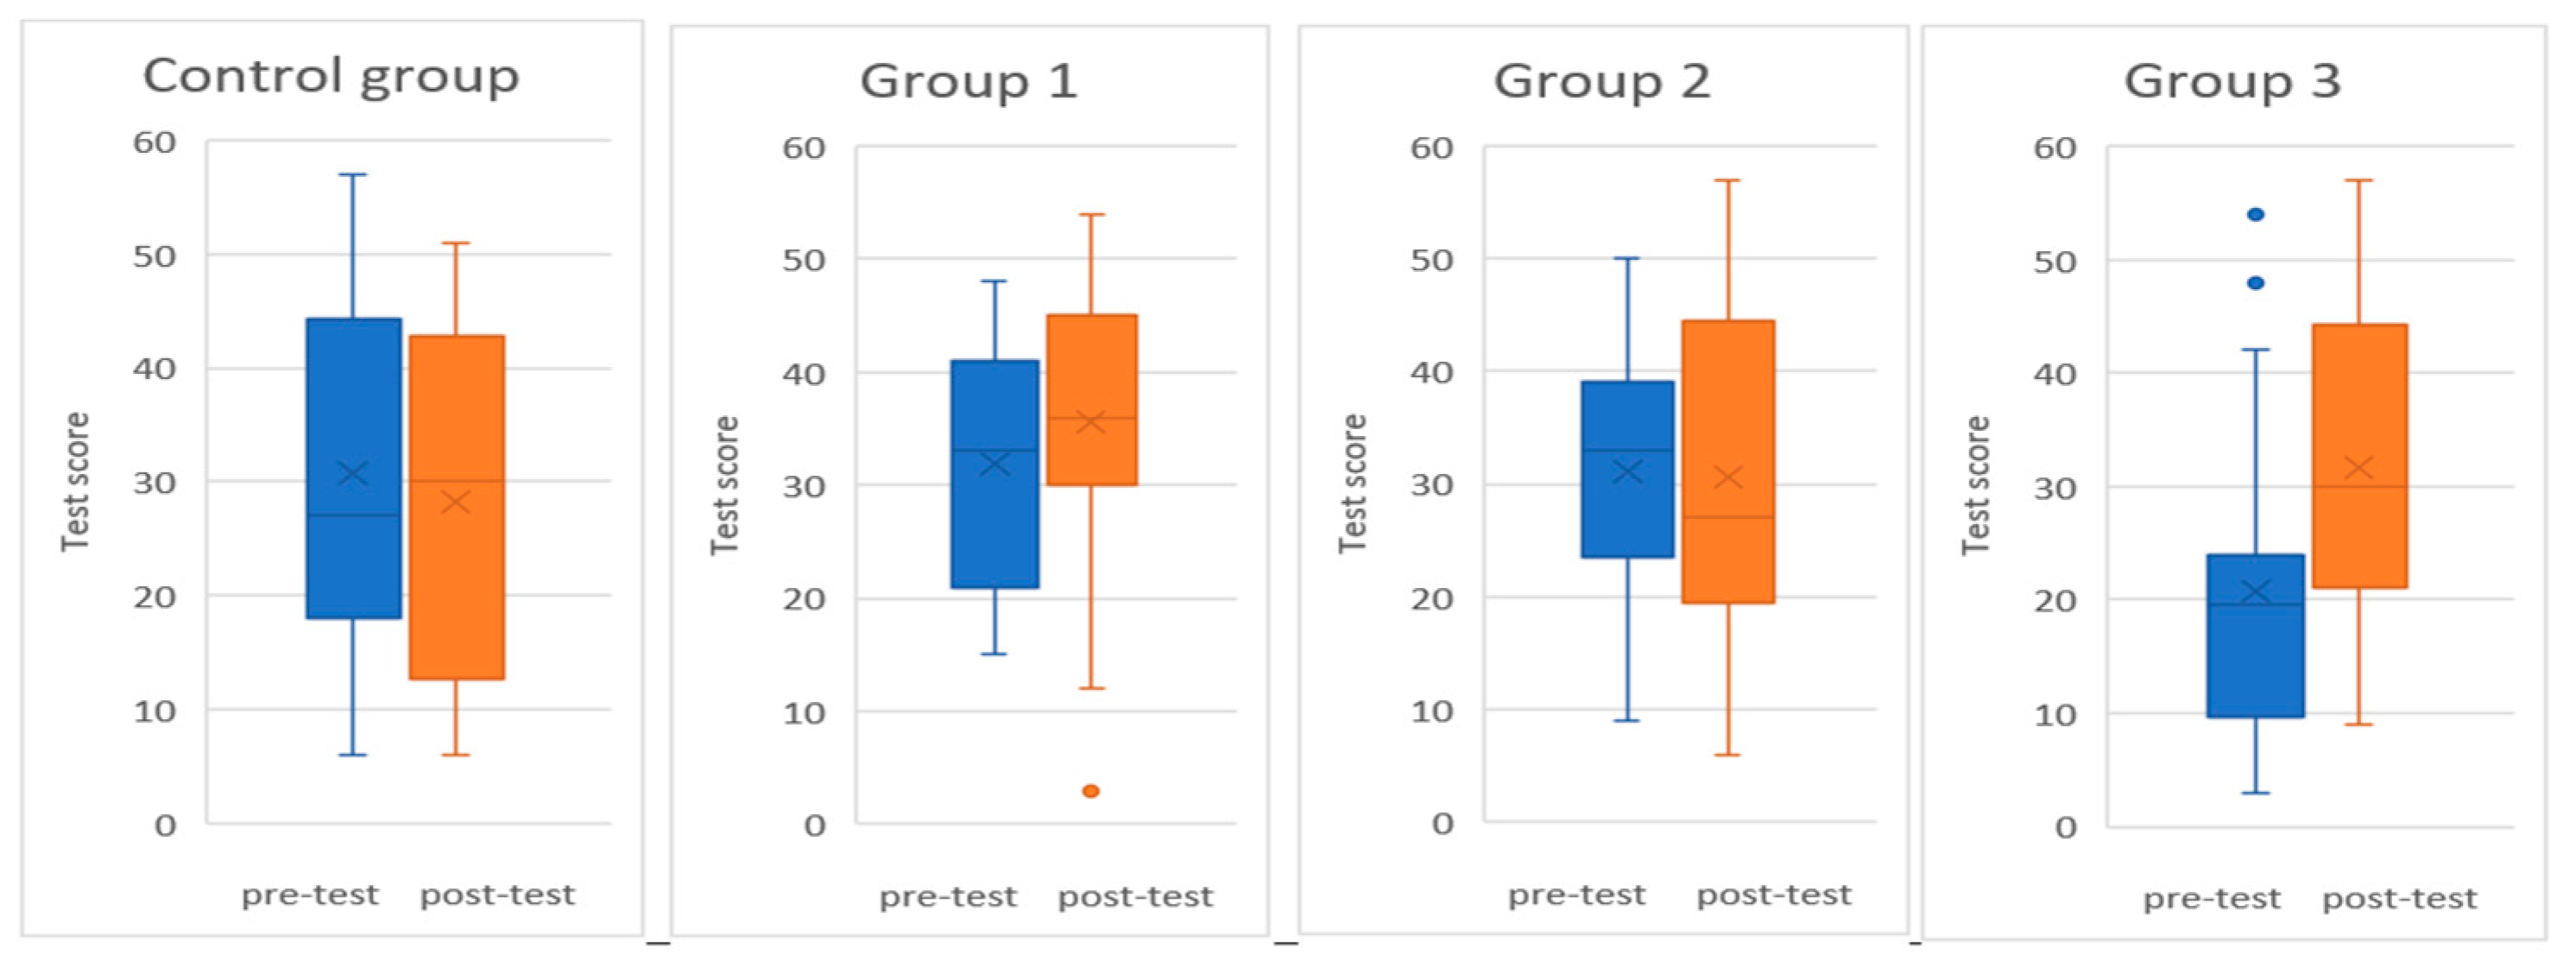
3.2. Differences between Pre-Test and Post-Test

The first analysis involved three experimental groups (1, 2, and 3) and a control group. A pre-test of 23 questions was administered at the beginning of the semester, and a post-test at the end. The points assigned for each correct answer per item, established by PISA, are 0 or 3 for closed questions and 0, 1, 2, or 3 for open questions. The maximum score for this study is 69 points per student, considering that all answers are correct and that the maximum score of 3 points per correct answer is obtained. Students took a pre-test to evaluate the level of mathematical skills they had at the beginning of their first high school semester and after taking classes online in the virtual format during about 12 months of middle school.
Figure 3 shows the comparison between groups in relation to the number of correct answers per group, (x represents the mean, the line represents the median and the bullets represent the outliers). The maximum number of correct answers is 69 points, considering a maximum of 3 points per correct answer.
Following these results, the Kruskal-Wallis H test shows that there was a statistical difference in the median pre-test score (p-value = 0.02) among all groups, and that there is variability concerning the essential mathematical competencies. Table 4 shows the pre-test results of the median between groups.
The Nemenyi test determined that there was a statistical difference in the mean pre-test score of Group 3 compared to the pre-test scores of Groups 1 (p value = 0.036) and 2 (p value = 0.040), which means that group 3 shows a deficiency in the development of essential mathematical skills than the other groups. Table 5 shows the pre-test results of the mean per group using the Nemenyi test.
After a semester of taking classes using the PreparaTec platform (except for the control group), the post-test was taken by all groups at the end of the course. The experimental groups worked with the PreparaTec platform throughout the semester, inside and outside the classroom. During this semester, given the pandemic conditions, the 64 students in the experimental groups took the mathematics course in hybrid format, attending twice a week to face-to-face classes and three days a week in virtual format by zoom. With the use of flipped learning (considered in the construction of PreparaTec), students were able to review the class material in their own space and at their own pace, take notes, practice reflection, and analysis of the information on all those students who had problems with the content of the subject (10). Figure 4 shows the results of the post-test (x represents the mean, the line represents the median and the bullet represents the outlier).
The Kruskal-Wallis H test indicates no statistical difference in median test scores after the post-test, not even with the control group (p-value = 0.4362), indicating that all groups reached the same level of mathematical competence at the end of the semester. Table 6 shows the post-test results of the median between groups.
The Nemenyi test determined that there was no statistical difference in the mean post-test score of Group 3 compared to the pre-test scores of Groups 1 (p value = 0.7503) and 2 (p value = 0.9972), which means that group 3 showed an improvement in the development of essential mathematical skills than the other groups. Table 7 shows the pre-test results of the mean per group using the Nemenyi test.
To compare the pre-test and post-test scores for each group, we used the Mann-Whitney Test for two independent samples for each group, for one and two tails. There were no statistical differences in the means of pre-test and post-tests for the control group (p-value = 0.2915), group 1 (p-value = 0.1060), and group 2 (p-value = 0.3864). Nevertheless, group 3 had a statistical difference with an improvement in mean from pre-test to post-test (p-value = 0.0056), indicating that it reached the same level of mathematical competence at the end of the semester as the other groups. Table 8 shows the pre-test and post-test results of the mean between groups.
Figure 5 shows the pre-test and post-test for each group (x represents the mean, the line represents the median and the bullet represents the outlier). Comparison between groups shows that there were no statistical differences in pre-test and post-test means for the control group (p-value = 0.2915), group 1 (p-value = 0.1060), and group 2 (p-value = 0.3868). There was a statistical difference in pre-test and post-test means for group 3 (p-value = 0.0056).

3.3. Comparison of Total Groups with Other Countries

The second part of the study includes a comparison of the percentage of correct answers with the results of the experimental groups and the percentage of correct answers determined by the OECD and Spain [56]. Twelve items of level 1 competence, eight items of level 2, and three items of level 3 were considered within the 23 items.
We completed the comparison of points by taking the correct answer ratio to the number of the difficulty level of the competition per item. In this comparison, all the experimental groups were considered together. The percentage of correct answers is calculated by adding the number of right questions per student, where the value per correct question corresponds to the value of the level of difficulty per item. So, the sum of correct answers between the level of difficulty gives us the percentage of correct answers, which we can compare with the percentages suggested by the OECD and the results of Spain as a reference [56].
Table 9 shows the percentage of success in level 1 of the selected questions. Level 1 (reproduction, definitions, and calculations) encompasses relatively familiar exercises, where students require: memory retention of mathematical concepts and properties, knowledge of everyday facts and problems, recognition of equivalences, use of routine processes, application of algorithms, handling of expressions with symbols, and performance of simple operations. The results show that in level 1 proficiency, 57% improved in the post-test. This improvement concerns the percentage of success suggested by the OECD, the percentage obtained in the Spanish evaluation, or the percentage of success in the pre-test. We can observe that this improvement relates to difficulty levels 2, 3, and 4, which implies that students can use: algorithms, formulas, conventions, or basic procedures, execute clearly described procedures, including those that require sequential decisions, as well as select and integrate different representations, including symbols, and associating directly to real-world situations [31].
Table 10 shows the percentage of success in level 2 proficiency of the selected PISA items. Level 2 (connections and integration to solve problems) encompasses problems that are not routine but are in familiar or close contexts. They place greater demands on their interpretation and use intermediate levels of complexity for their solution. The student is required to establish relationships for the management of different representations of the same situation.
The results show a 63.6% improvement in the questions with level 2 of competence in the post-test, regarding the percentage of correct answers suggested by the OECD, to the percentage obtained in the Spanish evaluation or relation to the percentage of correct answers in the pre-test. We also observed that the improvement relates to levels 3, 4, 5, and 6 of the degree of difficulty, which implies that students can relate to different sources of information, demonstrate advanced mathematical thinking and reasoning, as well as compare and evaluate adequate strategies for solving complex problems. They can execute clearly described procedures requiring sequential decisions and select and integrate different representations, including symbols and associating directly to real-world situations [31].
Table 11 shows the percentage of success in proficiency level 3 of the selected PISA items. Level 3 (reflection) encompasses understanding, reflection, and creativity on the part of the student to identify and link knowledge from different sources. It involves the explanation or justification of the solution obtained. The results show an improvement of 100% with the questions concerning the percentage of correct answers suggested by the OECD compared to the percentage obtained in the Spanish assessment [18]. We also observed that the improvement relates to levels 4 and 5 of the degree of difficulty, which implies that the student can compare and evaluate adequate strategies for solving complex problems, selecting and integrating different representations, including symbols, and associating directly to real-world situations. However, the improvement in the percentage of success in the questions of level 6 of the degree of difficulty was only reflected in one question out of three, so according to [16], the experiential practice in the solution of problems of everyday life will enable the application of knowledge and skills of mathematics to face novel situations.

4. Discussion

Teaching mathematics requires students to analyze the knowledge acquired and apply it to their real environment. However, this is not easy to achieve. Especially in the current times of contingency, teaching abstract concepts and acquiring these competencies becomes challenging for teachers and educational institutions [13]. In addition, using ICTs became a key tool to maintain distance education during the pandemic, which is necessary to study their impact on student learning [12]. This research aimed to identify the difference in basic mathematical competencies of middle school students when moving to the high school level under pandemic conditions through the practice in the technological platform PreparaTec.
In the first part of the research, the students gradually learned to work autonomously on practice-oriented mathematics activities since, after the pre-test, they worked with the platform in the classroom to show the benefits of its use. The students accepted flipped learning and the fact that learning can be ubiquitous (it can be done anywhere and at any time), which allowed flexibility for the student to access information as often as required at the time needed. Thus, this helped with supporting students who find it difficult to understand certain subjects [54].
In this research, we found that for this study group, in times of pandemic, the student-centered teaching-learning process, combined with innovative educational strategies (flipped learning) mediated by technology (PreparaTec platform), facilitated the development of mathematical competencies. They allowed the student to find the relationship between what was learned and the problem to be solved. These findings coincide with studies by other authors who indicate that this pedagogical strategy favors student learning [49,50,51,53].
As a first finding, the development of mathematical competencies in the classroom could be measured with PISA test items and compared with the OECD percentages of correct answers per question. This comparison can also be made based on points per correct answer per student, with the three proficiency levels of PISA and the six difficulty levels. In this case, we selected the item from a sample of the bank of items released by PISA [56]. The study compared the post-test results with the average percentage determined by the OECD and the results obtained in the Spanish application [56], and the comparison with the results obtained in the pre-test. Under this method, the study shows an improvement in the three proficiency levels under the PISA evaluation scheme. The second finding shows that we found an improvement in the percentage of correct answers in 57% of the level 1 proficiency questions (reproduction, definitions, and calculations), 63.6% in level 2 proficiency (connections and integration to solve problems), and 100% in level 3 proficiency (reflection). Although we found no studies with the PISA test as an instrument for evaluating specific interventions in the classroom, the test measures the recognition and assessment of the skills acquired by the students [28].
The third finding was in experimental group 3, which obtained higher scores in the post-test. Differences between the groups could be seen in the analysis of the median and mean for each group. We observed that experimental group 3 had a significant difference, with an improvement in the mean from pre-test to post-test (p-value = 0.0056), indicating that it reached the same level of mathematical competence at the end of the semester as the other groups.
We consider that this result was due to the teacher–student relationship created in the group throughout the semester. The fact that the students were part of an investigation and the importance this would leave on resuming classes during the pandemic were motivating factors for the students. This relationship influenced the students to do their best in the semester and use the PreparaTec platform. In theory, we could call it “achievement emotions,” directly linked to achievement activities or outcomes [33]. Teachers’ interest in students leads to higher achievement in mathematics teaching, as occurs in high-performing countries [29]. According to Retnawati [57], within the learning process, students should master the development of mathematical skills gradually; the expectation is that the students’ literacy level increases over time.

5. Conclusions

The PISA test is a standardized test measure that compares the results of the education of high school students. Its analysis is generally performed in a macro manner, comparing countries or regions according to different socioeconomic and sociodemographic variables [27]. In this study, we sought to use the questions from the test to identify the competencies obtained by students when participating in an educational experiment through the use of the PreparaTec platform. The results can be valuable for managers, teachers, and mathematics specialists because they propose using active pedagogical strategies facilitated by technologies, and they present an example of how teachers can evaluate the competencies obtained by students once they have received training through these media. The use of the PISA test as an instrument to measure the results of educational innovation is considered novel and appropriate, since no similar studies were found that allowed identifying the change in the achievement of competencies in specific study contexts under pandemic conditions (COVID-19).
It is recommended to review the level 6 degree of difficulty for future studies since the expected results suggested by the OECD were not achieved, at least in the selected PISA items. We believe that the level 6 degree of difficulty leads to the realization of experiential practices to facilitate both the application of mathematical concepts and their understanding of the solution of a real problem [16]. Among the limitations, we have not found studies comparing the results of this level of competence with PISA in the classroom.

Limitations

The results of this study are for this context and this study population and are not intended for generalizations. The study sample comprised 84 participants from a population of 108 students enrolled in the bicultural program at PrepaTec. However, for future research, it would be interesting to consider a more extensive study with a broader population considering the requirements for participants, including parental consent since the students are underage, at 14 to 15 years of age. It must be considered that for this study, we were in a pandemic, and the data collection for the pre-test and post-test was limited to the days when the students were on campus to ensure the same application conditions for all participants. Even though the pandemic conditions did not allow for a more extensive study, we believe that this experimentation sheds light on the use of standardized tests in seeking to measure the impact of an educational innovation such as the PreparaTec platform.

Author Contributions

Conceptualization, B.E.M.-G., A.O.-D. and M.P.-C.; Formal analysis, A.O.-D.; Funding acquisition, B.E.M.-G.; Methodology, B.E.M.-G., A.O.-D. and M.P.-C.; Software, B.E.M.-G.; Supervision, B.E.M.-G. and M.P.-C.; Writing—original draft, B.E.M.-G., A.O.-D. and M.P.-C.; Writing—review & editing, B.E.M.-G., A.O.-D. and M.P.-C. All authors have read and agreed to the published version of the manuscript.

Funding

The authors would like to acknowledge the financial support of NOVUS (Grant number: N19-45), Institute for the Future of Education, Tecnologico de Monterrey, Mexico, in the production of this work. The authors would like to acknowledge the financial support of the Writing Lab, Institute for the Future of Education, Tecnologico de Monterrey, Mexico, in the production of this paper.

Institutional Review Board Statement

Not applicable.

Informed Consent Statement

Informed consent was obtained from all subjects involved in the study.

Data Availability Statement

Not applicable.

Acknowledgments

We acknowledge Maria Elena Cano Ruiz for helping us with the statistical measurements of the investigation, and Karen Astrid Wagner Sinniger for helping us with the spelling and grammar of this manuscript.

Conflicts of Interest

The authors declare no conflict of interest.

References

  1. Contini, D.; Di Tommaso, M.L.; Muratori, C.; Piazzalunga, D.; Schiavon, L. Who lost the most? Mathematics achievement during the COVID-19 pandemic. BE J. Econ. Anal. Policy 2022, 22, 399–408. [Google Scholar] [CrossRef]
  2. García, L. COVID-19 y educación a distancia digital: Preconfinamiento, confinamiento y posconfinamiento. RIED 2021, 24, 9–32. [Google Scholar] [CrossRef]
  3. Government of Mexico. Available online: https://coronavirus.gob.mx/medidas-de-seguridad-sanitaria/ (accessed on 20 March 2022).
  4. Statista. Available online: https://es.statista.com/estadisticas/1196749/estudiantes-afectados-cierre-escuelas-covid-mexico-nivel-educativo/ (accessed on 15 March 2022).
  5. Gonzalez, T.; de la Rubia, M.; Hincz, K.; Comas-Lopez, M.; Subirats, L.; Fort, S.; Sacha, G. Influence of COVID-19 confinement on students’ performance in higher education. PLoS ONE 2020, 15, e0239490. [Google Scholar] [CrossRef] [PubMed]
  6. Pirrone, C.; Di Corrado, D.; Privitera, A.; Castellano, S.; Varrasi, S. Students’ mathematics anxiety at distance and in-person learning conditions during COVID-19 pandemic: Are there any differences? An Exploratory Study. Educ. Sci. 2022, 12, 379. [Google Scholar] [CrossRef]
  7. Rincón-Flores, E.; Mena, J.; López-Camacho, E. Gamification as a teaching method to improve performance and motivation in tertiary education during COVID-19: A research study from Mexico. Educ. Sci. 2022, 12, 49. [Google Scholar] [CrossRef]
  8. Martínez, F.; Jacinto, E.; Montiel, H. The use of online learning environments in higher education as a response to the confinement caused by COVID-19. J. E-Learn. Knowl. Soc. 2021, 17, 10–17. [Google Scholar] [CrossRef]
  9. Condor, H. Educating in times of COVID-19. CienciAmérica 2020, 9, 1–7. [Google Scholar] [CrossRef]
  10. Zhao, Y. COVID-19 as a catalyst for educational change. Prospects 2020, 49, 29–33. [Google Scholar] [CrossRef]
  11. Espinosa, M.P.P.; Cartagena, F.C. Advanced technologies to face the challenge of educational innovation. RIED 2021, 24, 35–53. [Google Scholar] [CrossRef]
  12. Palomares-Ruiz, A.; Cebrián, A.; López-Parra, E.; García-Toledano, E. Influence of ICTs on math teaching–learning processes and their connection to the digital gender gap. Sustainability 2020, 12, 6692. [Google Scholar] [CrossRef]
  13. Dziuban, C.; Graham, C.R.; Moskal, P.D.; Norberg, A.; Sicilia, N. Blended learning: The new normal and emerging technologies. Int. J. Educ. Technol. High Educ. 2018, 15, 38. [Google Scholar] [CrossRef]
  14. Dúo-Terrón, P.; Moreno-Guerrero, A.-J.; Marín-Marín, J.A. ICT motivation in sixth-grade students in pandemic times-the influence of gender and age. Educ. Sci. 2022, 12, 183. [Google Scholar] [CrossRef]
  15. Brunetto, D.; Bernardi, G.; Abdrá, C.; Liljedahl, P. Teaching as a system: COVID-19 as a lens into teacher change. Educ. Stud. Math. 2022, 110, 65–81. [Google Scholar] [CrossRef] [PubMed]
  16. Martínez-Sierra, G.; García-García, J.; Dolores Flores, C. Mathematics should be applied: The mathematical beliefs of secondary school mathematics teachers. Math. Educ. 2019, 31, 92–120. [Google Scholar] [CrossRef]
  17. Lavidas, K.; Apostolou, Z.; Papadakis, S. Challenges and opportunities of mathematics in digital times: Preschool teachers’ views. Educ. Sci. 2022, 12, 459. [Google Scholar] [CrossRef]
  18. Pérez Rojas, F.J. El razonamiento lógico en la enseñanza de las matemáticas. Nextia 2018, 5, 26–28. [Google Scholar]
  19. PISA 2022 Mathematics Framework. Available online: https://pisa2022-maths.oecd.org/ (accessed on 15 April 2022).
  20. Yusupova, N.G.; Skudareva, G.N. Quality Accordingly PISA: From Math Teachers’ Continuing Education to Students’ Mathematical Literacy. In Proceedings of the VI International Forum on Teacher Education (IFTE-2020), Kazan, Russia, 25 November 2020. [Google Scholar] [CrossRef]
  21. Žnidaršič, A.; Brezavšček, A.; Rus, G.; Jerebic, J. Has the COVID-19 pandemic affected mathematics achievement? A case study of university students in social sciences. Mathematics 2022, 10, 2314. [Google Scholar] [CrossRef]
  22. Segbenya, M.; Bervell, B.; Minadzi, V.M.; Asante Somuah, B. Modelling the perspectives of distance education students towards online learning during COVID-19 pandemic. Smart Learn. Environ. 2022, 9, 13. [Google Scholar] [CrossRef]
  23. Sampedro Requena, B.E.; Maldonado Berea, G.A. Valoraciones de los estudiantes mexicanos y españoles sobre el uso de las TIC como recurso para trabajar la educación inclusiva. Bordón 2017, 69, 89–106. [Google Scholar] [CrossRef]
  24. Huang, H.K. Implementing a theory-driven gamification model in higher education flipped courses: Effects on out-of-class activity completion and quality of artifacts. Comput. Educ. Int. J. 2018, 125, 255–257. [Google Scholar] [CrossRef]
  25. Mahfuzah, M.S. Gamification approaching education to increase learning engagement. Int. J. Humanit. Soc. Sci. 2018, 4, 22–32. [Google Scholar] [CrossRef]
  26. OECD. PISA 2012 Results: What Students Know and Can Do—Student Performance in Mathematics, Reading and Science (Volume I, Revised edition, February 2014); OECD Publishing: Paris, France, 2014. [Google Scholar] [CrossRef]
  27. OECD. PISA 2012 Results in Focus. What Students Know at Age 15 and What They Can Do with What They Know. Available online: https://www.oecd.org/pisa/keyfindings/PISA2012_Overview_ESP-FINAL.pdf (accessed on 30 July 2022).
  28. Hernández-Fernández, J. Admission and academic selection in upper secondary education. Arch. Analíticos Políticas Educ. 2021, 29, 1–29. [Google Scholar] [CrossRef]
  29. Skipp, C.S.; Dommett, E.J. Understanding and addressing the deficiencies in UK mathematics education: Taking an international perspective. Educ. Sci. 2021, 11, 141. [Google Scholar] [CrossRef]
  30. Mora, C.D. Strategies for learning and teaching mathematics. J. Pedagogy 2003, 24, 181–272. [Google Scholar]
  31. Ramírez-Montoya, M.S.; Loaiza-Aguirre, M.I.; Zúñiga-Ojeda, A.; Portuguez-Castro, M. Characterization of the teaching profile within the framework of education 4.0. Future Internet 2021, 13, 91. [Google Scholar] [CrossRef]
  32. Gamal, C.E.; Casas, J.A.; Pérez, C.; Ortega-Ruíz, R. Teaching and learning Mathematics: The need for a multidisciplinary analysis. Psychol. Soc. Educ. 2017, 9, 1–10. [Google Scholar] [CrossRef]
  33. Pekrun, R. The control-value theory of achievement emotions: Assumptions, corollaries, and implications for educational research and practice. Educ. Psychol. Rev. 2006, 18, 315–341. [Google Scholar] [CrossRef]
  34. Robertson, S.L. Provincializing the OECD-PISA global competences project. Glob. Soc. Educ. 2021, 19, 167–182. [Google Scholar] [CrossRef]
  35. Osuna, C.; Díaz, K. Mathematics learning achievement in PISA, ENLACE and PLANEA in Mexican adolescents. A retrospective analysis. Arch. Analíticos Políticas Educ. 2019, 28, 3. [Google Scholar] [CrossRef]
  36. PISA 2013, Prueba de Matemáticas y Solución de Problemas. Available online: https://drive.google.com/file/d/16fYvZGzBUVRgje5pB_8Lr-ZKGwE4LjvM/view (accessed on 26 June 2022).
  37. OECD’s PISA Program. Available online: https://www.oecd.org/pisa/39730818.pdf (accessed on 10 March 2022).
  38. Programa para la Evaluación Internacional de Alumno. Informe PISA 2003, Aprender Para el Mundo del Mañana. Available online: https://www.oecd.org/pisa/39732493.pdf (accessed on 26 June 2022).
  39. Green, A.; Pensiero, N. The effects of upper-secondary education and training systems on skills inequality. A quasi-cohort analysis using PISA 2000 and the OECD survey of adult skills. Br. Educ. Res. J. 2016, 42, 756–779. [Google Scholar] [CrossRef]
  40. Sortkær, B.; Reimer, D. Classroom disciplinary climate of schools and gender—Evidence from the Nordic countries. Sch. Eff. Sch. Improv. 2018, 29, 511–528. [Google Scholar] [CrossRef]
  41. Boman, B. PISA Achievement in Sweden from the perspective of both individual data and aggregated cross-country data. Front. Educ. 2022, 6, 753347. [Google Scholar] [CrossRef]
  42. Basarkod, G.; Marsh, H.W.; Parker, P.D.; Dicke, T.; Guo, J. The immigrant paradox and math self-concept: An SES-of-origin-country hypothesis. Learn. Instr. 2022, 77, 101539. [Google Scholar] [CrossRef]
  43. Beneito, P.; Vicente-Chirivella, Ó. Banning mobile phones in schools: Evidence from regional-level policies in Spain. Appl. Econ. 2022; Ahead of print. [Google Scholar] [CrossRef]
  44. Divjak, B.; Rienties, B.; Iniesto, F.; Vondra, P.; Zĭzăk, M. Flipped classrooms in higher education during the COVID-19 pandemic: Findings and future research recommendations. Int. J. Educ. Technol. High Educ. 2022, 19, 9. [Google Scholar] [CrossRef]
  45. Ospina Espinal, Y.A.; Galvis López, J. The paradigm of traditional education towards a virtual curricular approach. Virtualmente 2016, 3, 4–29. [Google Scholar]
  46. Nederveld, A.B. Flipped learning in the workplace. J. Workplace Learn. 2015, 27, 162–172. [Google Scholar] [CrossRef]
  47. Prieto, M.A. Flipped Learning: Aplicar el Modelo de Aprendizaje Inverso; Narcea: Madrid, Spain, 2017. [Google Scholar]
  48. Ramírez-Montoya, M.S.; Andrade-Vargas, L.; Rivera-Rogel, D.; Portuguez-Castro, M. Trends for the future of education programs for professional development. Sustainability 2021, 13, 7244. [Google Scholar] [CrossRef]
  49. Strelan, P.; Osborn, A.; Palmer, E. The flipped classroom: A meta-analysis of effects on student performance across disciplines and education levels. Educ. Res. Rev. 2020, 30, 100314. [Google Scholar] [CrossRef]
  50. Van Alten, D.C.D.; Phielix, C.; Janssen, J.; Kester, L. Effects of flipping the classroom on learning outcomes and satisfaction: A meta-analysis. Educ. Res. Rev. 2019, 28, 100281. [Google Scholar] [CrossRef]
  51. Zainuddin, Z.; Haruna, H.; Li, X.; Zhang, Y.; Chu, S.K.W. A systematic review of flipped classroom empirical evidence from different fields: What are the gaps and future trends? Horizon 2019, 27, 72–86. [Google Scholar] [CrossRef]
  52. Yang, Q.F.; Lin, C.J.; Hwang, G.J. Research focuses and findings of flipping mathematics classes: A review of journal publications based on the technology-enhanced learning model. Interact. Learn. Environ. 2021, 29, 905–938. [Google Scholar] [CrossRef]
  53. Fornons, J.V.; Palau, M.R. Flipped classroom in mathematics education: A systematic review. Educ. Knowl. Soc. (EKS) 2021, 22, 1–11. [Google Scholar] [CrossRef]
  54. Bergmann, J.S.; Sams, A. Flip Your Classroom: Reach Every Student in Every Classroom Every Day, 1st ed.; International Society for Technology in Education: Eugene, OR, USA, 2012. [Google Scholar]
  55. Portuguez Castro, M. El aula invertida como estrategia didáctica en educación superior. In Educación y Aprendizaje Significativo Durante la Pandemia de COVID 19; Venteño Jaramillo, G., Bethzabe, R.T., Eds.; UNAM: Oaxaca, Mexico, 2021; pp. 89–94. [Google Scholar]
  56. Inee, PISA Stimuli Released. Available online: http://recursostic.educacion.es/inee/pisa/ (accessed on 26 June 2022).
  57. Retnawati, H.; Wulandari, N.F. The development of students’ mathematical literacy proficiency. Probl. Educ. 21st Century 2019, 77, 502–514. [Google Scholar] [CrossRef]
Figure 1. Student view of the PreparaTec platform (Source: Authors’ own elaboration).
Education 12 00546 g001
Figure 2. Basic concepts videos (Source: Authors’ own elaboration).
Education 12 00546 g002
Figure 3. Pre-test scores of students in control and experimental groups.
Education 12 00546 g003
Figure 4. Post-test scores of students in control and experimental groups.
Education 12 00546 g004
Figure 5. Comparison between test score distributions of control group, group 1, group 2, and group 3 in pre-test and post-test (Source: Authors’ own elaboration).
Education 12 00546 g005
Table 1. Topics, learning objectives, resources, and evaluation that are handled in the PreparaTec platform (Source: Authors’ own creation).
AreaTopicsLearning ObjectivesLearning and Assessment Resource for all topics
Arithmetic and AlgebraBasic operations, fractions, real numbers, decimals, successions, equations, percentages, hierarchy of operationsReproducing representations, definitions and facts.
  • Multiple choice exercises
  • Videos by topic
  • Team analysis exercises
  • The evaluation of the exercises is one point by correct answer
Functions and GraphsLinear functions, table analysisInterpretation of problem situations and mathematical statements, using multiple well-defined methods.
GeometryAreas, perimeters and volumeEngaging in simple mathematical Reasoning.
Descriptive statisticsHistograms, mean, median and modeReflecting on, and gaining insight into, mathematics and constructing original mathematical approaches.
Combinations and ProbabilityCombinations, estimation of quantities
Table 2. Evaluation instrument with the mathematical competencies and their relationship with the areas to be evaluated. Adapted from [56].
Item NameNumber of QuestionsLevel of CompetenceProficiency LevelArea
Walking2Level 1 (Reproduction), level 2 (Connections)level 5 (611), level 6 (723), level 5 (666)Arithmetic and Algebra
Cubes1Level 1 (Reproductionlevel 2 (478)Arithmetic and Algebra
Coloured Candies1Level 1 (Reproductionlevel 4 (549)Combinations and Probability
Science Tests1Level 1 (Reproductionlevel 4 (556)Descriptive statistics
Growing Up3Level 1 (Reproduction), level 2 (Connections)level 2 (477), level 4 (574), level 3 (525), level 1 (420)Functions and Graphs
Exchange Rate3Level 1 (Reproduction), level 2 (Connections), Level 3 (Reflection)level 1 (406), level 2 (439), leve 4 (586)Arithmetic and Algebra
Skateboard3Level 1 (Reproduction), level 2 (Connections)Level 3 (496), level 2 (464), level 4 (570), level 4 (554)Combinations and Probability
Table Tennis Tournament1Level 1 (ReproductionPilot testCombinations and Probability
Shoes for Kids1Level 1 (ReproductionPilot testArithmetic and Algebra
Robberies1Level 2 (Connections)Level 6 (694), level 4 (577)Functions and Graphs
Carpenter1Level 2 (Connections)level 6 (687)Functions and Graphs
Chat2Level 2 (Connections), Level 3 (Reflection)Level 3 (533), level 5 (636)Arithmetic and Algebra
Shelving1Level 2 (Connections)level 3 (499)Arithmetic and Algebra
Fair1Level 2 (Connections)Pilot TestCombinations and Probability
Earthquake1Level 3 (Reflection)level 4 (557)Combinations and Probability
Table 3. Proficiency levels of mathematical competence established by PISA. Adapted with permission from Ref. [56], 2013, OECD, INEE.
Proficiency LevelExample of a PISA ItemWhat Is Assessed at Each Level
Level 6
more than 668 points
Walking
Question 2
scoring 3 (723)
Conceptualise, generalise, and utilise information; are capable of advanced mathematical thinking and reasoning; have a mastery of symbolic and formal mathematical operations and relationships; formulate and precisely communicate their findings, interpretations, and arguments. Example: Bernard knows his pacelength is 0.80 metres. The formula applies to Bernard’s walking. Calculate Bernard’s walking speed in metres per minute and in kilometres per hour. Show your working out.
Level 5
607 to 668 points
Walking
Question 1
scoring 2 (666)
Develop and work with models for complex situations; select, compare, and evaluate appropriate problem-solving strategies for dealing with complex problems; work strategically using broad, well-developed thinking and reasoning skills; reflect on their actions and formulate and communicate their interpretations and reasoning. Example: ¿If the formula applies to Heiko’s walking and Heiko takes 70 steps per minute, what is Heiko’s pacelength? Show your work.
Level 4
545 to 606 points
Coloured Candies
Question 1
Scoring 3 (549)
Work effectively with explicit models for complex concrete situations; select and integrate different representations, including symbolic ones; utilise well-developed skills and reason flexibly; construct and communicate explanations and arguments. Example: Robert’s mother lets him pick one candy from a bag. He can’t see the candies. The number of candies of each colour in the bag is shown in the following graph.
Level 3
483 to 544 points
Skateboard
Question 1
Scoring 3 (496)
Execute clearly described procedures, including those that require sequential decisions; select and apply simple problem-solving strategies; interpret and use representations; develop short communications reporting these. Example: Eric is a great skateboard fan. He visits a shop named SKATERS to check some prices. At this shop you can buy a complete board. Or you can buy a deck, a set of 4 wheels, a set of 2 trucks and a set of hardware and assemble your own board. Eric wants to assemble his own skateboard. What is the minimum price and the maximum price in this shop for self-assembled skateboards?
Level 2
421 to 482 points
Exchange Rate
Question 2
Scoring 3
(439)
Interpret and recognise situations in contexts that require no more than direct inference; extract relevant information from a single source and make use of a single representational mode; employ basic procedures; make literal interpretations of the results. Example: On returning to Singapore after 3 months, Mei-Ling had 3 900 ZAR left. She changed this back to Singapore dollars, noting that the exchange rate had changed to: 1 SGD = 4.0 ZAR How much money in Singapore dollars did Mei-Ling get?
Level 1
358 to 420 points
Growing Up
Question 3
Scoring 2
(420)
Answer questions involving familiar contexts where all relevant information is present, and the questions are clearly defined; identify information and carry out routine procedures according to direct instructions in explicit situations; perform actions that are obvious and follow immediately from the given stimuli. Example: Explain how the graph shows that on average the growth rate for girls slows down after 12 years of age.
Below Level 1less than 358 pointsNot demonstrate even the most basic types of mathematical literacy that PISA measures. These students are likely to be seriously disadvantaged in their lives beyond school.
Table 4. Analysis of the median using the Kruskal-Wallis H test after applying the pre-test. (Source: Authors’ elaboration).
Pre-Test Data AnalysisControl GroupGroup 1Group 2Group 3
median27333319.5
rank sum905928.51181555.5
count2019252084
r2/n40,951.2545,374.328955,790.4415,429.0125157,545.031
H-stat 9.78156546
H-ties 9.80628719
df 3
p-value 0.02028661
α 0.05
sig yes
Table 5. Analysis of the mean using the Nemenyi test after applying the pre-test (Source: Authors’ own elaboration).
Group AGroup BR MeanStd ErrQ-Statp-ValueR-Crit
Control GroupGroup 13.618421055.525657860.654839870.9670376120.1465485
Control GroupGroup 21.995.174456490.384581450.9929640818.8660684
Control GroupGroup 317.4755.454356063.203861250.107653819.8865822
Group 1Group 21.628421055.249561390.310201350.9962717919.1399008
Group 1Group 321.09342115.525657863.817359240.0360836120.1465485
Group 2Group 319.4655.174456493.761747740.0401802918.8660684
Table 6. Analysis of the median using the Kruskal-Wallis H test after applying the post-test. (Source: Authors’ own elaboration).
Post-Test Data AnalysisControl Group Group 1 Group 2Group 3
median30362730
rank sum7549511020845
count2019252084
r2/n28,425.847,600.052641,61635,701.25153,343.103
H-stat 2.71950022
H-ties 2.72371941
df 3
p-value 0.43621147
α 0.05
sig no
Table 7. Analysis of the mean using the Nemenyi test after applying the post-test (Source: Authors’ own elaboration).
Group 1Group 2R MeanStd ErrQ-Statp-ValueR-Crit
Control GroupGroup 1 12.35263165.525657862.235504240.3905967520.1465485
Control GroupGroup 23.15.174456490.599096740.9744295618.8660684
Control GroupGroup 34.555.454356060.834195630.9351300219.8865822
Group 1Group 29.252631585.249561391.762553270.5976503619.1399008
Group 1Group 37.802631585.525657861.412072880.7503338420.1465485
Group 2Group 31.455.174456490.280222670.9972424518.8660684
Table 8. Analysis of the mean using the Mann-Whitney Test after applying the pre and post-test (Source: Authors’ own elaboration).
Data AnalysisControl Grupo Pre-testControl Group Post-testGroup 1 Pre-TestGroup 1 Post-TestGroup 2 Pre-TestGroup 2 Post-TestGroup 3 Pre-TestGroup 3 Post-Test
count2020191925252020
median27303336332719.530
rank sum430.5389.5327.5413.5652.5622.5317.5502.5
U179.5220.5223.5137.5297.5327.5292.5107.5
one tailtwo tailsone tailtwo tailsone tailtwo tailsone tailtwo tails
U179.5 137.5 297.5 107.5
mean200 180.5 312.5 200
std dev36.879916ties34.1795735ties51.5016841ties36.8068416ties
z-score0.54230058yates1.24343272yates0.28154419yates2.4995353yates
effect r0.08574525 0.20171142 0.03981636 0.39521123
p-norm0.293805730.587611450.106854210.213708420.389146520.778293040.006217820.01243563
p-exact0.291557110.583114230.106002380.212004750.386493090.772986180.005603380.01120677
Table 9. Comparison of the percentage of success for level 1 of competence of the experimental group, compared to the OECD and Spain. Adapted from [56].
Item NameScoringLevels of Performance% Correct OECD% Correct Spain% Correct Pre-Test % Correct Post-Test
Cubes3level 2 (478)69.0%72.5%76.56%82.81%
(Q1) Growing Up3level 2 (477)67.0%66.5%81.25%70.31%
Shoes for Kids3Pilot TestPilot TestPilot Test51.56%68.75%
Coloured Candies3level 4 (549)50.2%42.1%50.00%64.06%
(Q3) Growing Up3level 3 (525)54.7%62.4%70.31%62.50%
Science Tests3level 4 (556)46.8%30.4%29.69%40.63%
Table Tennis Tournament3Pilot TestPilot TestPilot Test32.81%40.63%
(Q1) Skateboard2level 2 (464)10.6%10.1%7.81%14.06%
(Q1) Walking3level 5 (611)36.3%38.4%18.75%12.50%
(Q3) Growing Up2level 1 (420)28.1% 19.2%0.00%0.00%
(Q1) Skateboard3level 3 (496)66.7%66.6%23.44%29.69%
(Q2) Skateboard3level 4 (570)45.5%43.0%15.63%35.94%
(Q1) Exchange Rate2level 1 (406)79.7% 79.0%64.06%56.25%
(Q2) Exchange Rate3level 2 (439)73.9%72.0%51.56%46.88%
Table 10. Comparison of the percentage of success for level 2 of competence of the experimental group, compared to the OECD and Spain. Adapted from [56].
Item NameScoringLevels of Performance% Correct OECD% Correct Spain% Correct Pre-Test% Correct Post-Test
(Q2) Walking2level 5 (666)9.00%8.30%7.81%15.63
Shelving3level 3 (499)60.90%57.00%42.19%60.94%
(Q1) Chat3level 3 (533)53.70%46.00%50.00%48.40%
(Q2) Growing Up3level 4 (574)44.80%36.50%29.69%43.75%
Robberies3level 6 (694)15.40%9.90%31.25%35.94%
Carpenter3level 6 (687)20.00%12.90%9.38%14.06%
Fair3Pilot TestPilot TestPilot Test40.63%73.44%
(Q3) Skateboard3level 4 (554)49.80%46.00%17.19%34.38%
(Q2) Walking1level 4 (605)19.90%23.70%0%6.25%
Robberies2level 4 (577)28.10%31.30%1.56%6.24%
(Q2) Walking3level 6 (723)8.00%7.50%9.38%0%
Table 11. Comparison of the percentage of success for level 3 of competence of the experimental group, compared to the OECD and Spain. Adapted from [56].
Item NameScoringLevels of Performance% Correct OECD% Correct Spain% Correct Pre-Test % Correct Post-Test
(Q2) Chat3level 5 (636)28.80%21.60%40.63%28.13%
(Q3) Exchange Rate3level 4 (586)40.30%30.30%45.31%39.06%
Earthquake3level 4 (557)46.50%38.80%34.38%43.75%
Publisher’s Note: MDPI stays neutral with regard to jurisdictional claims in published maps and institutional affiliations.

