Article

Sentiment Analysis and Topic Modeling on Tweets about Online Education during COVID-19

1
Department of Computer Science, Khwaja Fareed University of Engineering and Information Technology, Rahim Yar Khan 64200, Pakistan
2
Department of Computer Science, Broward College, Broward County, FL 33332, USA
3
Division of Business Administration and Economics, Morehouse College, Atlanta, GA 30314, USA
4
Department of Computer Science, College of Computer Science and Engineering, Taibah University, Medina 42353, Saudi Arabia
5
Department of Information and Communication Engineering, Yeungnam University, Gyeongsan 38541, Korea
*
Authors to whom correspondence should be addressed.
Primary Authors (These authors contributed equally to this work).
Appl. Sci. 2021, 11(18), 8438; https://doi.org/10.3390/app11188438
Submission received: 30 August 2021 / Revised: 6 September 2021 / Accepted: 6 September 2021 / Published: 12 September 2021

Abstract

:
Amid the worldwide COVID-19 pandemic lockdowns, the closure of educational institutes leads to an unprecedented rise in online learning. For limiting the impact of COVID-19 and obstructing its widespread, educational institutions closed their campuses immediately and academic activities are moved to e-learning platforms. The effectiveness of e-learning is a critical concern for both students and parents, specifically in terms of its suitability to students and teachers and its technical feasibility with respect to different social scenarios. Such concerns must be reviewed from several aspects before e-learning can be adopted at such a larger scale. This study endeavors to investigate the effectiveness of e-learning by analyzing the sentiments of people about e-learning. Due to the rise of social media as an important mode of communication recently, people’s views can be found on platforms such as Twitter, Instagram, Facebook, etc. This study uses a Twitter dataset containing 17,155 tweets about e-learning. Machine learning and deep learning approaches have shown their suitability, capability, and potential for image processing, object detection, and natural language processing tasks and text analysis is no exception. Machine learning approaches have been largely used both for annotation and text and sentiment analysis. Keeping in view the adequacy and efficacy of machine learning models, this study adopts TextBlob, VADER (Valence Aware Dictionary for Sentiment Reasoning), and SentiWordNet to analyze the polarity and subjectivity score of tweets’ text. Furthermore, bearing in mind the fact that machine learning models display high classification accuracy, various machine learning models have been used for sentiment classification. Two feature extraction techniques, TF-IDF (Term Frequency-Inverse Document Frequency) and BoW (Bag of Words) have been used to effectively build and evaluate the models. All the models have been evaluated in terms of various important performance metrics such as accuracy, precision, recall, and F1 score. The results reveal that the random forest and support vector machine classifier achieve the highest accuracy of 0.95 when used with Bow features. Performance comparison is carried out for results of TextBlob, VADER, and SentiWordNet, as well as classification results of machine learning models and deep learning models such as CNN (Convolutional Neural Network), LSTM (Long Short Term Memory), CNN-LSTM, and Bi-LSTM (Bidirectional-LSTM). Additionally, topic modeling is performed to find the problems associated with e-learning which indicates that uncertainty of campus opening date, children’s disabilities to grasp online education, and lagging efficient networks for online education are the top three problems.

1. Introduction

The outbreak of COVID-19 transformed the daily activities of human beings from living, traveling, and working to social interactions. Like many other sectors, the education system experiences grave implications involving students, instructors, and institutions around the globe. In the midst of worldwide COVID-19 lockdowns, educational institutes have been closed for formal face-to-face education leading to digital transformation and the unprecedented rise of online learning. Online learning, also called e-learning, is learning through synchronous or asynchronous environments involving the use of internet-enabled mobile devices such as mobile phones, laptops, tablets, etc. [1]. The transition from traditional education to online education is not possible overnight and several challenges may hinder this transition. Despite its advantages, the challenges of transition may impair the full potential of online education. Several studies investigate the effectiveness and advantages of online education over conventional teaching methods. The advantages include overall flexibility, extended reach of teaching, accessibility, and non-confinement of time and place as well as the pace of learning. On the other hand, several serious challenges pose serious threats to e-learning over conventional classroom teaching methods. The limitations include the availability of communication technology infrastructure, high cost of equipment and devices, limited technical know-how of teachers and learners, and cultural change needed for successful and effective online education.
The COVID-19 pandemic affected the education system globally with conventional education activities suspended. Billions of students from different educational and training courses were not able to attend the in campus teaching sessions. Most of the educational and teaching institutions around the world switched their teaching-learning process to different e-learning platforms and communication media. Not only does online education provide significant advantages in the teaching and learning process, in the present scenario of the COVID-19 pandemic, it served as a backbone for the education system globally. While switching from face-to-face conventional teaching to e-learning, it must be ensured that the e-learning method should be at least a feasible alternative if not better than the traditional education. As some studies such as [2,3,4] argue that, even with the present technological revolution which demands the adoption of e-learning, the conventional face-to-face in campus sessions cannot be replaced fully. Furthermore, face-to-face teaching is a cornerstone for most educational institutions. According to the famous Bloom’s Taxonomy, the framework for the classification of educational outcomes classifies learning outcomes in six domains: knowledge, comprehension, application, analysis, synthesis, and evaluation [5]. Most modern educational institutions rely on Bloom’s taxonomy for the learning outcome process. Considering the above-mentioned educational outcomes and adoption of e-learning, there is a significant need to evaluate the effectiveness and challenges of e-learning.
This study presents the analyses of the sentiments of students, teachers as well as other stakeholders gathered from Twitter. The tweets from different entities related to education such as parents, students, teachers, and other stakeholders will be covering most of the aspects of online education. Such aspects include advantages, disadvantages, challenges, and difficulties faced in adopting the e-learning approach. Sentiment analysis, a field in text analysis, holds great potential to extract and analyze the sentiments, and opinions of people regarding a specific topic, idea, personality, or institution, thereby revealing its pros and cons with respect to common people. Over the past two decades, machine learning and deep learning approaches have proven their superiority in several fields such as image processing [6,7], object detection and localization [8], and NLP (Natural Language Processing) tasks [9], etc., and text analysis is no exception. Additionally, the use of machine learning models has been made to analyze the text in several different languages including Turkish, Lithuanian, and French, other than English [10,11,12]. Bearing in mind that machine learning and deep learning approaches can be leveraged for text annotation, clustering, and classification, this study utilizes machine learning approaches for annotation while a machine and deep learning approach for sentiment classification. To put it in a nutshell, the primary goal of the study is to address the following:
  • The analysis of the effectiveness of the e-learning system to achieve the desired learning outcome through sentiment analysis on stakeholders’ tweets.
  • To analyze the thoughts and experiences of learners and teachers about the transition from face-to-face education to online education.
  • To find the gap between traditional education and online education by leveraging NLP approaches for text processing, feature selection for sentiment analysis, and machine learning models for sentiment classification.
  • To find the problems associated with online education in terms of technology, social setup, and interaction by employing topic modeling.
  • To analyze the performance of various machine learning and deep learning models for sentiment analysis using different annotation approaches such as TextBlob, VADER (Valence Aware Dictionary for Sentiment Reasoning), and SentiWordNet, as well as the efficacy of TF-IDF (Term Frequency-Inverse Document Frequency) and BoW (Bag of Words) feature extraction approaches.
The rest of the paper is organized as follows: Section 2 discusses several research works related to the current study. Section 3 contains the description of data collection, feature extraction, proposed methodology, and machine learning algorithms. Results and discussions are provided in Section 4, followed by the conclusions and future work in Section 5.

2. Related Work

Sentiment analysis or opinion mining is the process of extracting people’s opinions, emotions, attitudes, and feelings about a topic or situation from a large amount of unstructured data. A large body of research has been done in recent years to develop methods for analyzing and describing the process of sentiment analysis in different languages.
The study [13] analyzed the emotions of educational tweets during COVID-19 on the dataset obtained using the NLP toolkit and naive-based classifier. Results show that the number of tweets with negative emotions has exceeded the number of tweets with positive emotions. Another study about online education is [14] where the dataset of 1717 tweets is collected for analysis. After cleaning, 1548 tweets are extracted and categorized as favorable, negative, or neutral with an accuracy of 74.9%. A total of 154 articles about online learning are retrieved from Google and other platforms including online reviews and blogging and sentiment analysis are performed through text mining using the dictionary-based technique of the lexicon-based approach in [15]. Polarity and subjectivity of articles are obtained using the TextBlob toolkit. Similarly, comments about online learning from learners, professionals, and guardians are gathered to assess educational system reforms in [16].
The study [17] compares the efficiency of the online education system with traditional classrooms with a focus on students enrolled in higher education. Research suggests that 73 percent of students have appropriate internet access and 71.4 percent of students feel well equipped to operate a computer/laptop for online classes. However, 78.6 percent of respondents believe that traditional classrooms are more effective than online learning. Althagafi et al. [18] investigate sentiment analysis of tweets to grasp better understanding of people’s sentiments and opinions about online education in the mid of COVID-19. The study performs experiments using NB (Naïve Bayes), KNN (K-Nearest Neighbour), and RF (Random Forest) classifiers. In comparison to NB and KNN, the RF multi-class classification technique shows the best classification accuracy due to its ability to work well with high-dimensional data such as text categorization. Hogenboom et al. [19] proposed a model that accurately classifies the sentiments into positive, negative, and neutral. Furthermore, three basic approaches are used for sentiment analysis. First, a lexicon-based approach is used in which the sentiment lexicon is to describe the polarity and subjectivity score of textual data into positive, negative, and neutral. Machine learning algorithms are easy to implement and understand but require human efforts for labeling. Secondly, the machine learning-based approach requires labeled data to train the classifier manually for better performance. Three, a hybrid approach is a combination of machine learning and a lexicon-based approach.
The authors in [20] analyze movie reviews using KNN, NB, and LR (Logistic Regression). The dataset is gathered from several sources for analysis, and LR provides the highest accuracy. In both short and lengthy text content, many classifiers are tested. For brief text, NB and LR produce average outcomes of 91 and 74 percent, respectively. Both models do poorly on long texts [21]. Machine Learning models produce good results when it comes to categorizing product reviews. For camera reviews, NB has an accuracy of 98.17 percent and SVM (Support Vector Machine) an accuracy of 93.54 percent [22]. Furthermore, according to [23], sentiment analysis is the analysis of opinions involving NLP, computer science, theory of computation, and artificial intelligence. Subjectivity and polarity are two components of sentiment analysis. Polarity expresses emotions that can be positive or negative scores while subjectivity identifies the attitudes, feelings, and opinions [24]. Another study [25], performs sentiment analysis on COVID-19 tweets using machine learning and lexicon-based techniques. The data are extracted from Twitter and annotated using TextBlob, while TF-IDF and BoW features are used for machine learning models. Results indicate that the ETC models achieve the best performance with BoW features and Textblob.
Keeping in view the superior performance of deep learning models, several studies adopt deep learning models for sentiment classification. For example, Ref. [26] uses deep learning and NLP tools to determine how people feel about the COVID-19 vaccination in the UK (United Kingdom) and the US (United States). The data are collected from Facebook and Twitter using various COVID-19 and vaccine-related keywords. Afterward, the data are preprocessed and two lexicon-based techniques including VADER and Text Blob are applied for sentiments. The study shows that average positive, negative, and neutral emotions in the UK are better than in the US. Similarly, the study [27] analyzes the articles about the emergence of infectious diseases such as COVID-19 and MERS (Middle East Respiratory Syndrome) pandemics, etc., and analyze the main findings. The study discusses the classification models, lexicon-based approaches, and machine learning approaches—both individual and hybrid—as well as the application language. The authors perform sentiment analysis on tweets related to COVID-19 in [28] using deep learning models. A multi-layer LSTM (Long Short Term Memory) model is proposed for the classification of sentiment polarity and emotions. The study [29] uses a deep learning approach for COVID-19 tweets’ sentiment analysis. It leverages LSTM and BERT (Bidirectional Encoder Representations from Transformers) models for sentiment classification. BERT achieves an 89% accuracy while LSTM achieves only 65% accuracy for sentiment classification.
Research findings indicate that the knowledge process is not anticipated; rather, it is viewed as a last-minute learning technique [30]. To understand the need of the hour, many schools have started online courses. Almost everywhere there are two major issues; e-learning has little effect and learning through digital platforms is not as effective as traditional teaching methods are in achieving learning goals and focusing on educational priorities [31]. Table 1 provides a comprehensive summary of the discussed related works.

3. Materials and Methods

This section presents the description of the dataset and its visualization, the sentiment analysis process, and the proposed methodology for performing sentiment analysis on the selected dataset.

3.1. Dataset Description
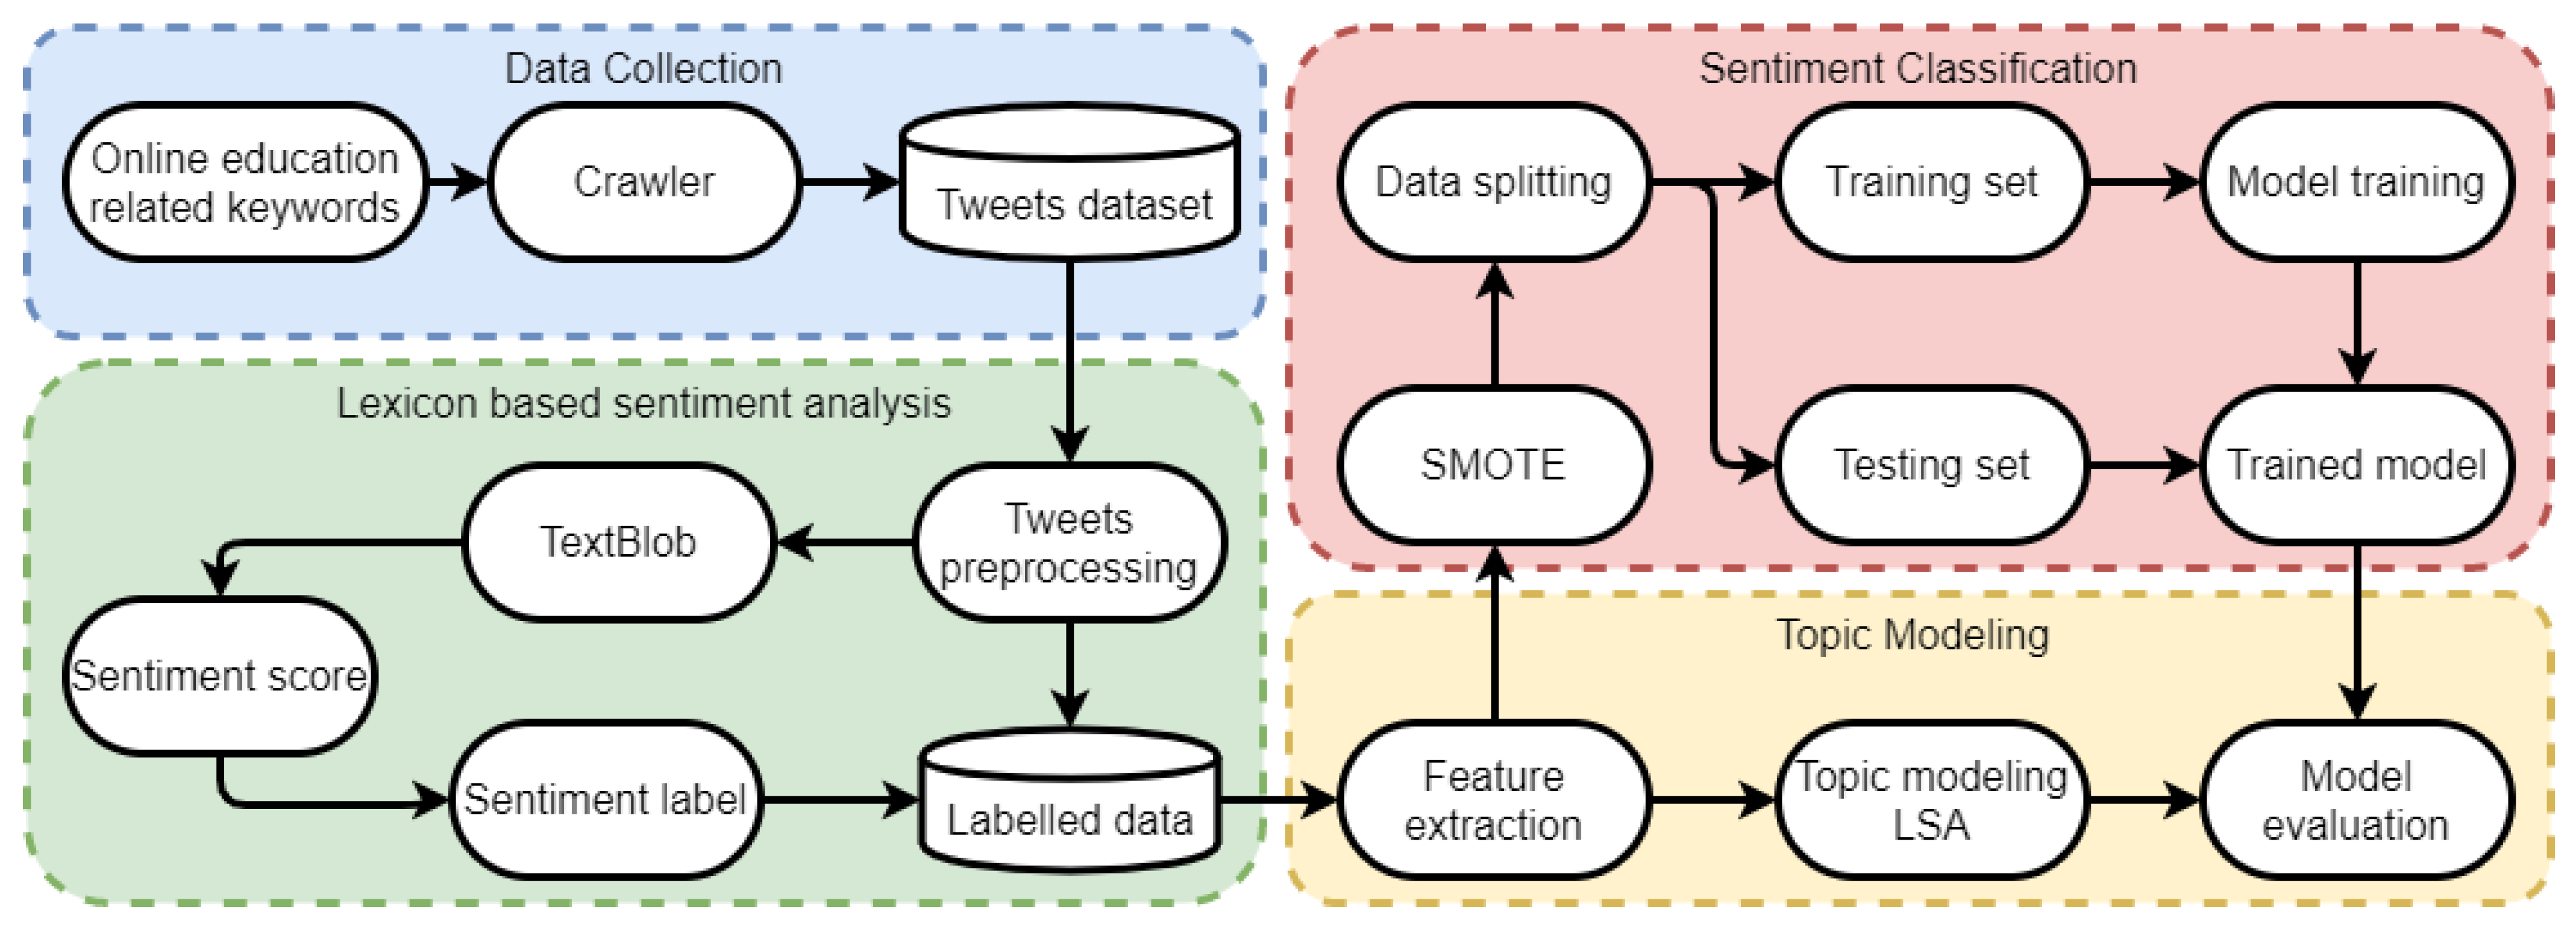
The dataset for this study has been collected from Twitter and contains 17,155 records. The primary dataset, called online-education-during-COVID-19, is unlabeled. For data collection, several relevant keywords are used to obtain the desired tweets such as “coronaeducation”, “covidneducation”, “distancelearning”, “Onlineclasses”, and ”onlinelearning”, etc. Table 2 shows a sample subset from the dataset with corresponding username and location.
After data gathering, the TextBlob Python package is used to obtain the polarity score of tweets. For this purpose, preprocessing is carried out to clean the dataset and remove superfluous information. The sentiment score is divided into three categories of positive, neutral, and negative. The criterion used for defining the sentiment of a tweet based on its polarity score is shown in Table 3 with sample tweets and assigned sentiment.

3.2. Methodology

This subsection contains an explanation of various phases of the methodology and the approaches used in each phase.
The sequential workflow of the methodology along with the methods, algorithms, and state of data in each phase is illustrated in Figure 1. The workflow starts from dataset extraction from Twitter into the “online-education-during-COVID-19 dataset”. The next phase is cleaning the dataset using several preprocessing steps, followed by a lexicon-based approach to annotate the data using corresponding sentiment labels. The labeled dataset is further divided into training and testing sets for machine learning models train and test process, respectively. In this regard, BoW and TF-IDF features are used. A brief description of each of these phases is given in the following sections.

3.2.1. Preprocessing

Data analysis applications require data preprocessing to remove the superfluous information to increase the learning process of classification models for increased accuracy. Superfluous information refers to any data that contribute very little or no contribution at all to predicting the target class; however, it increases the size of the feature vector and thus introduces unnecessary computational complexity. Consequently, the performance of classification models is degraded if no or improper preprocessing is carried out. Thus, data cleaning or preprocessing are performed before encoding [32]. Python’s NLP toolkit has been used for preprocessing tweets data in this study. Initially, the text is converted into lower case, followed by the removal of links, HTML (HyperText Markup Language) tags, and punctuation. Then, stemming and lemmatization methods are performed to clean the text, and stopwords are removed in the end.
  • Convert to lowercase: Converting the text to lowercase reduces the complexity of the feature set as, ‘go’ and ‘Go’ are taken as different features by machine learning models, so converting to lowercase both terms will be ‘go’. Models consider upper and lower case words as different words which affect the training process and classification performance.
  • URL links, tags, punctuation, and number removal: URL links, tags, punctuation, and numbers do not contribute to improving the classification performance because they provide no additional meaning for learning models and increase the complexity of feature space, so removing them helps to reduce the feature space.
  • Stemming and Lemmatization: The goal of both stemming and lemmatization is to reduce inflectional forms and sometimes derivationally related forms of a word to a common base form [33]. For example, ‘walks, ‘walking’, and ‘walked’ are converted to the root word ‘walk’ in this process.
  • Stopwords removal: Stop words are frequently used words that give no useful information for analysis. Stop words such as ‘the’, ‘is’, ‘a’, and ’an’ are removed [34]. Table 4 shows samples of raw text from tweets and cleaned text after applying the preprocessing steps.

3.2.2. TextBlob

TextBlob is a lexicon-based technique that can be used for different NLP tasks including part-of-speech tagging, sentiment analysis, noun phrase extraction, paraphrase, and sorting, etc. [35]. We used it in this study for sentiment purposes. TextBlob sentiment function provides a polarity score between −1 and 1. Tweets that have a polarity score less than 0 will be a negative, equal to zero will be neutral, and greater than zero will be positive statements [36]. Table 3 shows the results of TextBlob on sample tweets with polarity score and corresponding sentiment.

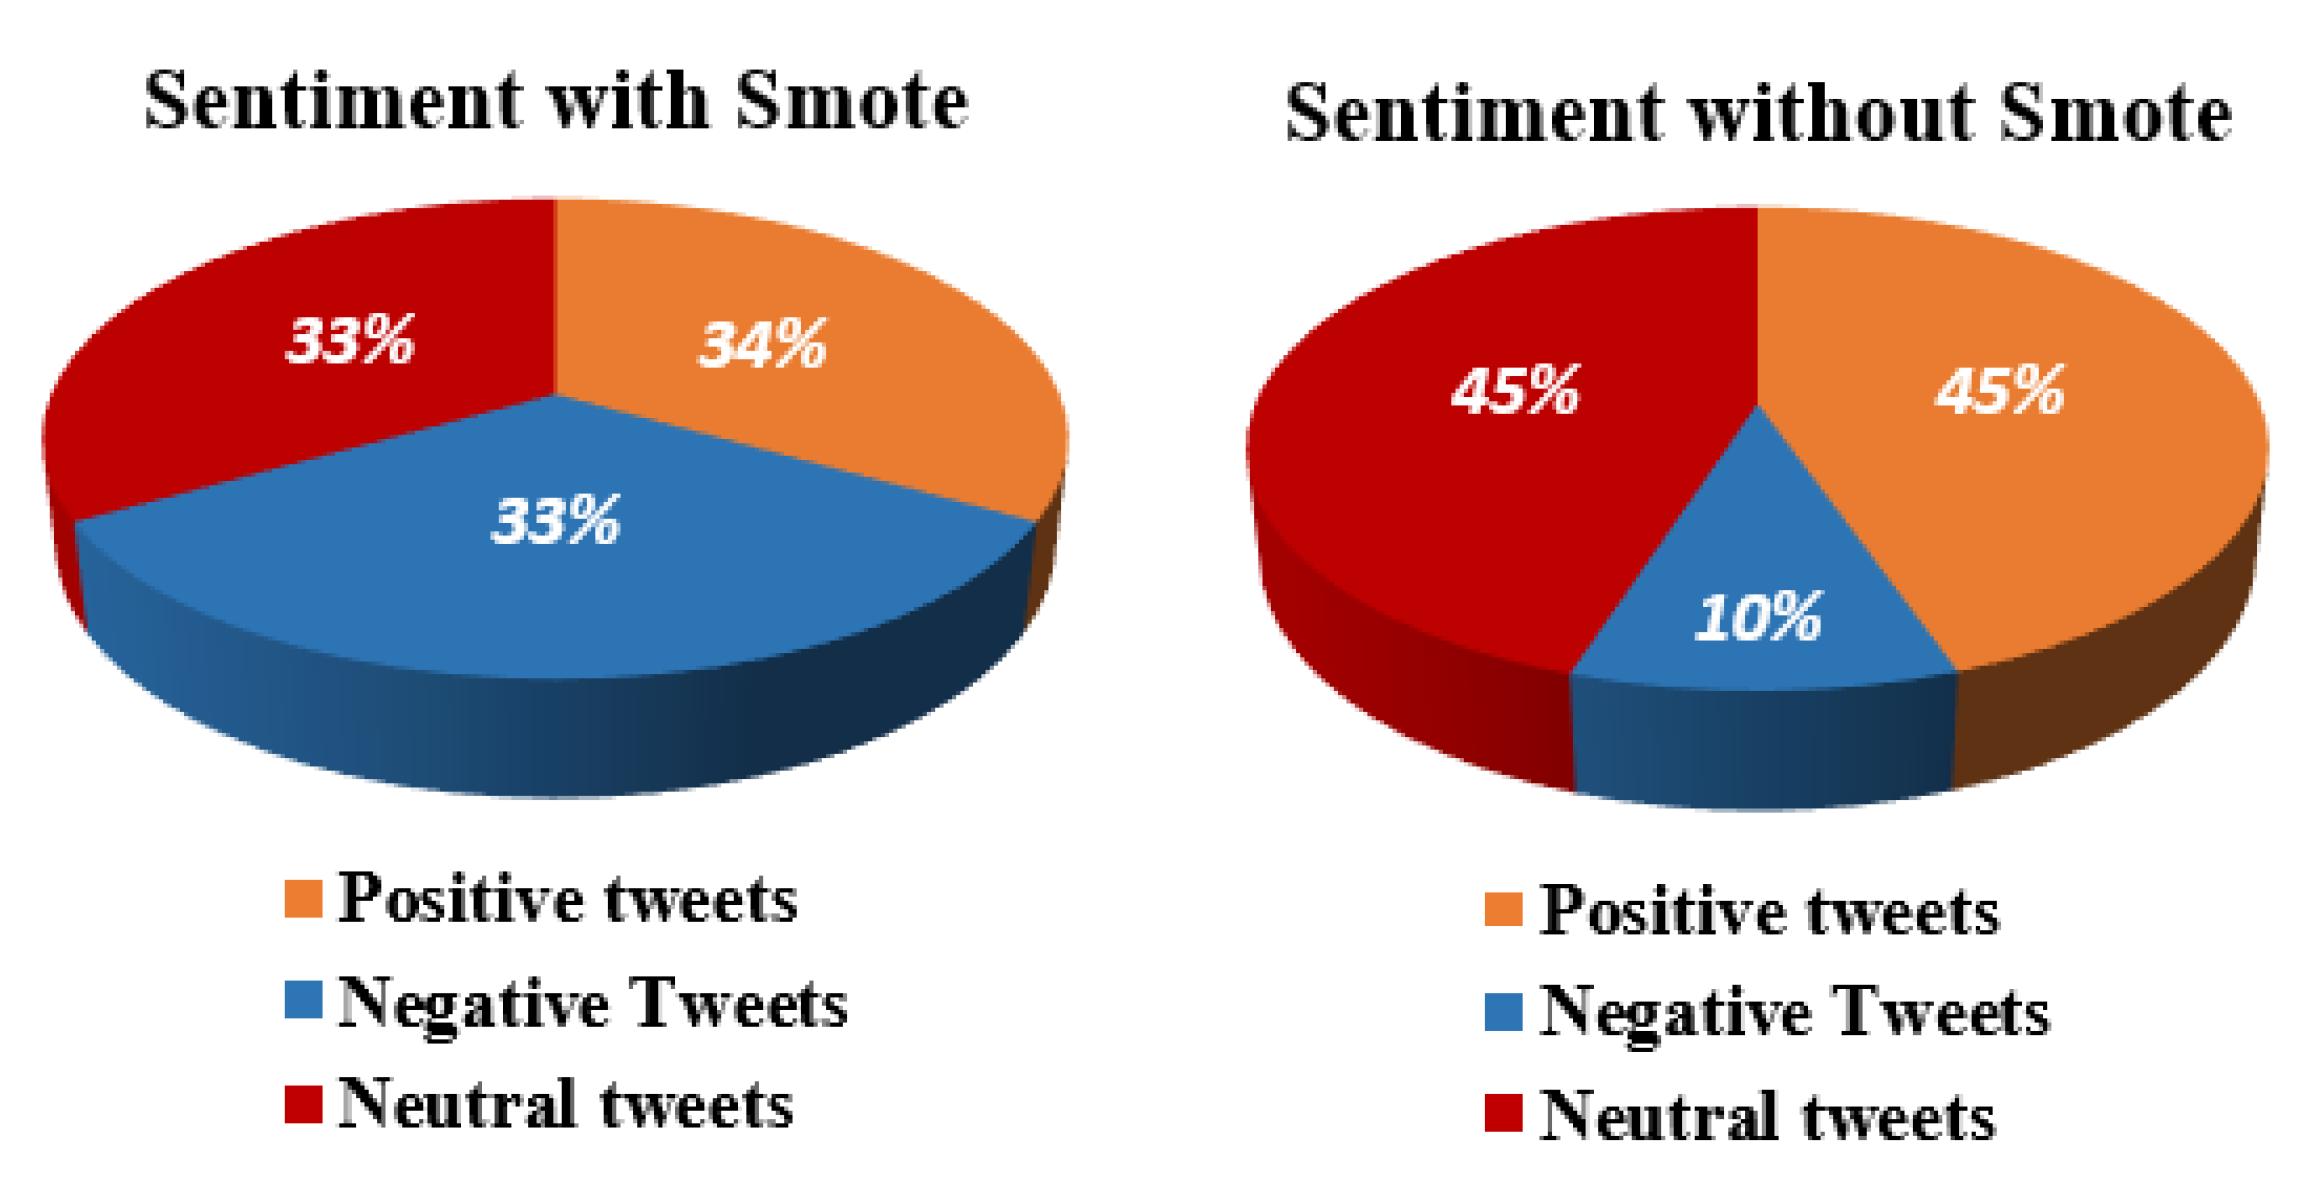
3.2.3. Synthetic Minority Oversampling Technique

SMOTE (Synthetic Minority Oversampling Technique) is used to solve the imbalanced dataset problems by balancing the number of samples for all the classes of a dataset [37]. Balancing is achieved by generating synthetic samples of minority classes so that the number of minority class samples becomes almost equal to that of the majority class. The ratio of sentiments after applying the TextBlob is not equal so models can be over-fit on the imbalanced dataset. To avoid this over-fitting problem, SMOTE is used to balance the dataset by generating artificial data for the minority class. The ratio of sentiments before and after applying SMOTE is shown in Figure 2.

3.2.4. Data Splitting

This study uses a 75:25 split ratio where 75% of data are used for the models’ training while 25% of data are taken for models’ testing. Before the data split, the shuffling of data is carried out, so as to reduce the variance and ensure the generalizability of the models. Shuffling also helps to make the training data more representative of the overall distribution of the data and avoids model overfit. The number of tweets in training and testing sets are shown in Table 5 with and without the SMOTE technique.

3.2.5. Feature Engineering

To extract features from tweets, the two most widely used feature extraction methods are used including BoW and TF-IDF.
Bag of Words: BoW is a simple technique to extract features from simplified text or data and is commonly used in natural language processing and information retrieval [38]. For text classification, BoW is used to count the occurrence of a word in a text and forms a feature vector containing the number of occurrences of each unique word. The BoW is mostly used to build the vocabulary of all matchless words and train the learning models through their frequencies. BoW feature vectors from the following sample text data statements are shown in Table 6. Sample statements are
S1: england high school face mask lift
S2: wear mask right way
Term Frequency-Inverse Document Frequency: TF-IDF is a feature extraction technique used to extract weighted features from text data. It provides the weight of each term in the corpus to improve the performance of learning models [39]. TF-IDF is a product of TF and IDF. TF can be calculated as:
TF ( t , d ) = n t N ( T , d )
where n t represents the number of occurrences of term t in a document d, while N ( T , d ) indicates total terms T in that document. IDF of a term indicates how important it is in the whole corpus [40], and it can be calculated as:
IDF = log D n d
where D is total number of documents in the corpus, whereas n d is the number of documents where the term t appears. Using TF and IDF, TF-IDF can be calculated as
TF - IDF = TF IDF
For a better understanding of TF-IDF, Table 7 shows the results of TF-IDF on two pre-processed data samples.

3.2.6. Topic Modeling

Topic modeling is a very popularized and important algorithm of machine learning and natural language processing. It is an approach to extract hidden topics from large documents. With the increase in the popularity of social media platforms, many researchers are interested in extracting ideas from these platforms. It is essential to discover topics through tweets as they contain unorganized short text topic modeling that has to be performed for finding such information. In this paper, the LSA (Latent Semantic Analysis) method has been used. LSA describes the strong relationship between documents and expressions. Several research works suggest that LSA performs well in short sentence classifications [41,42]. When comparing with other methods for automatically indexing and retrieving information, LSA gives similar meanings with low dimensions and consumes less power.

3.2.7. Supervised Machine Learning Models

Several supervised machine learning models have been employed, each with its own set of parameters. The models are selected with respect to their wide use for sentiment analysis. A brief description of the used models is provided in Table 8, while the parameter settings of the models are given in Table 9.

3.2.8. Evaluation Measures

The performance of supervised machine learning models has been assessed using four evaluation parameters: sensitivity score, precision score, F1 measure, and accuracy score. The maximum and minimum accuracy ratings are 1 and 0, respectively. For measuring the values of these performance evaluation metrics, TP (True Positive), TN (True Negative), FP (False Positive), and FN (False Negative) are used. A prediction is TP when the model predicts the positive class correctly while a TN is a result in which the model correctly predicts the negative class. On the other hand, FP is the prediction when the model incorrectly predicts the negative sample as positive, and FN is the sample of positive class predicted as negative.
Accuracy shows the ratio of correct predictions to total predictions. Sensitivity refers to the capability of a model to correctly predict a sample of positive class while precision is used to evaluate the exactness of a classifier. Precision and recall alone may not be appropriate to evaluate the model, so an F1 score is used that incorporates both precision and recall:
Accuracy = TP + TN TP + TN + FP + FN
Sensitivity = TP TP + FN
Precision = TP TP + FP
F 1 score = 2 × Precision × Recall Precision + Recall

4. Results and Discussion

Several experiments are performed involving the use of BoW and TF-IDF, as well as imbalanced data and SMOTE balanced data. In addition, the combinations of models and feature extraction techniques have been permuted.

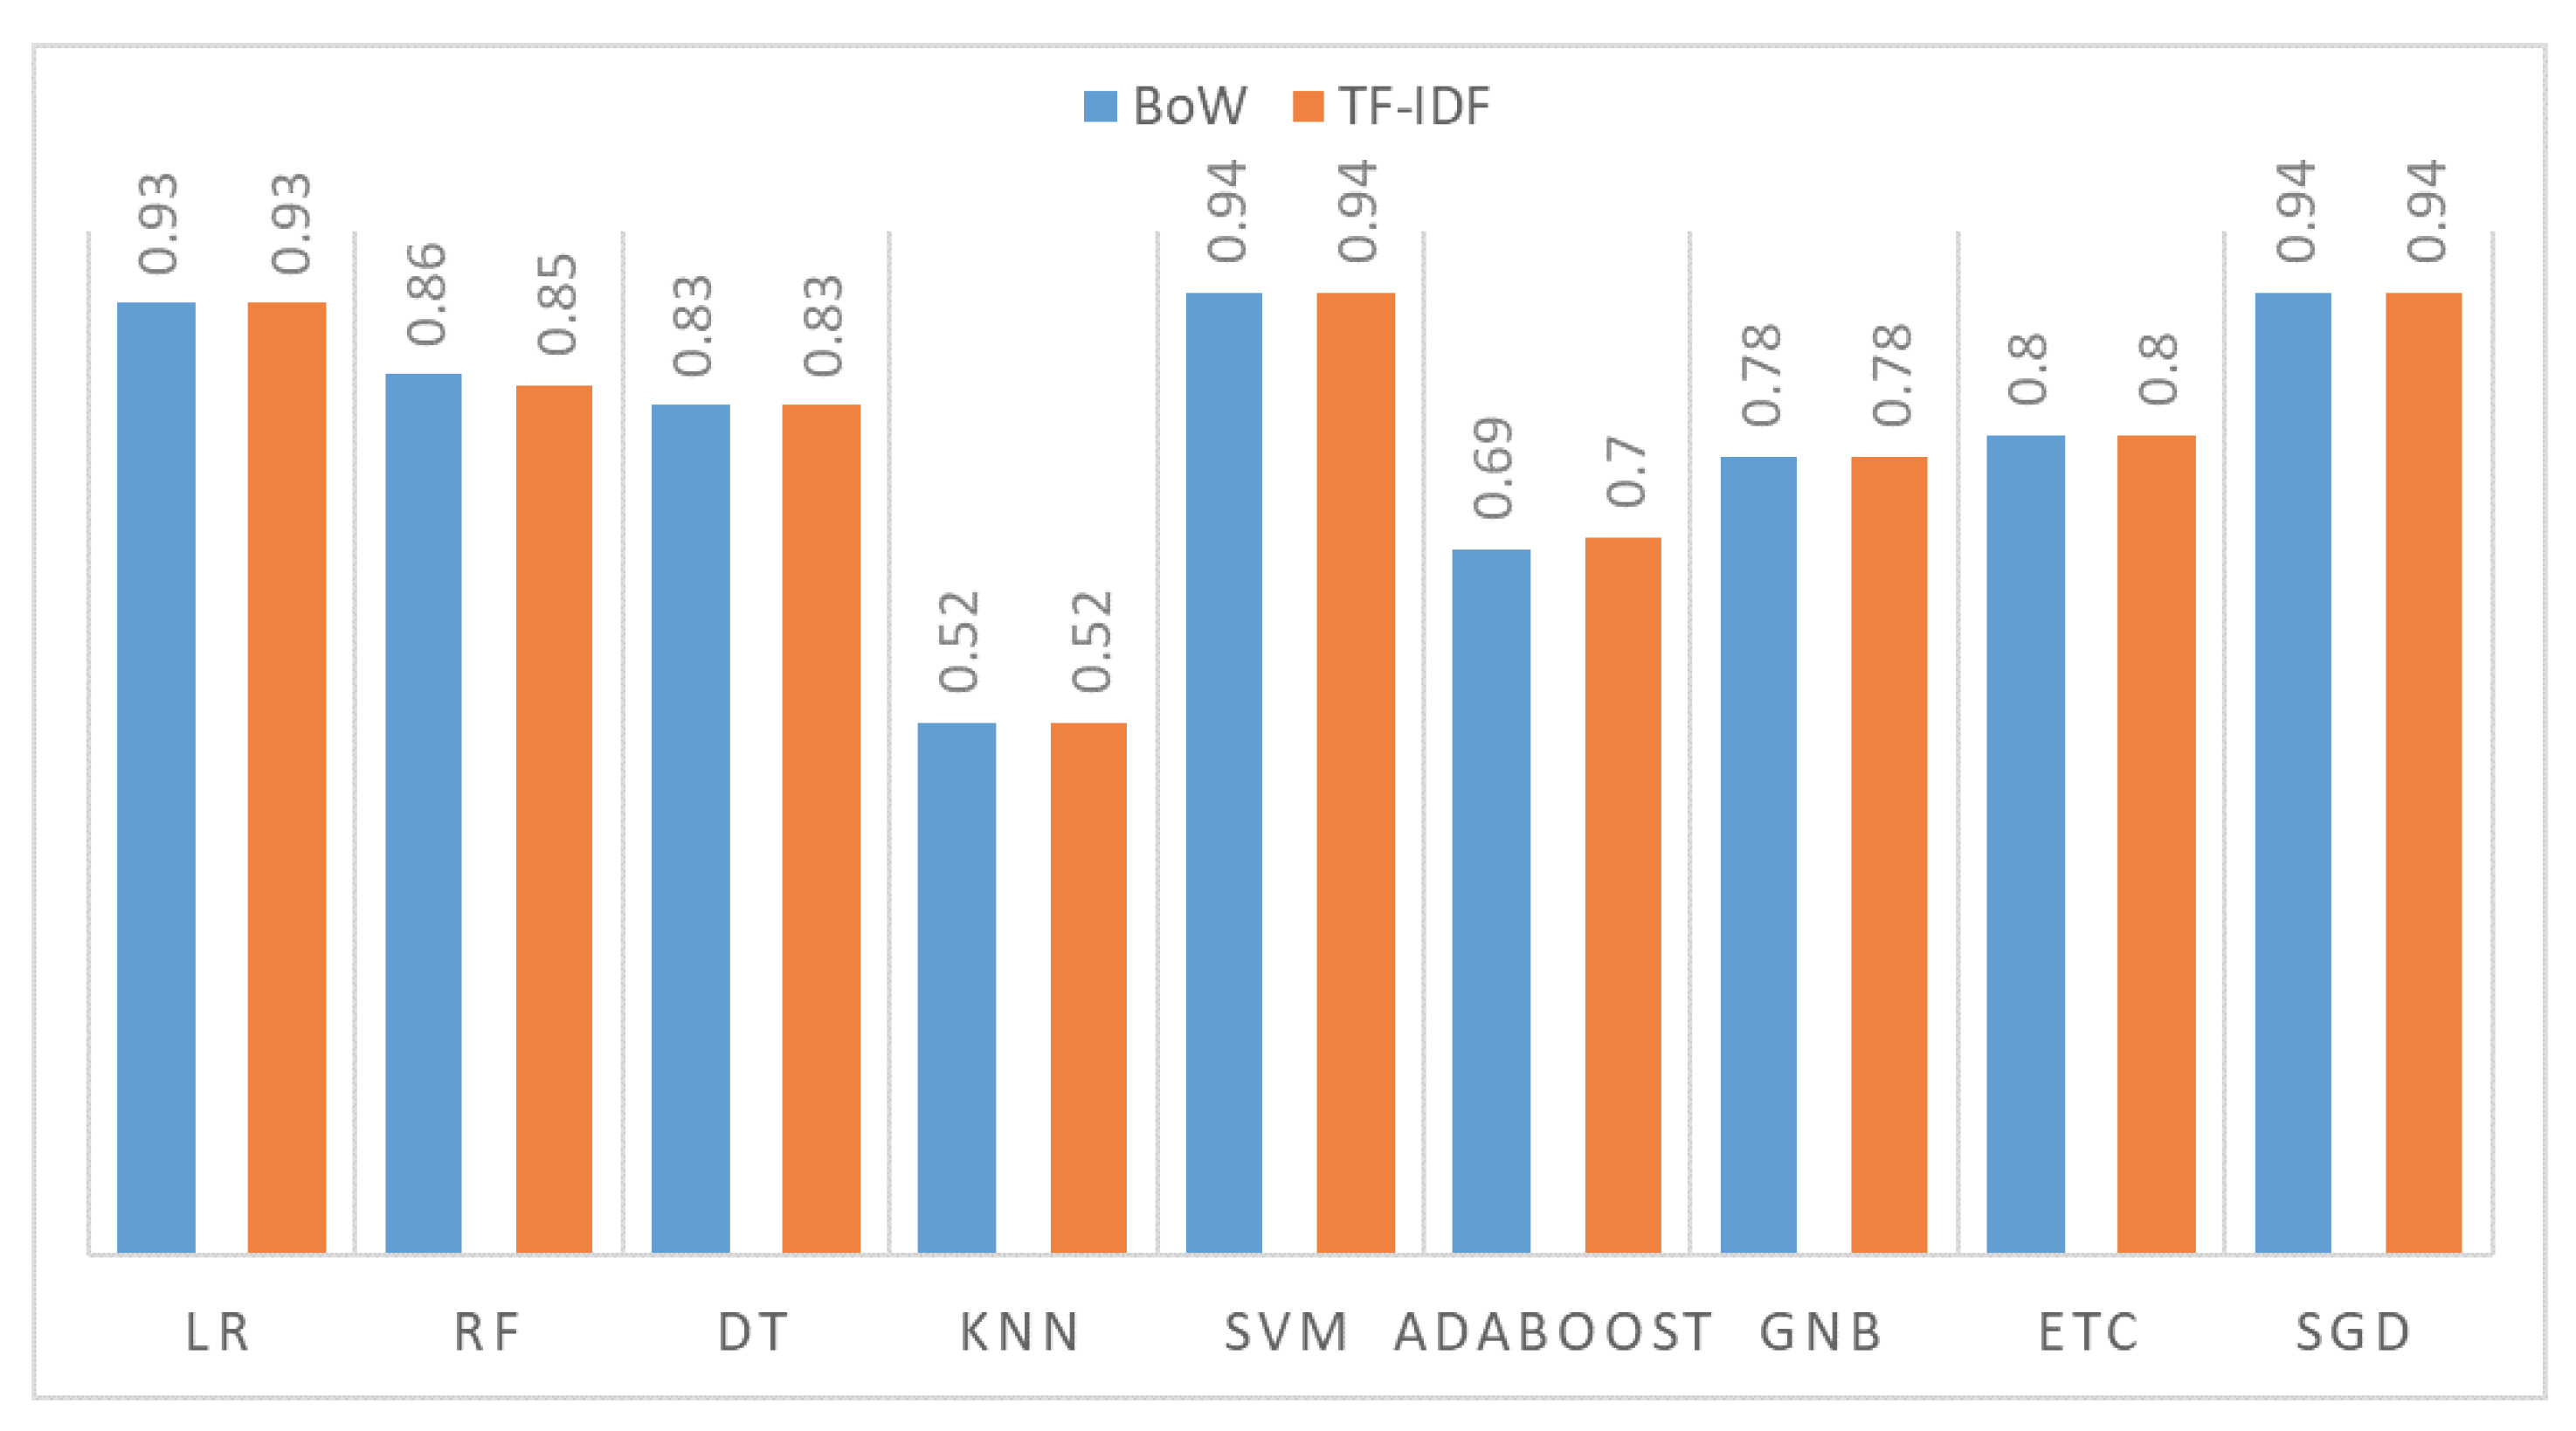
4.1. Results Using BoW and without the SMOTE Technique

Initially, experiments are performed on the original dataset with class imbalance using BoW features. The results of all models in terms of accuracy, precision, recall, and F1 score are shown in Table 10. SVM and SGD outperform other models with significant accuracy of 0.94 each followed by LR with 0.93 accuracy. Results indicate that linear models perform better on the dataset when BoW features are used. The primary reason is the large feature set used for training as using the BoW technique feature space is large and the linear model performs well when a large feature set is available for training. While KNN, GNB, and AdaBoost show poor performance as they require a small feature set for a good fit, and they need categorical data for the significant results. Tree-based models RF, ETC, and DT show average accuracy scores.

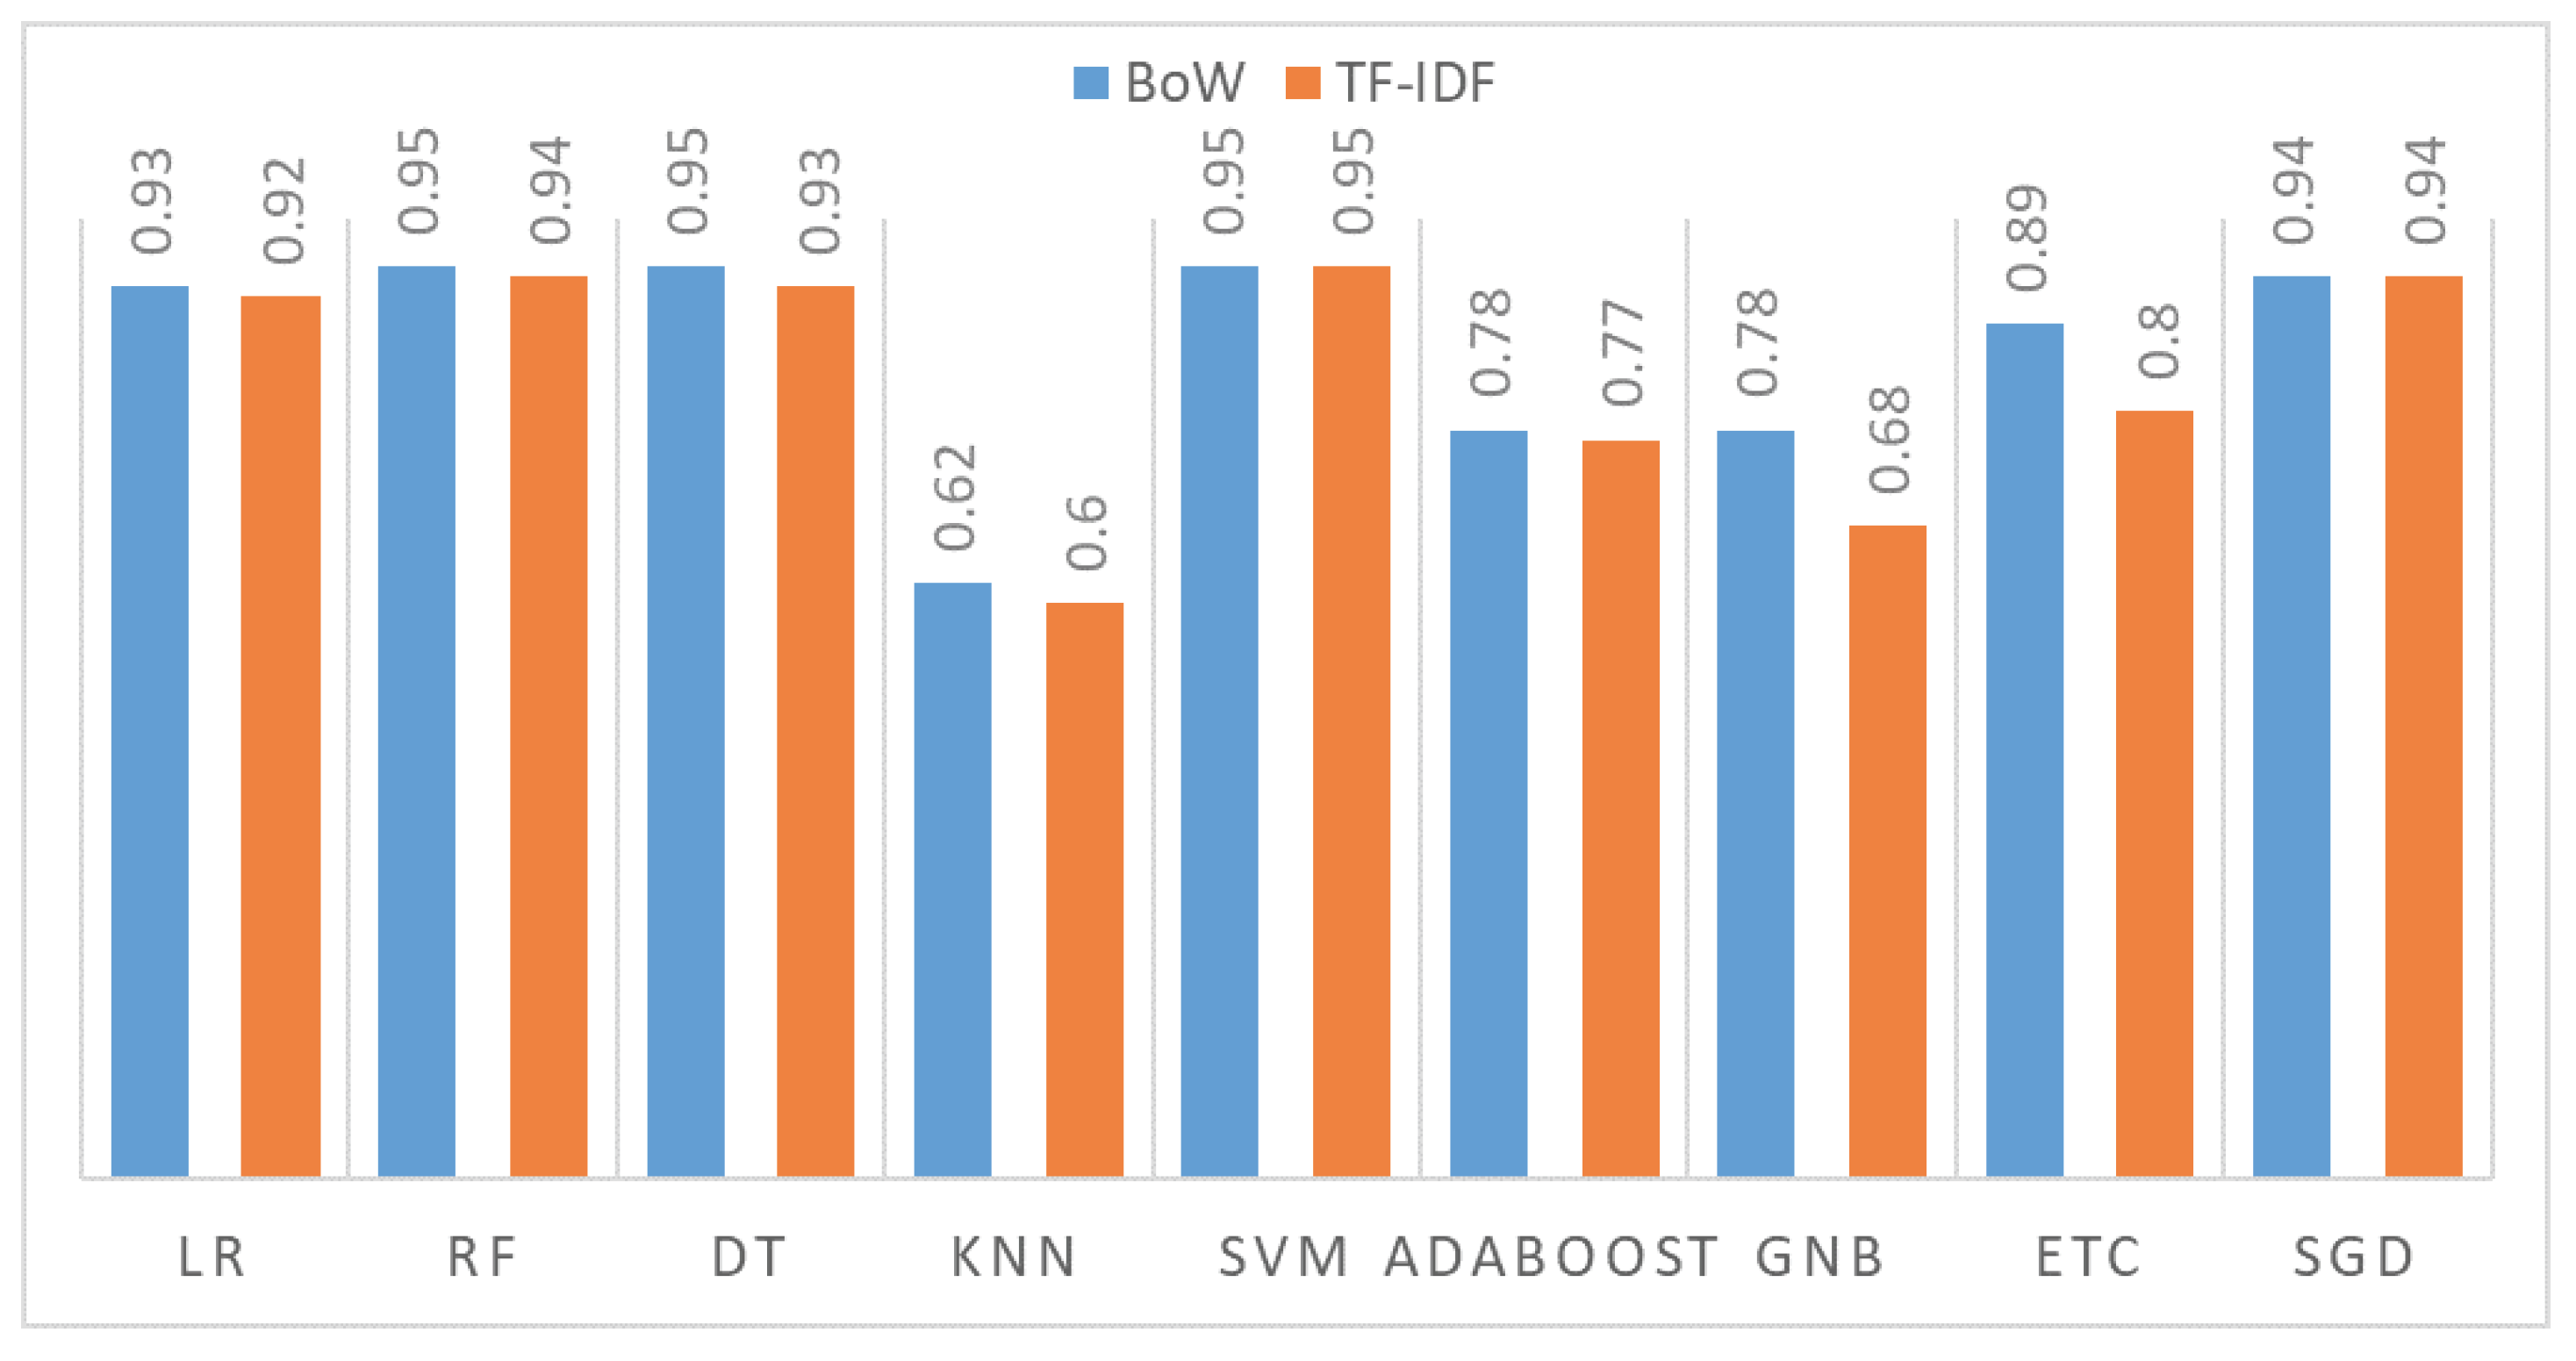
4.2. Results Using BoW with the SMOTE Technique

The second set of experiments involves using BoW on the SMOTE balanced dataset. Experimental results are provided in Table 11, which indicates significantly better performance as compared to results on the imbalanced dataset. On the balanced dataset, the performance of tree-based models improved significantly as well as linear models because of the increase in the feature set. RF, DT tree-based models achieved the highest accuracy score of 0.95, and SVM also shares this highest accuracy score with RF and DT. SGD and LR are just behind them with 0.94 and 0.93 accuracy scores, respectively. Using the SMOTE technique, the performance of ETC is improved from 0.80 to 0.89. Similarly, the performance of RF, DT, KNN, and AdaBoost is improved from 0.86, 0.83, 0.52, and 0.69 to 0.95, 0.95, 0.62, and 0.78, respectively. This significant improvement in models performance is due to class balance and an increase in the feature set after balancing. The use of SMOTE for data balancing also reduces the probability of the model over-fitting on the majority class and helps to improve the performance.

4.3. Results Using TF-IDF Features on the Original Dataset

For this set of experiments, machine learning models are trained using TF-IDF features from the original dataset. TF-IDF gives weighted features for the learning of models which can be useful for better training of models. The results of machine learning models with TF-IDF features on original data are shown in Table 12. Results show that SVM and SGD outperform all other models with a 0.94 accuracy score each followed by LR with a 0.93 accuracy score. Linear models again perform well on the imbalanced dataset with TF-IDF features, similar to BoW features. Still, KNN, GNB, and AdaBoost are the worst performers on imbalanced data using TF-IDF features, and only 1% improvement in AdaBoost results is observed with TF-IDF on the imbalanced dataset.

4.4. Results Using TF-IDF Features and the SMOTE Technique

Experiments are performed using TF-IDF on the balanced dataset as well as using SMOTE for balancing the minority class samples. Table 13 shows results in terms of accuracy, precision, recall, and F1 score for all the machine learning classifiers used in this study. Results indicate that models’ performance has been improved significantly as compared to the models’ performance on imbalanced data when TF-IDF features are used for training the models. Analogous to the performance using BoW with SMOTE, SVM shows superior performance with a 0.95 accuracy and significant precision, recall, and F1 scores. The difference in accuracy and other metrics is small, which indicates that the model has a good fit. The accuracy of RF and SGD is marginally lower than SVM with 0.94 accuracy each, followed by DT which obtains an accuracy of 0.93.
On average, the performance of all models has been improved substantially when TF-IDF features are used from the SMOTE balanced dataset as compared to the imbalanced dataset. In addition to an approximately equal number of samples for each class, balancing the dataset increases the feature set as well due to generating artificial data to make the dataset balanced. This data generation creates more features for learning models, and linear learner such as SVM is the best performer on large feature sets. Consequently, models get good accuracy when the SMOTE technique is used for generating synthetic samples of the minority class.
Comparative analysis between results of BoW and TF-IDF indicates that there is no significant difference in the performance of machine learning models when models are trained using BoW or TF-IDF features on the original dataset that contains a different number of samples for three classes. The similarity in models performance can be seen in Figure 3, which indicates that the difference in the performance of RF and AdaBoost is marginal while LR, DT, KNN, SVM, GNB, ETC, and SGD are the same. Similarly, Figure 4 shows comparative accuracy of the models using BoW and TF-IDF features from SMOTE balanced data. Although the performance is improved substantially, the difference in the performance is little between BoW and TF-IDF features except for GNB, where accuracy with BoW and TF-IDF is 0.78 and 0.68, respectively.
Table 14 summarizes the average accuracy for positive, negative, and neutral classes for the machine learning models with BoW and TF-IDF for the original and balanced datasets. Results indicate that the use of SMOTE to balance the dataset leads to higher classification accuracy both with BoW and TF-IDF.
In this study, different machine learning models are used with two different feature extraction techniques such as BoW and TF-IDF. These feature extraction techniques have been applied with a combination of SMOTE. Analysis of experimental results proves that the SVM model can achieve the highest accuracy among all the models with different features. The accuracy of SVM is as high as 95% with BoW and TF-IDF features without using any statistical techniques and 94% with BoW and TF-IDF features when applied along with SMOTE. Table 15 shows the number of CP (correct predictions) and WP (wrong predictions) for machine learning models with both features with the combination of using SMOTE and without SMOTE. The highest number of CP is achieved by SVM using TF-IDF and SMOTE, which is 5610 with only 183 wrong predictions. Using BoW with SMOTE, the highest number of CP is 5440 by the SGD classifier. Although these classifiers perform better on the original dataset as well, the number of correct predictions is high when they are used on SMOTE balanced data.

4.5. Results Using K-Fold Cross-Validation

To show the adequacy and efficacy of the models, this study performs 10-fold cross-validation with both BoW and TF-IDF features. The 10-fold cross-validation is applied after annotating the dataset using the Textblob technique. The results with 10-fold cross-validation are shown in Table 16. Results indicate that models perform significantly in 10-fold cross-validation and SVC achieves the highest 0.94 accuracy score with +/−0.03 standard deviation using the SMOTE technique and both BoW and TF-IDF features. SVC and RF also perform significantly better without applying the SMOTE technique with a 0.93 accuracy score and 0.04 standard deviation with both BoW and TF-IDF features.

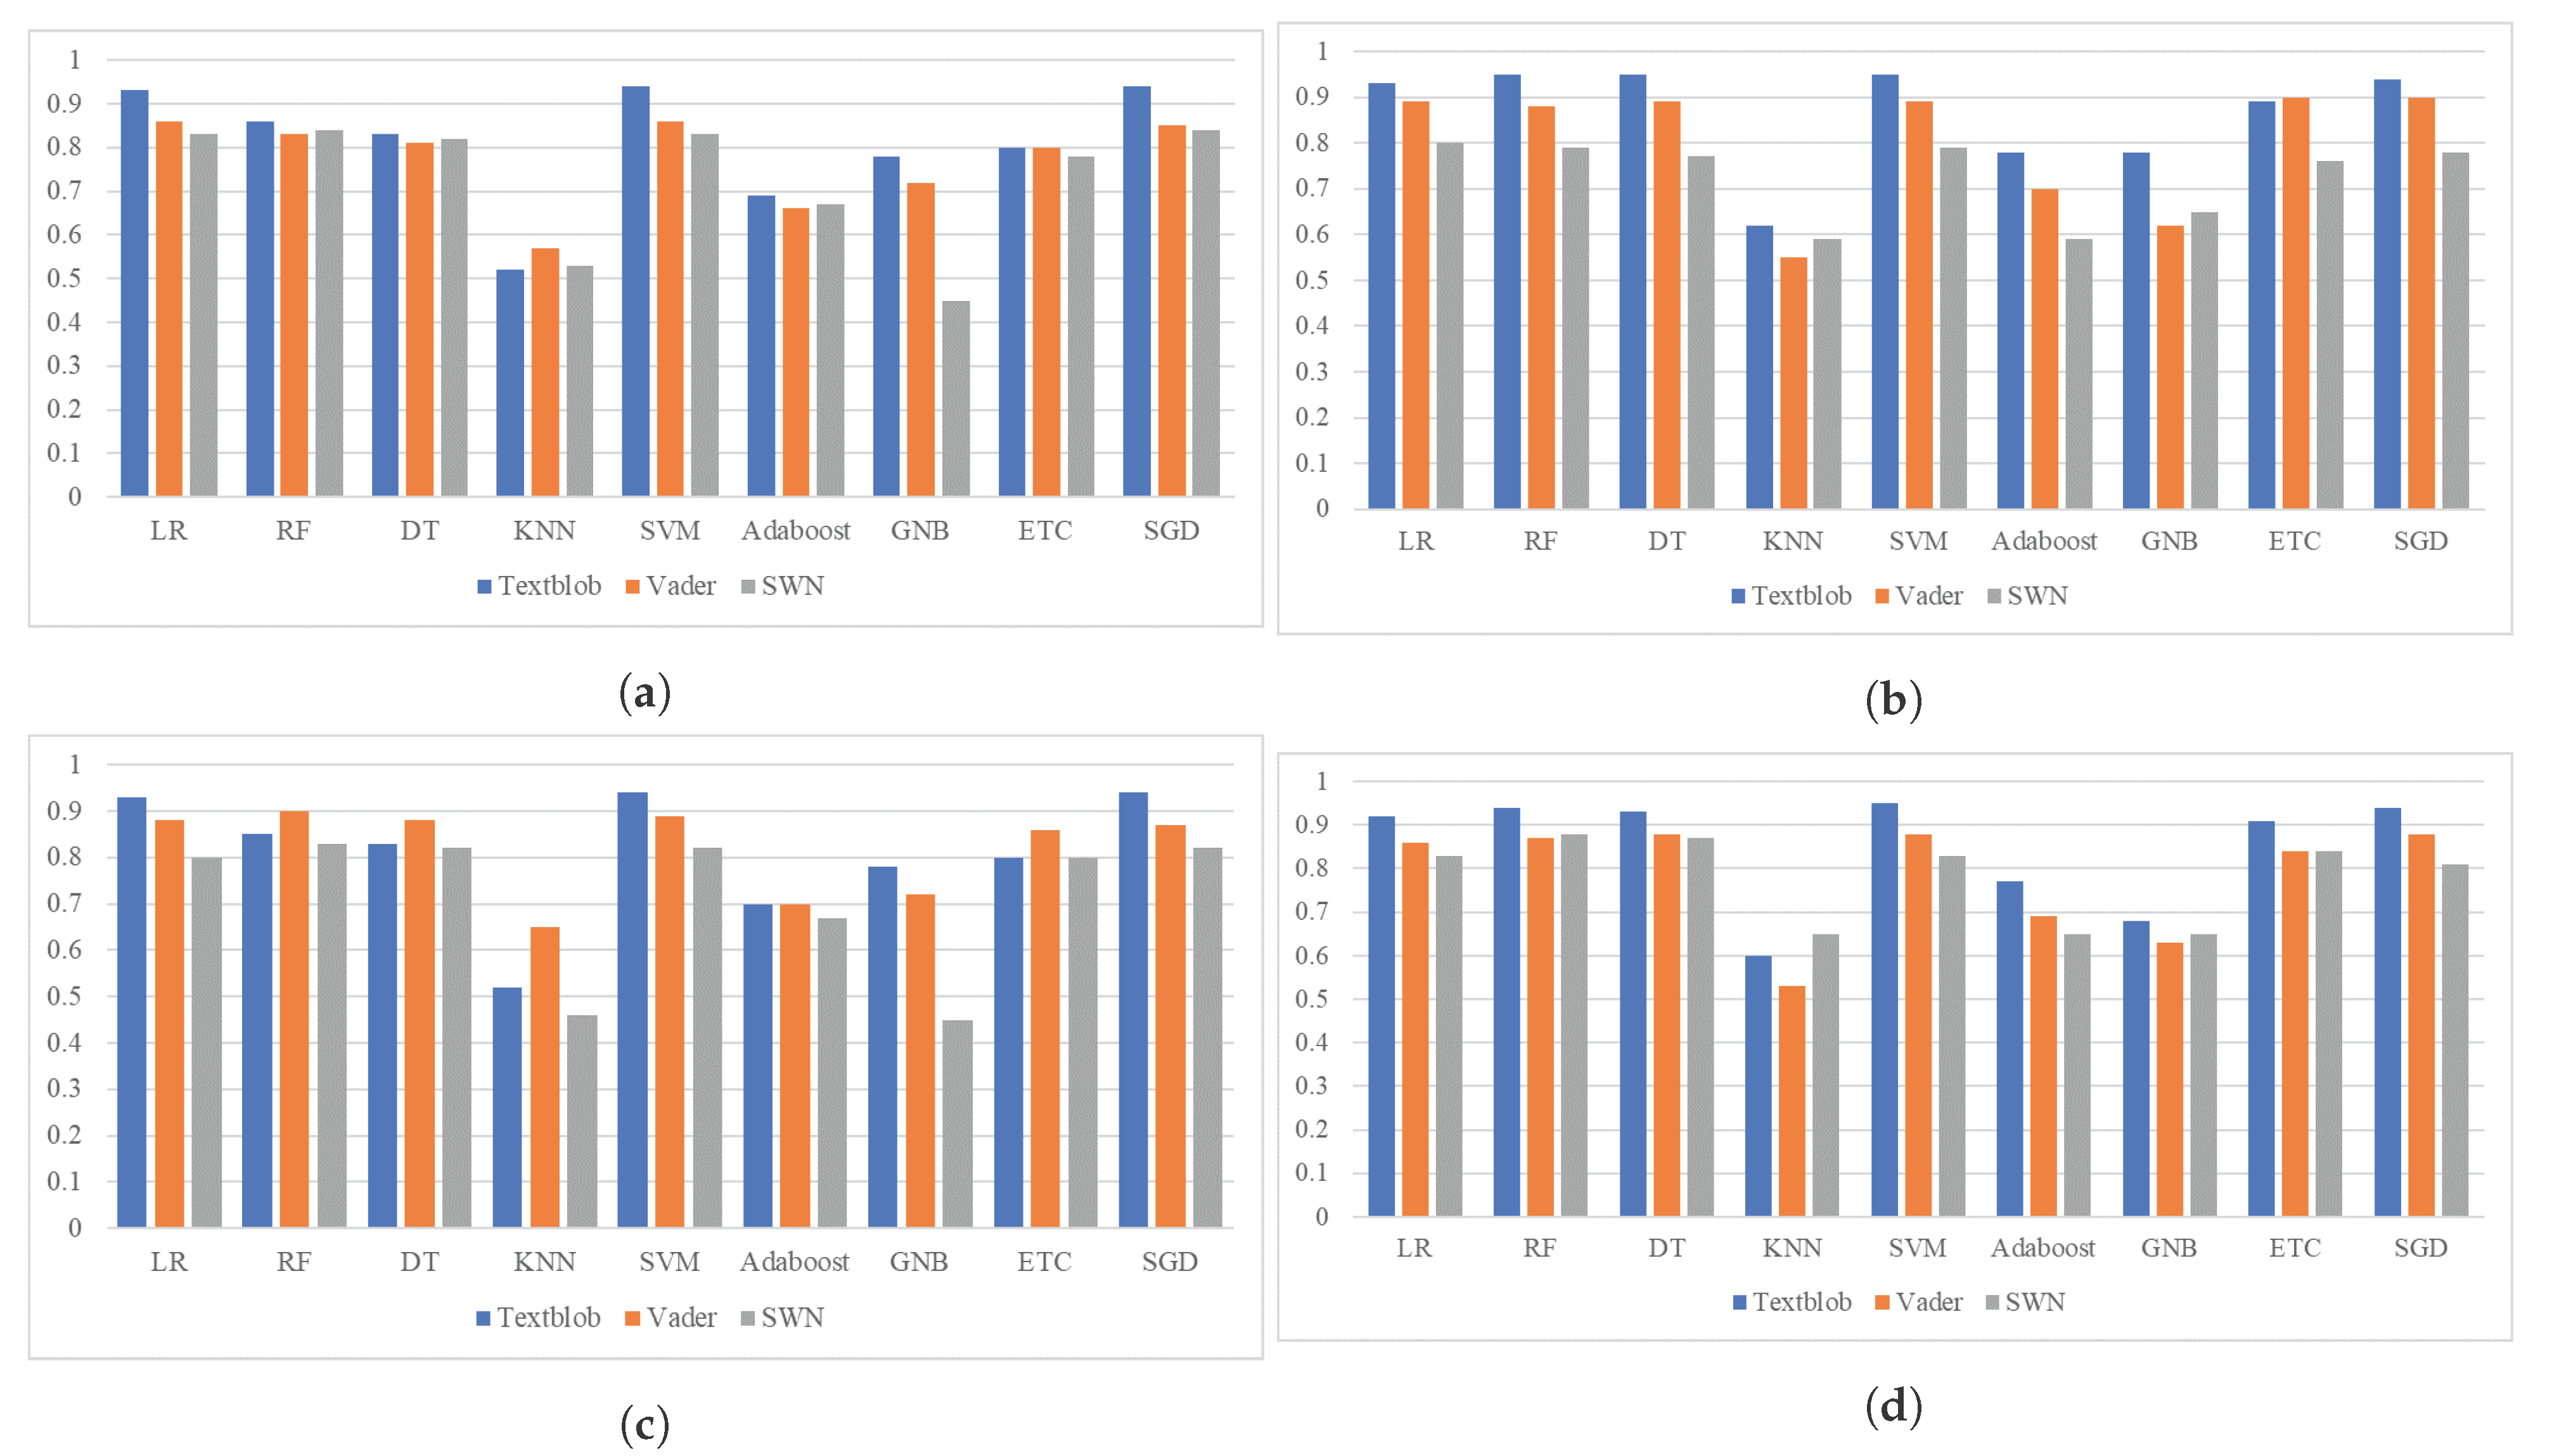
4.6. Comparison of TextBlob Results with VADER and SentiWordNet

To analyze the performance of TextBlob, VADER and SenitWordNet are also adopted in this study. VADER is used to find the polarity of social media posts to categorize them with respect to the sentiments such as positive, negative, and neutral [25]. It is a rule-based technique that shows the intensity of positive or negative emotion in text. Similarly, another lexicon-based technique, SentiWordNet is also used in comparison to Textblob and VADER. SentiWordNet finds the polarity score from the text to categorize the data into positive, negative, and neutral sentiment [51]. The ratio of sentiments such as positive, negative, and neutral with VADER, and SentiWordNet is shown in Table 17.
Table 18 shows the results using VADER and SentiWordNet, which indicate that the performance of VADER is slightly better as compared to SentiWordNet. VADER is suitable especially for social media posts and shows better performance. ETC and SGC achieve the highest accuracy of 0.90 using TF-IDF features with VADER and the SMOTE technique while RF achieves 0.90 accuracy with VADER and BoW features. In the case of SentiWorNet, the highest accuracy is 0.88 by RF using TF-IDF features with the SMOTE technique. The comparison between Textblob, VADER, and SentiWordNet using BoW and TF-IDF features with and without SMOTE is shown in Figure 5.

4.7. Experimental Results Using Deep Learning Models

This section contains the results of deep learning models with each lexicon technique. Table 19 shows the results of all models which reveal that deep learning models show superior performance with TextBlob sentiments as compared to VADER and SentiWordNet. For experiments, LSTM, CNN (Convolutional Neural Networks), CNN-LSTM [52], and Bi-LSTM Bi-directional-LSTM) are utilized in this study. The implementation details of these deep learning models are given in Figure 6. All the models are compiled using the ‘categorical_crossentropy’ loss function because of the multi-class dataset and the ‘Adam’ optimizer is used for optimization. The models are fit using 200 epochs and 32 batch sizes. Results suggest that, on average, Bi-LSTM outperforms all models with Textblob sentiments by achieving the highest 0.94 accuracy score. Bi-LSTM is significant with each lexicon technique. The performance of the LSTM is marginally low with 0.94, 0.91, and 0.85 accuracy scores with Textblob, VADER, and SentiWordNet, respectively.

4.8. Topic Modeling Analysis

Topic Modeling is a text-mining tool frequently used for discovering the semantic constructs of the given text. It is a statistical modeling technique with a potential application for NLP domains like sentiment analysis. This study applies topic modeling to reveal the potential benefits of online education, as well as uncover the problems associated with it. The required preprocessing and data cleaning procedures are carried out on the dataset for applying topic modeling. The data from tweets have been transformed into an appropriate structural format for topic modeling. TF-IDF features are used to facilitate identifying the most significant terms in the corpus and a total of 4000 features are utilized. Topic modeling is performed on the tweets from positive and negative classes to identify the pros and cons of online education. Table 20 shows the LSA (Latent Semantic Analysis) results for positive tweets.
LSA is the most commonly used topic modeling approach that makes use of the distributional hypothesis which infers that the semantic of words can be obtained by analyzing the contexts of words. It indicates that, if words appear in a similar context, their semantics would be the same [53]. LSA can be used with different features, where this study uses TF-IDF.
LSA results show that students, while learning through online education during the COVID-19 pandemic, protect themselves from the disease. The most often appearing words in subjects in LSA are online education, online courses, and COVID-19. The positive opinions about online education are summarized in Table 20. Similarly, topic modeling with LSA for negative words is shown in Table 21. The issues that students have concerning online education are highlighted in this table by topic keywords. The major issue of discussion is the lack of technical skills and network challenges in rural regions. Similarly, children’s disability to grasp online education is a serious threat to the efficacy of online education.

5. Conclusions

The COVID-19 pandemic led to the closure of traditional face-to-face teaching institutions and the rise of the online education system. Although online education serves as the backbone of education during the pandemic, its effectiveness and suitability have serious concerns from stakeholders such as parents, teachers, and students. For this reason, such concerns must be analyzed to find the problems faced by students and suggest modifications to utilize the full potential of online education. This study investigates the effectiveness of online education by analyzing the sentiments of its stakeholders’ using social media data. The dataset used in this study has been obtained by the Twitter API using the keywords related to the topic. Various text preprocessing methods, such as stemming, normalization, tokenization, and stop words removal, etc., have been used to clean the tweets. Afterwards, lexicon-based approaches have been used to find the sentiments and label tweets. Two feature engineering techniques BoW and TD-IDF are used to classify positive, negative, and neutral reviews using several machine learning algorithms. Results indicate that using the data balancing with SMOTE enhances the classification accuracy. DT, SVM, and RF perform very well and achieved an accuracy of 0.95 using Bow and SMOTE, while SVM achieves 0.95 accuracy using TF-IDF with SMOTE. VADER and SentiWordNet techniques are also used for performance comparison with TextBlob, and results indicate that TextBlob shows superior results for data annotation as compared to VADER and SentiWordNet. Deep learning models are used in comparison with machine learning models, and results suggest the superior performance of machine learning models, primarily due to the small size of the dataset. Topic modeling through LSA suggests that the uncertainty of opening date institutions is among the most concerning topics for students. Additionally, lack of technical skills and network challenges in rural areas are major concerns for the students.

Author Contributions

Conceptualization, M.M. and F.R.; Data curation, E.L. and F.R.; Formal analysis, M.M. and P.B.W.; Funding acquisition, E.L.; Investigation, P.B.W. and F.R.; Methodology, E.L. and F.R.; Resources, S.U. and A.A.R.; Software, P.B.W. and S.U.; Supervision, M.M. and I.A.; Validation, A.A.R.; Visualization, S.U. and I.A.; Writing—review and editing, I.A. All authors have read and agreed to the published version of the manuscript.

Funding

This research was supported by the Florida Center for Advanced Analytics and Data Science funded by Ernesto.Net (under the Algorithms for Good Grant).

Institutional Review Board Statement

Not applicable.

Informed Consent Statement

Not applicable.

Data Availability Statement

Not applicable.

Conflicts of Interest

The authors declare no conflict of interest. The funders had no role in the design of the study; in the collection, analyses, or interpretation of data; in the writing of the manuscript, or in the decision to publish the results.

References

  1. Zhu, X.; Liu, J. Education in and after COVID-19: Immediate responses and long-term visions. Postdigital Sci. Educ. 2020, 2, 695–699. [Google Scholar] [CrossRef] [Green Version]
  2. Liu, C.; Long, F. The discussion of traditional teaching and multimedia teaching approach in college English teaching. In Proceedings of the International Conference on Management, Education and Social Science, Beijing, China, 16–17 January 2014; pp. 31–33. [Google Scholar]
  3. Nikoubakht, A.; Kiamanesh, A. The comparison of the effectiveness of computer-based education and traditional education on the numerical memory in students with mathematics disorder. J. Psychol. 2019, 18, 55–65. [Google Scholar]
  4. Mpungose, C.B. Emergent transition from face-to-face to online learning in a South African University in the context of the Coronavirus pandemic. Humanit. Soc. Sci. Commun. 2020, 7, 1–9. [Google Scholar] [CrossRef]
  5. Kanani, B. Stop Words—Machine Learning. 2020. Available online: https://cft.vanderbilt.edu/guides-sub-pages/blooms-taxonomy/ (accessed on 22 August 2021).
  6. Ashraf, I.; Kang, M.; Hur, S.; Park, Y. MINLOC: Magnetic field patterns-based indoor localization using convolutional neural networks. IEEE Access 2020, 8, 66213–66227. [Google Scholar] [CrossRef]
  7. Umer, M.; Ashraf, I.; Ullah, S.; Mehmood, A.; Choi, G.S. COVINet: A convolutional neural network approach for predicting COVID-19 from chest X-ray images. J. Ambient. Intell. Humaniz. Comput. 2021, 1–13. [Google Scholar] [CrossRef]
  8. Ashraf, I.; Hur, S.; Park, Y. Application of deep convolutional neural networks and smartphone sensors for indoor localization. Appl. Sci. 2019, 9, 2337. [Google Scholar] [CrossRef] [Green Version]
  9. Mehmood, A.; On, B.W.; Lee, I.; Ashraf, I.; Choi, G.S. Spam comments prediction using stacking with ensemble learning. J. Phys. Conf. Ser. Iop Publ. 2017, 933, 012012. [Google Scholar] [CrossRef]
  10. Eroğul, U. Sentiment Analysis in Turkish. Master’s Thesis, Middle East Technical University, Ankara, Turkey, 2009. [Google Scholar]
  11. Štrimaitis, R.; Stefanovič, P.; Ramanauskaitė, S.; Slotkienė, A. Financial Context News Sentiment Analysis for the Lithuanian Language. Appl. Sci. 2021, 11, 4443. [Google Scholar] [CrossRef]
  12. Rhouati, A.; Berrich, J.; Belkasmi, M.G.; Bouchentouf, T. Sentiment Analysis of French Tweets based on Subjective Lexicon Approach: Evaluation of the use of OpenNLP and CoreNLP Tools. J. Comput. Sci. 2018, 14, 829–836. [Google Scholar] [CrossRef] [Green Version]
  13. Cheeti, S.; Li, Y.; Hadaegh, A. Twitter based Sentiment Analysis of Impact of COVID-19 on Education Globaly. Int. J. Artif. Intell. Appl. 2021, 12, 15–24. [Google Scholar] [CrossRef]
  14. Relucio, F.S.; Palaoag, T.D. Sentiment analysis on educational posts from social media. In Proceedings of the 9th International Conference on E-Education, E-Business, E-Management and E-Learning, San Diego, CA, USA, 11–13 January 2018; pp. 99–102. [Google Scholar]
  15. Bhagat, K.K.; Mishra, S.; Dixit, A.; Chang, C.Y. Public Opinions about Online Learning during COVID-19: A Sentiment Analysis Approach. Sustainability 2021, 13, 3346. [Google Scholar] [CrossRef]
  16. Ashwitha, R.; Jeevitha, T.G. To Impact of COVID-19 in Education System. J. Emerg. Technol. Innov. Res. 2021, 8, 428–430. [Google Scholar]
  17. Anwar, K.; Adnan, M. Online learning amid the COVID-19 pandemic: Students perspectives. J. Pedagog. Res. 2020, 1, 45–51. [Google Scholar] [CrossRef]
  18. Althagafi, A.; Althobaiti, G.; Alhakami, H.; Alsubait, T. Arabic Tweets Sentiment Analysis about Online Learning during COVID-19 in Saudi Arabia. Int. J. Adv. Comput. Sci. Appl. 2021, 12, 620–625. [Google Scholar]
  19. Hogenboom, A.; Heerschop, B.; Frasincar, F.; Kaymak, U.; de Jong, F. Multi-lingual support for lexicon-based sentiment analysis guided by semantics. Decis. Support Syst. 2014, 62, 43–53. [Google Scholar] [CrossRef] [Green Version]
  20. Mamtesh, M.; Mehla, S. Sentiment Analysis of Movie Reviews using Machine Learning Classifiers. Int. J. Comput. Appl. 2019, 182, 25–28. [Google Scholar] [CrossRef]
  21. Samuel, J.; Ali, G.; Rahman, M.; Esawi, E.; Samuel, Y. COVID-19 public sentiment insights and machine learning for tweets classification. Information 2020, 11, 314. [Google Scholar] [CrossRef]
  22. Jagdale, R.S.; Shirsat, V.S.; Deshmukh, S.N. Sentiment analysis on product reviews using machine learning techniques. In Cognitive Informatics and Soft Computing; Springer: Berlin/Heidelberg, Germany, 2019; pp. 639–647. [Google Scholar]
  23. Devika, M.; Sunitha, C.; Ganesh, A. Sentiment analysis: A comparative study on different approaches. Procedia Comput. Sci. 2016, 87, 44–49. [Google Scholar] [CrossRef] [Green Version]
  24. Liu, B. Sentiment analysis and opinion mining. Synth. Lect. Hum. Lang. Technol. 2012, 5, 1–167. [Google Scholar] [CrossRef] [Green Version]
  25. Rustam, F.; Khalid, M.; Aslam, W.; Rupapara, V.; Mehmood, A.; Choi, G.S. A performance comparison of supervised machine learning models for COVID-19 tweets sentiment analysis. PLoS ONE 2021, 16, e0245909. [Google Scholar] [CrossRef]
  26. Hussain, A.; Tahir, A.; Hussain, Z.; Sheikh, Z.; Gogate, M.; Dashtipour, K.; Ali, A.; Sheikh, A. Artificial intelligence–enabled analysis of public attitudes on facebook and Twitter toward COVID-19 vaccines in the united kingdom and the united states: Observational study. J. Med. Internet Res. 2021, 23, e26627. [Google Scholar] [CrossRef]
  27. Alamoodi, A.; Zaidan, B.; Zaidan, A.; Albahri, O.; Mohammed, K.; Malik, R.; Almahdi, E.; Chyad, M.; Tareq, Z.; Albahri, A.; et al. Sentiment analysis and its applications in fighting COVID-19 and infectious diseases: A systematic review. Expert Syst. Appl. 2020, 167, 114155. [Google Scholar] [CrossRef] [PubMed]
  28. Imran, A.S.; Daudpota, S.M.; Kastrati, Z.; Batra, R. Cross-Cultural Polarity and Emotion Detection Using Sentiment Analysis and Deep Learning on COVID-19 Related Tweets. IEEE Access 2020, 8, 181074–181090. [Google Scholar] [CrossRef]
  29. Chintalapudi, N.; Battineni, G.; Amenta, F. Sentimental Analysis of COVID-19 Tweets Using Deep Learning Models. Infect. Dis. Rep. 2021, 13, 329–339. [Google Scholar] [CrossRef] [PubMed]
  30. Pace, C.; Pettit, S.K.; Barker, K.S. Best practices in middle level quaranteaching: Strategies, tips and resources amidst COVID-19. Becom. J. Ga. Assoc. Middle Level Educ. 2020, 31, 2–13. [Google Scholar] [CrossRef]
  31. Liguori, E.; Winkler, C. From Offline to Online: Challenges and Opportunities for Entrepreneurship Education Following the COVID-19 Pandemic. Entrep. Educ. Pedagog. 2020, 3, 346–351. [Google Scholar]
  32. Reddy, A.; Vasundhara, D.; Subhash, P. Sentiment Research on Twitter Data. Int. J. Recent Technol. Eng. 2019, 8, 1068–1070. [Google Scholar]
  33. Jivani, A. A Comparative Study of Stemming Algorithms. Int. J. Comp. Tech. Appl. 2011, 2, 1930–1938. [Google Scholar]
  34. Armstrong, P. Bloom’s Taxonomy. Vanderbilt University Center for Teaching. 2019. Available online: https://studymachinelearning.com/nlp-stop-words/ (accessed on 23 August 2021).
  35. Loria, S. textblob Documentation. Release 0.15 2018, 2, 269. [Google Scholar]
  36. Sohangir, S.; Petty, N.; Wang, D. Financial sentiment lexicon analysis. In Proceedings of the 2018 IEEE 12th International Conference on Semantic Computing (ICSC), Laguna Hills, CA, USA, 31 January–2 February 2018; IEEE: New York, NY, USA, 2018; pp. 286–289. [Google Scholar]
  37. Rupapara, V.; Rustam, F.; Shahzad, H.F.; Mehmood, A.; Ashraf, I.; Choi, G.S. Impact of SMOTE on Imbalanced Text Features for Toxic Comments Classification using RVVC Model. IEEE Access 2021, 78621–78634. [Google Scholar] [CrossRef]
  38. Eshan, S.C.; Hasan, M.S. An application of machine learning to detect abusive bengali text. In Proceedings of the 2017 20th International Conference of Computer and Information Technology (ICCIT), Dhaka, Bangladesh, 22–24 December 2017; IEEE: New York, NY, USA, 2017; pp. 1–6. [Google Scholar]
  39. Zhang, W.; Yoshida, T.; Tang, X. A comparative study of TF* IDF, LSI and multi-words for text classification. Expert Syst. Appl. 2011, 38, 2758–2765. [Google Scholar] [CrossRef]
  40. Robertson, S. Understanding inverse document frequency: On theoretical arguments for IDF. J. Doc. 2004. [Google Scholar] [CrossRef] [Green Version]
  41. George, K.M.; Soundarabai, P.B.; Krishnamurthi, K. Impact Of Topic Modelling Methods In addition, Text Classification Techniques In Text Mining: A Survey. Int. J. Adv. Electron. Comput. Sci. 2017, 4, 72–77. [Google Scholar]
  42. Deerwester, S.; Dumais, S.T.; Furnas, G.W.; Landauer, T.K.; Harshman, R. Indexing by latent semantic analysis. J. Am. Soc. Inf. Sci. 1990, 41, 391–407. [Google Scholar] [CrossRef]
  43. Zainuddin, N.; Selamat, A. Sentiment analysis using support vector machine. In Proceedings of the 2014 International Conference on Computer, Communications, and Control Technology (I4CT), Langkawi, Malaysia, 2–4 September 2014; IEEE: New York, NY, USA, 2014; pp. 333–337. [Google Scholar]
  44. AnithaElavarasi, S.; Jayanthi, J.; Basker, N. A comparative study on logistic regression and svm based machine learning approach for analyzing user reviews. Turk. J. Physiother. Rehabil. 2021, 32, 3564–3570. [Google Scholar]
  45. Safavian, S.R.; Landgrebe, D. A survey of decision tree classifier methodology. IEEE Trans. Syst. Man, Cybern. 1991, 213, 660–674. [Google Scholar] [CrossRef] [Green Version]
  46. Donges, N. He Random Forest Algorithm. 2021. Available online: https://builtin.com/data-science/random-forest-algorithm (accessed on 22 August 2020).
  47. Rustam, F.; Ashraf, I.; Mehmood, A.; Ullah, S.; Choi, G.S. Tweets classification on the base of sentiments for US airline companies. Entropy 2019, 21, 1078. [Google Scholar] [CrossRef] [Green Version]
  48. Soucy, P.; Mineau, G.W. A simple KNN algorithm for text categorization. In Proceedings of the 2001 IEEE International Conference on Data Mining, San Jose, CA, USA, 29 November–2 December 2001; IEEE: New York, NY, USA, 2001; pp. 647–648. [Google Scholar]
  49. Brownlee, J. Machine Learning Naive Baiyes. 2021. Available online: https://machinelearningmastery.com/better-naive-bayes/ (accessed on 20 August 2020).
  50. Fuhua, S. Research of the Improved Adaboost Algorithm Based on Unbalanced Data. Int. J. Comput. Sci. Netw. Secur. 2014, 14, 14. [Google Scholar]
  51. Ohana, B.; Tierney, B. Sentiment classification of reviews using SentiWordNet. In Proceedings of the 9th IT&T Conference, Dublin, Ireland, 22–23 October 2009. [Google Scholar] [CrossRef]
  52. Jamil, R.; Ashraf, I.; Rustam, F.; Saad, E.; Mehmood, A.; Choi, G.S. Detecting sarcasm in multi-domain datasets using convolutional neural networks and long short term memory network model. PeerJ Comput. Sci. 2021, 7, e645. [Google Scholar] [CrossRef]
  53. Mohammed, S.H.; Al-augby, S. Lsa & lda topic modeling classification: Comparison study on e-books. Indones. J. Electr. Eng. Comput. Sci. 2020, 19, 353–362. [Google Scholar]
Figure 1. Architecture of the proposed methodology.
Applsci 11 08438 g001
Figure 2. Ratio of sentiment with and without SMOTE.
Applsci 11 08438 g002
Figure 3. Models’ performance comparison using BoW and TF-IDF on the original imbalanced dataset.
Applsci 11 08438 g003
Figure 4. Models’ performance comparison on BoW and TF-IDF features when we used the SMOTE technique.
Applsci 11 08438 g004
Figure 5. Models’ performance comparison using Textbob, VADER, and SentiWordNet techniques, (a) with BoW features on the original dataset; (b) with BoW features on the SMOTE balanced dataset; (c) with TF-IDF features on the original imbalanced dataset; and (d) with TF-IDF features on the SMOTE balanced dataset.
Applsci 11 08438 g005
Figure 6. Architecture of deep learning models used for sentiment classification.
Applsci 11 08438 g006
Table 1. A summary of related work.
Ref.Model/ApproachAimDatasetLimitations
 [13]Naive-based classifier (model)Sentiment analysis of tweets on education during COVID-19The area of study has generated nearly 90,000 tweets.Study did not perform topic modeling and accuracy is not significant.
 [14]Web analytics approachFind sentiment on educational postsA total of 1717 tweets collected from Twitter.Study did not use a machine learning approach.
 [15]Dictionary based approachPublic Opinion on Online Learning in COVID-19154 articles collected from Google.Study did not use a machine learning approach.
 [16]NLP techniques and Logistic regression classifierSentiment Analysis on COVID-19 Epidemic’s EducationGoogle Forms is used to collect data.Study did not perform topic modeling and accuracy is not significant.
 [18]Naïve Bayes, KNN and random forestSentiment analysis of online education during coronavirus10,445 tweets were gathered using the Twitter API.Study did not perform topic modeling to discuss the reason behind negative sentiments
 [20]KNN, Naïve Bayes, and Logistic regressionSentiment analysis of movies reviewsThe data set is compiled from a variety of sources.Study is not about online education sentiment analysis.
 [21]Machine learning (KNN & Naïve Bayes)COVID-19 tweets public sentiment classificationMore than 900,000 COVID-19 tweets.Study is about general COVID-19 tweets sentiment analysis not about online education.
 [22]Machine learning (SVM and Naive Bayes)Sentiment analysis on product reviewsOver 13,000 tweets obtained from six product reviews.Study is not about online education sentiment analysis.
 [28]Deep learning (Multi-layer LSTM)Sentiment analysis on COVID-19A total of 27,357 tweets related to COVID-19Accuracy is not significant and its about general COVID-19 tweets.
 [29]Deep learning (BERT and LSTM)Sentiment analysis on COVID-19A total of 3090 tweets related to COVID-19Accuracy is not significant and its about general COVID-19 tweets
Table 2. Sample tweets from the collected dataset.
UserLocationTweets Text
educationblogUSA#EDUCATION: #Children read longer #books of greater difficulty during #lockdown periods last year, and reported tha a ^ €| https://t.co/S9UbQtKWZL (accessed on 1 September 2021)
StudentGujarat, IndiaWe havenot been given online education, so we r in severe depression
brenda11831USA8.4 million fewer jobs than in February 2020, just before #coronavirus shut down large swaths of the U.S. economy a ^ €| https://t.co/DevQfUWDMW (accessed on 1 September 2021) 8.4 million fewer jobs than in February 2020, just before #coronavirus shut down large swaths of the U.S. economy a ^ | https://t.co/DevQfUWDMW (accessed on 1 September 2021)
Table 3. Sentiment score assigned by TextBlob.
UserTextPolarity ScoreSentiment
NEC_Educationfunctional skill key open opportunity wide range career include apprentice−0.05−1
Tutor_eduonixjoin free live workshop COVID-19 mental health amp mindful0.1451
PrincipalTameducation around learn credible source poor0.00
Table 4. Sample tweets from the dataset before and after preprocessing.
Tweets before Pre-Processing Tweets after Pre-Processing
People have to take more precaution. time to educate everyone effectively to undo Covid19 second wave.people precaution time educate everyone effect undo covid19 second wave
In the meantime, #COVID-19 cases in schools have not flared up as much as some feared amid the #pandemic restrict€| https://t.co/tcVBMglgOB (accessed on 1 September 2021)meantime covid19 case school flare fear amid pandemic restrict
England: High school face mask may be liftedengland high school face mask lift
If education around learning what a credible source is wasn’t so poor, this wouldn’t be necessary. It’s amazingly d a ^ €| https://t.co/8sb71lALo6 (accessed on 1 September 2021)educ around learn credible source poor necessary its amaze
Table 5. Train and test count after data splitting.
TechniqueDatasetPositiveNegativeNeutralTotal
Total data76631768772417,155
OriginalTesting set436189919544289
Training set57641332577012,866
Total data77247724772423,172
SMOTETesting set1977195018665793
Training set57475774585817,379
Table 6. Two sample tweets from the dataset are taken for Bag of Words features on preprocessed data.
SEnglandHighSchoolFaceMaskLiftWearRightWayLength
11111110006
20000101114
Table 7. TF-IDF features on preprocessed data taken from the dataset.
TermsTF (doc1)TF (doc2)IDFTF-IDF (doc1)TF-IDF (doc2)
england1/600.30100.0500
high1/600.30100.0500
school1/600.30100.0500
face1/600.30100.0500
mask1/61/4000
may1/600.30100.0500
lift1/600.30100.0500
wear01/40.301000.07525
right01/40.301000.07525
way01/40.301000.07525
Table 8. Brief description of machine learning models used in this study.
ModelsDescription
SVMSVM is one of the most widely used models for sentiment analysis [43]. It performs classification by locating the hyper-plane that is the best match for differentiating the classes. SVM is a linear model which is used with kernel sigmoid and a c = 3.0 parameter (see Table 9).
LRLR is a supervised machine learning algorithm used to determine the probabilities of output variable [44]. It performs well when the nature of the output or dependent variable is binary, but it can also be good for multi-class data classification. It used the logistic function to categorize the data.
DTDT collects data in the form of a tree, which may alternatively be expressed as a collection of discrete rules [45]. Decision trees can handle big data well. The DT algorithm works to split the record according to the attribute selection measures technique and select the best set of attributes.
RFRF is a supervised learning algorithm. It can be used for both classification and regression. This algorithm is also the most flexible and easy to use [46]. The forest is made of trees, more trees in the forest, and the stronger they will be in prediction. RF makes random trees from randomly selected data samples, makes predictions from each tree, and votes for the best solution.
SGDSGD Classifier is a linear classifier that implements regularized linear models with a stochastic gradient descent as the cost function [47]. It supplies regularized linear models with SGD learning to build an estimator. The SGD classifier works well with large-scale datasets, and it is efficient and easy to implement the method. SGD is implemented using the sci-kit library.
KNNIt is a supervised machine learning model used for classification of data [48]. It is a simple model which is easy to implement and interpret. KNN is also known as a lazy learner because it makes predictions based on the nearest neighbor by finding the distance. It performs well when the size of data is not too large.
GNBThe GNB algorithm is a special kind of Naive Bayes algorithm that is unique. It is mostly used with continuous features. It is also expected that all of the characteristics have a Gaussian distribution or a normal distribution. Naive Bayes algorithms work on the basis of the Bayes theorem. If the data contain strongly correlated characteristics, the performance of Naive Bayes might suffer [49].
AdaBoostAdaBoost is termed adaptive boosting, which is a supervised machine learning model used for the classification of data. It used a boosting mechanism to boost the classification accuracy. Adaboost used DT as a base leaner (“weak learner”) by default. The output of the learning algorithm is associated with weight, which is the end result of the density assessment [50].
ETCETC is a tree-based ensemble model used for the classification of data by training/fitting a large number of weak learners (randomized decision trees) on distinct samples of the dataset, ETC uses the majority voting criteria to enhance prediction accuracy [25]. It is an ensemble learning model that works similarly to RF. The only difference between ETC and RF is how the forest trees are constructed.
Table 9. The hyper-parameter settings of machine learning models.
ModelsHyper-Parameters
RFn_estimators = 300, max_depth = 300
LRsolver = “saga”, multi_class = “multinomial”, C = 3.0
SVMKernel = “linear”, C = 3.0
DTmax_depth = 300, random state =2
KNNn_neighbour = 5
AdaBoostn_estimator = 50, learning_rate =0.1
GNBDefault setting
SGDmax iter = 200, tol = 1× 10 3
ETCn_estimators = 300, max_depth = 300
Table 10. Results using BoW features on the original dataset.
ModelsAccuracyClassPrecisionRecallF1 Score
LR0.9300.920.920.92
10.970.930.95
−10.900.950.92
Macro avg0.930.930.93
RF0.8600.860.790.82
10.960.830.89
−10.780.950.86
Macro avg0.860.860.86
DT0.8300.840.730.78
10.920.830.87
−10.760.950.84
Macro avg0.840.830.83
KNN0.5200.300.870.45
10.270.970.42
−10.990.410.58
Macro avg0.520.750.48
SVM0.9400.940.920.93
10.980.940.99
−10.890.950.92
Macro avg0.940.940.94
AdaBoost0.6900.531.000.70
10.940.740.83
−10.980.330.49
Macro avg0.820.690.67
GNB0.7800.910.630.74
10.870.770.82
−10.650.930.77
Macro avg0.810.780.78
ETC0.8000.790.720.75
10.870.760.82
−10.760.930.84
Macro avg0.810.800.80
SGD0.9400.930.930.93
10.970.940.96
−10.910.950.93
Macro avg0.940.940.94
Table 11. Results using BoW features and the SMOTE technique.
ModelsAccuracyClassPrecisionRecallF1 Score
LR0.9300.910.990.95
10.980.930.95
−10.940.720.81
Macro avg0.940.880.90
RF0.9500.910.990.95
10.980.930.94
−10.950.780.86
Macro avg0.950.900.92
DT0.9500.950.950.96
10.970.950.96
−10.860.850.84
Macro avg0.930.920.92
KNN0.6200.990.550.71
10.300.960.45
−10.410.920.57
Macro avg0.560.810.58
SVM0.9500.930.990.96
10.980.950.96
−10.890.800.84
Macro avg0.940.920.92
AdaBoost0.7800.681.000.81
10.970.590.73
−10.870.620.72
Macro avg0.840.740.76
GNB0.7800.910.630.74
10.870.770.82
−10.650.930.77
Macro avg0.810.780.78
ETC0.8900.900.920.91
10.930.900.91
−10.730.790.76
Macro avg0.860.870.86
SGD0.9400.920.990.95
10.980.940.96
−10.940.810.87
Macro avg0.950.910.93
Table 12. Results using TF-IDF features on the original dataset.
ModelsAccuracyClassPrecisionRecallF1 Score
LR0.9300.910.920.91
10.980.920.95
−10.900.940.92
Macro avg0.930.930.93
RF0.8500.840.770.81
10.970.840.90
−10.770.940.85
Macro avg0.860.850.85
DT0.8300.830.730.78
10.920.820.87
−10.760.940.84
Macro avg0.840.830.83
KNN0.5200.290.880.44
10.270.970.43
−11.000.410.58
Macro avg0.520.760.48
SVM0.9400.920.910.91
10.980.930.96
−10.880.940.91
Macro avg0.930.930.93
AdaBoost0.7000.541.000.70
10.950.740.83
−10.980.360.52
Macro avg0.820.700.68
GNB0.7800.920.650.76
10.870.770.82
−10.650.930.77
Macro avg0.810.780.78
ETC0.8000.780.710.74
10.870.770.82
−10.760.930.84
Macro avg0.810.800.80
SGD0.9400.910.930.92
10.980.940.96
−10.920.940.93
Macro avg0.940.940.94
Table 13. Results using TF-IDF features and the SMOTE technique.
ModelsAccuracyClassPrecisionRecallF1 Score
LR0.9200.880.990.93
10.960.930.94
−10.970.600.74
Macro avg0.940.840.87
RF0.9400.901.000.95
10.980.920.95
−10.960.760.85
Macro avg0.950.890.92
DT0.9300.940.940.94
10.950.950.95
−10.820.830.82
Macro avg0.900.910.90
KNN0.6000.980.540.70
10.260.950.70
−10.440.700.57
Macro avg0.560.750.58
SVM0.9500.910.990.95
10.980.930.95
−10.940.780.85
Macro avg0.940.900.92
AdaBoost0.7700.681.000.81
10.970.590.73
−10.870.620.72
Macro avg0.840.740.76
GNB0.6800.910.580.71
10.870.750.81
−10.240.780.37
Macro avg0.680.700.63
ETC0.9100.920.930.93
10.930.920.93
−10.810.810.81
Macro avg0.890.890.89
SGD0.9400.890.990.94
10.980.930.95
−10.980.730.84
Macro avg0.950.880.91
Table 14. Summary of models’ performance with BoW and TF-IDF.
ModelAccuracy with BoWAccuracy with TF-IDF
With SMOTEOriginalWith SMOTEOriginal
LR0.930.930.920.93
RF0.950.860.940.85
DT0.950.830.930.83
KNN0.620.520.600.52
SVM0.950.940.950.94
AdaBoost0.780.690.770.70
GNB0.780.780.680.78
ETC0.890.800.910.80
SGD0.940.940.940.94
Table 15. Confusion Matrix of a model using TF-IDF and BoW without SMOTE and using SMOTE.
ModelsWithout SMOTEUsing SMOTE
BoWTF-IDFBoWTF-IDF
CPWPCPWPCPWPCPWP
LR4013276388940053953985471322
SVM4047242403225754283655610183
RF4042247403025950107835462331
DT4018271400028948189755506287
KNN4018271400028948189755506287
AdaBoost335493533169734015177844071386
GNB29101379291113784501129241261667
ETC38614283918371470510885169624
SGD4061228398230754403535536257
Table 16. 10-fold cross-validation results.
ModelSMOTEOriginal
BoWTF-IDFBoWTF-IDF
LR0.93 (±0.03)0.90 (±0.03)0.91 (±0.06)0.91 (±0.04)
RF0.93 (±0.03)0.93 (±0.03)0.83 (±0.08)0.93 (±0.04)
DT0.93 (±0.04)0.92 (±0.04)0.80 (±0.08)0.92 (±0.05)
KNN0.58 (±0.08)0.56 (±0.08)0.48 (±0.10)0.47 (±0.09)
SVM0.94 (±0.03)0.94 (±0.02)0.92 (±0.06)0.93(±0.04)
Adaboost0.77 (±0.04)0.77 (±0.04)0.69 (±0.04)0.74 (±0.04)
GNB0.78 (±0.03)0.78 (±0.05)0.74 (±0.04)0.75 (±0.04)
ETC0.86 (±0.05)0.86 (±0.04)0.77 (±0.06)0.85 (±0.05)
SGD0.95 (±0.02)0.92(±0.02)0.93 (±0.04)0.92(±0.04)
Table 17. Vader and SWN train and test count after data splitting.
Re-SamplingTechniquePositiveNegativeNeutral
Without SMOTEVADER886123735921
SentiWordNet960625475002
SMOTEVADER886188618861
SentiWordNet960696069606
Table 18. Model results using the VADER and SentiWordNet technique.
ModelVADERVADER + SMOTESentiWordNetSentiWordNet + SMOTE
BoWTF-IDFBoWTF-IDFBoWTF-IDFBoWTF-IDF
LR0.860.880.890.860.830.800.800.83
RF0.830.900.880.870.840.830.790.88
DT0.810.880.890.880.820.820.770.87
KNN0.570.650.550.530.530.460.590.65
SVM0.860.890.890.880.830.820.790.83
Adaboost0.660.700.700.690.670.670.590.65
GNB0.720.720.620.630.450.450.650.65
ETC0.800.860.900.840.780.800.760.84
SGD0.850.870.900.880.840.820.780.81
Table 19. Performance of deep learning models with each lexicon technique.
TechniqueModelAccuracyPrecisionRecallF1 Score
TextblobLSTM0.940.920.910.91
CNN0.910.900.870.88
CNN-LSTM0.920.890.880.89
Bi-LSTM0.940.930.940.93
VADERLSTM0.910.890.890.89
CNN0.880.870.850.86
CNN-LSTM0.890.870.860.86
Bi-LSTM0.920.910.890.90
SentiWordNetLSTM0.850.820.800.81
CNN0.820.790.770.78
CNN-LSTM0.820.790.770.78
Bi-LSTM0.850.820.800.81
Table 20. Topic modeling with LSA for positive tweets.
Topic #Keywords
1help history need paper online academic paysomeone mathematics accounts study
2covid education blockchain business boove onlineclasses coronavirus higher assignments pandemic
3onlinelearning students learning highereducation byjus help school assignmentdue essaywriting onlineclasses
4highereducation due amp history coronavirus depression given also cancel severe
5research get coronavirus may available today someonehelppaper onlinecourses also essaydue
6courses pandemic student parents remote day see year kids college
7one history week freeonlinecourses children check digital psychology class latest
8webinar follow classroom complete top lms app science never hit
9teachers student one college join university looking essaypay visit video
10take children want future via home way top stay onlineeducation
Table 21. Topic modeling with LSA for negative tweets.
Topic #Keywords
1schools closed may remain till minister education class said
2children disabilities near challenging proved families onlineeducation impossible class puc
3disabilities missing lagging network performing securitycameras switches families challenging proved
4pandemic coronavirus back staying individuals furthermore resorted widespread home research
5learning deadline miss difficult covid 19 econometrics highereducation month offers
6deadline miss onlineclasses onlinecourses b2b reach hesitate maths lead
7time school year hard boring highereducation make late past elearning
8need training 2021 schools center remote green belt lean sigma
9little onlinelearning needs minister amp mytutorhub whether teach COVID-19
10forced mytutorhub virtual boring needs internet teach subject educator coronavirus
Publisher’s Note: MDPI stays neutral with regard to jurisdictional claims in published maps and institutional affiliations.

