
Implementation of a Ventilation Protocol for SARS-CoV-2 in a Higher Educational Centre
by
 , , and
Alberto Meiss
* ,
,
Irene Poza-Casado
*,
Alfredo Llorente-Álvarez
,
Héctor Jimeno-Merino
and
Miguel Ángel Padilla-Marcos
RG Architecture & Energy, Universidad de Valladolid, Av. Salamanca, 18-47014 Valladolid, Spain
*
Authors to whom correspondence should be addressed.
Energies 2021, 14(19), 6172; https://doi.org/10.3390/en14196172
Submission received: 1 September 2021
/
Revised: 12 September 2021
/
Accepted: 23 September 2021
/
Published: 27 September 2021
(This article belongs to the Special Issue Energy Efficiency and Indoor Environment Quality)
Abstract
:The most recent research confirms that airborne transmission may be the dominant mode of SARS-CoV-2 virus spread in the interior spaces of buildings. Consequently, based on some prescriptions that implemented natural ventilation during face-to-face lessons in a university centre, an experimental characterization of several complementary options aimed at reinforcing the prevention and safety of the occupants was carried out. The action protocol adopted was based on the combination of mandatory natural ventilation, a maximum contribution of outdoor air supply in the air conditioning system, and the use of filtering devices located inside the classroom. All the strategies were incorporated concomitantly with necessary compliance with the basic conditions of social distance, occupation, use of masks and guidelines for use and cleaning within educational buildings. The suitability of this protocol was further evaluated throughout the teaching day with students and teachers by measuring the CO2 concentration. The results showed that the measures implemented successfully removed the possible pollutants generated inside.
1. Introduction
Throughout the current global pandemic caused by the SARS-CoV-2 virus, there has been a significant evolution of the knowledge of contagion. In the early stages of preventive action, the recognized contagion mechanisms were [1]:
- Direct contact between a healthy person and an infected person;
- Indirect contact or transmission through fomites, in which a healthy individual gets infected through his/her mucosae or conjunctiva after touching a contaminated object or surface;
- Close contact through respiratory droplet transmission and contact routes. “Large droplets” or “ballistic droplets” (greater than approximately 100 μm) are expelled by an infected person when coughing, sneezing and, to a lesser extent, when speaking.
At the beginning of February 2020, it was still not considered necessary for the population to wear face masks. In this way, mandating the population to assume protection mechanisms that might not make sense was avoided [2]. It was in May 2020 when the mandatory use of masks was decreed in Spain [3], following the pattern of the rest of the developed countries, with the predominant aim of blocking the emission of “large droplets” infected with the virus.
Only recently, in April 2021, has the World Health Organization (WHO) begun to as-sess airborne transmission, although emphasis continues to be placed on the fomite path and large droplets [4]. However, there is a current endorsement by a growing number of scientists who do not agree with this limited view [5].
In the field of interior spaces in buildings, the term bioaerosol includes the droplets exhaled by people which can be between 0.4 and 100 μm and remain suspended in the air for a long time [6]. In other contexts, the emission sources can be any living beings in any terrestrial or marine ecosystem.
At an early date (July 2020), the Directorate of the Architecture Technical School in Valladolid developed a supplementary strategy to face a possible airborne transmission method in addition to the strict measures adopted regarding social distance, occupancy, the use of masks and guidelines for the use and cleaning of the building.
It is important to inform society that bioaerosols may be the dominant mode of transmission of the SARS-CoV-2 virus, with some contribution from the fomite pathway and an even smaller contribution of large droplets.
2. State of the Art
2.1. Bioaerosols and SARS-CoV-2
Bioaerosols can contain in their structure:
- Pathogenic bacteria and fungi;
- Virus;
- Allergens and endotoxins;
- Pollen and plant fibres.
The size of an individual SARS-CoV-2 virus is very small (around 0.10 μm), which enables its lodgement in the bioaerosols generated by an infected person (Figure 1).
The virus uses the bioaerosol as a means of transport and, depending on the bioaerosol’s size, can affect different organs of the recipient body, which in turn influences the viral load that will determine the contagion.
All bioaerosols smaller than 100 μm can be inhaled. There are three main mechanisms for the deposition of bioaerosols in the respiratory tract (Figure 2):
- The larger ones, once aspirated, do not transcend beyond the vicinity of the nostrils and mouth, since they move with difficulty and impact with the walls of those cavities;
- Bioaerosols smaller than 10 μm can penetrate deeper into the respiratory tract and the viruses contained in them can reach its receptors;
- For bioaerosols in the range around 0.3 μm, a singular fact occurs: a significant percentage of bioaerosols are deposited in the respiratory tract when inhaling and are released again when exhaling. This range matches the aerosols of cigarette smoke, and that is the reason why smoke is exhaled when smoking;
- Finally, the smallest bioaerosols are very diffusive, having a high Brownian movement, so that many of them do not transcend beyond the nostrils and mouth.
2.2. Classification of the Droplets Emitted by People
In the case of sedentary or light activity (1.0 to 1.2 met), human emissions through the respiratory tract are limited to events such as breathing, speaking, coughing or sneezing. In each of these events, a mixture of air and droplets of different sizes and at a variable speed is exhaled (Table 1).
Their distribution based on sizes also varies according to the type of event, which in-fluences the way in which contagion from the infected person could occur (Figure 3, [9,10,11,12]). A usual classification establishes three ranges of size:
- Larger droplets (greater than 300 μm);
- Transition droplets (size between 100 and 300 μm);
- Bioaerosols (smaller than 100 μm).
2.3. Evaporation
Evaporation processes affect bioaerosols emitted by people. Thus, the distribution according to droplet size is not only dependent on the event but also a transformation through evaporation (Figure 4). This significantly affects the transition droplets (between 100 and 300 μm).
Thus, the rate of evaporation of the droplets depends on the humidity conditions of the environment (the lower the humidity, the higher the evaporation) and the emission speed (depending on the type of event). Based on these parameters, part of the droplets precipitate and others undergo an evaporation process, which allows them to diffuse as bioaerosols (Figure 5). Large droplets are those that could cause infection if they hit the eyes, nose, or mouth of a healthy person. In these cases, social distance greater than 1 m serves as effective protection, as well as the mandatory use of masks.
It is the particles smaller than 100 μm that normally acquire the properties of an air-diffused bioaerosol, which, when inhaled, transmit the disease through the respiratory tract.
A fundamental question is to know how long the SARS-CoV-2 virus remains infectious in bioaerosols emitted by a patient. The life expectancy of the virus is conditioned by the loss of viral infectivity.
However, there is still no consensus on this matter since the time varies between 1 and 3 h under typical temperature and humidity conditions (20 °C and 50% RH) [15,16,17]. This range of time is important in order to confirm that any virus present in the air of a room has lost its contagiousness after a few hours. On the other hand, it has been demonstrated that the virus remains infectious over much longer periods of time on surfaces (Table 2).
2.4. Dynamic Behaviour of Bioaerosols
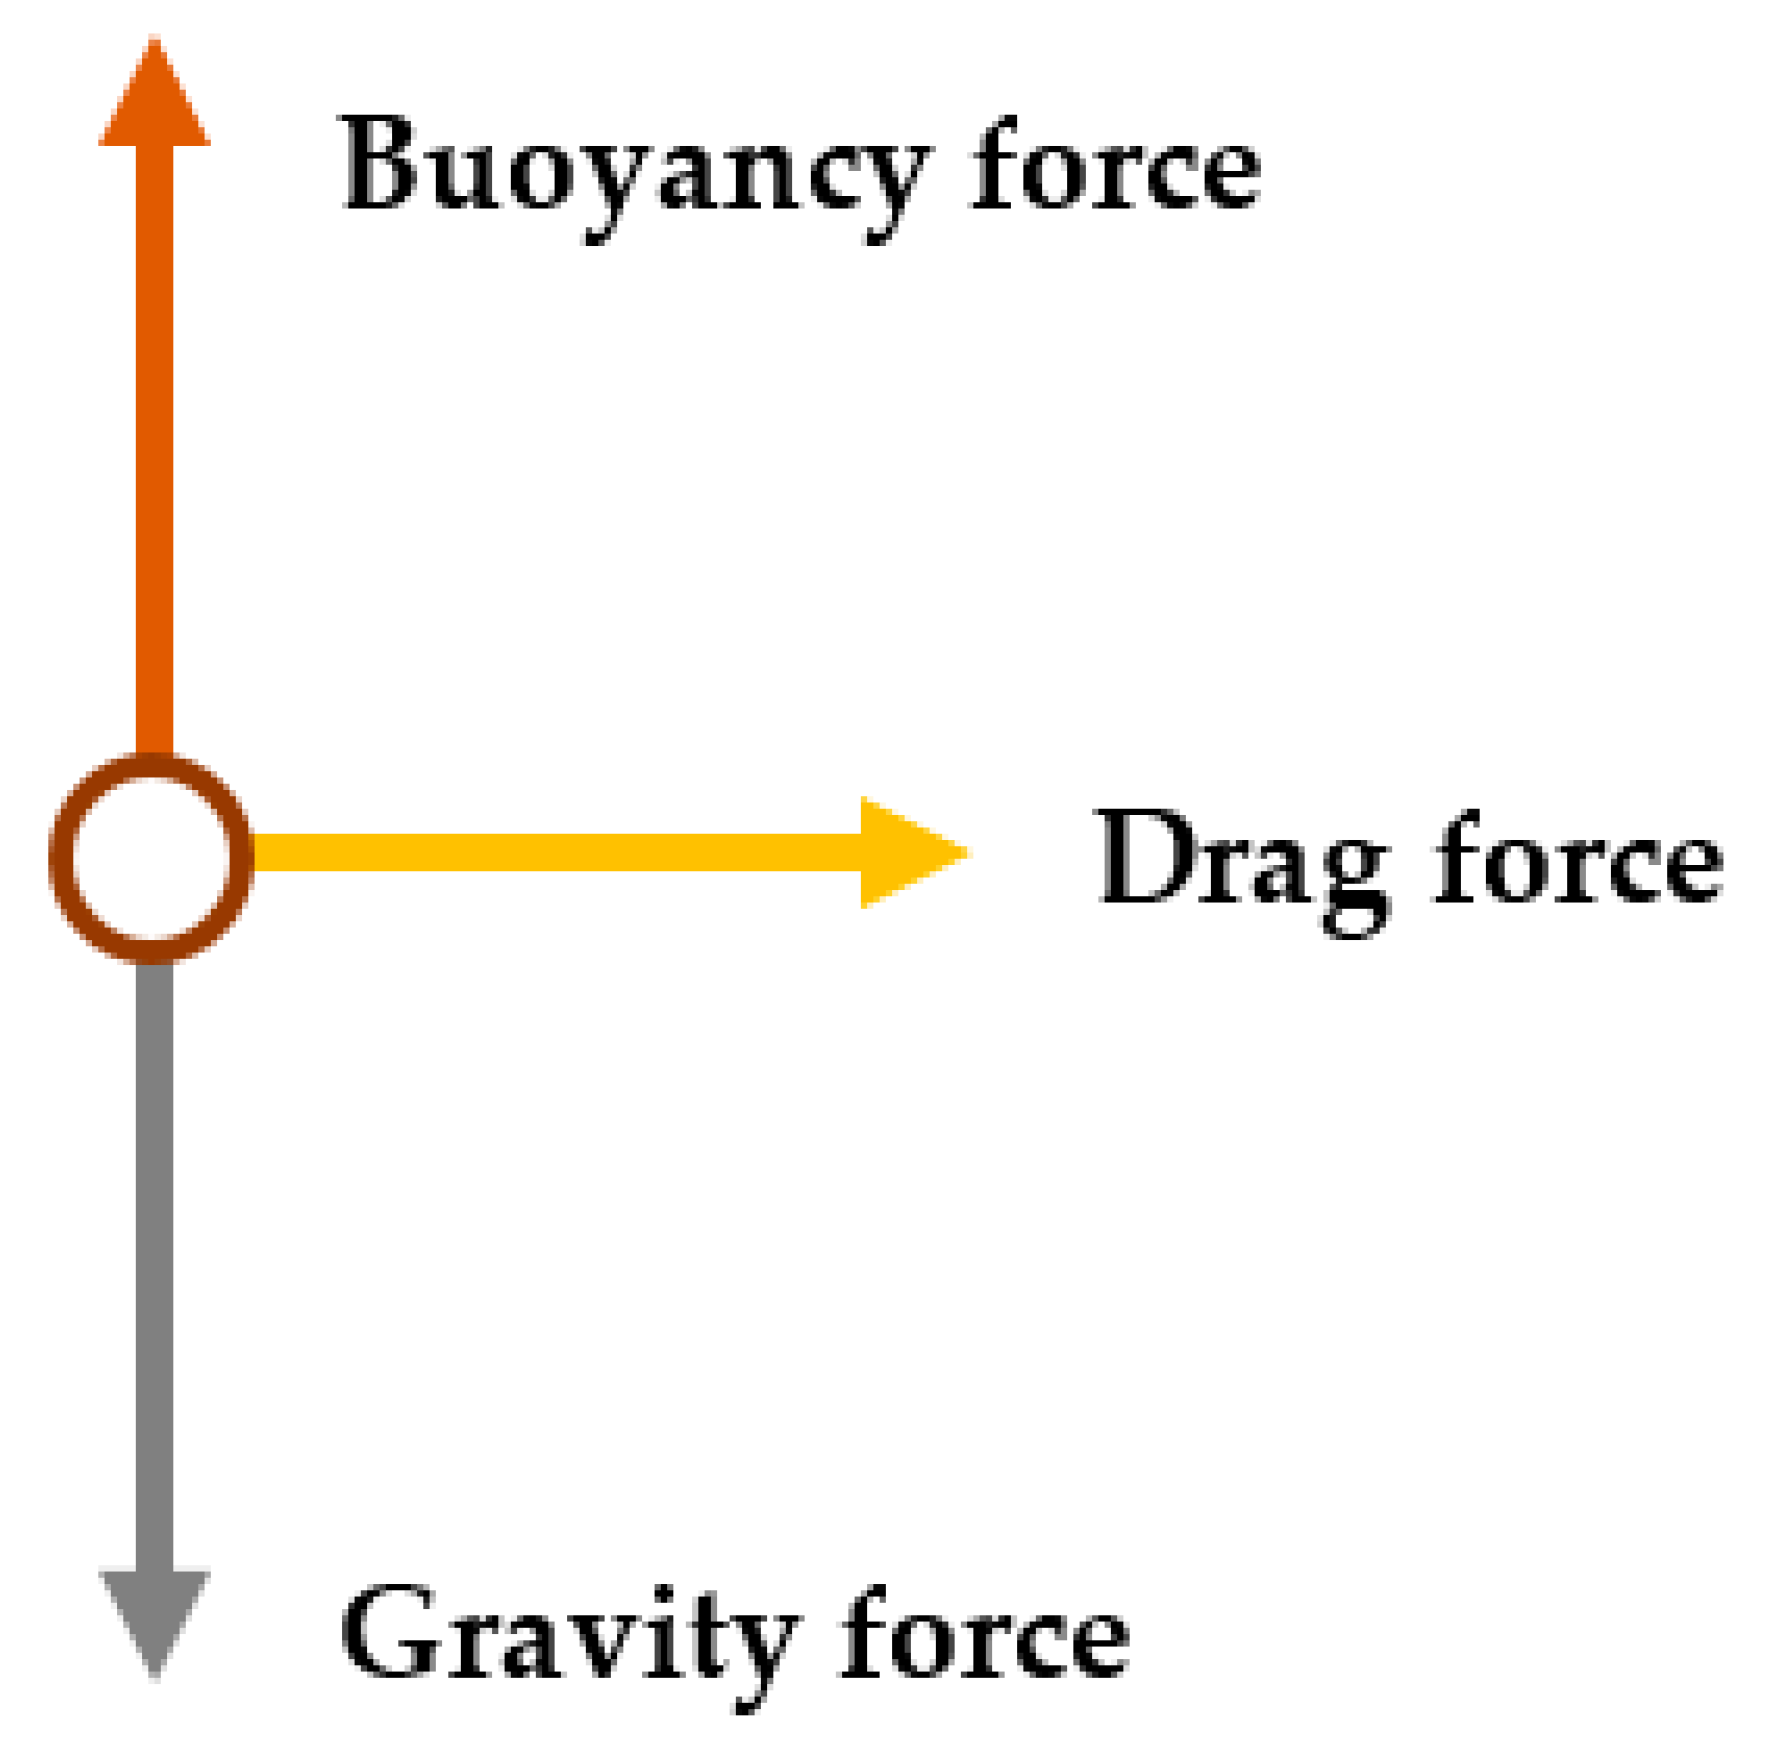
Once the droplet is emitted by the infected person, its dynamic behaviour is deter-mined by the simultaneous and combined action of a system of forces. The acting forces are the gravity force, the buoyancy force and the drag force (Figure 6). The preponderance of one over the others basically depends on the size of the droplet, which determines its diffusion and permanence in the air of the room.
In the case of the larger droplets, the drag force (from the impulse speed) and the gravity force are dominant, so their impact or their precipitation is favoured after a few seconds. In the case of bioaerosols, buoyancy is the main force, favouring their diffusion and increasing their permanence in the air.
2.5. Standard Protocol
Therefore, it is verified that bioaerosols serve as a vehicle for transporting the SARS-CoV-2 virus when they are emitted from an infected person. Its diffusion capacity is very wide, being able to follow a highly variable pathway from its emission until the bioaerosol leaves the room or the virus loses its infectivity. For this reason, it is necessary to adequately ventilate interior spaces.
The instructions received from the government authorities [18] motivated the development of a first strategy in the classrooms throughout the 2020/2021 school year:
- The frequent opening of the windows was established (without specifying time);
- In air conditioning systems, the supply of outside air was maximized (up to 50% of the circulating flow);
- Low occupancy of the classrooms was set;
- A safe distance between people was determined (1.5 m).
Although the measures were correct as a basic prevention mechanism, a series of drawbacks that could affect the desired level of prevention were identified:
- Natural ventilation was relied upon as the primary mechanism for removing indoor polluted air. Problems derived from its random and chaotic nature were not considered. This caused long periods in which a stable ventilation airflow was not achieved (due to the lack of wind pressure, limited indoor/outdoor thermal gradient, absence of cross flow in the room, little stack effect, etc.);
- Thermal discomfort in the classrooms during the cold season was identified, which entailed the reduction of the cognitive abilities of the students and risk to their health;
- In the case of natural ventilation flows, the appearance of annoying drafts was verified. Thus, the indoor air mixing patterns were altered, and, as a consequence, there were large unventilated short-circuit areas.
Accordingly, in order to supplement the above measures and increase the prevention of possible contagion, an experimental study was carried out [19]. The indoor air quality (IAQ) was assessed assuming strict compliance with the aforementioned provisions, and alter-native proposals based on the use of air purifiers were evaluated.
3. Methods
3.1. Experimental Study in a Typical Classroom
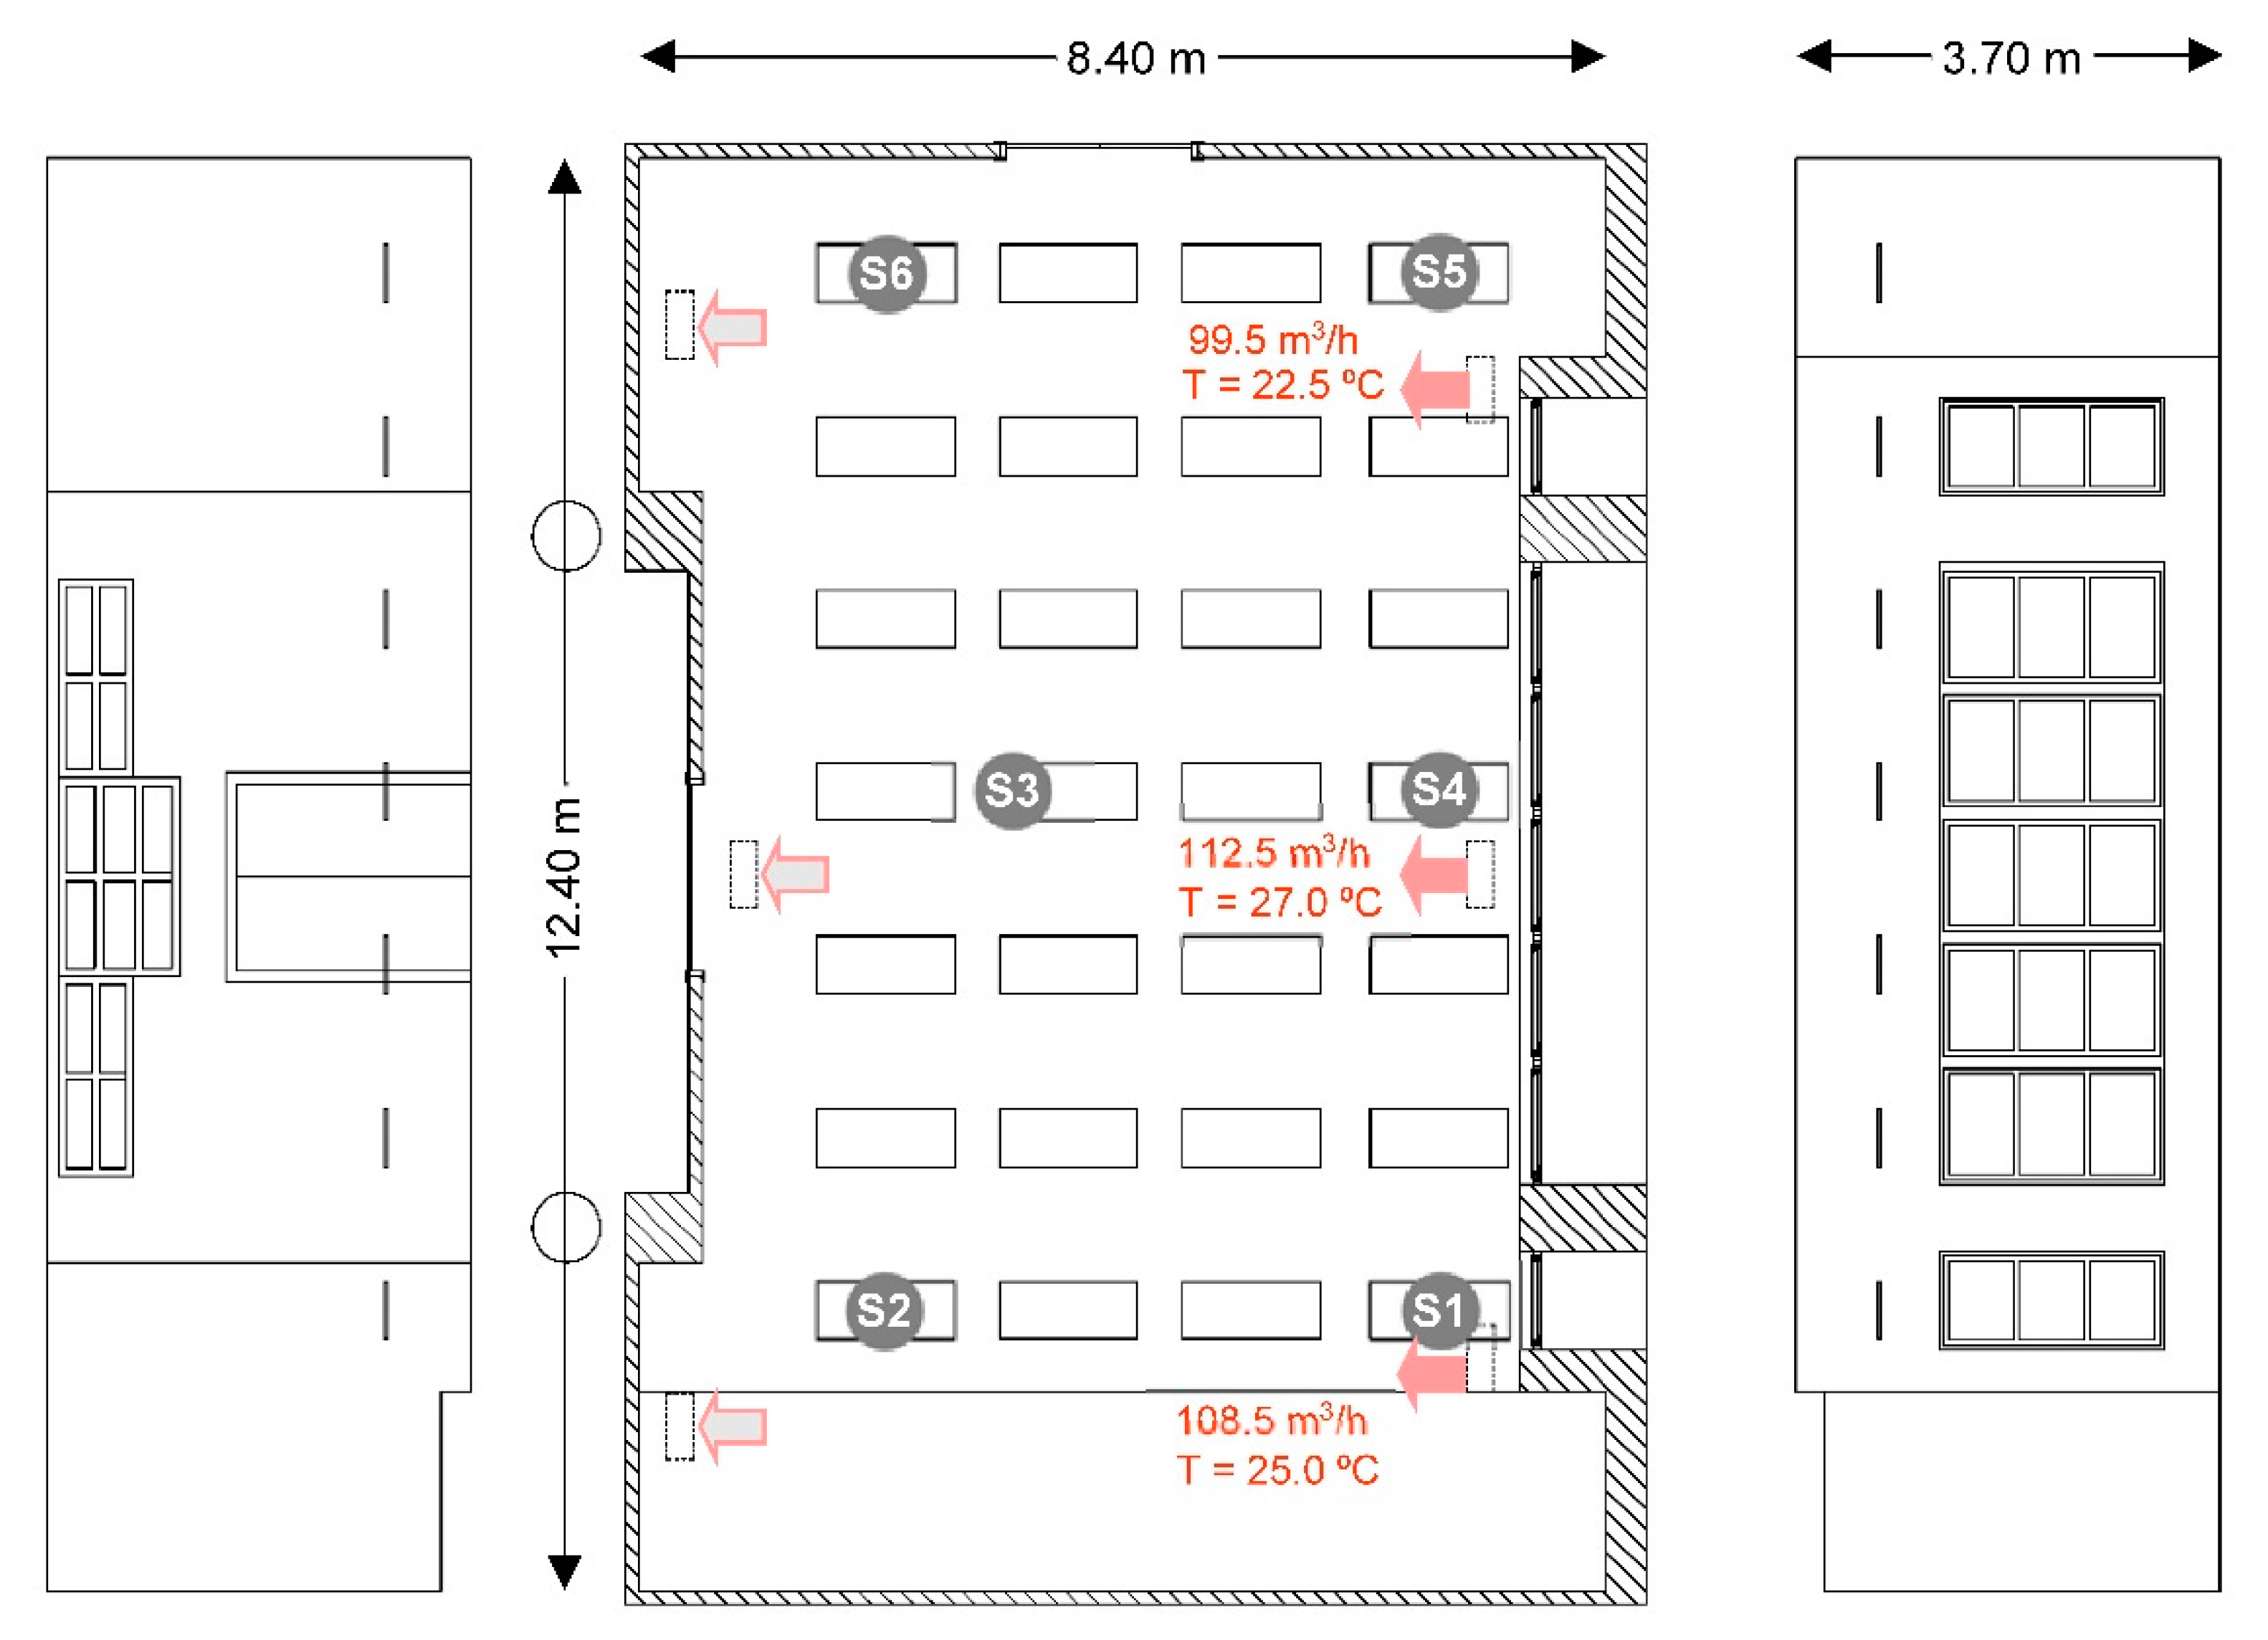
Successive tests were carried out in a representative classroom of the building of the Architecture Technical School of the University of Valladolid (Figure 7) under different ventilation conditions.
The classrooms have an air conditioner that vertically blows heat-treated air into the room through three inlets in the ceiling and recirculates the indoor air, which is mixed with fresh outside air (50% of the airflow, as a preventive measure against SARS-CoV-2). The windows were modified to allow total opening of their openable surface.
Tests were carried out according to the concentration drop method. In this way, aerosols were released in a controlled way up to a certain concentration, achieving homogeneous distribution by means of fans located inside the classroom. Once the concentration was stabilized, measurements were taken with six sensors (S1 to S6) distributed through-out the room.
To simulate the behaviour of bioaerosols, the emission of smoke was used, since they behave in an analogous way: the smoke contains aerosols with a similar range of sizes (the visible part of the smoke) and gases (recognizable by their smell, which do not constitute a vehicle for virus transport).
The behaviour of smoke emission is analogous to that of bioaerosols released in an environment. When a person smokes, the smoke does not fall to the ground quickly, but rather concentrates in front of the smoker and then mixes with the airflows. If this occurs in a poorly ventilated room, the smoke accumulates. In these situations, only a small fraction, less than 10%, is deposited on the interior surfaces, and the rest remains floating in the environment until the interior air is renewed.
The concept of smoke serves also to illustrate a situation between two people [18] where one person is exhaling smoke and the other wishes to inhale as little of it as possible: this is how the chances of contagion are reduced. This experience carries over to the use of masks: the aerosols are filtered with the masks, but the gases are not. The fact that the odour penetrates the mask does not mean that the mask is not retaining the aerosols.
A smoke machine (1.2 kW model Fz-1200) was used to carry out the tests. Its operation consisted of the combustion of oils that emit fumes with bioaerosols analogous to the composition of the air, allowing its traceability in its airflow path, as well as measuring its concentration by means of multipurpose sensors.
3.2. Filtering Device
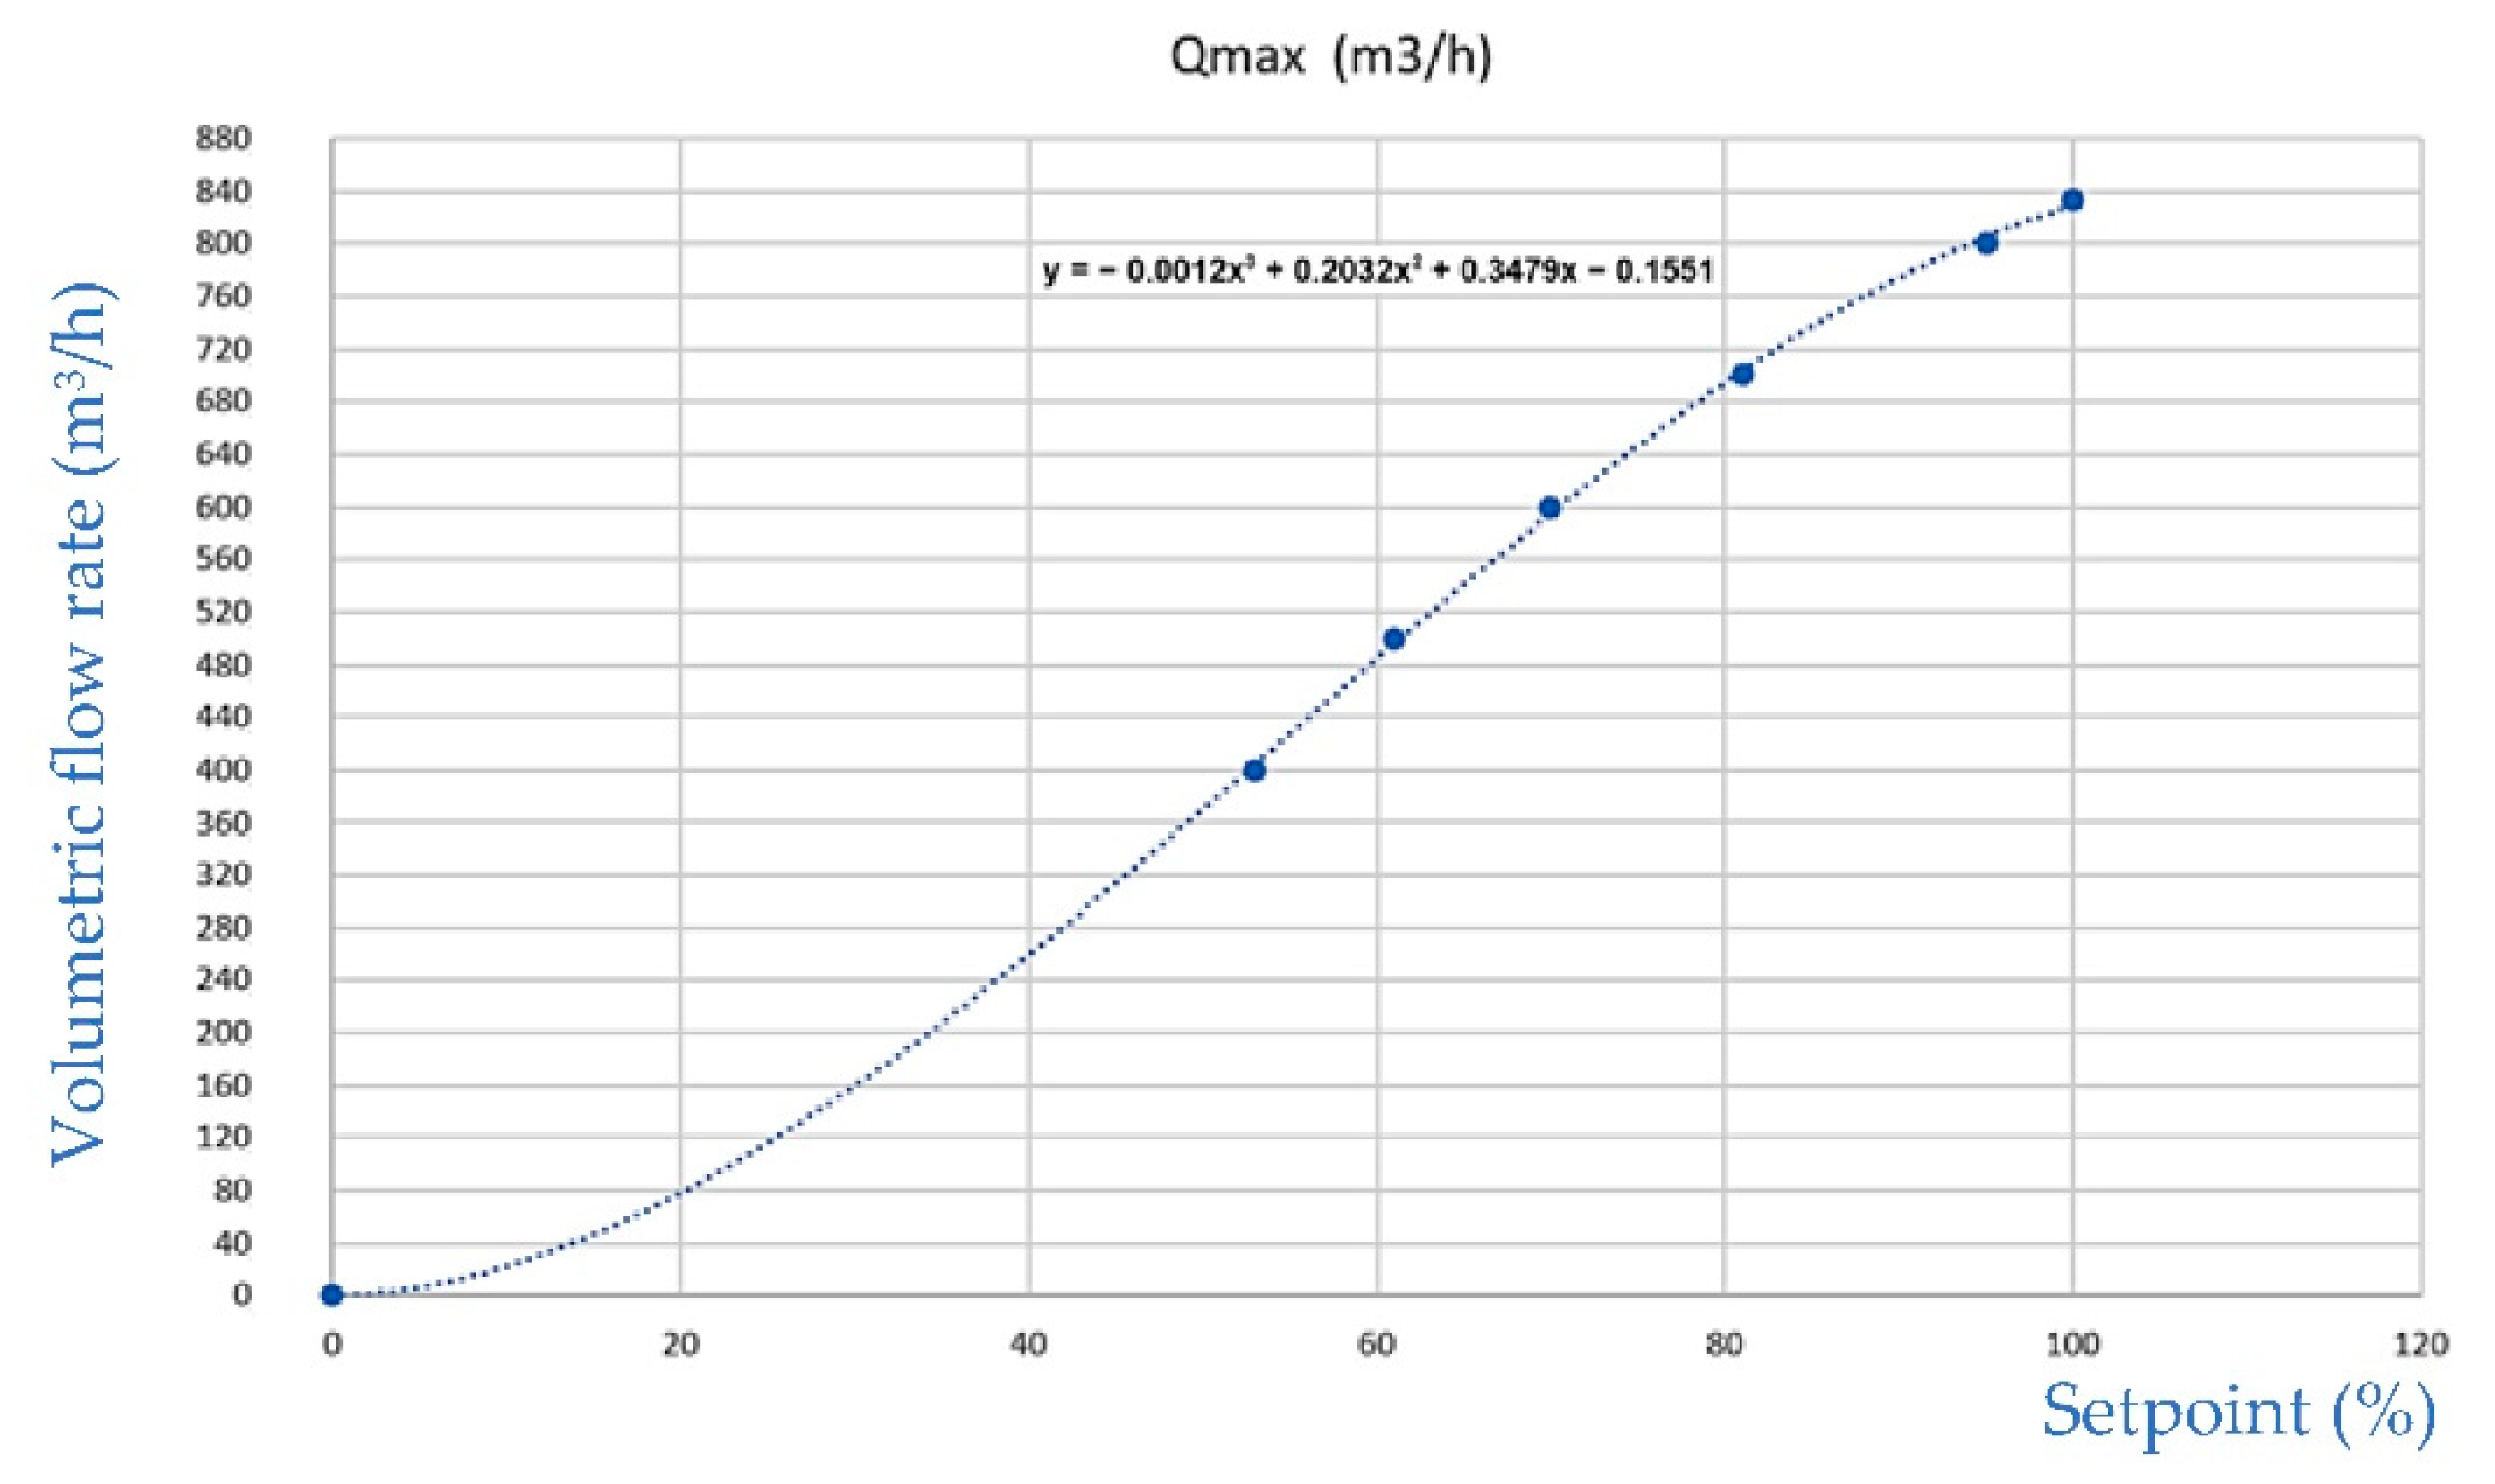
As a significant improvement to the initial protocol, it was proposed to incorporate an air filtration device into the classroom. The mechanical capture of particles and aero-sols was done by means of a HEPA H14 filtering surface with an efficiency greater than 99.995%. The efficiency represents the percentage of particles that each type of filter can retain with respect to the most penetrating particle size (MPPS), which is normally be-tween 0.15 and 0.25 μm. Thus, a HEPA H14 filter with an efficiency of 99.995% for a particle size of greater penetration of 0.15 μm implies that for every 100,000 particles of that size, the filter only allows 5 of them to pass through. For particles of other sizes, the filter has an even higher retention capacity.
The flow rates treated depend on the adjustable flow rate (SETPOINT), according to the data supplied by the manufacturer (Figure 8):
A parameter that requires further study is the flow pattern of treated and contaminated air in order to determine the recommended position and height of the air purifiers within the classroom [20]. For the tests conducted for this study, the device was placed in a central position in the space. Since a mixture flow pattern was achieved inside the studied classroom, it was possible to determine that adequate purification of the polluted air was guaranteed [21,22,23,24,25].
4. Results
The experimental study consisted of 12 cases with different configurations regarding the opening of windows and doors, the operation of the air conditioning system with the supply of outdoor air, and the use of a filtration device:
- Case 1: 100% of the windows open and doors closed. Air conditioning system off;
- Case 2: 50% of the windows open and 50% of the doors open. Air conditioning system off;
- Case 3: 100% of the windows open and 100% of the doors open. Air conditioning system off;
- Case 4: 100% of the windows and doors closed. Constant air filtration flow (400 m3/h) through a HEPA 14 filter. Air conditioning system off;
- Case 5: 100% of the windows and doors closed. Constant air filtration flow (330 m3/h) through a HEPA 14 filter. Air conditioning system off;
- Case 6: 100% of the windows open and doors closed. Air conditioning system on;
- Case 7: 50% of the windows open and 50% of the doors open. Air conditioning system on;
- Case 8: 100% of the windows open and 100% of the doors open. Air conditioning system on;
- Case 9: 100% of the windows open and doors closed. Constant air filtration flow (550 m3/h) through a HEPA 14 filter. Air conditioning system on;
- Case 10: 50% of the windows open and 50% of the doors open. Constant air filtration flow (550 m3/h) through a HEPA 14 filter. Air conditioning system on;
- Case 11: 100% of the windows open and 100% of the doors open. Constant air filtration flow (550 m3/h) through a HEPA 14 filter. Air conditioning system on;
- Case 12: 100% of the windows open and doors closed. Constant air filtration flow (550 m3/h) through a HEPA 14 filter. Air conditioning system on.
Throughout all the tests, the outdoor temperature was in the range of 8 to 10 °C, which represents a typical winter situation in Valladolid (Spain).
5. Discussion
5.1. Conclusions Derived from the Results
From these tests, the following general conclusions can be derived:
- The combined action of natural ventilation, the air conditioning system (with 50% of outdoor air) and the filtering device is the strategy that removes particles and aerosols in the shortest time (Case 11);
- Guaranteeing a mixture flow pattern through the air supply of the air conditioning system enables, in all cases, the best performance (Cases 6 to 11);
- If the exterior and interior conditions allow it, natural ventilation achieves very good results (Case 3). However, natural ventilation does not offer reliable particulate removal conditions due to its chaotic and unpredictable nature. The measurements made were taken at a certain moment and cannot be considered as the average of conditions that can be guaranteed. On the other hand, natural ventilation causes an unacceptable interior temperature drop far from comfort conditions;
- In the event that the windows are closed to prevent the entry of outside air without conditioning in winter (taking into account thermal comfort), the simultaneous use of the filtering device and the air conditioning system with outside air supply (Case 12) reaches average values analogous to a natural ventilation regime, with the added guarantee of controlling the stability of the ventilation process;
- The results obtained when the opening surface of the windows and doors is reduced to 50%, in combination with the operation of the air conditioning system (with 50% outdoor air supply) and the filtering device (Case 10), reach similar quality standards to the best case study. The relative advantage is a better quality of the thermal environment with respect to the complete opening.
5.2. Verification of the Ventilation Conditions
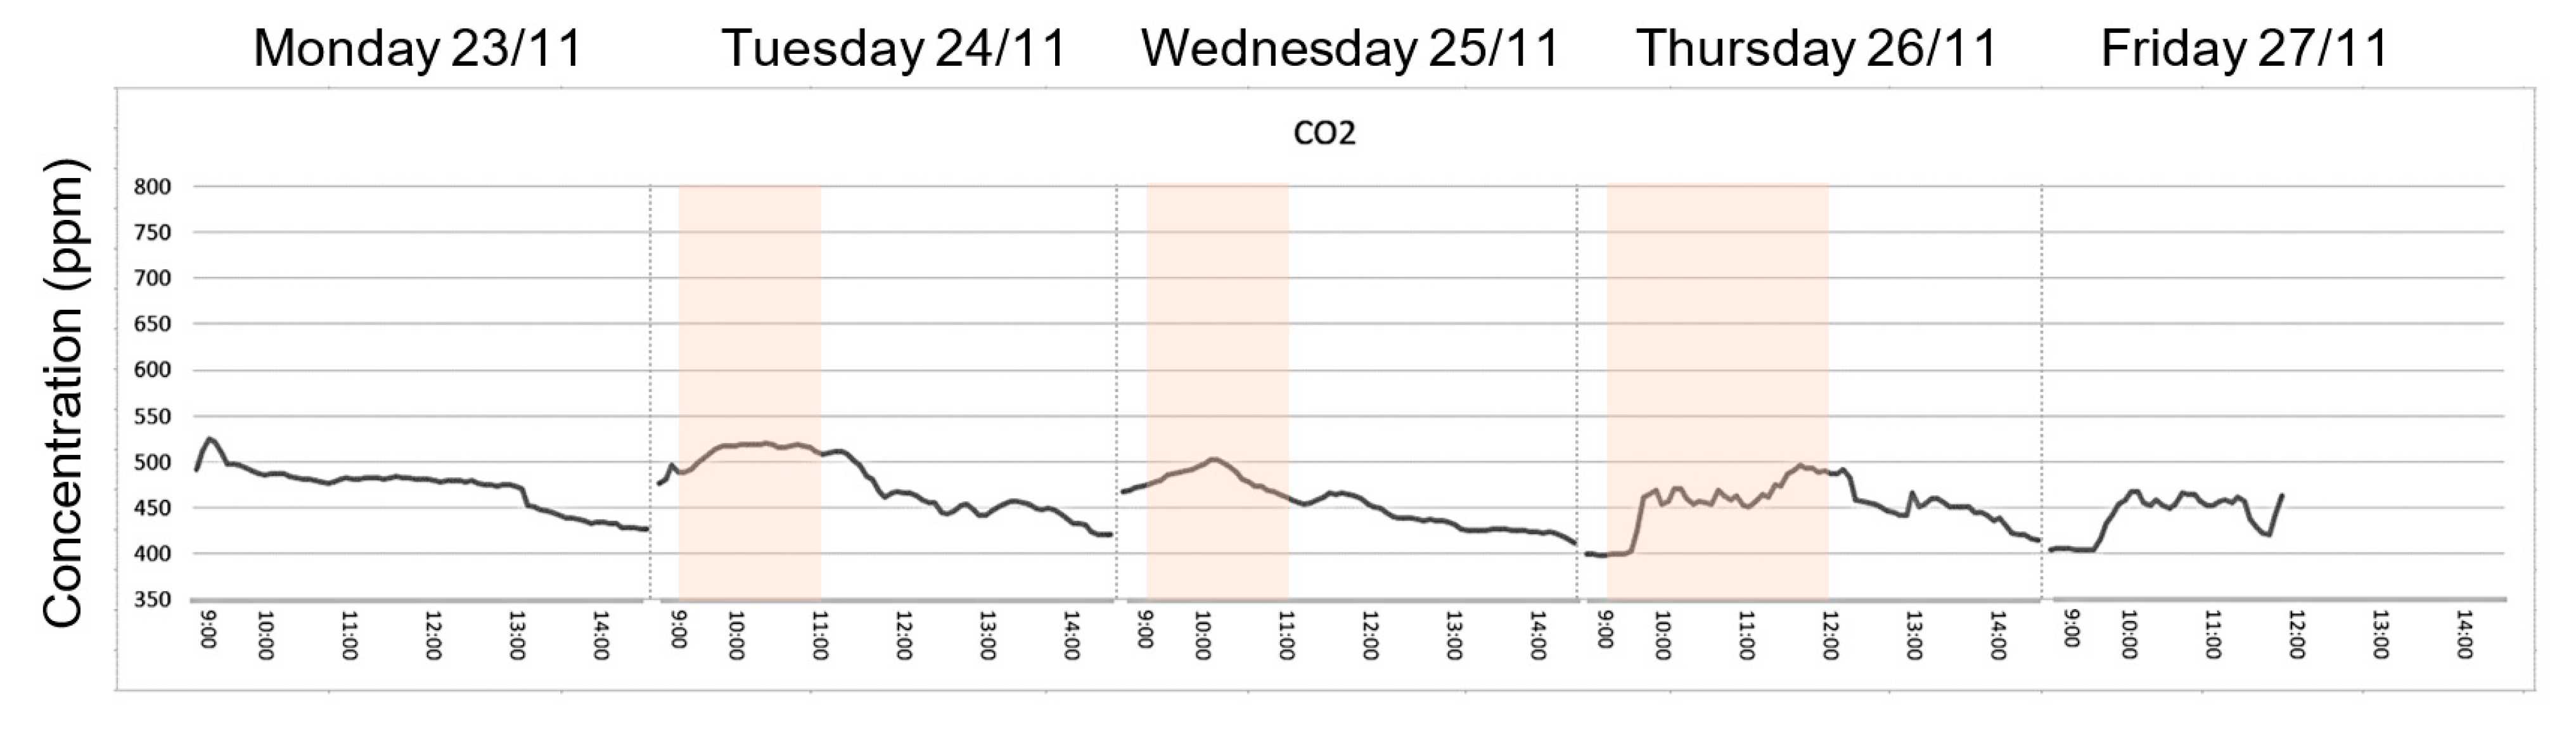
Finally, after the previous comparative analysis, the classroom under study was subjected to a test under typical conditions, that is, with 29 students and a teacher during the usual course of a class. During the test, the outside temperature was 3 °C on average, so the openings were partially closed (50% of their surface) in a similar way to Case 11.
In this case, the tracer gas was the CO2 concentration. Although CO2 is not a pollutant since its concentration was far from dangerous levels for health, it is nevertheless a good indicator of the emission of human bioaerosols, because it is strictly related to them.
The classroom was intermittently occupied (from 9:00 to 11:00 on Tuesday and Wednesday, and from 9:00 to 12:00 on Thursday). However, the total CO2 concentration remained very low (maximum values of 515 ppm with an outdoor CO2 concentration of 400 ppm), as shown in Figure 10.
Under these circumstances, the combination of these three ventilation mechanisms can be considered as a means to strengthen the prevention measures adopted in the studied classroom.
6. Conclusions
In conclusion, it can be affirmed that it is necessary to strengthen prevention mechanisms against the risk of contagion of SARS-CoV-2 in buildings lacking centralized controlled mechanical ventilation systems, where the main strategy consists of window opening to promote natural ventilation.
The most appropriate methodology needs to address the characterization of each of the possible strategies in the building. In the case studied, the protocol adopted consisted of the combination of natural ventilation, the maximization of the outdoor air supply through the air conditioning system, and the use of filtering devices. Simultaneously, the basic conditions of social distance, occupation, use of masks and guidelines for the use and cleaning of the building must be met.
As a final note, it is necessary to mention that throughout the 2020/2021 school year with 100% face-to-face teaching, there was no case of contagion among students and teachers inside the classrooms of the centre.
Author Contributions
Conceptualization, A.M. and I.P.-C.; methodology, A.M. and I.P.-C.; formal analysis, A.M., A.L.-Á. and M.Á.P.-M.; investigation, A.M.; resources, A.L.-Á.; data curation, A.M. and H.J.-M.; writing—original draft preparation, A.M.; writing—review and editing, A.M. and I.P.-C.; visualization, A.M.; supervision, I.P.-C.; project administration, A.L.-Á.; funding acquisition, M.Á.P.-M. All authors have read and agreed to the published version of the manuscript.
Funding
This research “Metodologías de estudio y estrategias de mejora de eficiencia energética, confort y salubridad de centros educativos en Castilla y León. Investigación básica” was funded by Junta de Castilla y León, Consejería de Educación, grant number VA026G19 (2019–2021).
Institutional Review Board Statement
Not applicable.
Informed Consent Statement
Not applicable.
Conflicts of Interest
The authors declare no conflict of interest.
References
- World Health Organization (WHO). Modes of Transmission of Virus Causing COVID-19: Implications for IPC Precaution Recommendations. Available online: https://www.who.int/news-room/commentaries/detail/modes-of-transmission-of-virus-causing-covid-19-implications-for-ipc-precaution-recommendations (accessed on 17 August 2021).
- Europa Press Noticias S.A. Fernando Simón: “No es Necesario Que la Población Use Mascarillas”. Available online: https://www.europapress.tv/sociedad/476808/1/fernando-simon-no-necesario-poblacion-use-mascarillas (accessed on 17 July 2021).
- Boletín Oficial del Estado. Orden SND/422/2020, de 19 de Mayo, por la Que se Regulan las Condiciones Para el uso Obligatorio de Mascarilla Durante la Situación de Crisis Sanitaria Ocasionada por el COVID-19; Boletín Oficial del Estado: Madrid, Spain, 2020. [Google Scholar]
- World Health Organization (WHO). Coronavirus Disease (COVID-19): How Is It Transmitted? Available online: https://www.who.int/news-room/q-a-detail/coronavirus-disease-covid-19-how-is-it-transmitted (accessed on 17 August 2021).
- Morawska, L.; Milton, D.K. It Is Time to Address Airborne Transmission of Coronavirus Disease 2019 (COVID-19). Clin. Infect. Dis. 2020, 71, 2311–2313. [Google Scholar] [CrossRef] [PubMed]
- Ministerio de Sanidad. Gobierno de España Evaluación del Riesgo de la Transmisión de SARS-CoV-2 Mediante Aerosoles. Medidas de Prevención y Recomendaciones; Ministerio de Sanidad: Madrid, Spain, 2020. [Google Scholar]
- Bar-on, Y.M.; Flamholz, A.V.I.; Phillips, R.O.B.; Milo, R.O.N. SARS-CoV-2 (COVID-19) by the numbers. Epidemiol. Glob. Heal. Infect. Dis. 2020, 2, 1–15. [Google Scholar] [CrossRef] [PubMed]
- Ruiz de Adana Santiago, M.; Pastor Pérez, P.; Aledo Vives, S.; Gallardo Salazar, M. DTIE 2.07. Las Instalaciones de Climatización, SARS CoV 2 y la Calidad del Aire; Asociación Técnica Española de Climatización y Refrigeración—ATECYR: Madrid, Spain, 2020; ISBN 978-84-95010-71-1. [Google Scholar]
- Morawska, L.; Johnson, G.R.; Ristovski, Z.D.; Hargreaves, M.; Mengersen, K.; Corbett, S.; Chao, C.Y.H.; Li, Y.; Katoshevski, D. Size distribution and sites of origin of droplets expelled from the human respiratory tract during expiratory activities. J. Aerosol Sci. 2009, 40, 256–269. [Google Scholar] [CrossRef] [Green Version]
- Prather, K.A.; Marr, L.C.; Schooley, R.T.; McDiarmid, M.A.; Wilson, M.E.; Milton, D.K. Airborne transmission of SARS-CoV-2. Science 2020, 370, 303–304. [Google Scholar] [CrossRef] [PubMed]
- Chen, W.; Zhang, N.; Wei, J.; Yen, H.L.; Li, Y. Short-range airborne route dominates exposure of respiratory infection during close contact. Build. Environ. 2020, 176, 106859. [Google Scholar] [CrossRef]
- Memarzadeh, F. Improved strategy to control aerosol-transmitted infections in a hospital suite. In Proceedings of the IAQ Conference 2012, Houston, TX, USA, 5–10 June 2011. [Google Scholar]
- Verreault, D.; Moineau, S.; Duchaine, C. Methods for Sampling of Airborne Viruses. Microbiol. Mol. Biol. Rev. 2008, 72, 413–444. [Google Scholar] [CrossRef] [PubMed] [Green Version]
- Xie, X.; Li, Y.; Chwang, A.T.Y.; Ho, P.L.; Seto, W.H. How far droplets can move in indoor environments—Revisiting the Wells evaporation—Falling curve. Indoor Air 2007, 17, 211–225. [Google Scholar] [CrossRef] [PubMed]
- van Doremalen, N.; Bushmaker, T.; Morris, D.H.; Holbrook, M.G.; Gamble, A.; Williamson, B.N.; Tamin, A.; Harcourt, J.L.; Thornburg, N.J.; Gerber, S.I.; et al. Aerosol and Surface Stability of SARS-CoV-2 as Compared with SARS-CoV-1. N. Engl. J. Med. 2020, 382, 1564–1567. [Google Scholar] [CrossRef] [PubMed]
- Schuit, M.; Ratnesar-Shumate, S.; Yolitz, J.; Williams, G.; Weaver, W.; Green, B.; Miller, D.; Krause, M.; Beck, K.; Wood, S.; et al. Airborne SARS-CoV-2 is rapidly inactivated by simulated sunlight. J. Infect. Dis. 2020, 222, 564–571. [Google Scholar] [CrossRef] [PubMed]
- Smither, S.J.; Eastaugh, L.S.; Findlay, J.S.; Lever, M.S. Experimental aerosol survival of SARS-CoV-2 in artificial saliva and tissue culture media at medium and high humidity. Emerg. Microbes Infect. 2020, 9, 1415–1417. [Google Scholar] [CrossRef] [PubMed]
- Universidad de Valladolid. Instrucciones de Ventilación y Climatización de Espacios Para Evitar la Propagación del SARS-COV-2; Universidad de Valladolid: Valladolid, Spain, 2020. [Google Scholar]
- Settimo, G.; Indinnimeo, L.; Inglessis, M.; De Felice, M.; Morlino, R.; Di Coste, A.; Fratianni, A.; Avino, P. Indoor air quality levels in schools: Role of student activities and no activities. Int. J. Environ. Res. Public Health 2020, 17, 6695. [Google Scholar] [CrossRef] [PubMed]
- Casals Ventilación Fluid Simulation of REINTAIR 600 Purifier. Available online: https://www.youtube.com/watch?v=5WLPPCNnFzo (accessed on 30 August 2021).
- Etheridge, D.; Sandberg, M. Building Ventilation. Theory and Measurements; John Wiley & Sons Ltd.: Chichester, UK, 1996. [Google Scholar]
- Meiss, A.; Feijó-Muñoz, J.; García-Fuentes, M.A. Age-of-the-air in rooms according to the environmental condition of temperature: A case study. Energy Build. 2013, 67, 88–96. [Google Scholar] [CrossRef]
- Meiss, A.; Feijó, J. Influencia de la ubicación de las aberturas en la eficiencia de la ventilación en viviendas. Inf. Constr. 2011, 63, 53–60. [Google Scholar] [CrossRef]
- Mundt, E.; Mathisen, H.M.; Nielsen, P.V.; Moser, A. Ventilation Effectiveness; REHVA: Brussel, Belgium, 2004; ISBN 2960046803. [Google Scholar]
- Rabanillo-Herrero, M.; Padilla-Marcos, M.; Feijó-Muñoz, J.; Meiss, A. Effects of the radiant heating system location on both the airflow and ventilation efficiency in a room. Indoor Built Environ. 2019, 28, 372–383. [Google Scholar] [CrossRef]
Figure 1.
Dimensions of SARS-CoV-2 [7] and its possible distribution within a bioaerosol.
Figure 1.
Dimensions of SARS-CoV-2 [7] and its possible distribution within a bioaerosol.

Figure 2.
Mathematical model of particle deposition of nasal breathing [7].
Figure 2.
Mathematical model of particle deposition of nasal breathing [7].

Figure 3.
Droplets emitted according to the type of event.

Figure 4.
Droplet evaporation process (taken from Verreault, 2008 [13]).
Figure 4.
Droplet evaporation process (taken from Verreault, 2008 [13]).

Figure 5.
Behaviour of emissions according to their diameter [14].
Figure 5.
Behaviour of emissions according to their diameter [14].

Figure 6.
System of forces affecting the bioaerosol.

Figure 7.
Typical classroom of the Architecture Technical School in Valladolid.

Figure 8.
Adjustable flow rate of air filtration device.

Figure 9.
Evolution of the concentration drop of aerosols emitted in the classroom.

Figure 10.
Verification of the ventilation conditions through CO2 concentration measurement.


Table 1.
Average emission per person and event [8].
Table 1.
Average emission per person and event [8].
| Event | Droplets Generated (Per Event) | Velocity (m/s) | Exhaled Air (L) |
|---|---|---|---|
| Sneezing | 100,000–1,000,000 | 20–50 | 1.2 |
| Coughing | 3000–10,000 | 10 | 1.2 |
| Talking | 3900/min | 5 | 700 (1 h) |
| Breathing | 1200/min | 1 | 800 (1 h) |
Table 2.
SARS-CoV-2 viability in different materials [15].
Table 2.
SARS-CoV-2 viability in different materials [15].
| Material | Time that SARS-CoV-2 Remains Infectious on Surfaces |
|---|---|
| Plastic | 72 h–3 days |
| Stainless steel | 48 h–2 days |
| Paperboard | 4 h |
| Copper | 1–3 h |
Table 3.
Aerosol concentration decay time to 10μm/mm3.
| Case | Concentration Decay Time 10 μm Particles Range between 3250 and 200 μg/mm3 |
|---|---|
| Case 1 | >45 min |
| Case 2 | 29 min |
| Case 3 | 17 min |
| Case 4 | 24 min |
| Case 5 | 33 min |
| Case 6 | 19 min |
| Case 7 | 18 min |
| Case 8 | 15 min |
| Case 9 | 10 min |
| Case 10 | 8 min |
| Case 11 | 6 min |
| Case 12 | 18 min |
Publisher’s Note: MDPI stays neutral with regard to jurisdictional claims in published maps and institutional affiliations. |
© 2021 by the authors. Licensee MDPI, Basel, Switzerland. This article is an open access article distributed under the terms and conditions of the Creative Commons Attribution (CC BY) license (https://creativecommons.org/licenses/by/4.0/).
Share and Cite
MDPI and ACS Style
Meiss, A.; Poza-Casado, I.; Llorente-Álvarez, A.; Jimeno-Merino, H.; Padilla-Marcos, M.Á. Implementation of a Ventilation Protocol for SARS-CoV-2 in a Higher Educational Centre. Energies 2021, 14, 6172. https://doi.org/10.3390/en14196172
AMA Style
Meiss A, Poza-Casado I, Llorente-Álvarez A, Jimeno-Merino H, Padilla-Marcos MÁ. Implementation of a Ventilation Protocol for SARS-CoV-2 in a Higher Educational Centre. Energies. 2021; 14(19):6172. https://doi.org/10.3390/en14196172
Chicago/Turabian StyleMeiss, Alberto, Irene Poza-Casado, Alfredo Llorente-Álvarez, Héctor Jimeno-Merino, and Miguel Ángel Padilla-Marcos. 2021. "Implementation of a Ventilation Protocol for SARS-CoV-2 in a Higher Educational Centre" Energies 14, no. 19: 6172. https://doi.org/10.3390/en14196172
Note that from the first issue of 2016, this journal uses article numbers instead of page numbers. See further details here.