1. Introduction
The international energy market showed different fluctuations inflicted by the COVID-19 pandemic situation in 2020; energy demand and oil prices plummeted in early March of 2020 due to the COVID-19 outbreak throughout the globe when governments were urged to ban travel on a national and international level [
1]. The lockdown of businesses and commerce decelerated world trade, which caused a global recession in 2020, the world gross domestic product (GDP) shrunk by 4.4% [
2]. On the other hand, global electricity demand fell by 5%, which led to a positive impact on the environment, and much cleaner air quality was reported on most pollutant cities, and satellite imagery showed that the urban heat island had been reduced in several metropolitan areas [
3]. Moreover, schools and universities were closed in most countries. Therefore, the educational system had to adapt to this situation, and online learning through video conferences was adopted widely [
4]. As a result, the energy use in buildings destined for education decreased: in the USA the energy consumption in buildings declined by less than 10%, while gasoline and jet fuel drastically fell by 30% and 50%, respectively, from March to June of 2020 [
5]. Furthermore, the data collected in more than 30 countries showed that the fall of electricity consumption in public, industrial, and commercial buildings was resisted by an increase in residential buildings, which went up to 27% higher as more people had to work and study from home [
3]. The severity degree of lockdowns and their duration were the main factors that affected the energy demand, for instance, in one month of confinement, the energy demand decreased by 20% on average and was reduced by 1.5% on a yearly basis [
3]. Nevertheless, as most countries started to soften confinement measures, during June, the electricity demands were 10% lower than in the same month of 2019, and then it went down in July to 5% lower than the level of the same month of the previous year, with the weather corrected in the following countries (Great Britain, India, Spain, France) [
6]. In EU countries, the electricity demand started to recover to levels close to the ones reached in 2019 during August; afterward, the demand steadily decreased in the following months as the restriction measures were implemented once again [
6]. However, the end of the year was marked by energy demand levels that surpassed the ones in the previous year after a weather adjustment [
6]. This happened mainly in economies that depended heavily on the industry, such as China, where factories were able to maintain their industrial activity by following the preventive and safety protocols that were recommended by special authorities [
7]. Thus, confinement measures had a less significant effect on the overall energy demand, since the industry sector alone accounts for more than 60% against 10% for services of the country’s total consumption [
7], while the impact was much heavier in the USA where the industry sector accounts for only 20% and the services account for 40% and for Europe, the impact was even greater since the services sector plays a fundamental role in its economy [
8].
The global electricity supply dropped by 2.6% in the first quarter of 2020 compared with the same period in 2019 [
9], while electricity generation from renewable sources increased by 3%. This jump is mainly due to new investments in wind-solar photovoltaic power over the past year [
10]. This increase came by and at large at the cost of gas and coal as those two sources still generate roughly around 60% of the global electricity supply [
11]. The share of electricity generated by nuclear power also declined by 3% because fewer reactors were operational in the first quarter of 2020 [
12]. Although the fossil fuel industry fell by only 2.8% in generating electricity, its market showed unusual fluctuations such as a negative price of oil in the US market; other markets switched from gas to coal because of the cheap prices [
3,
11,
13]. As a result, the coal-fired power fell by 8% in comparison with the first quarter of 2019 [
3].
Even though the decline of the world electricity demand in 2020 caused a reduction in CO
2 and greenhouse emissions and was responsible for improving the quality of air and water, we are still far from reaching the Paris climate change agreement goals [
14,
15]. Moreover, this economic crisis threatens to delay investments in clean energy, the unemployment rate grew to unprecedented levels, and many families lost their income. This only makes it even harder for households to beneficiate from reliable and affordable energy, which exacerbates the issue of energy poverty [
5]. The Spanish Ministry for the Ecological Transition and the Demographic Challenge (MITECO) initiated measures to ensure electricity, water, and gas supplies in the residential sector. This action came as an emergency response to the lockdown imposed in early March of 2020. The Spanish government implemented regulations to temporarily suspend the jurisdictions that allow disconnecting the electricity supply for non-payment until the end of the emergency state. Then it proposed partial payment as a solution to pay off the bills in an extended period of time for households that were mostly affected by the outbreak. These jurisdictions were applied to the residential sector and only on the first property. Among other support measures, the Spanish government put on hold any upward update of the domestic electricity and gas prices by supporting the default tariff during the emergency state [
16]. The renewal of their social tariff deadlines was delayed and enlarged the number of households eligible for the electricity social tariff. The beneficiary list also included self-employed people who had to stop their activity or saw their income shrink by more than 75% [
16].
The International Energy Agency has been urging nations for actions to save the enormous energy loss due to inefficiency [
17]. Energy savings in buildings are usually perceived mainly from thermal insulation and indoor lighting standpoint, except that energy efficiency is about all the operating components of a building. Furthermore, there is an important amount of savings that could be made in other areas such as plug load and occupant behavior [
18]. In the USA, the electricity consumption of plug and process loads (PPLs) is responsible for 33% of the commercial building, and the consumption of the heating, ventilation, and air cooling (HVAC) system is not included in this ratio since it is integrated into a centralized system [
19]. The percentage of the plug load is expected to grow in the future since our buildings use more electrical equipment. In 2011, the Department of Energy’s National Renewable Energy Laboratory (NREL) implemented an energy-saving program with a national strategy for commercial buildings in order to reduce the energy consumption without affecting the functionality of their facilities, and they were able to reduce the electricity consumption by over 30% of the plug load ratio [
20].
Investing in energy efficiency programs and energy management in buildings is crucial for universities to promote sustainability and raise awareness among the academic community about our carbon footprint [
21]. University campuses use energy in a different way than residential buildings, and their consumption pattern is more complicated since it depends on many different factors such as physical characteristics of the facilities, occupancy rate; heating, ventilation, and air cooling (HVAC); indoor lighting; outdoor temperature; number of computers; laboratory materials; and plug loads [
22,
23]. It was estimated that plug loads were responsible for 32% of the total energy use of the Stanford University’s campus, in a study case that included 220 buildings that evaluate around 50 GWh in yearly electricity consumption [
24]. In addition, electric lighting accounted for 20% to 30% of the electricity consumption in office buildings and consumed, on average, about 14% of energy in schools in the USA [
25,
26].
This case study aimed to measure the impact of the COVID-19 pandemic on the energy consumption of the University campus during the period of lockdown. In a previous study, we were able to prove that the weather factor affected the total energy consumption of the campus more than the occupancy rate factor [
27]. The confinement situation gave us the opportunity to evaluate the energy performance of the university campus when there was practically no human activity. Furthermore, analyzing the data during this period allowed us to understand the dynamics of the electricity consumption inside the campus and how we could minimize energy loss. Many types of equipment remained operational during the lockdown, like laboratory materials, fridges, ultra-freezers that maintained temperatures as low as −80 °C, security systems such as sensors and cameras, and other equipment such as vending machines, exterior lighting, and internet and telecommunications equipment. This case study could be applied to other universities if similar data were available. It also could inspire other researchers, for example, to measure the impact of unplugged equipment during off days of the year. This quantity could be often underestimated, but when you operate hundreds of electrical materials in the university, it could have a considerable impact on energy use in the long run.
2. Materials and Methods
The University of Almeria campus accounts for 33 buildings and spreads on a surface of 170.000 m2. The campus is responsible for average electricity consumption of approximately 8 million kWh each year.
The dataset is composed of the total energy consumption on a monthly basis in the period of 2011–2020 (
Table 1), the energy consumption on a monthly basis in 2020 of every building according to its categories (
Table 2), and the energy consumption on an annual basis according to the buildings and their categories (
Table 3).
The period studied in this paper is the year 2020, which could be divided into three parts: the first one is the pre-outbreak period; the second one, starting from March until August when the occupancy rate at the campus was almost 0%; and the third part is when only 50% of the staff and research students were allowed the access the campus facilities.
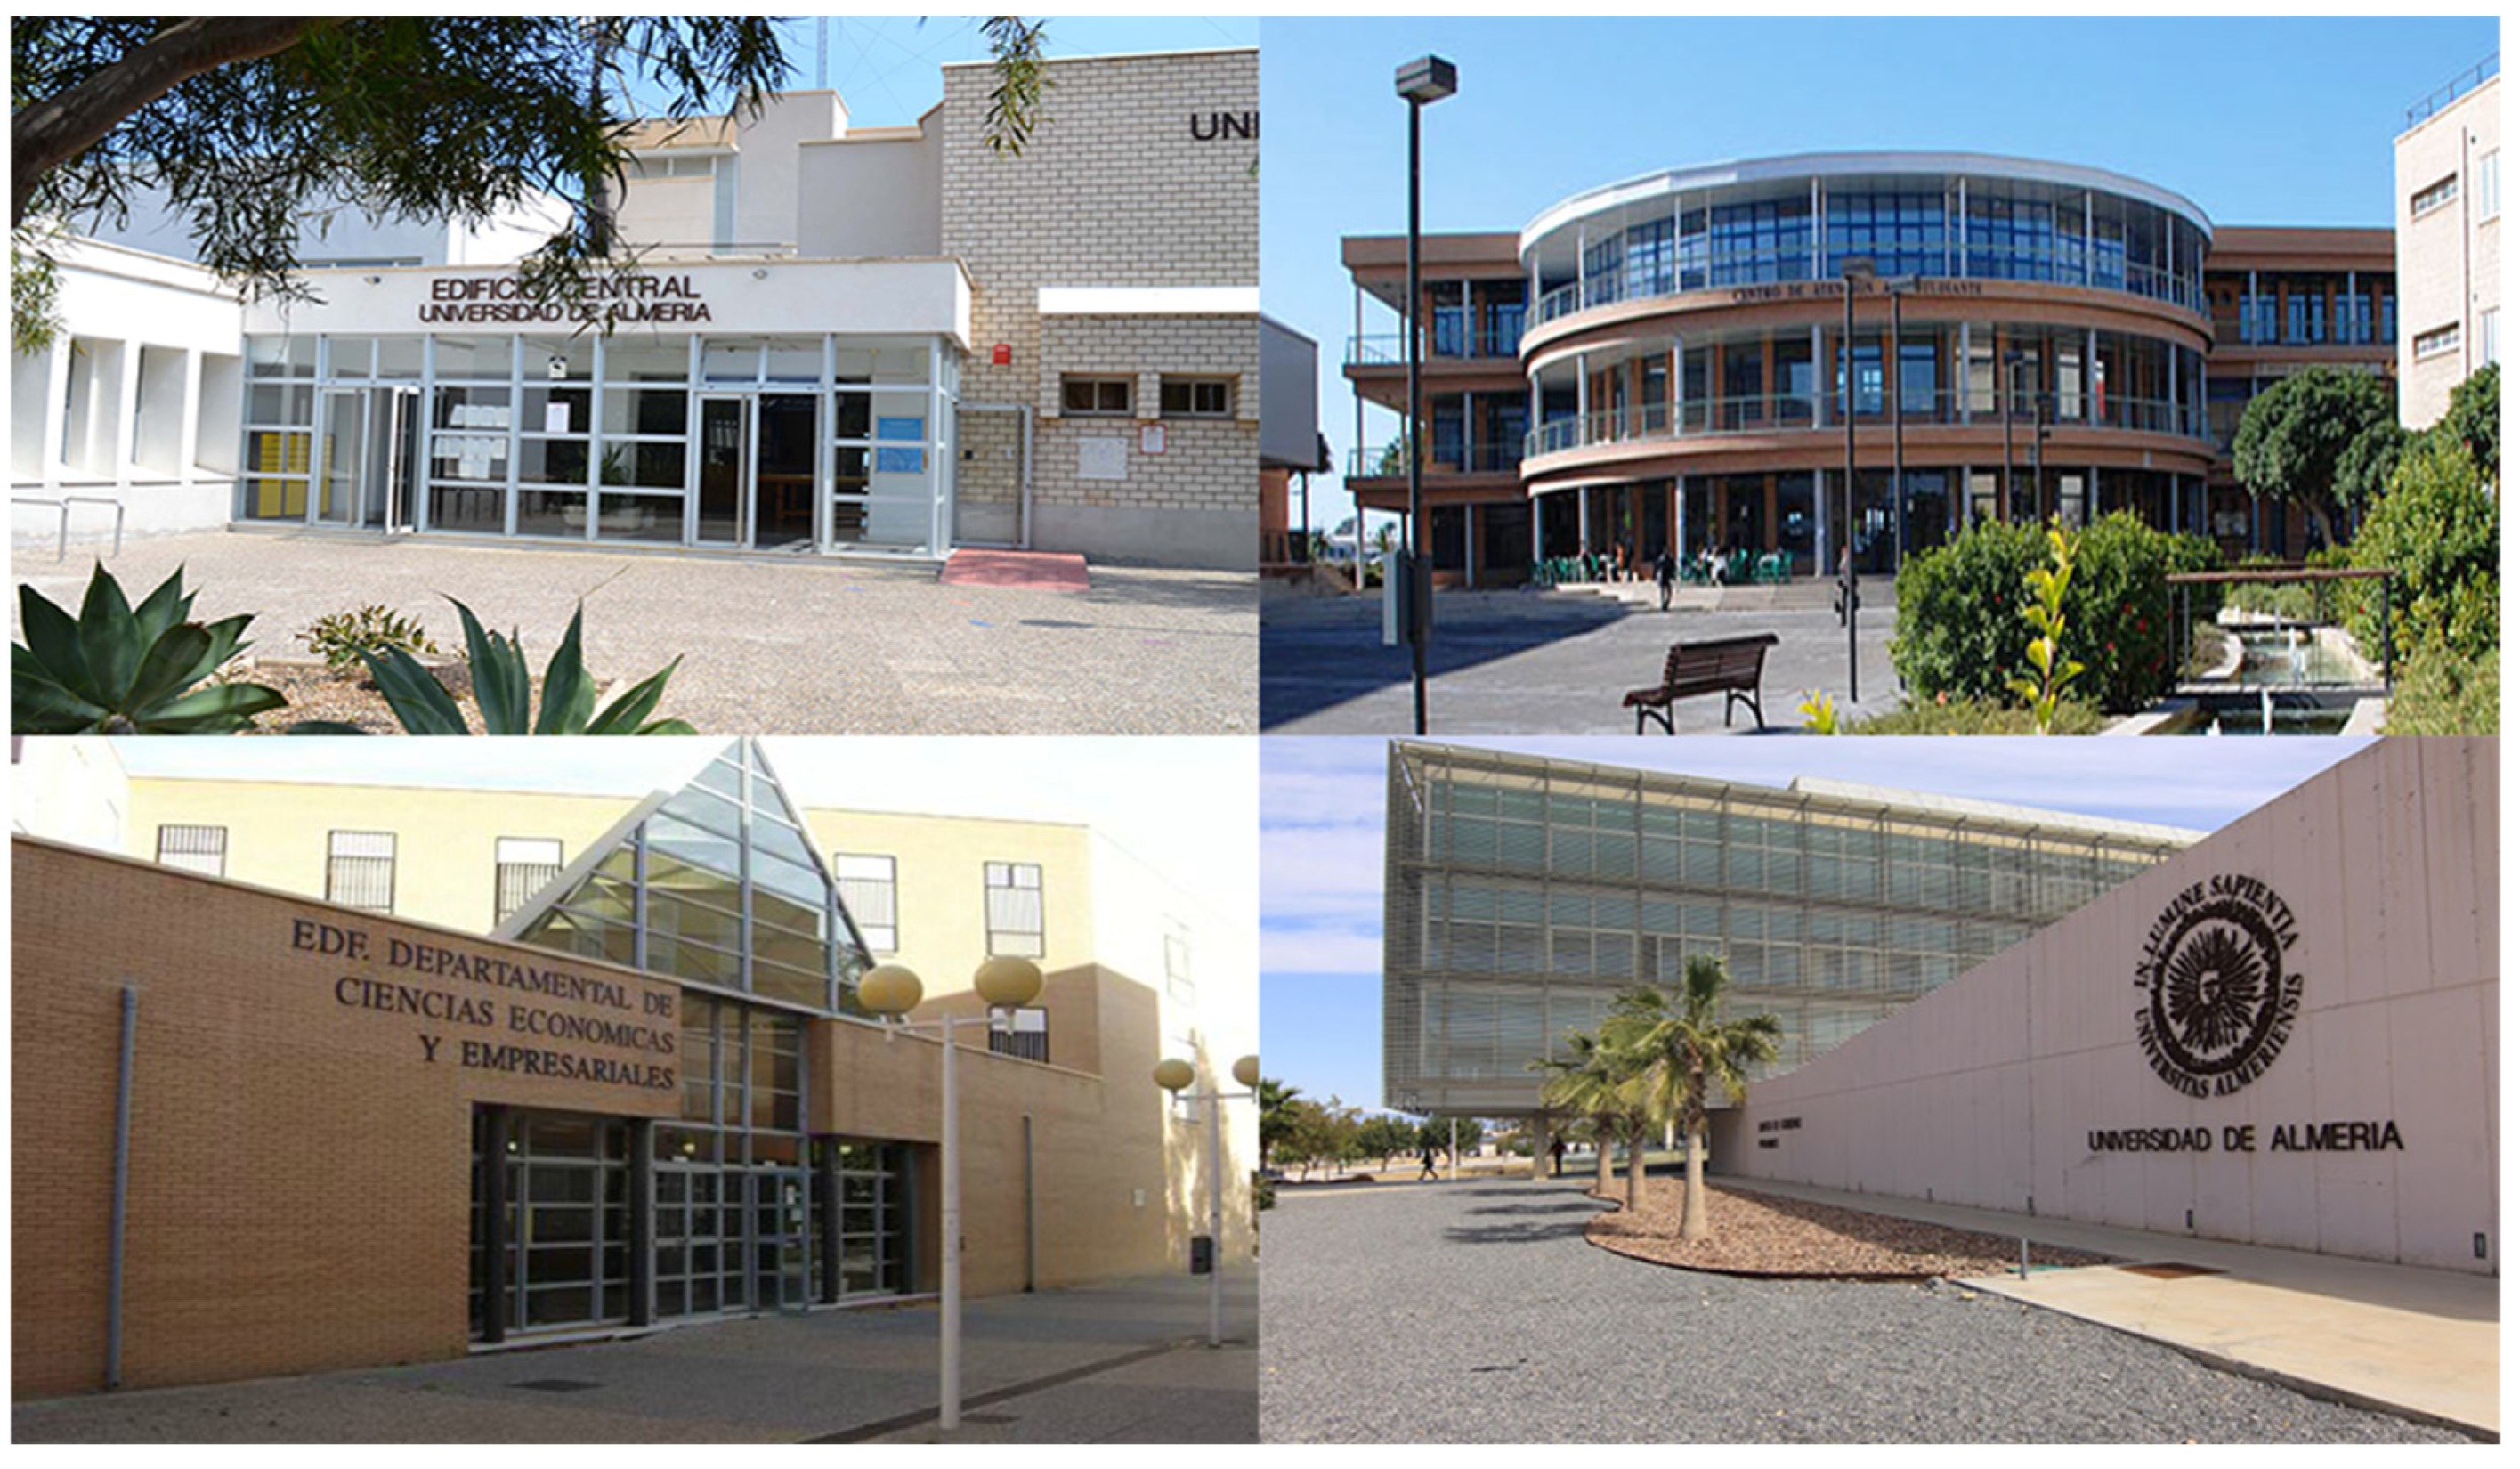
Administration buildings (
Figure 1) comprise facilities like offices, meeting rooms, seminar rooms, and lecture halls. These facilities host theoretical and practical training. Most of the administration buildings were inoperative during the period of lockdown. This category decreased by almost a third of its share, compared with 2019.
Building (1), the University presidency, is a four-floor building with a gross floor area of 5880 m2. This facility is composed of offices, meeting rooms, seminar rooms, and lecture halls. Building (2), the Central Administrative Services, is a two-floor building with a gross floor area of 11,430 m2. This facility is composed of offices and computer rooms, classrooms, and cafeteria restaurants. Building (18), the Department of Entrepreneurial and Economical Science, is a three-floor building that has a gross floor area of 2620 m2. This facility is composed of offices, seminar rooms, classrooms, and computer rooms. Building (19), the Department of Human and Social Science, is a three-floor building with a surface of 8290 m2. This facility is composed of offices, classrooms, seminar rooms, and computer rooms. Building (20), the Department of Juridical and Law Science, is a three-floor building with a gross floor area of 2450 m2. It is composed of offices, classrooms, and seminar rooms. Building (21), the Department of Education, is a two-floor building with a surface of 4605 m2. It is composed of seminary rooms, teaching and computer rooms, and solar energy workshops. Building (8), the Central building Cafeteria, is a three-floor building with a gross floor area of 3994 m2. This facility is composed of main offices and a cafeteria.
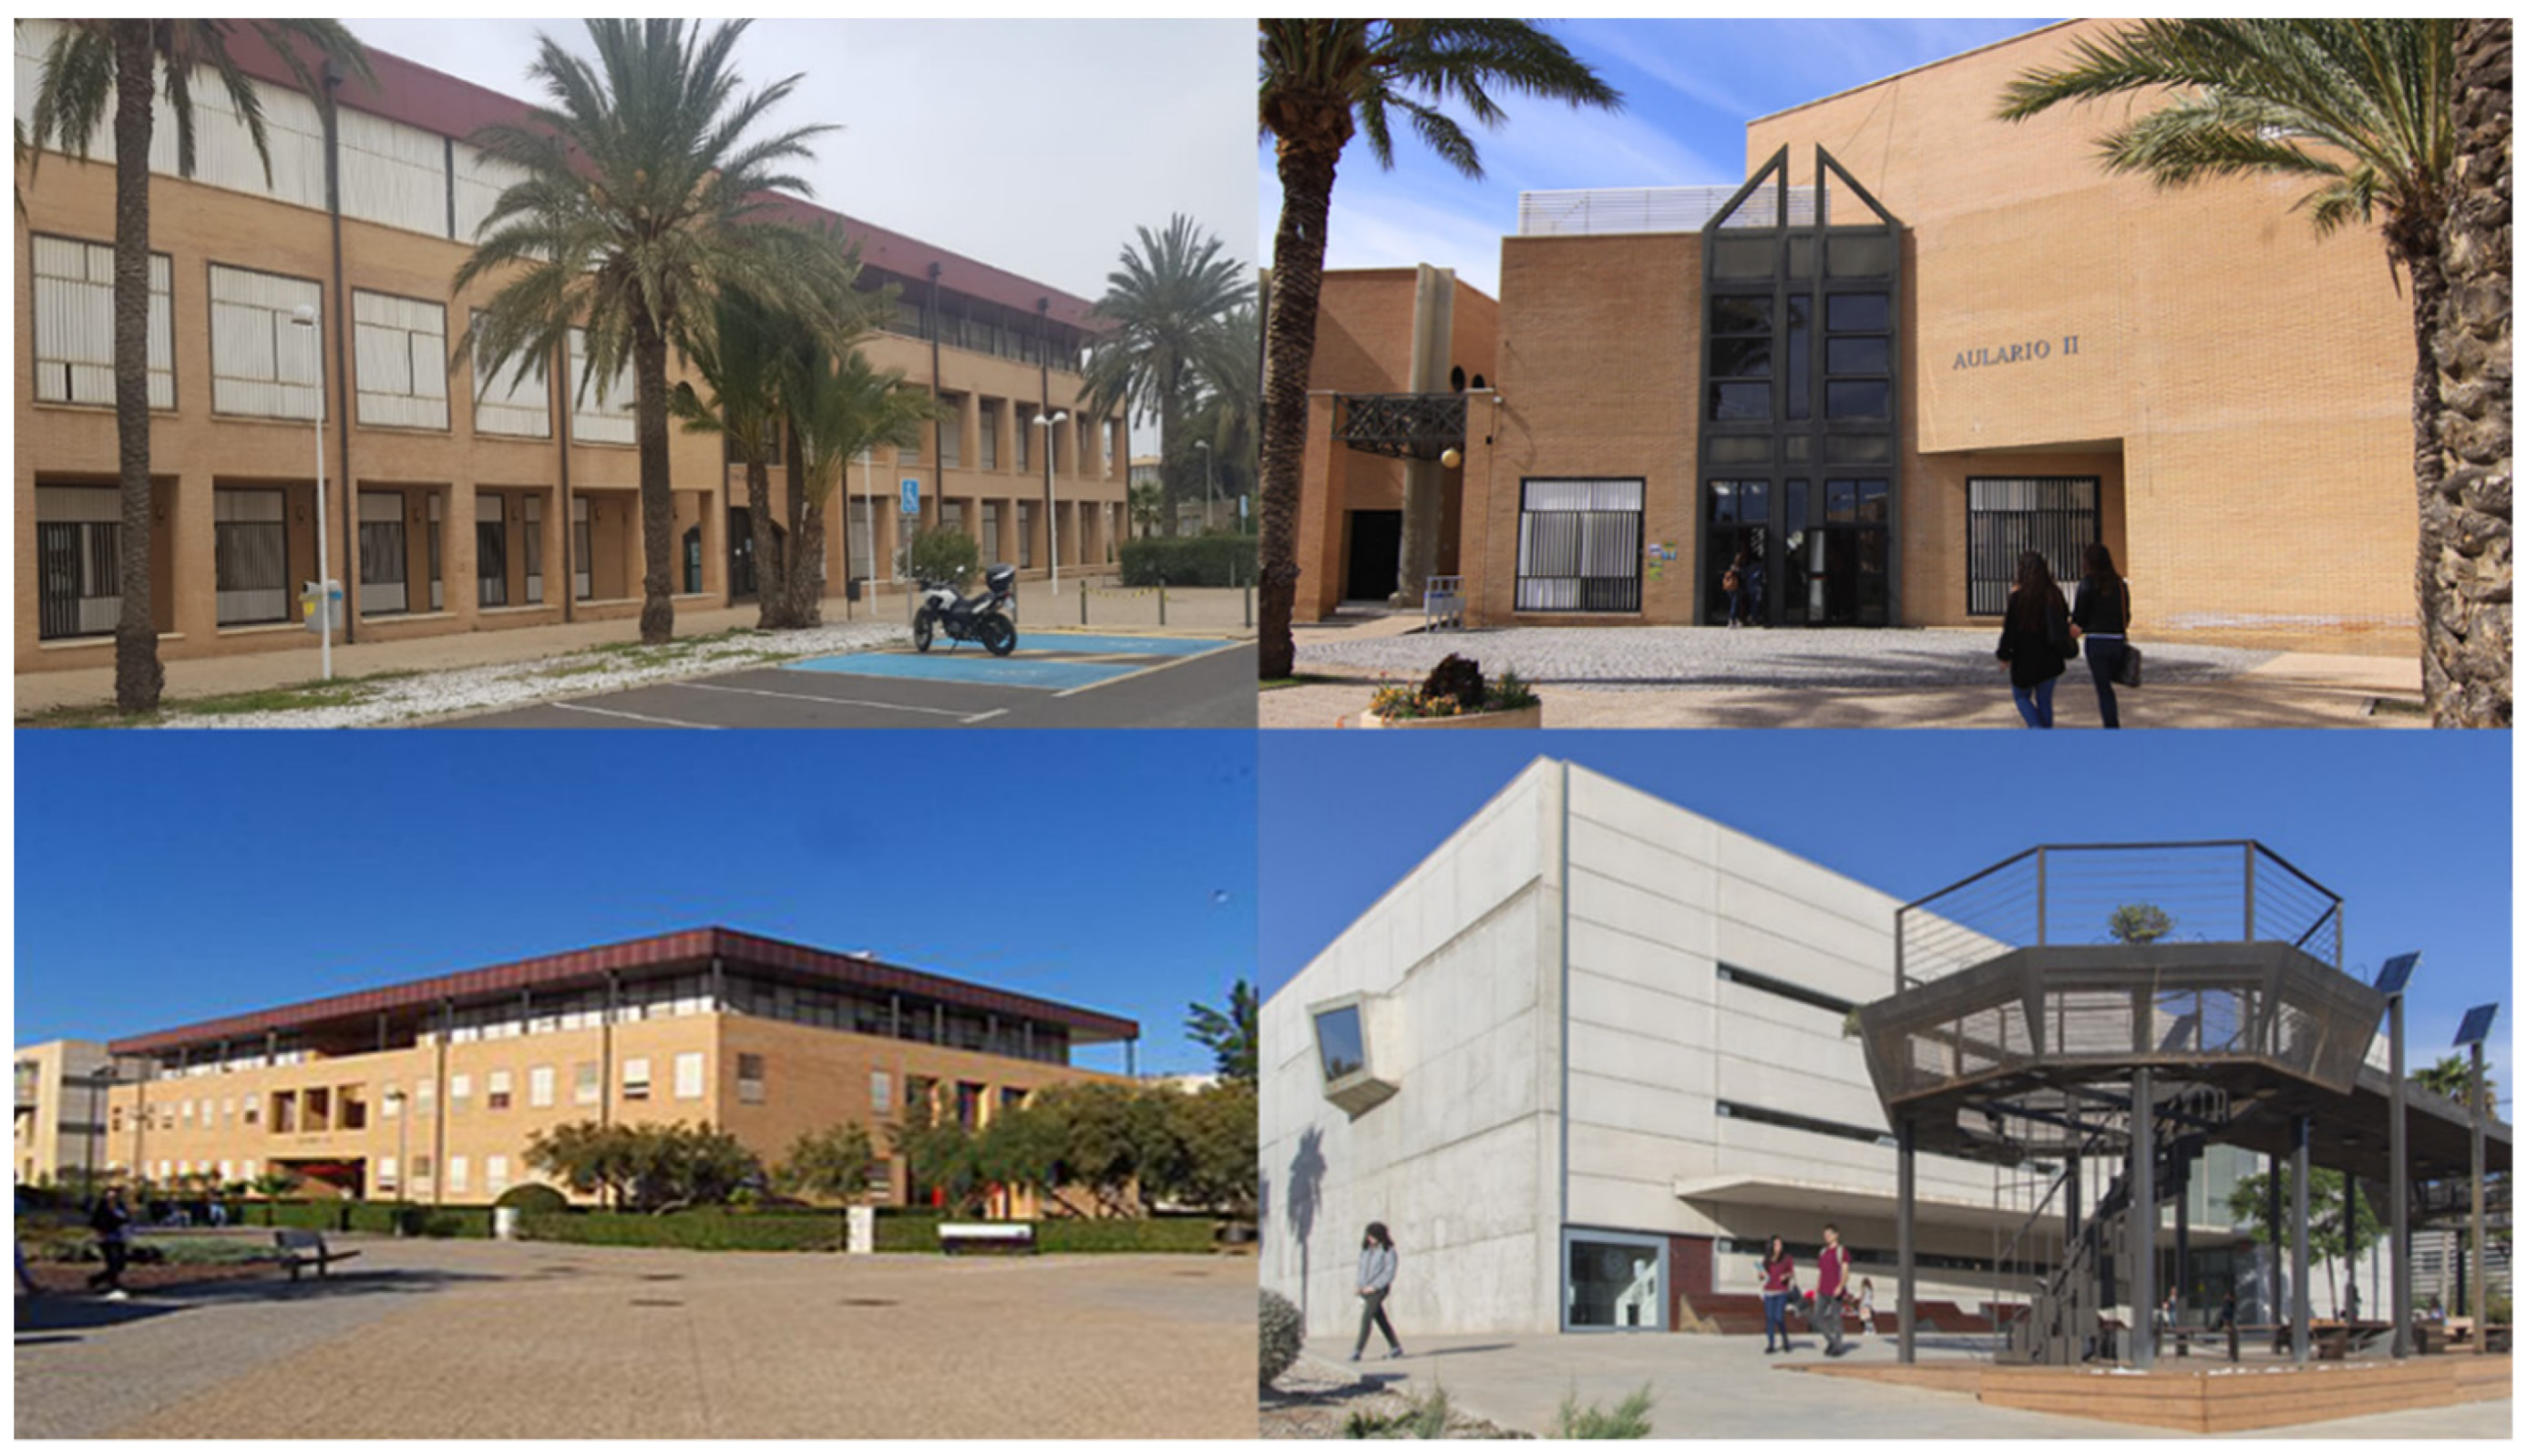
The teaching and seminary rooms (
Figure 2) comprise facilities like classrooms, lecture theatres, computer rooms, and these facilities usually contain a high number of occupants. Although the teaching and seminary rooms were empty during the larger part of 2020, this category consumed the equivalent of 72% of its share of the electricity consumption of 2019. Building (4) is a seminar building that is composed of one big lecture hall that spreads on a surface of 1002 m
2; events such as conferences, seminaries, and ceremonies are frequently hosted in this facility.
Buildings (5), (15), and (3) are teaching facilities composed of three floors with respective surfaces of 5612 m2, 4118 m2, and 5585 m2. These buildings are mainly composed of classrooms and few computer rooms.
Building (12) is a teaching and seminary building. It contains lecture halls, teaching, and computer rooms, and this facility hosts different events from conferences to seminaries and information technology training. Building (23) is the Center for Neuropsychological Evaluation and Rehabilitation (CERNEP) with a surface of 6605 m2. It is composed of many facilities such as classrooms, rooms for practical medical exercising, and this center hosts different events from conferences to practical training and theoretical classes.
Building (27) is the Scientific and Technical Mathematics III, with a surface of 8618 m2. It is composed of seminary rooms, teaching, and computer rooms, and this facility hosts different events from seminaries, theoretical classes, and information technology training.
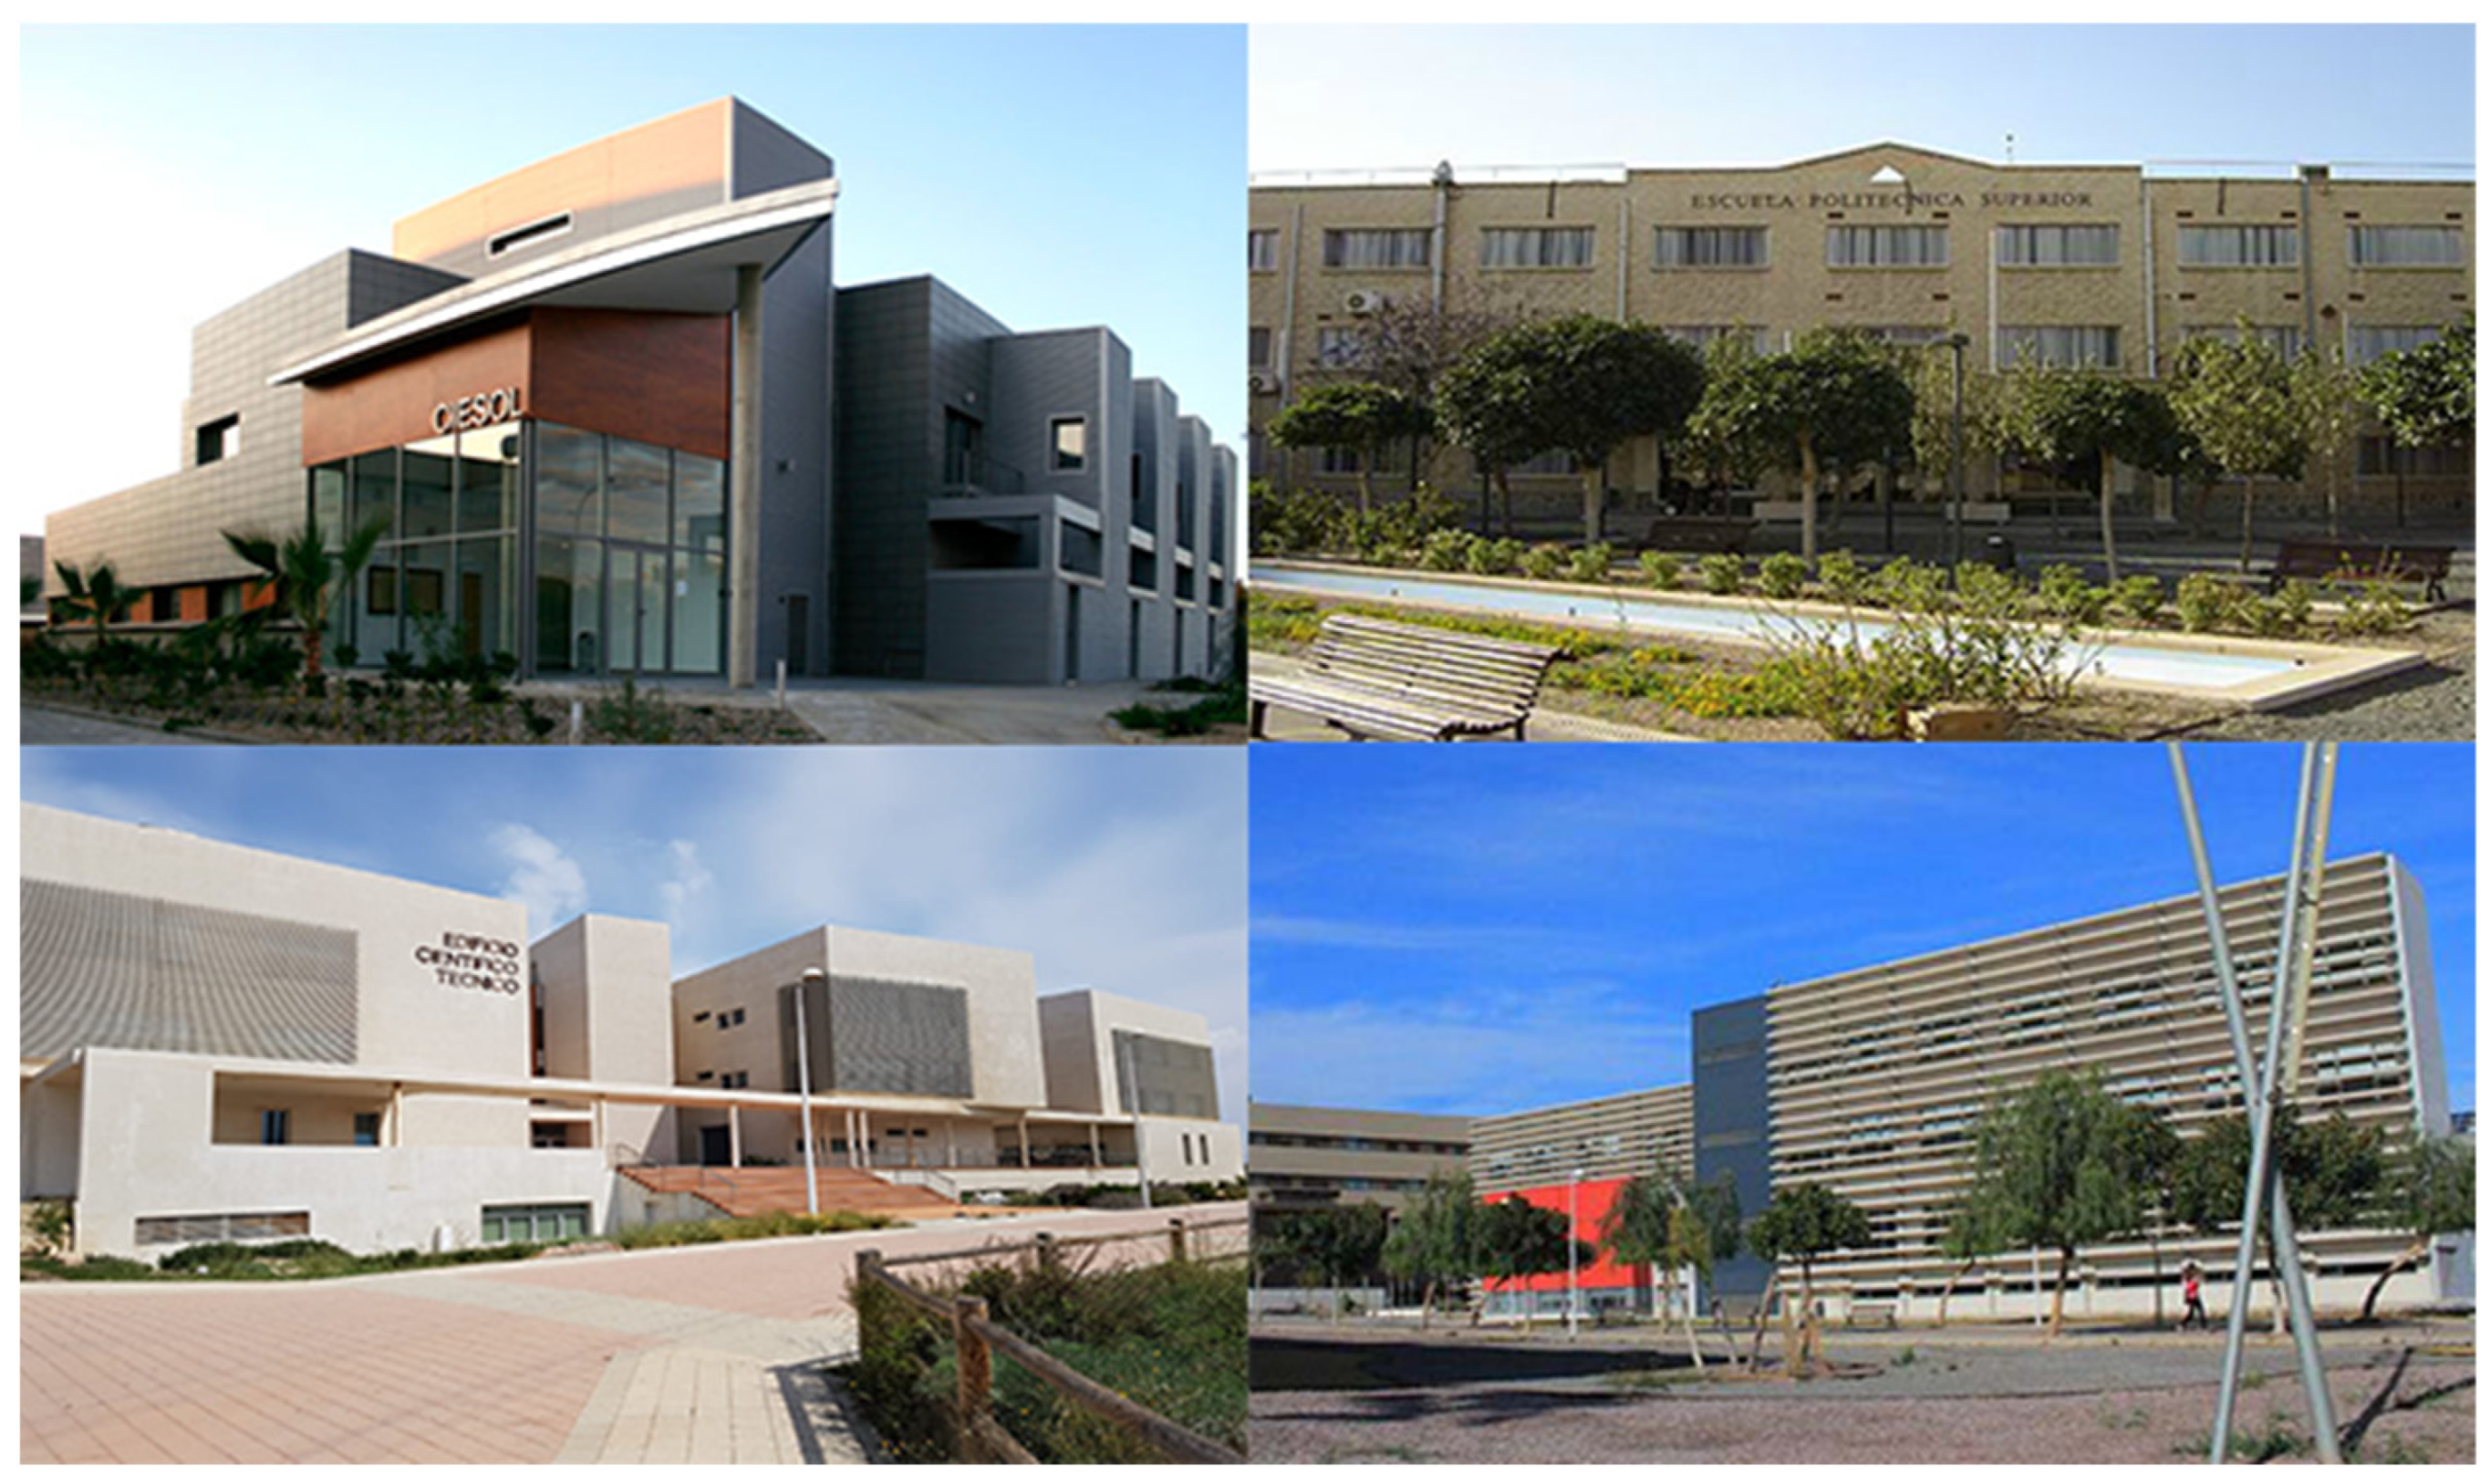
Research buildings (
Figure 3) comprise facilities like classrooms, seminary rooms, computer rooms, laboratories, and these facilities host theoretical and practical training. Although the majority of research buildings were empty during an important period of 2020, nevertheless this category barely changed its consumption value and reached the equivalent of 98% of its share of electricity consumption in 2019. Building (9), the School of Engineering, is a three-floor building that has a gross floor area of 5487 m
2. This facility is composed of diverse engineering fields laboratories, offices, computer rooms, classrooms, and seminar rooms. Buildings (30), the Center of Information and Communications Technologies Services, is a three-floor building that has a gross floor area of 4301 m
2. This facility is composed of offices and computer rooms and an information technology workshop. Building (16), the Superior Council of Scientific Research, is a three-floor building that has a gross floor area of 2100 m
2. This facility is composed of offices, seminary rooms, and hydrology and geology-related laboratories. Building (28), the Scientific-Technical and Chemistry, is a three-floor building with a surface of 4828 m
2. This facility is composed of chemistry laboratories, classrooms, seminar rooms, and computer rooms. Building (29), the Center of Research, is a three-floor building with a gross floor area of 4975 m
2. It is composed of laboratories, and offices. Building (31), the Center of Solar Energy Research, is a two-floor building with a surface of 1072 m
2. It is composed of seminary rooms, teaching and computer rooms, and a solar energy workshops. Building (24), Technical and Science, is a three-floor building with a gross floor area of 3089 m
2. This facility is composed of seminary rooms, computer rooms and teaching rooms, laboratories, and offices. Building (13), Technical and Science II, is a three-floor building with a gross floor area of 12,341 m
2. This facility is composed of seminary rooms, computer rooms and teaching rooms, laboratories, and offices.
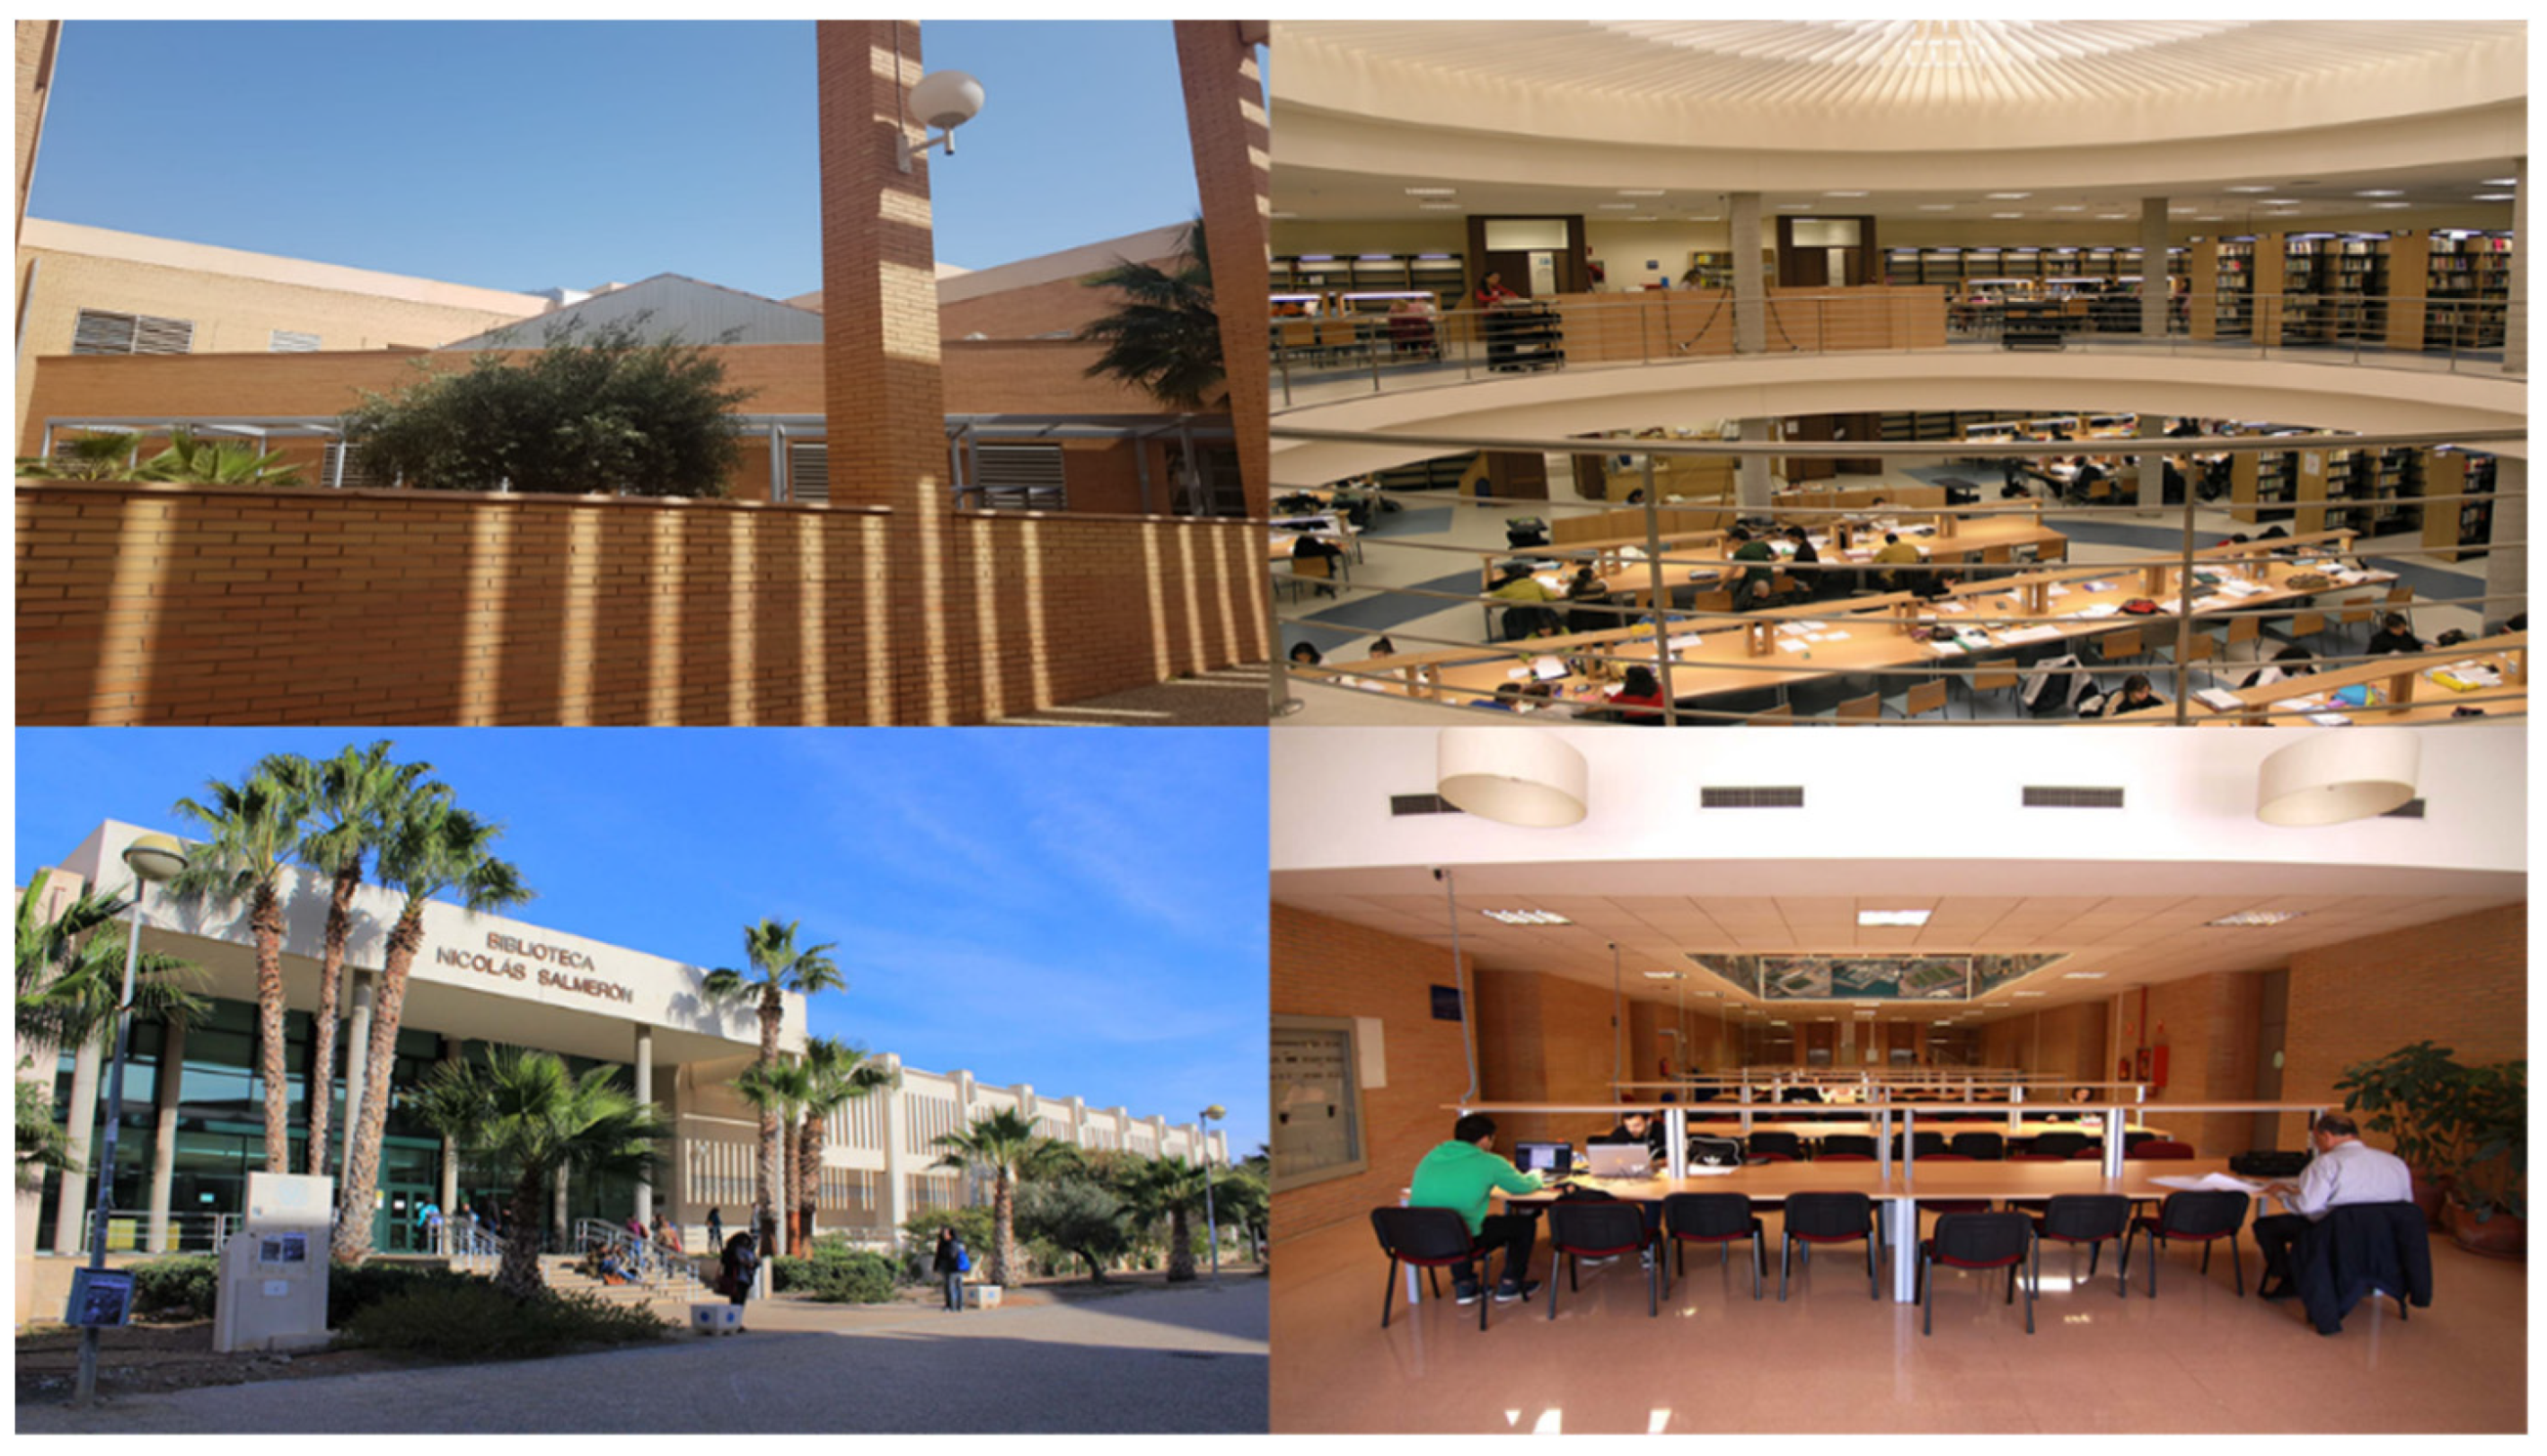
The Library building (26) (
Figure 4) of the University has a gross floor area of 16,194 m
2. Its facilities include different structures such as study rooms, computer rooms, meeting rooms, staff offices, and common spaces.
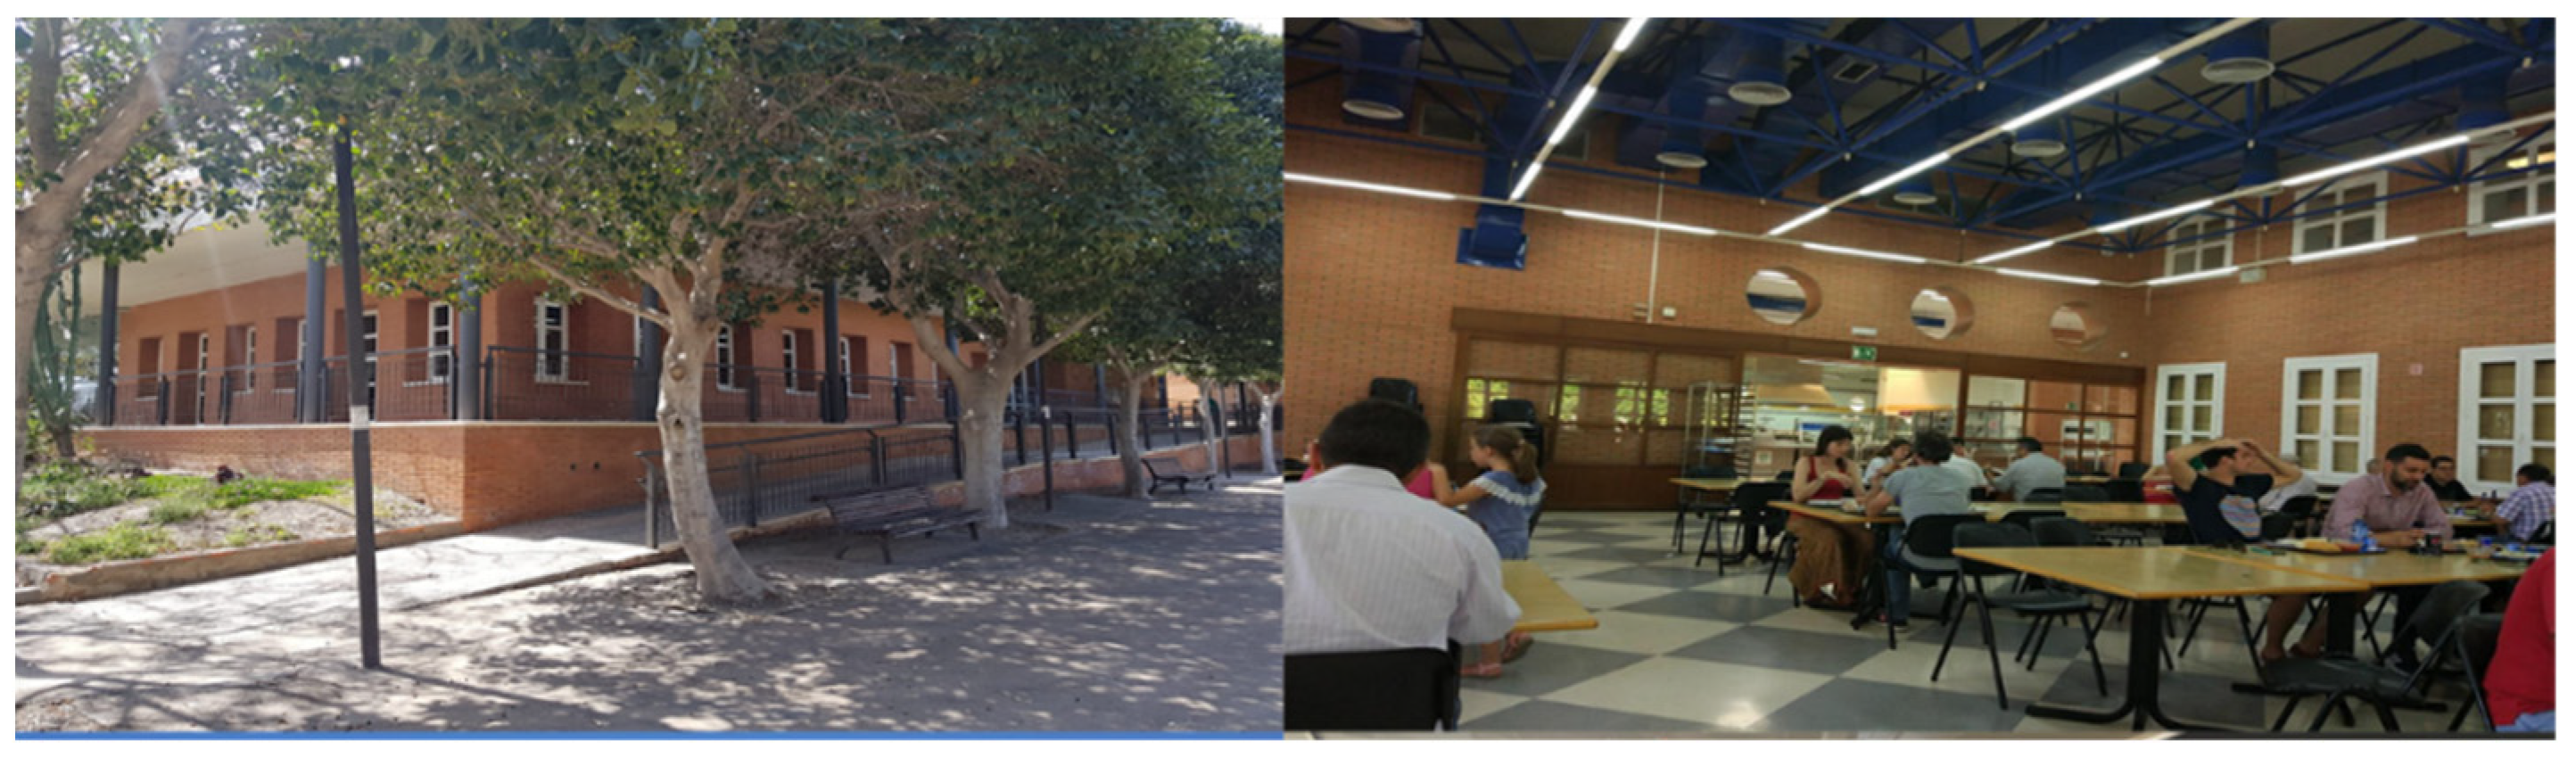
Restaurant buildings (
Figure 5) provide services for the staff, students, and visitors. Building (6) is the official university restaurant. It is a one-floor facility with a gross floor area of 1280 m
2. Building (33) is a private bar-restaurant, it is a one-floor facility with a gross floor area of 1190 m
2, and these facilities are composed of kitchens, halls, terraces, and toilets.
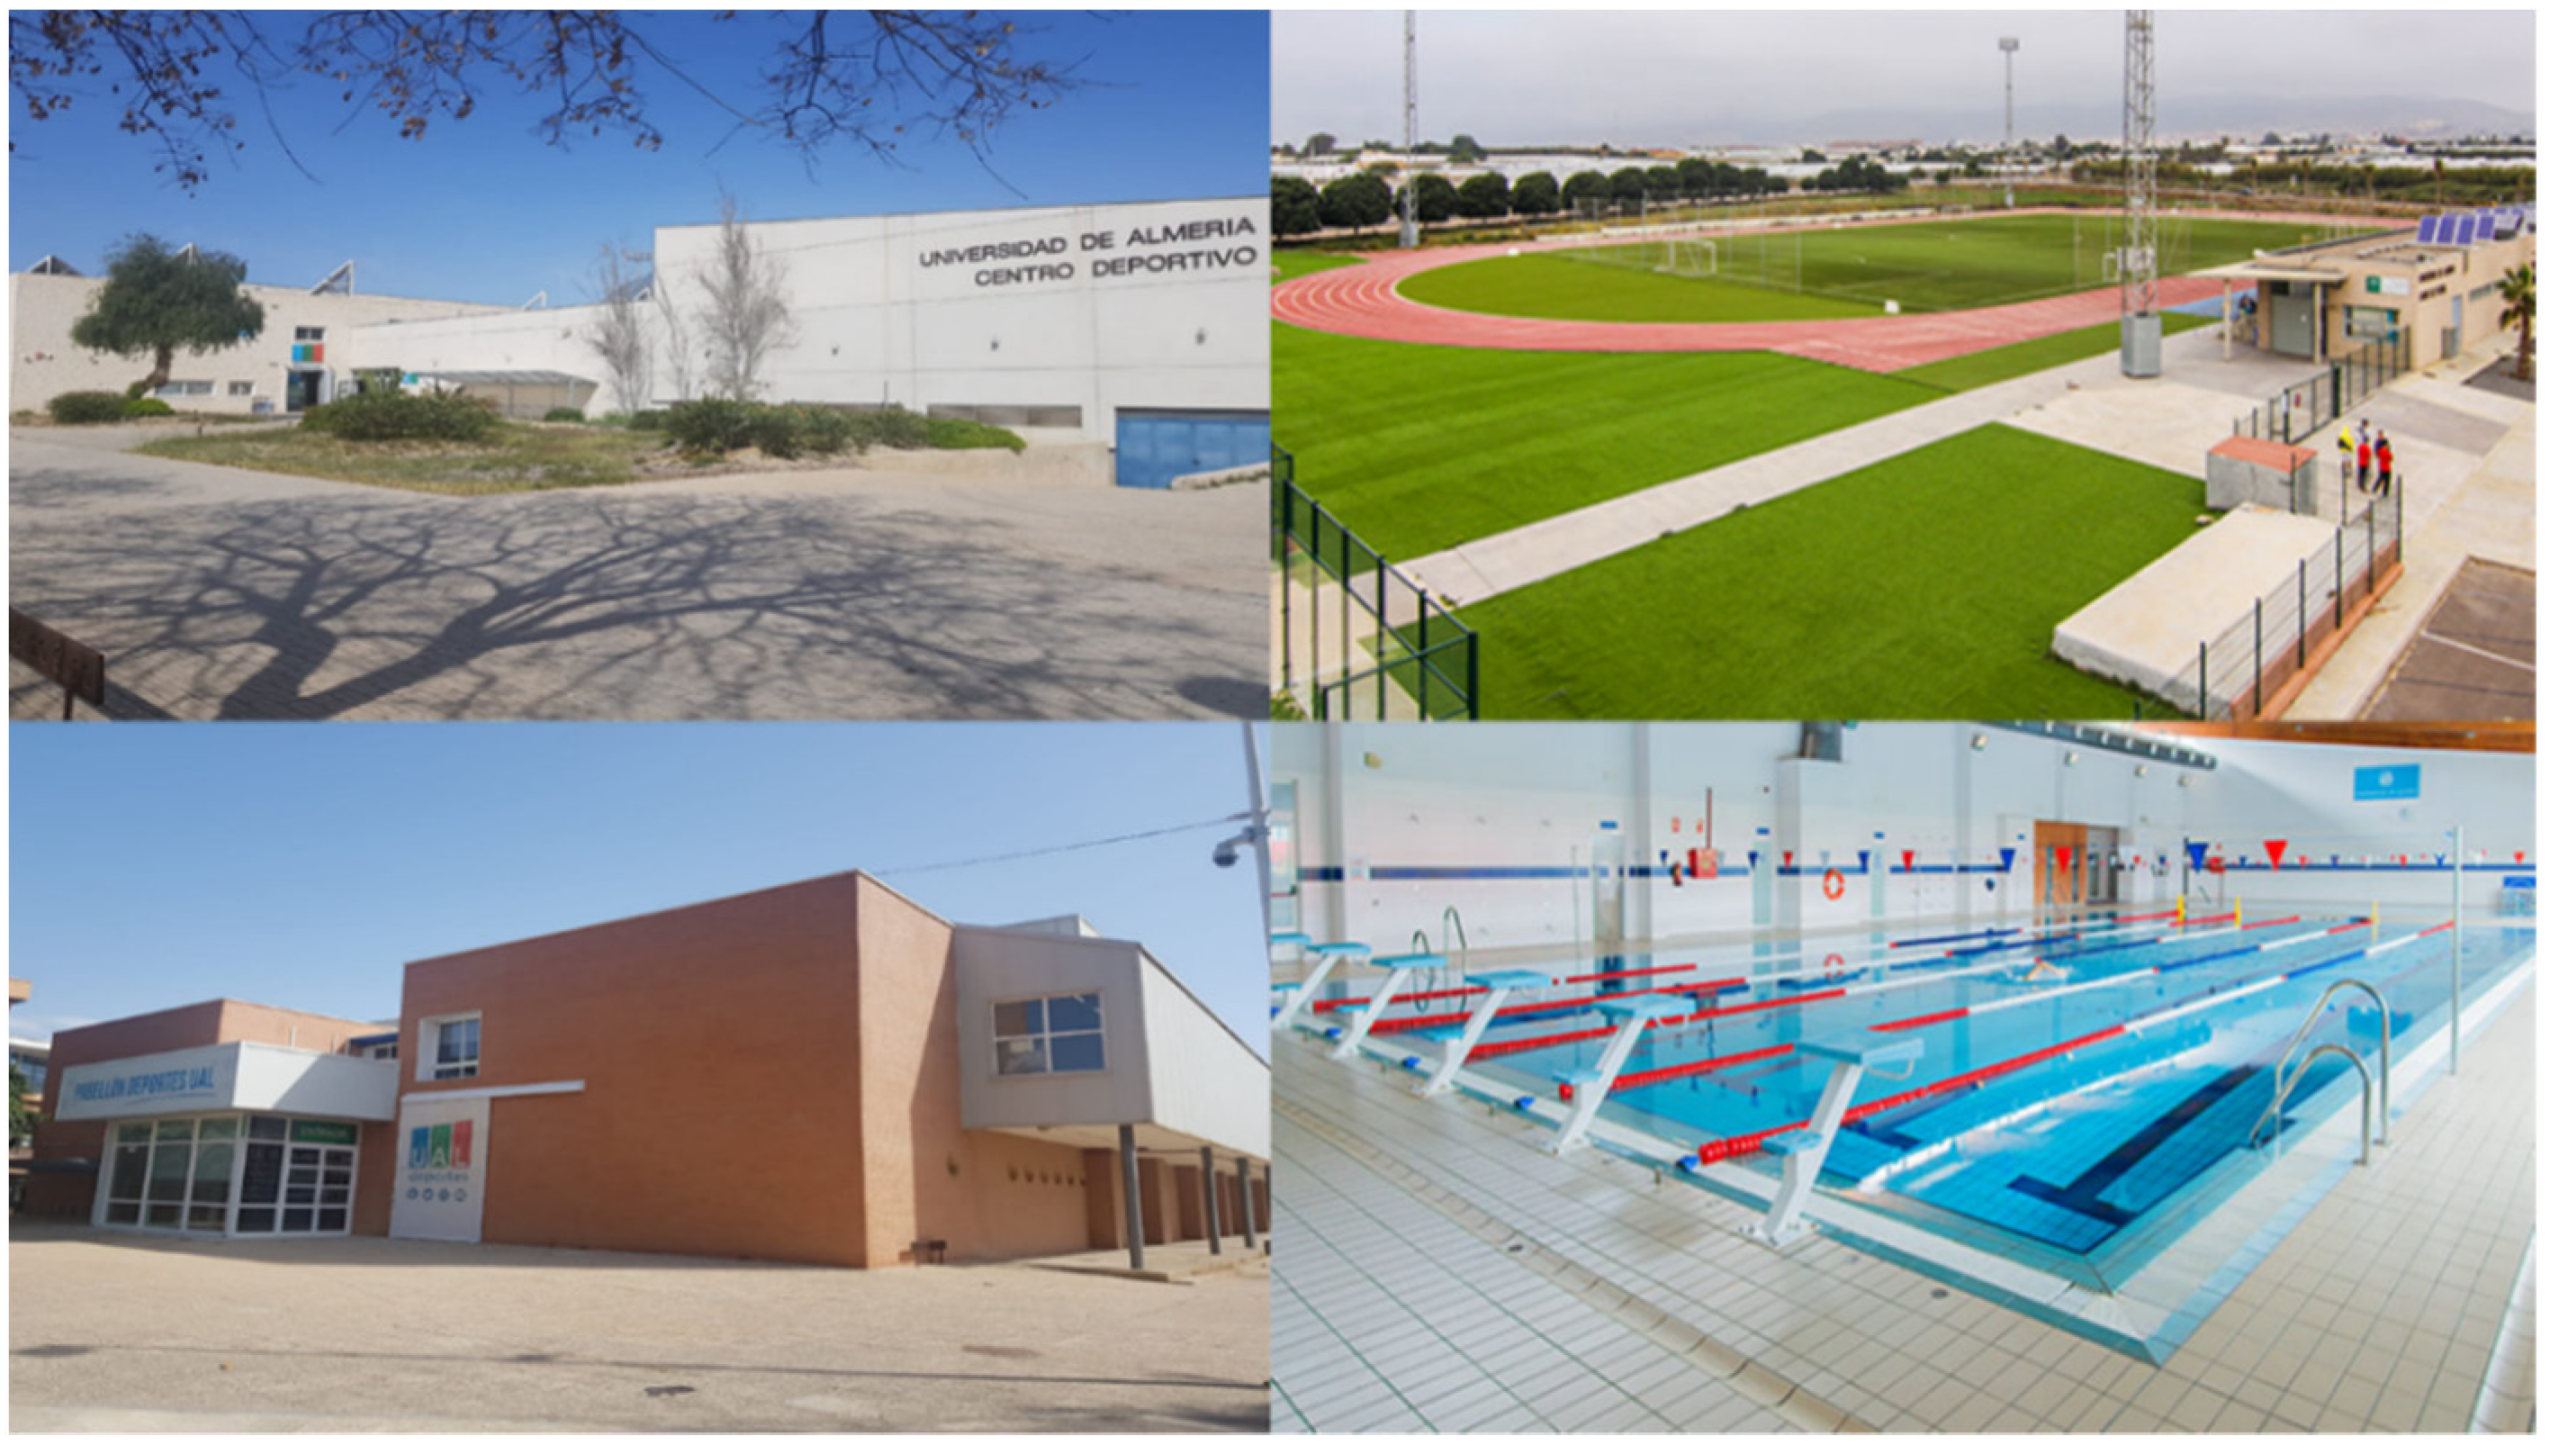
The Sports facility (
Figure 6), building (7), is an athletic swimming pool facility. Facility (17) includes a football stadium with an athletic running track and another smaller football stadium, and six tennis and paddle playing fields. Building (10) is a multi-sports hall that includes a gym, futsal, locker rooms, and showers.
3. Results
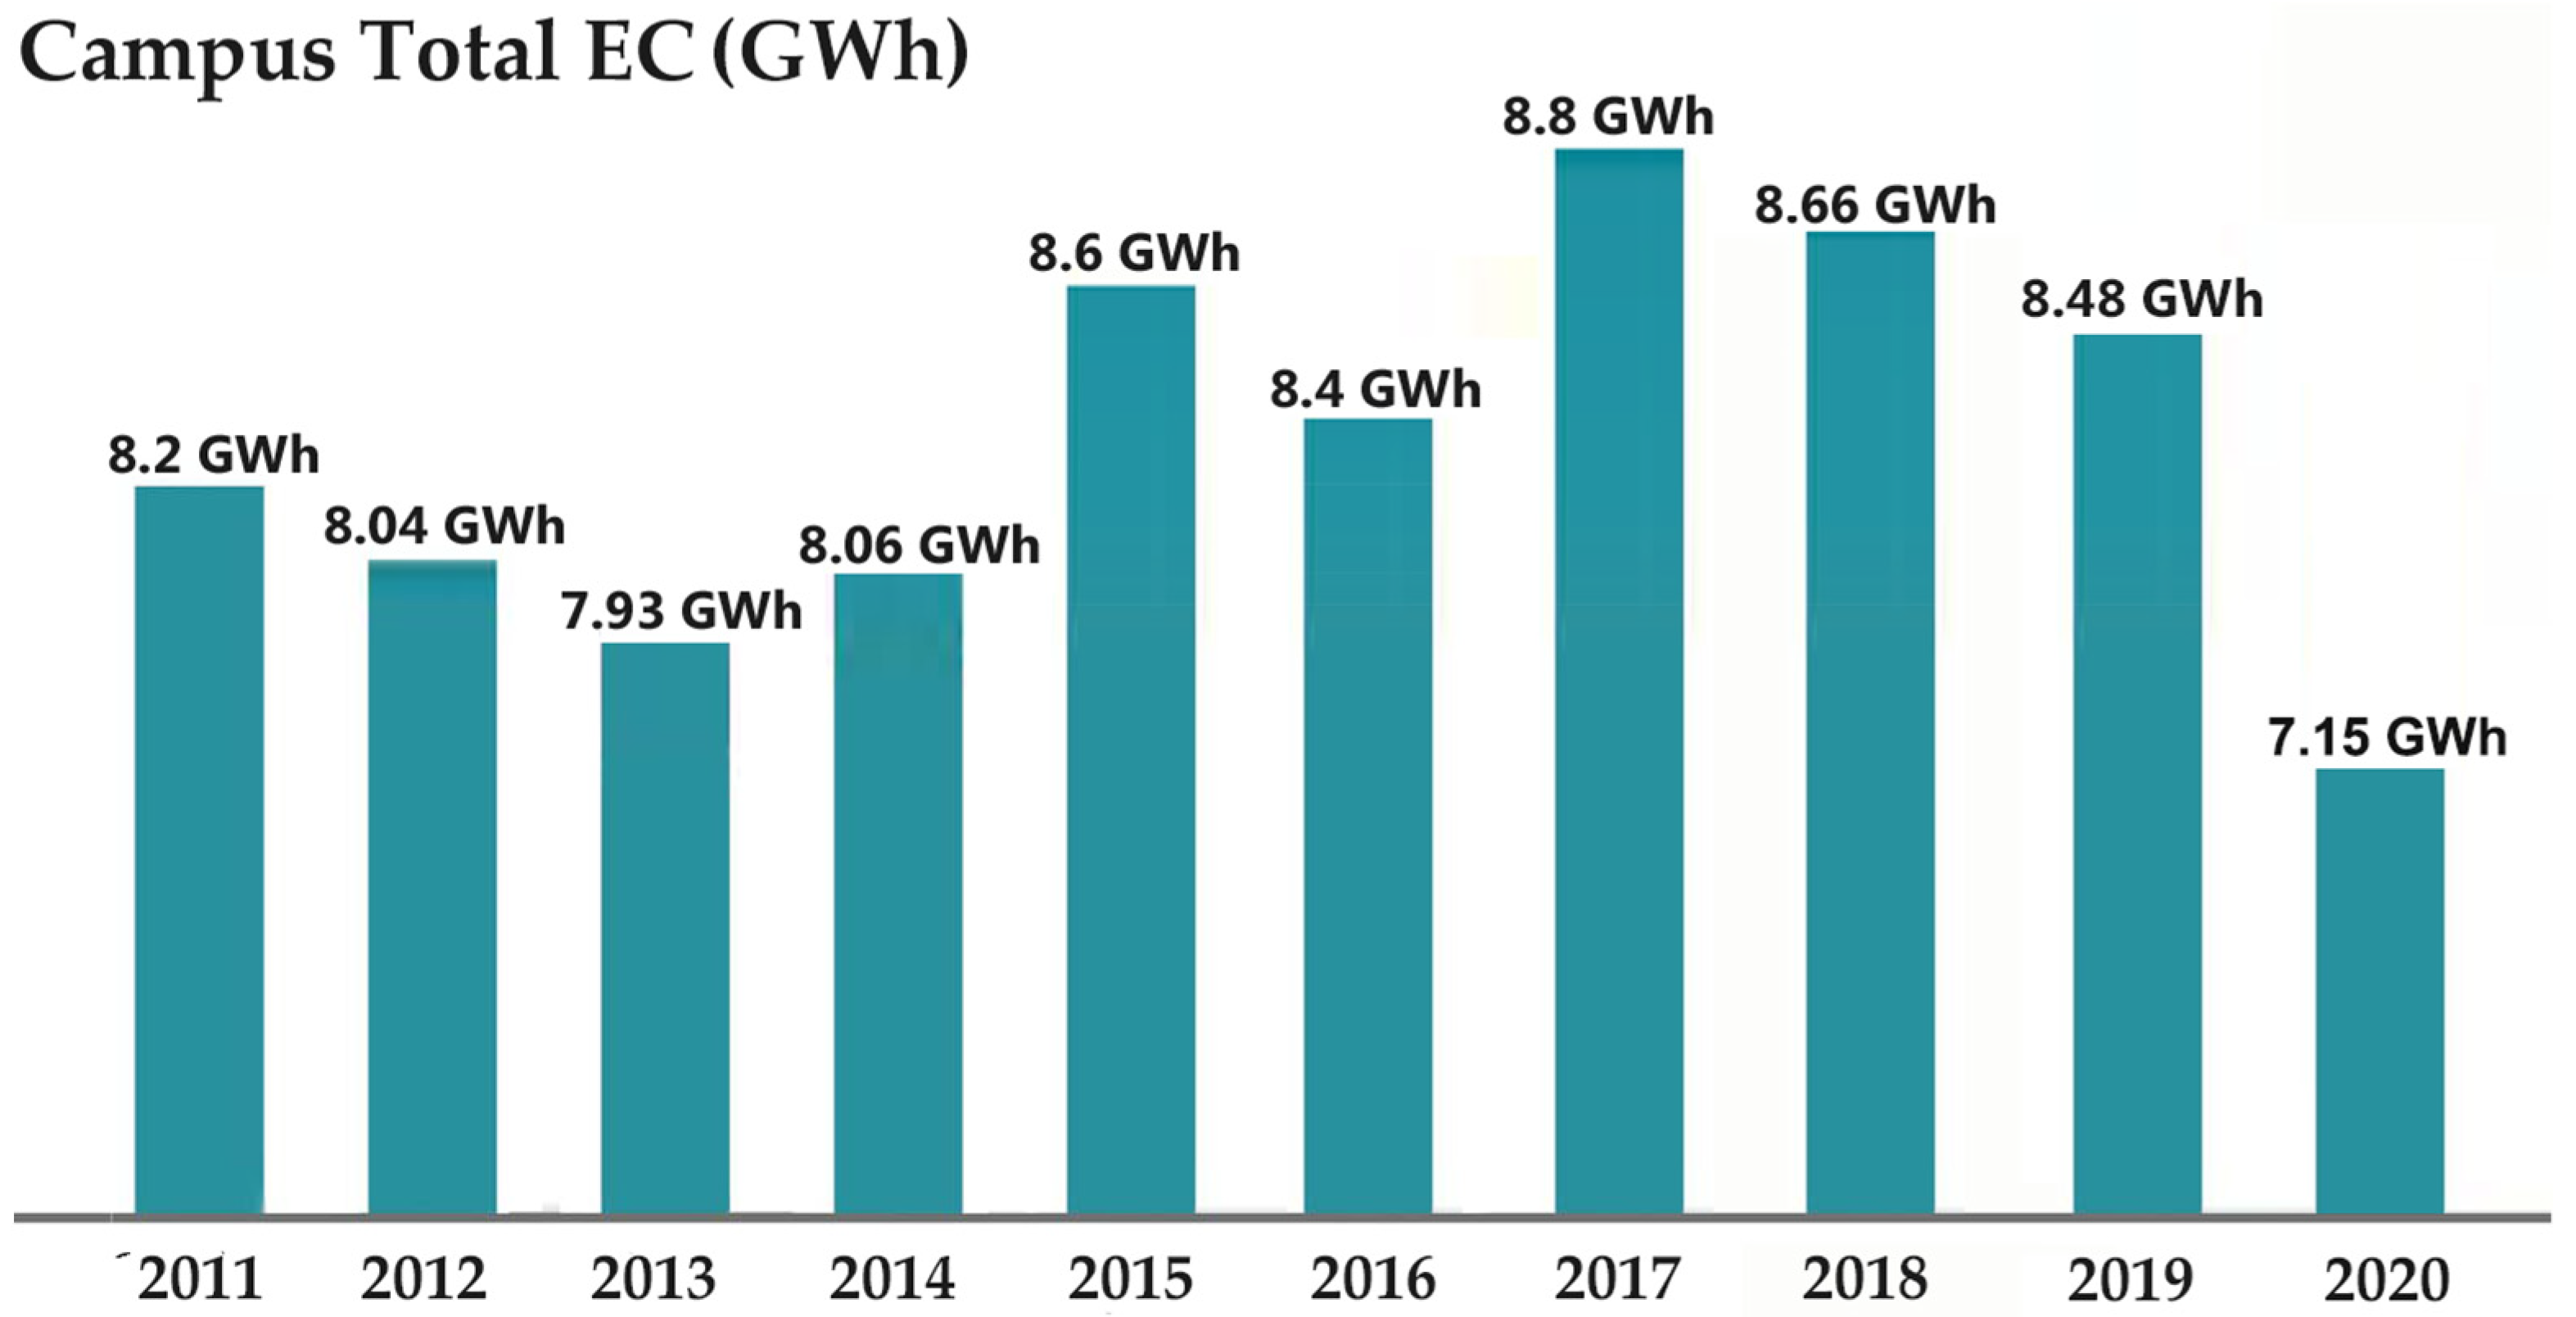
Figure 7 represents a histogram graphic that summarizes the evolution of the total electricity consumption on an annual basis from 2011 to 2020. The overall energy consumption has been varying in the range of 7.15 GWh–8.8 GWh, and it represents a gap of 10% between the minimum and the maximum value recorded. Furthermore, the year 2020 showed an unusual contraction due to the COVID-19 pandemic that hit Spain in the first months of 2020. This value is the lowest of the last ten years.
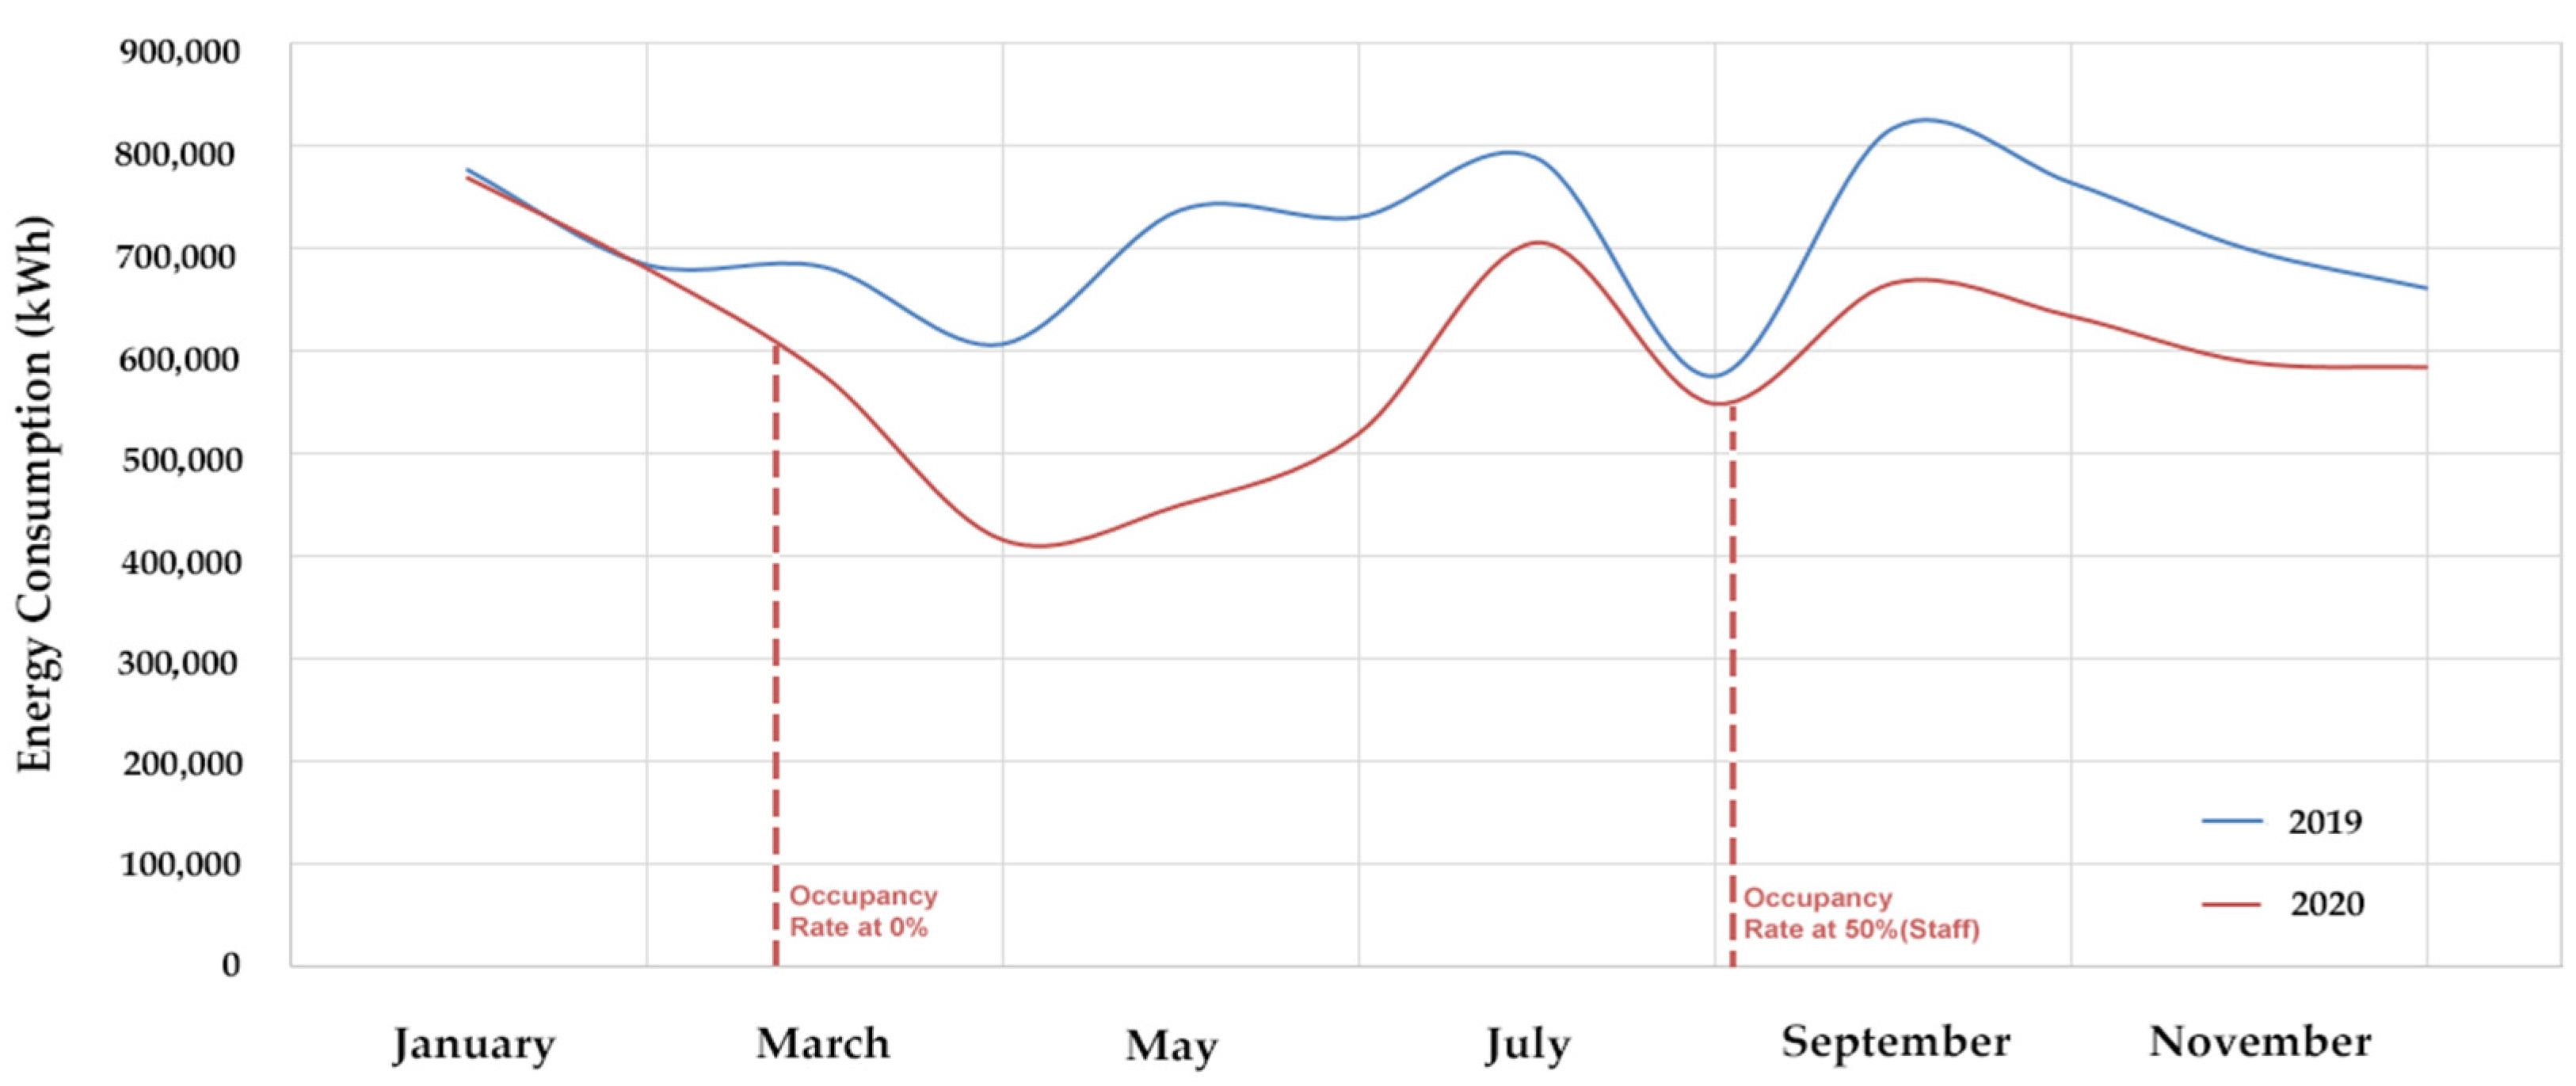
Figure 8 illustrates the campus energy consumption on a monthly basis. During the first two months (January and February) both patterns of 2019 and 2020 were identical until the month of March that witnessed the COVID-19 outbreak in Spain. Then the 2020 pattern evolved below the levels of the previous year, it decreased sharply and simultaneously with the lockdown of the University in April. The gap begun to narrow in August, this month was a summer break, and the number of occupants is at the lowest point for each year, and then the gap between the two graphics started to widen once again but not as much as in the period of the 0% occupant.
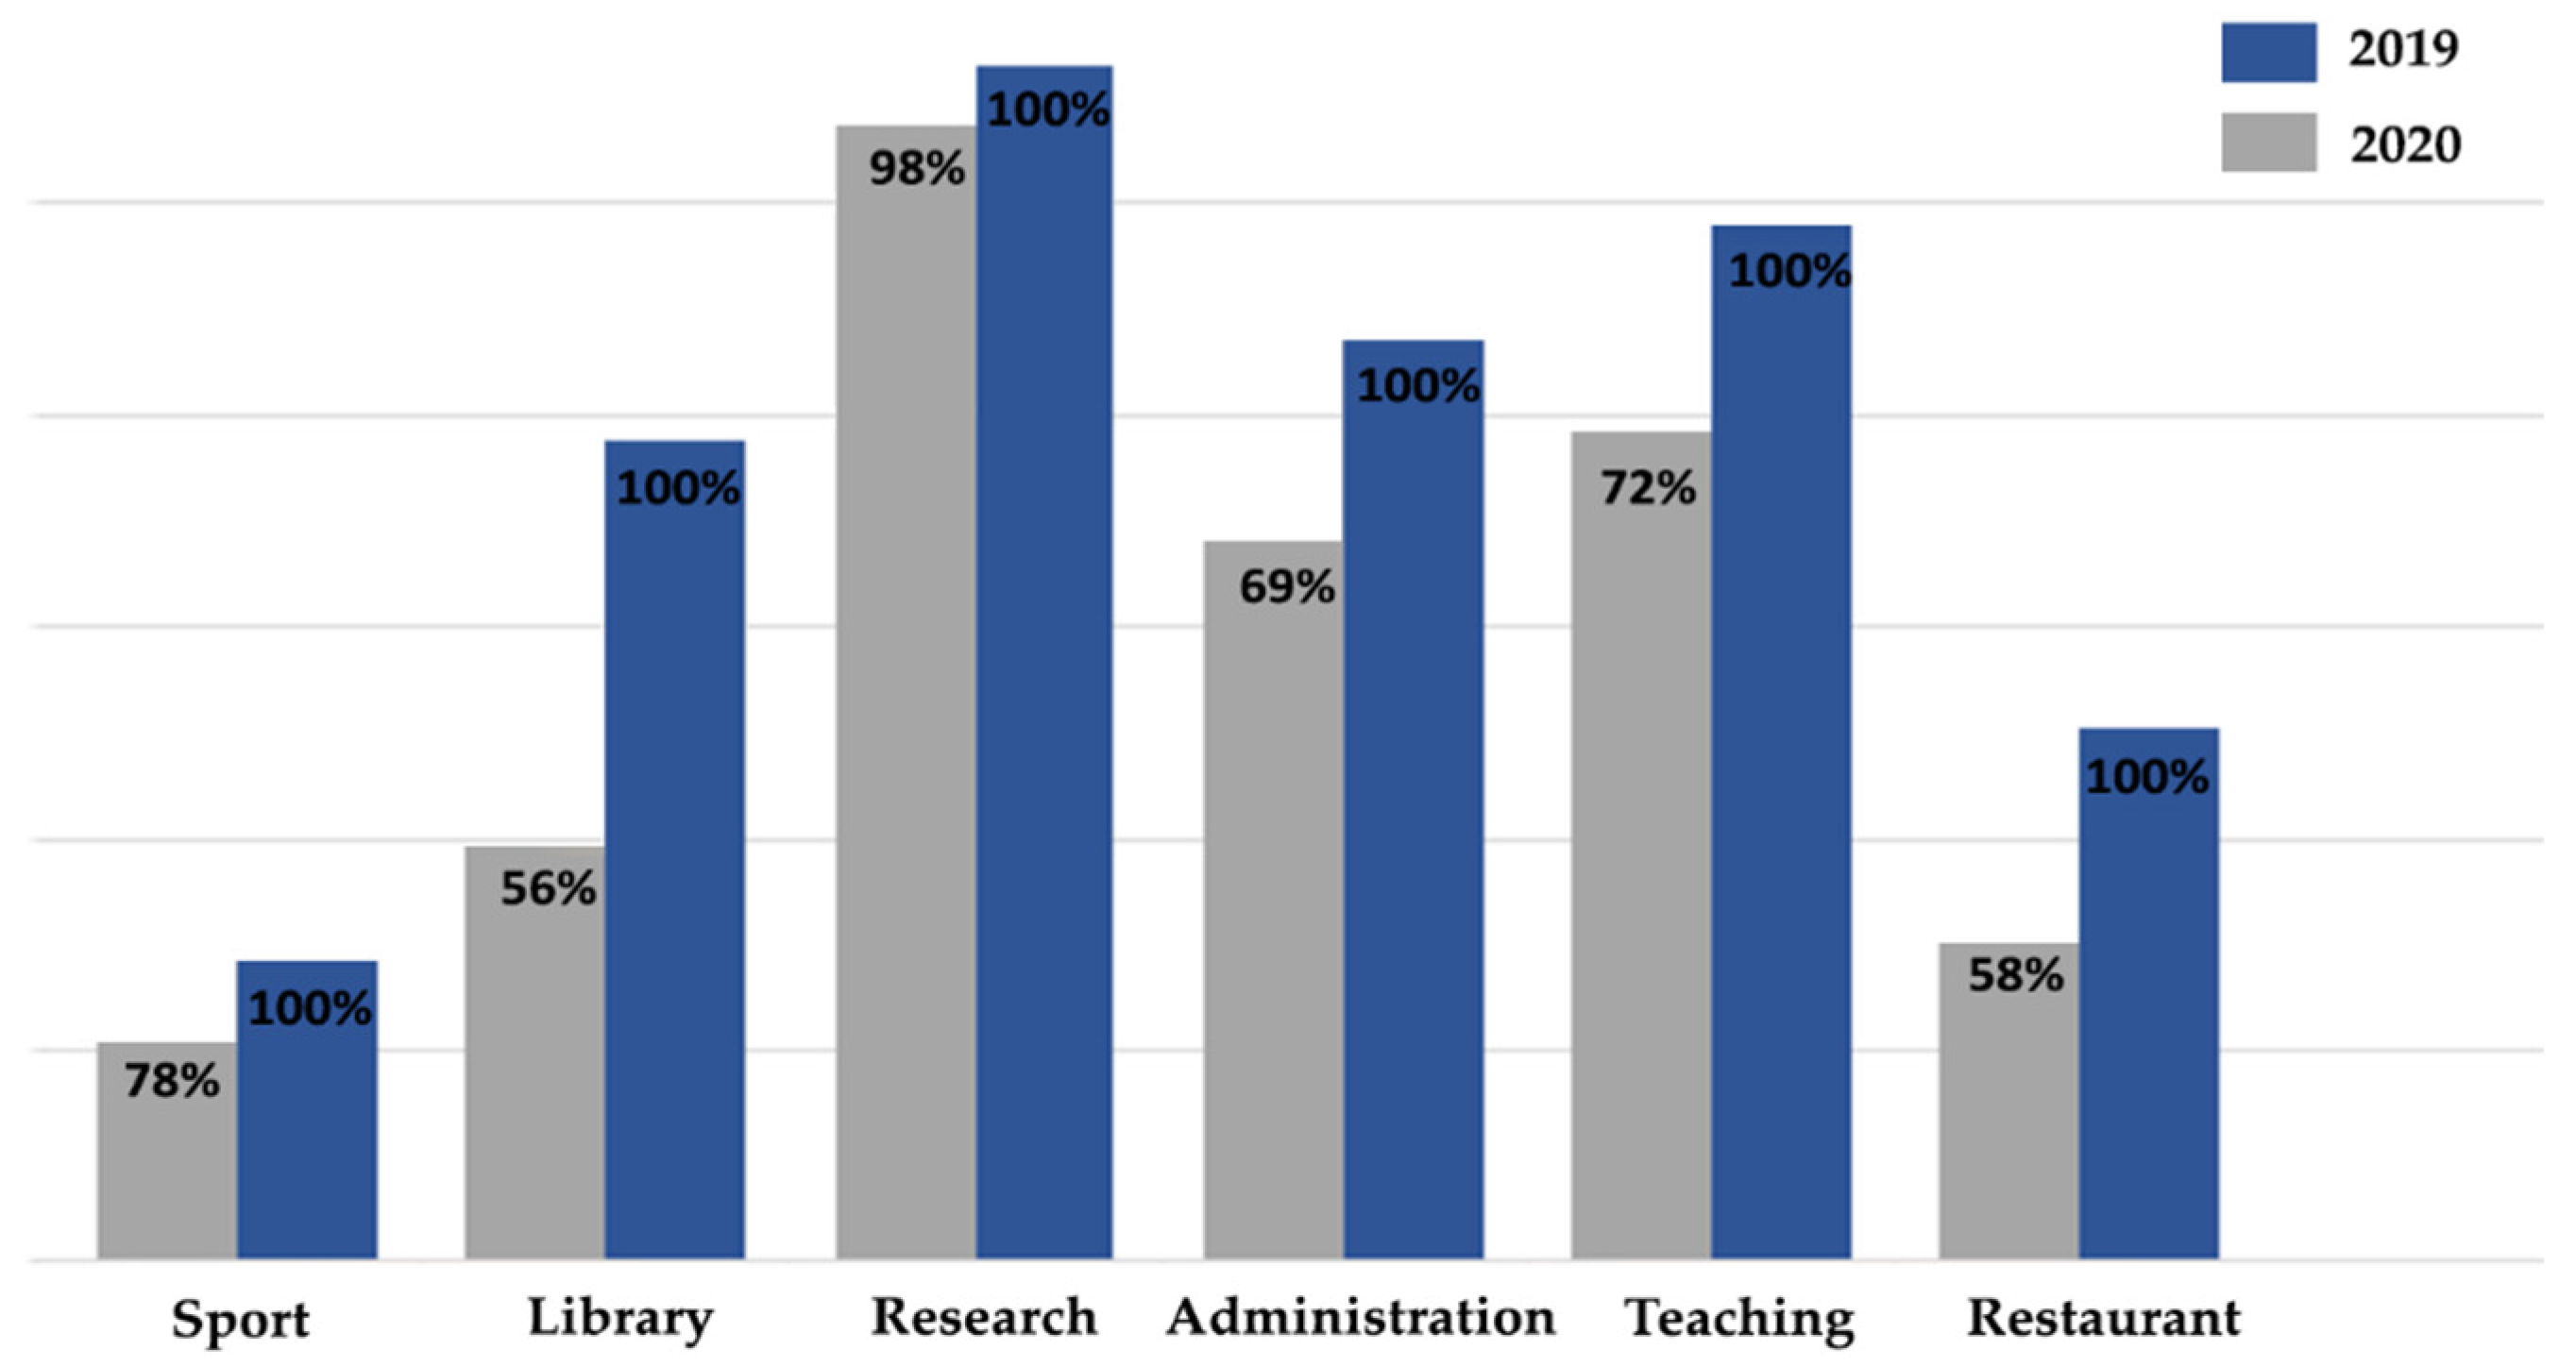
As
Figure 9 illustrates that the research and laboratory category reduced its electricity consumption by 2% from 2019 to 2020. This means that the occupancy rate is uncorrelated with the EC of this category. Library buildings witnessed a significant decrease of 44%, which means that the presence of students and staff plays a key role in EC of this category. The teaching and seminary room electricity consumption share went down by 28% during the period studied, and sports facilities reduced their EC by 22%. The restaurant building’s share of electricity consumption shrank by 42%. Administration and offices also showed a reduction of 31% in their share of the campus total EC. The EC gap in the same category between 2019 and 2020 varied from 2% to 44%. This disparity shows how much electricity consumption could differ from one category to another. These ratios do not reflect the manager’s level of expectation since they are far from being as low as the occupancy rate, especially in categories like teaching and seminary, research, and sports. To find more persuasive reasons, we aim to go further to study the patterns of buildings within each category.
Administration buildings comprise facilities like offices, meeting rooms, seminar rooms, lecture halls. These facilities host theoretical and practical training. Most of the administration was inoperative during the confinement, except few particular cases: in June, few offices were reopened again, and, starting from September, the University adopted a policy of 50% presence of staff.
Figure 10 and
Figure 11 showcase that administration facilities have generally the same evolution through time: during the period from January to April, the administration facilities fell by a wide range of ratios that varied from 14% to 89%; however, this gap was driven by only one building (1) since the rest of the buildings fell by levels under 50%. Moreover, the majority of the buildings showed their maximum value during the same month of January, which was a period before the outbreak happened in Spain, and five out of seven buildings had their minimum in the months of April and May, and the three following. Then all of the buildings increased their consumption during June and July, then they decreased in the summer break during August, and then, once the campus opened its door in September, the consumption went up again, showing that there is a clear correlation between the occupancy rate and the electricity consumption in this category.
Table 4 presents the relative standard deviation monthly energy consumption in 2019 and 2020 (see data in
Table 2). Generally, the year of the pandemic represented a much higher relative standard deviation than the previous year, except for building (1) which was also the least affected by the outbreak in the administration category and declined its consumption by only 12% in 2020. Building (19) had the highest relative standard deviation, followed by building (8), which makes them more likely to be considered the facilities most influenced by human activity within this category, and that is what the data (
Table 3) confirmed since they fell by the largest shares of 41% and 50% in 2020, respectively. On the other hand, most of the buildings nearly doubled their relative standard deviation between 2019 and 2020, showing a coherence of the accumulated fluctuations rate inflicted by the COVID-19 outbreak.
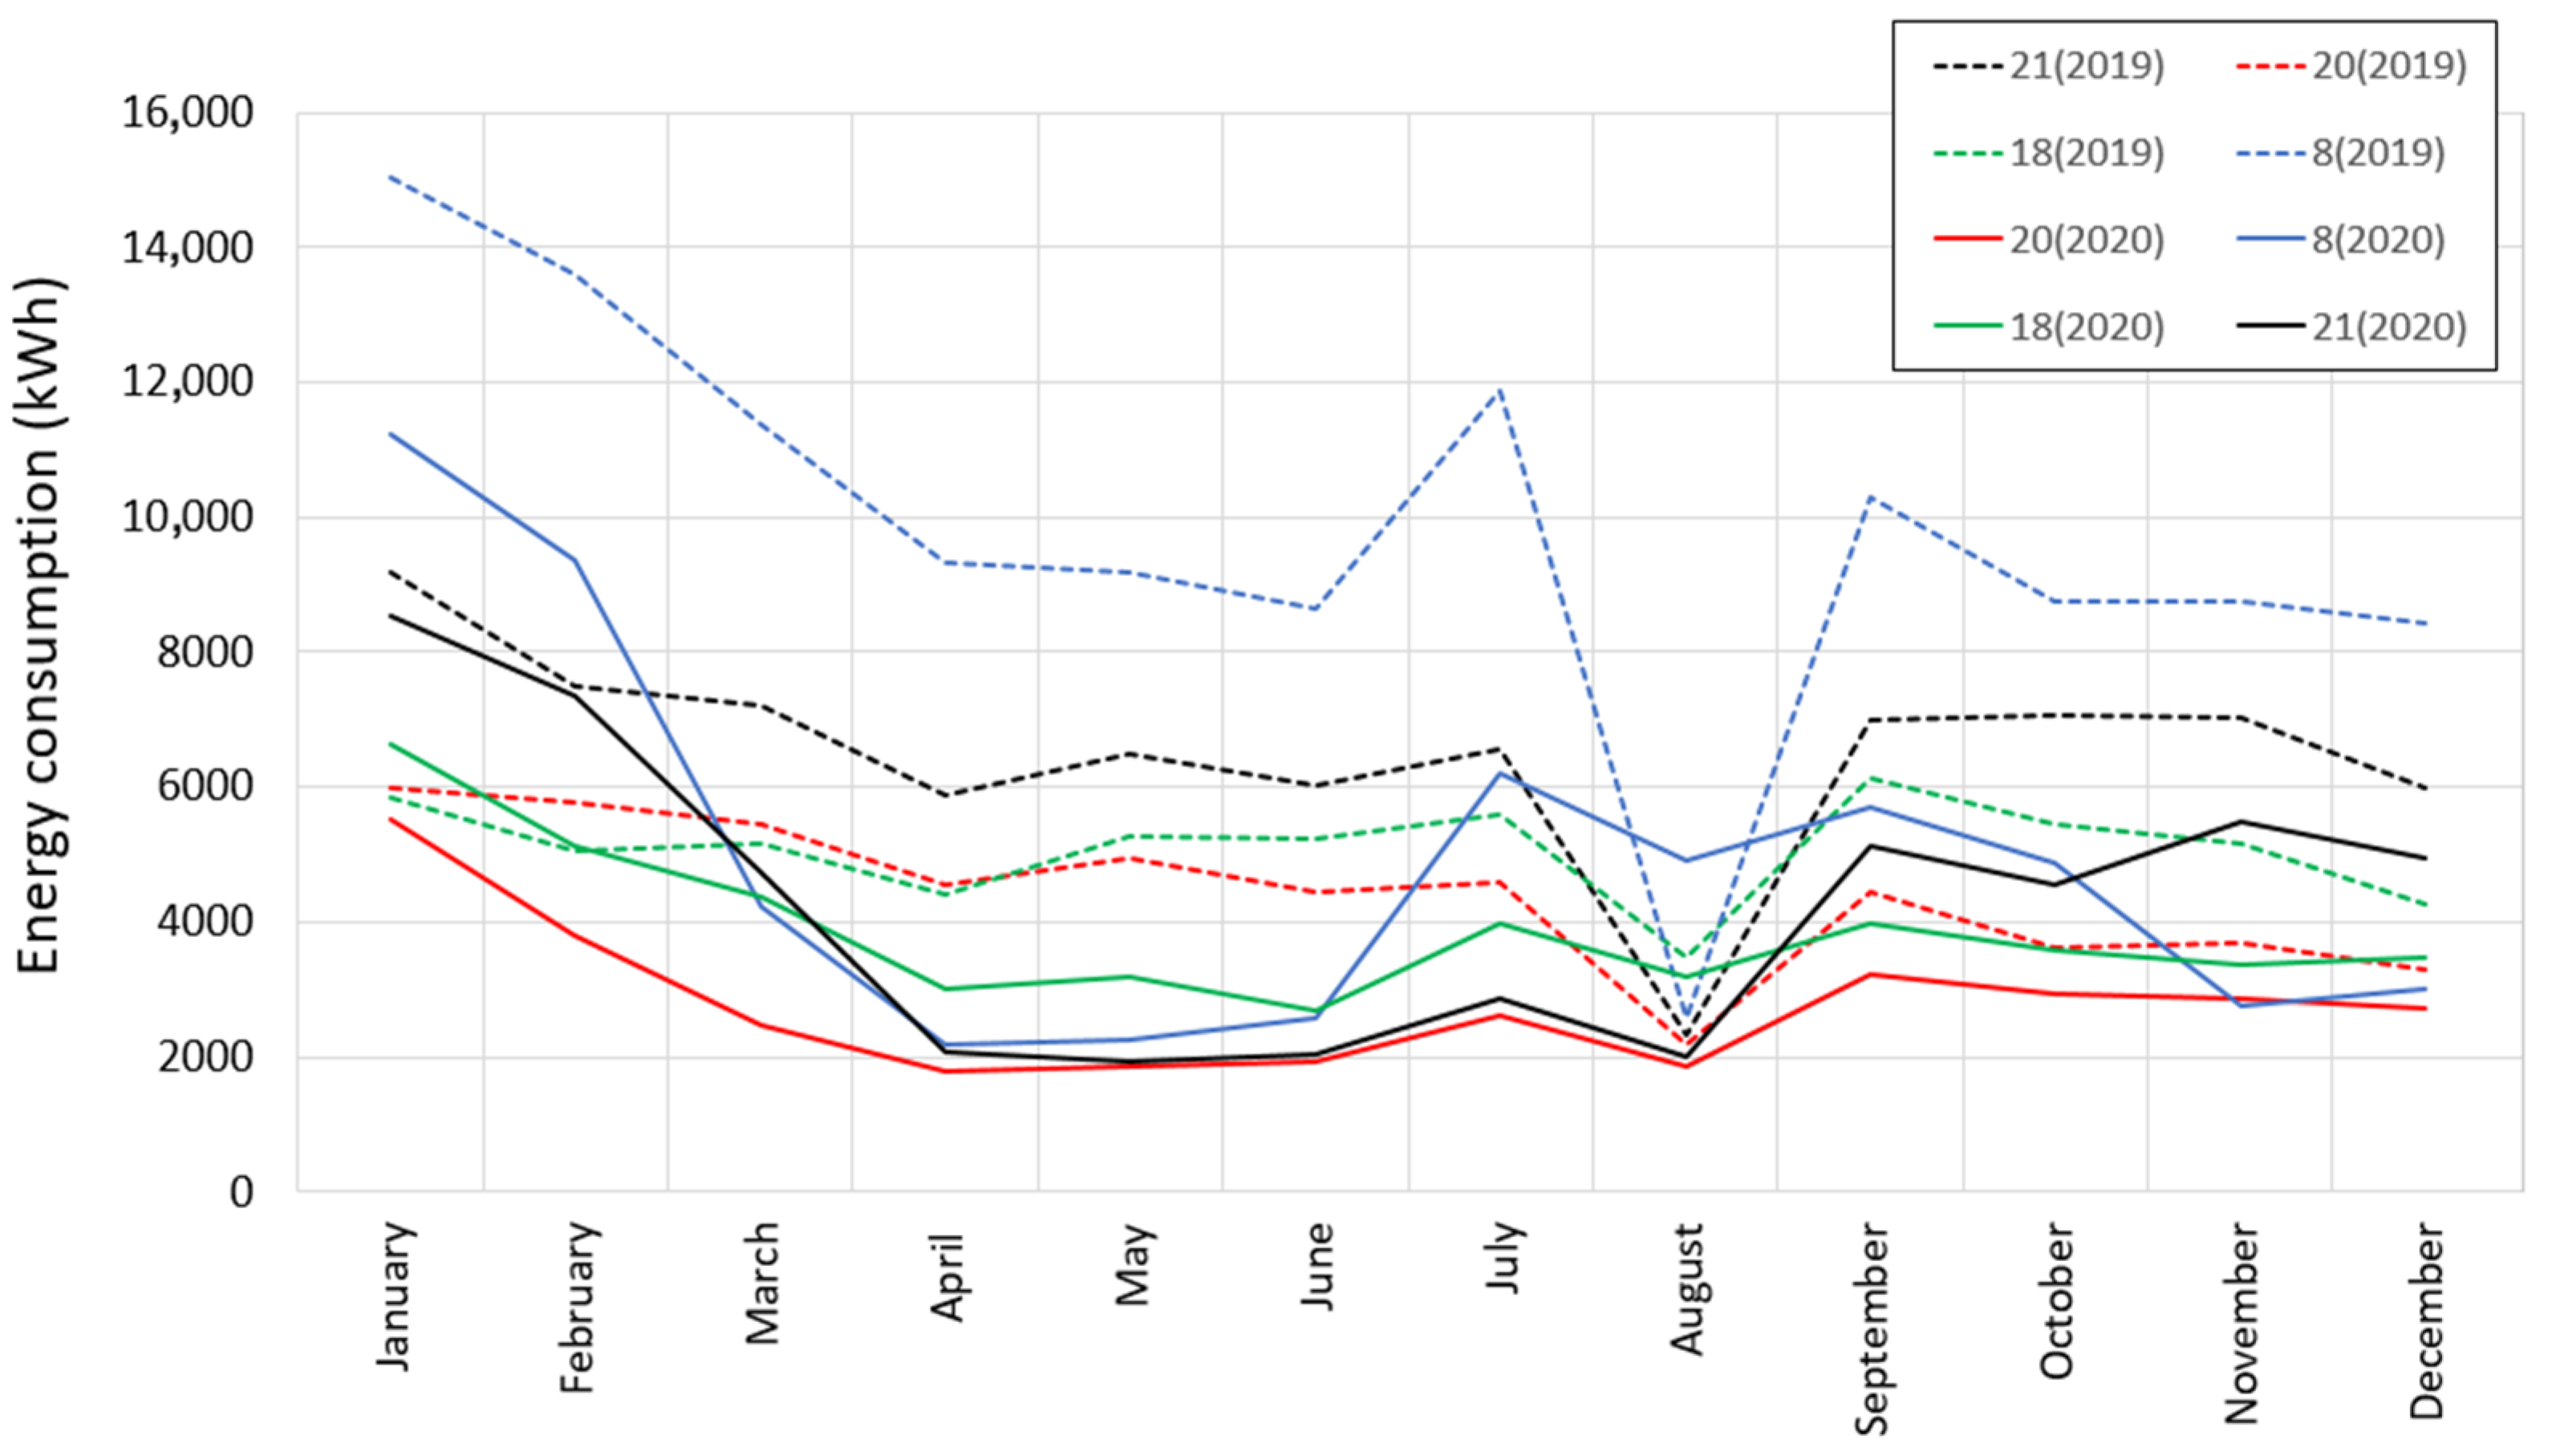
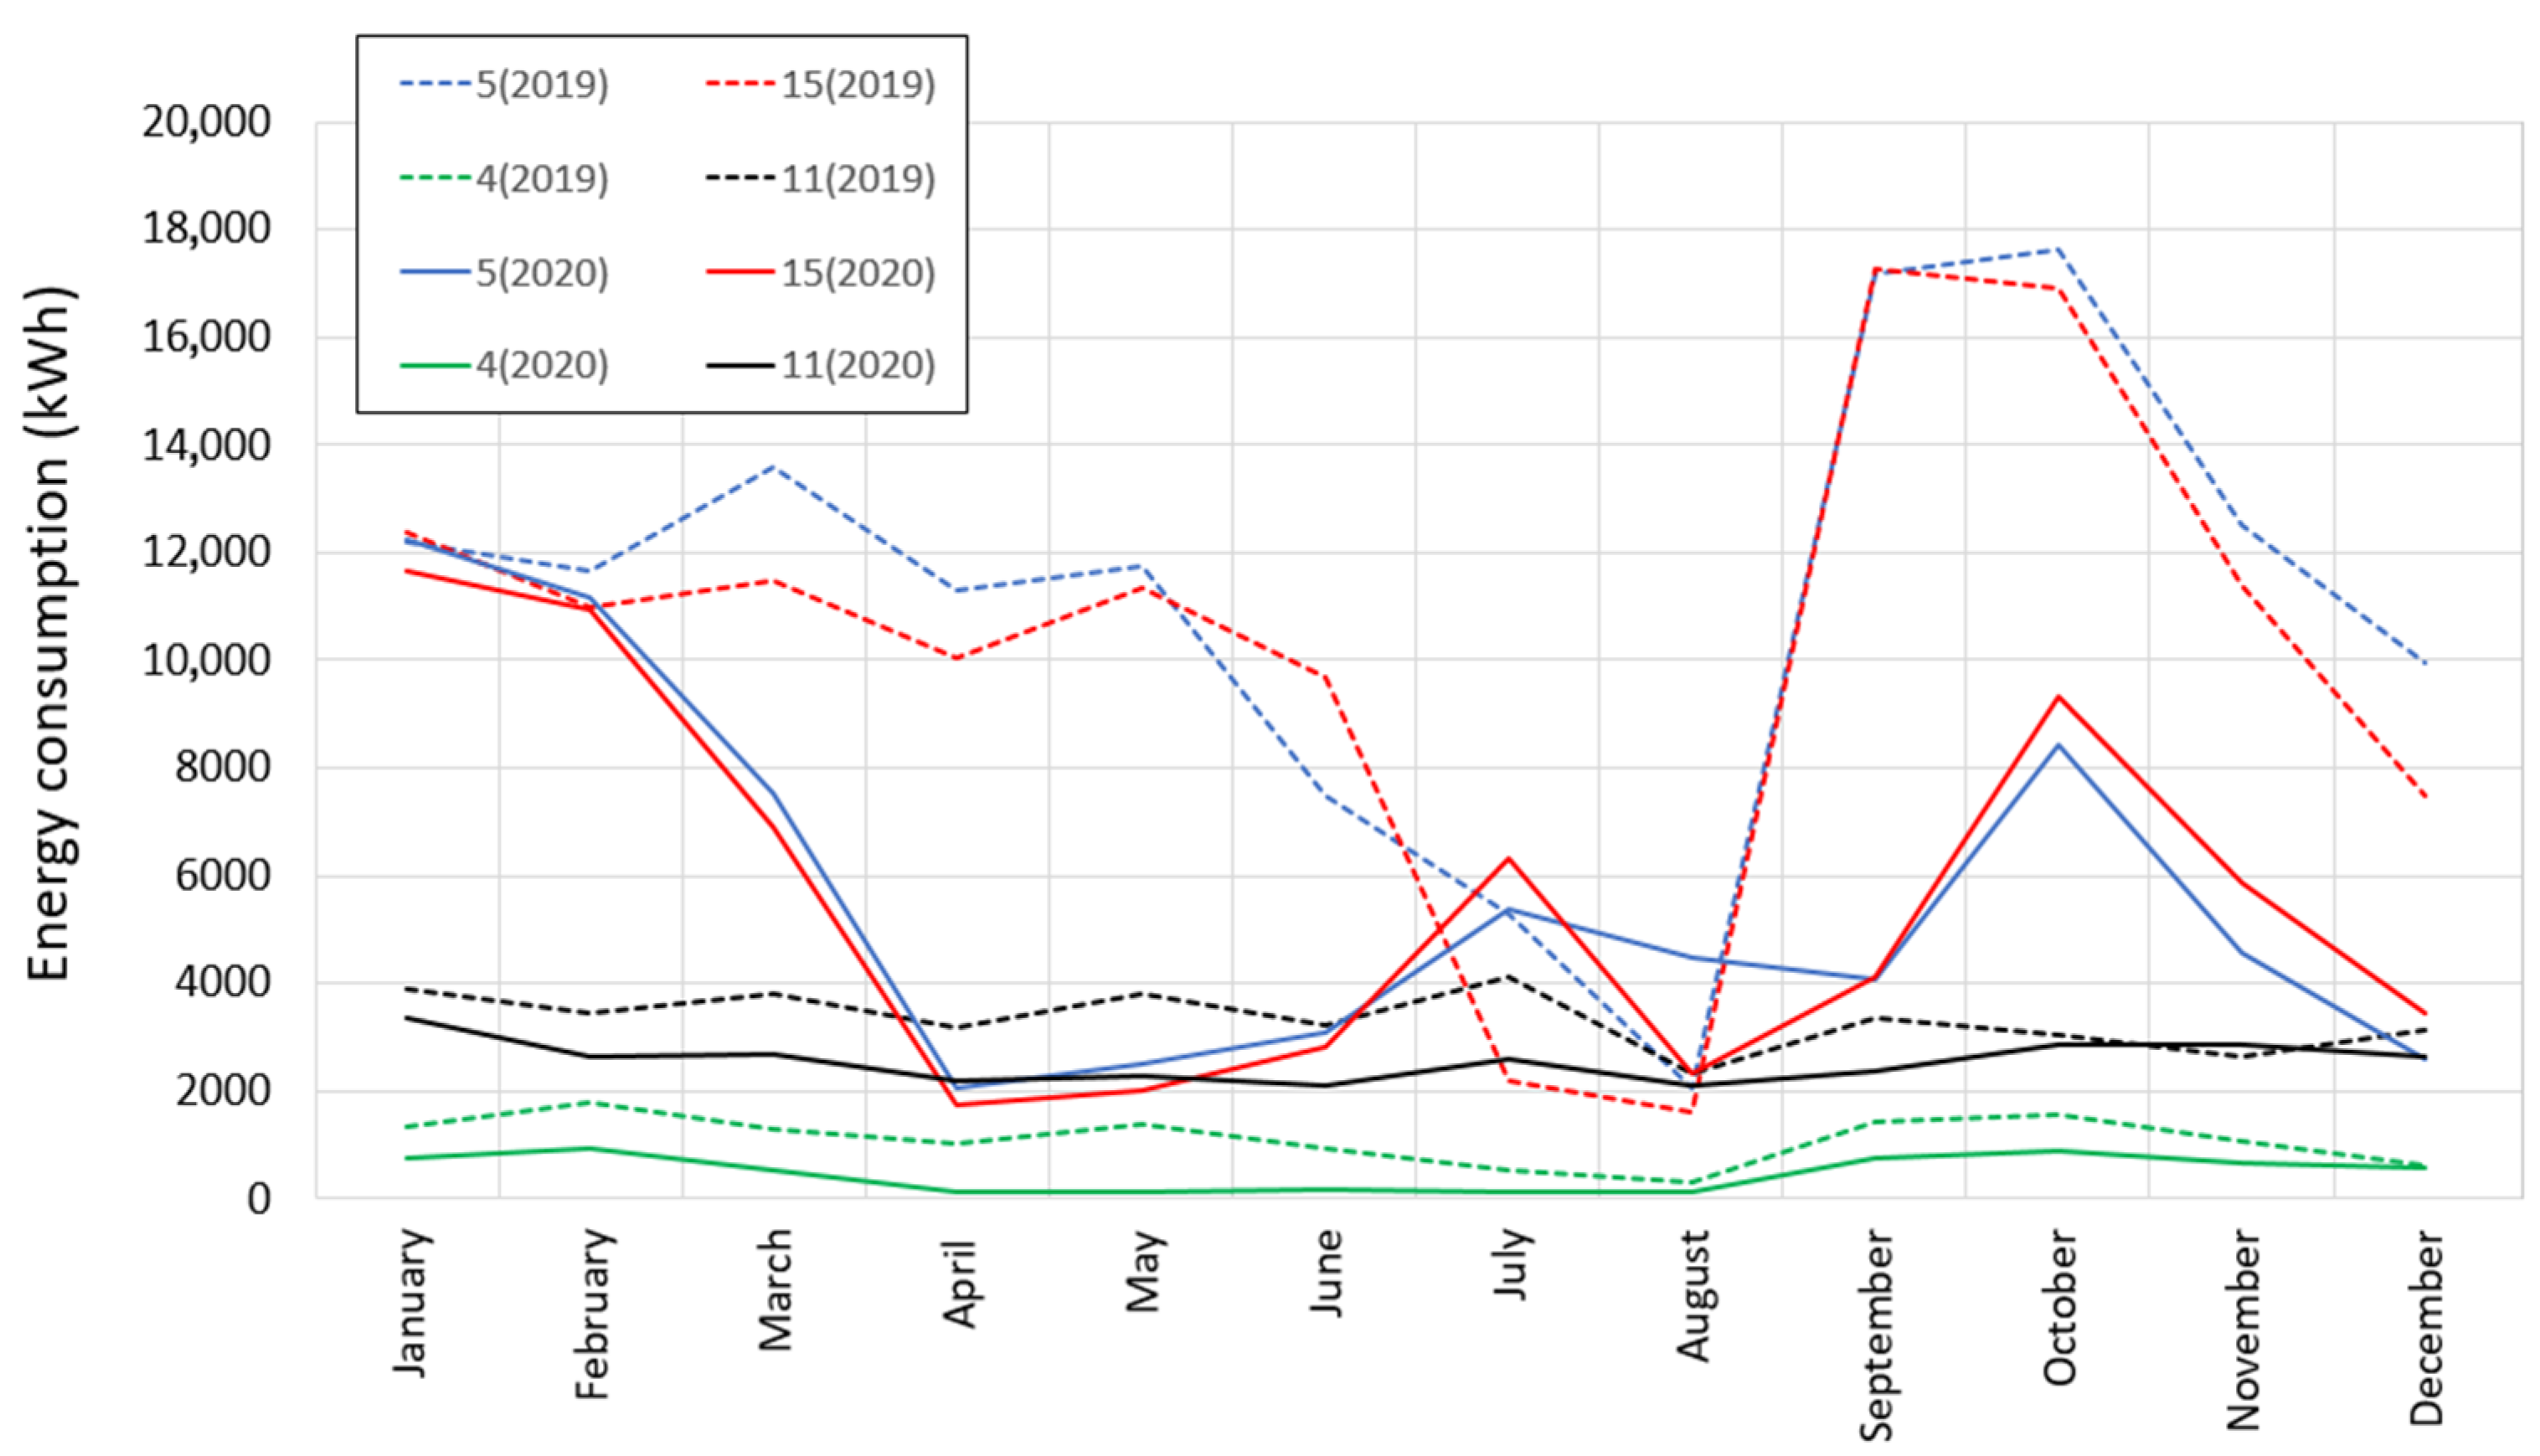
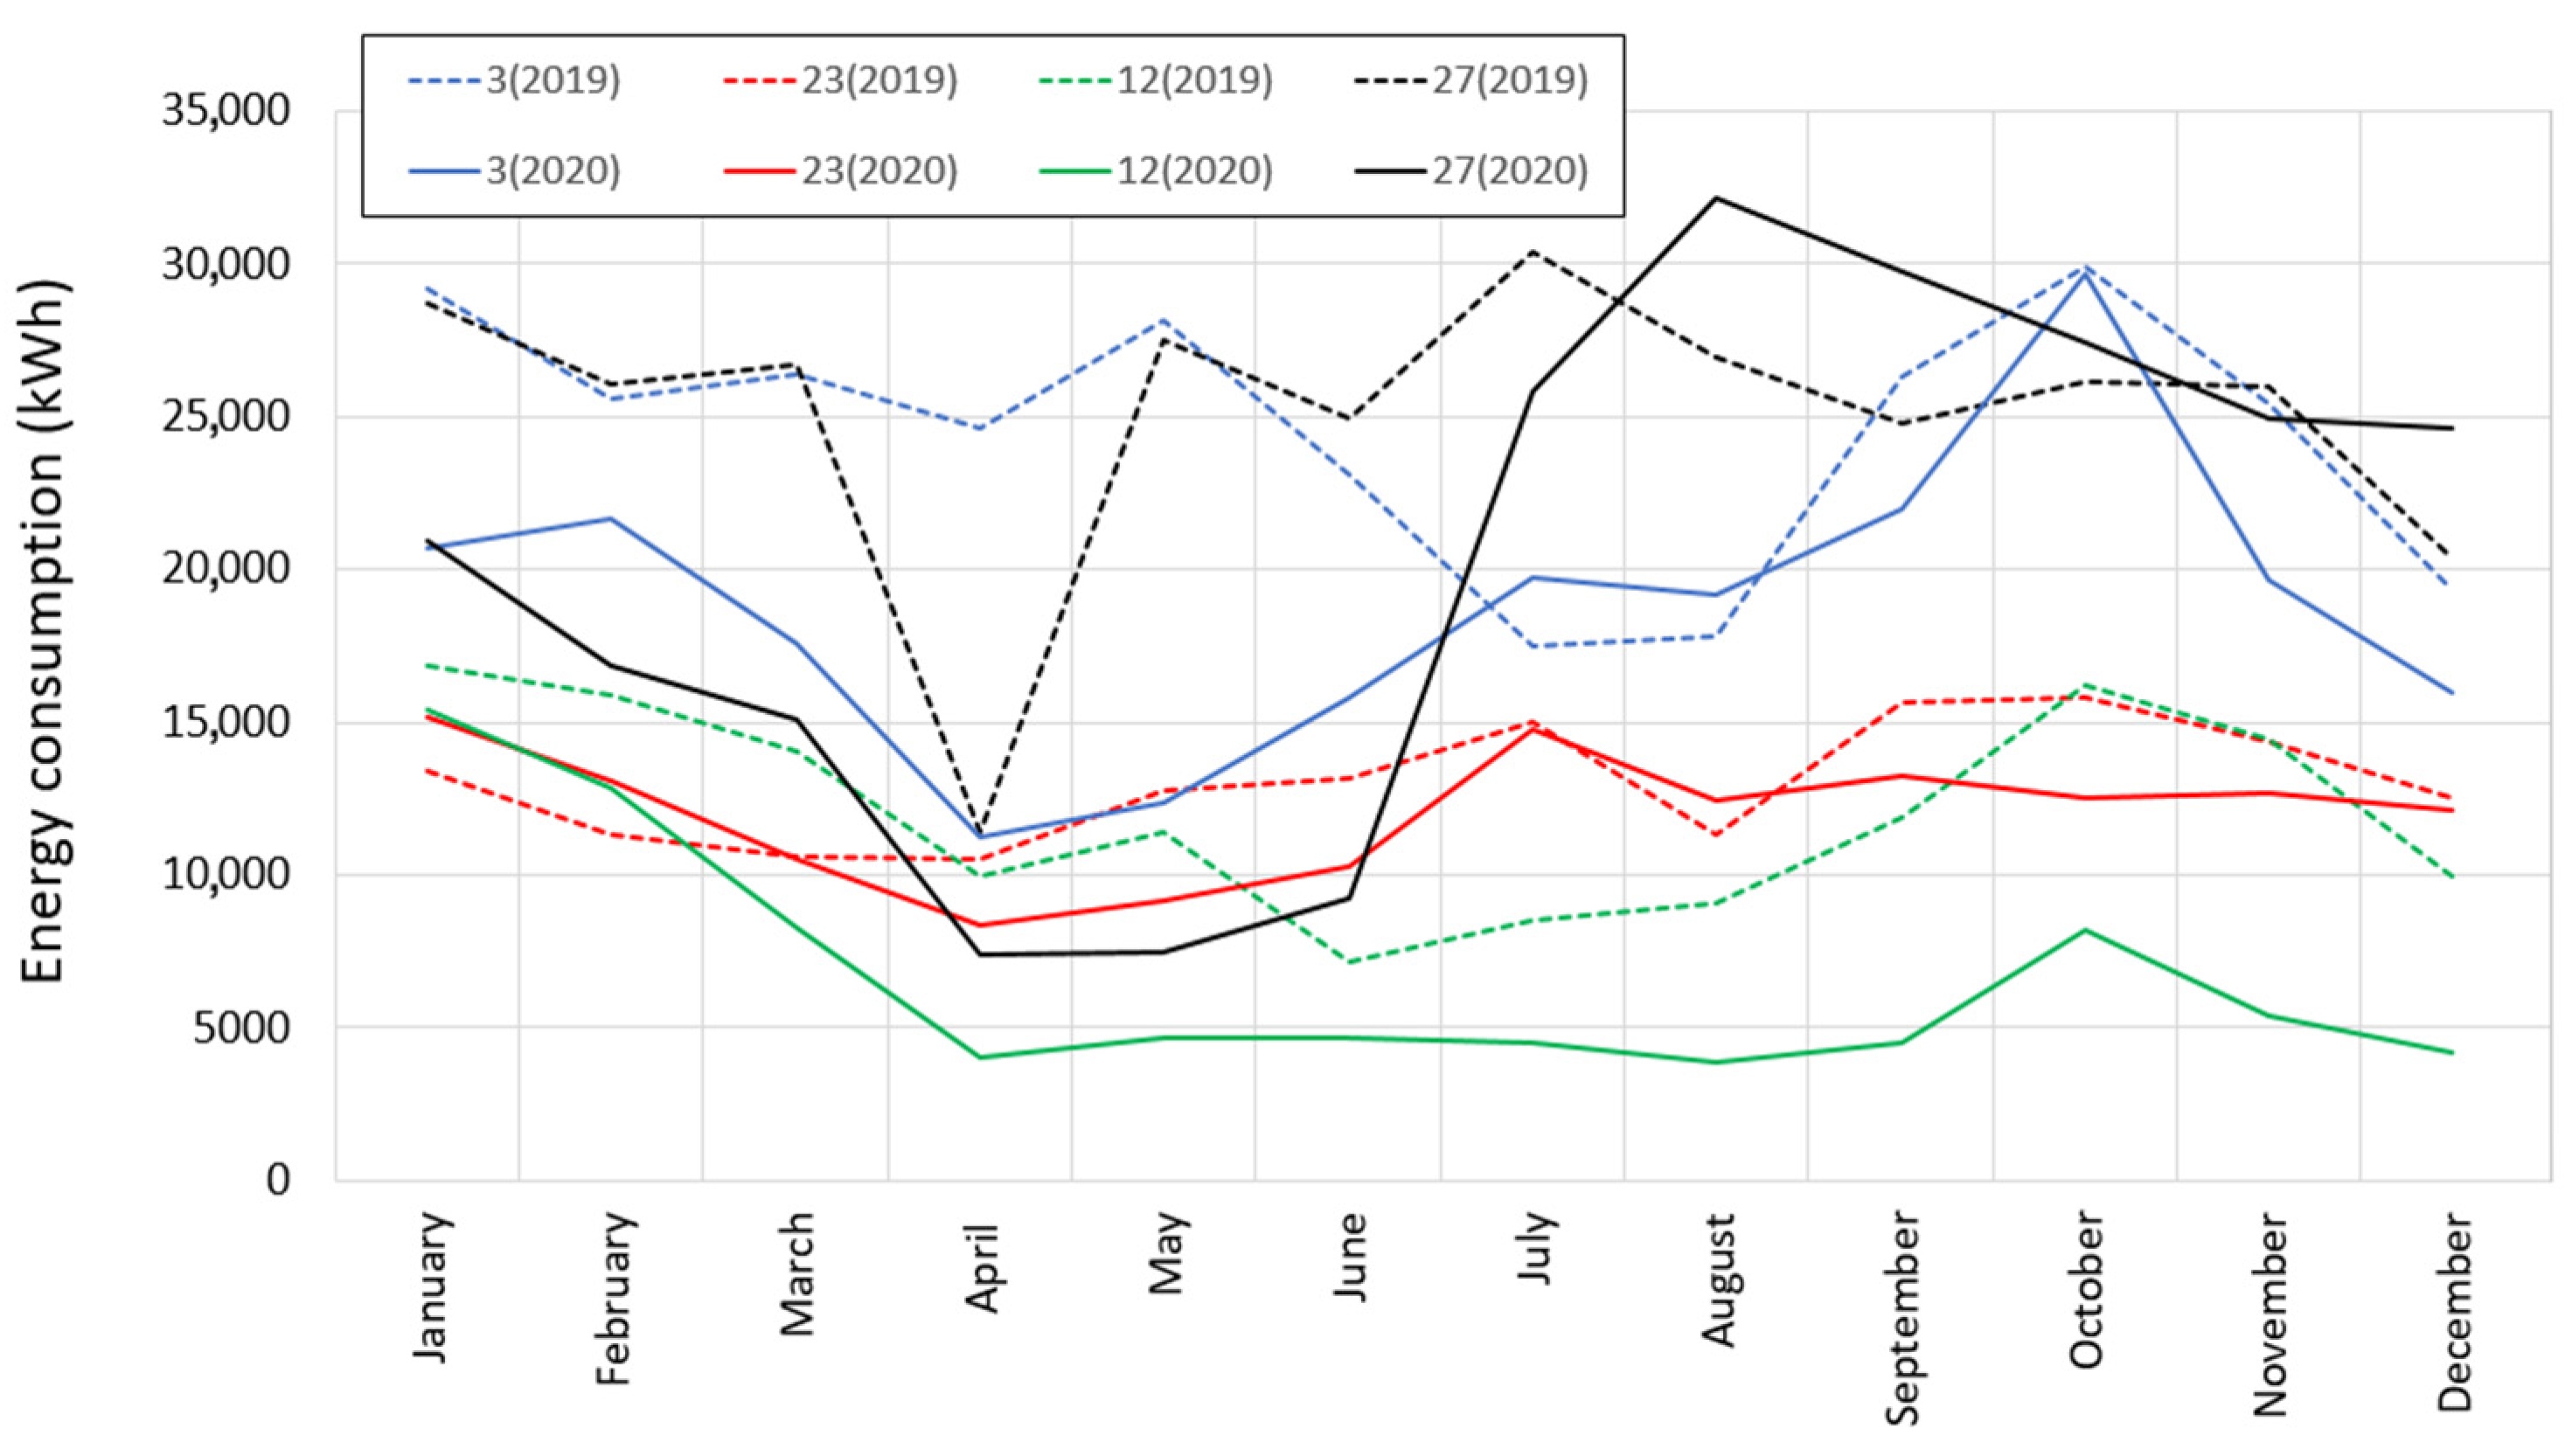
Figure 12 and
Figure 13 illustrate the monthly energy consumption patterns of teaching facilities during 2020: the first one shows that buildings (5) and (15) had almost the same behavior during the year of the pandemic, and we can also clearly notice the correlation with the lockdown measures and the electricity consumption. During April, the energy consumption of the two buildings plummeted to levels of 17% and 15%, respectively. Compared with the level of the first month of January, buildings (5) and (15) began to steadily rise in June and July when few facilities were reopened as measures started to ease after the first wave of the pandemic. Then they decreased in August; however, they started to surge once again to reach a peak in October before they started to decline once again in November as the second wave hit the country. Building (4) energy consumption has declined by levels around 83% from January to April, and it wasn’t until September when it slightly went up to get close to the levels of pre-confinement. This facility’s overall electricity consumption declined by 57%, it was the most influenced building in this category during 2020.
Building (23) declined its consumption by 45% during the first confinement (January to April), slightly increased in May, then started to rise once again to peak in July, and remained relatively constant after September as its locals showed few practice activities with a limited number of researchers and students. Building (3) had a similar pattern evolution as (15) and (5), except for the difference in the October peak level, in which, in the case of building (3), the level surpassed the EC levels of the pre-confinement period. This rose the question of how a facility could consume more energy when its occupancy rate is lower than 50%.
Table 5 illustrates the relative standard deviation of the monthly energy consumption that varied within the range of 11% and 58% for every building in the teaching category. This indicator was higher in 2020 for most cases of this category, and that means that the majority of the buildings showed larger fluctuations of EC on a monthly basis in 2020. Data showed that buildings (5), (15), and (4) had major fluctuations by an indicator of 49%, 51%, and 58%, respectively. These buildings also had a major decrease on an annual basis (see
Table 3). Buildings (3), (23), and (11) experienced minor fluctuations by an indicator of 19%, 14%, and 11%, respectively. These facilities also recorded closer EC values to the previous year, and that made them the least affected by the outbreak, and their share fell respectively by an annual margin of 13%, 8%, and 13%.
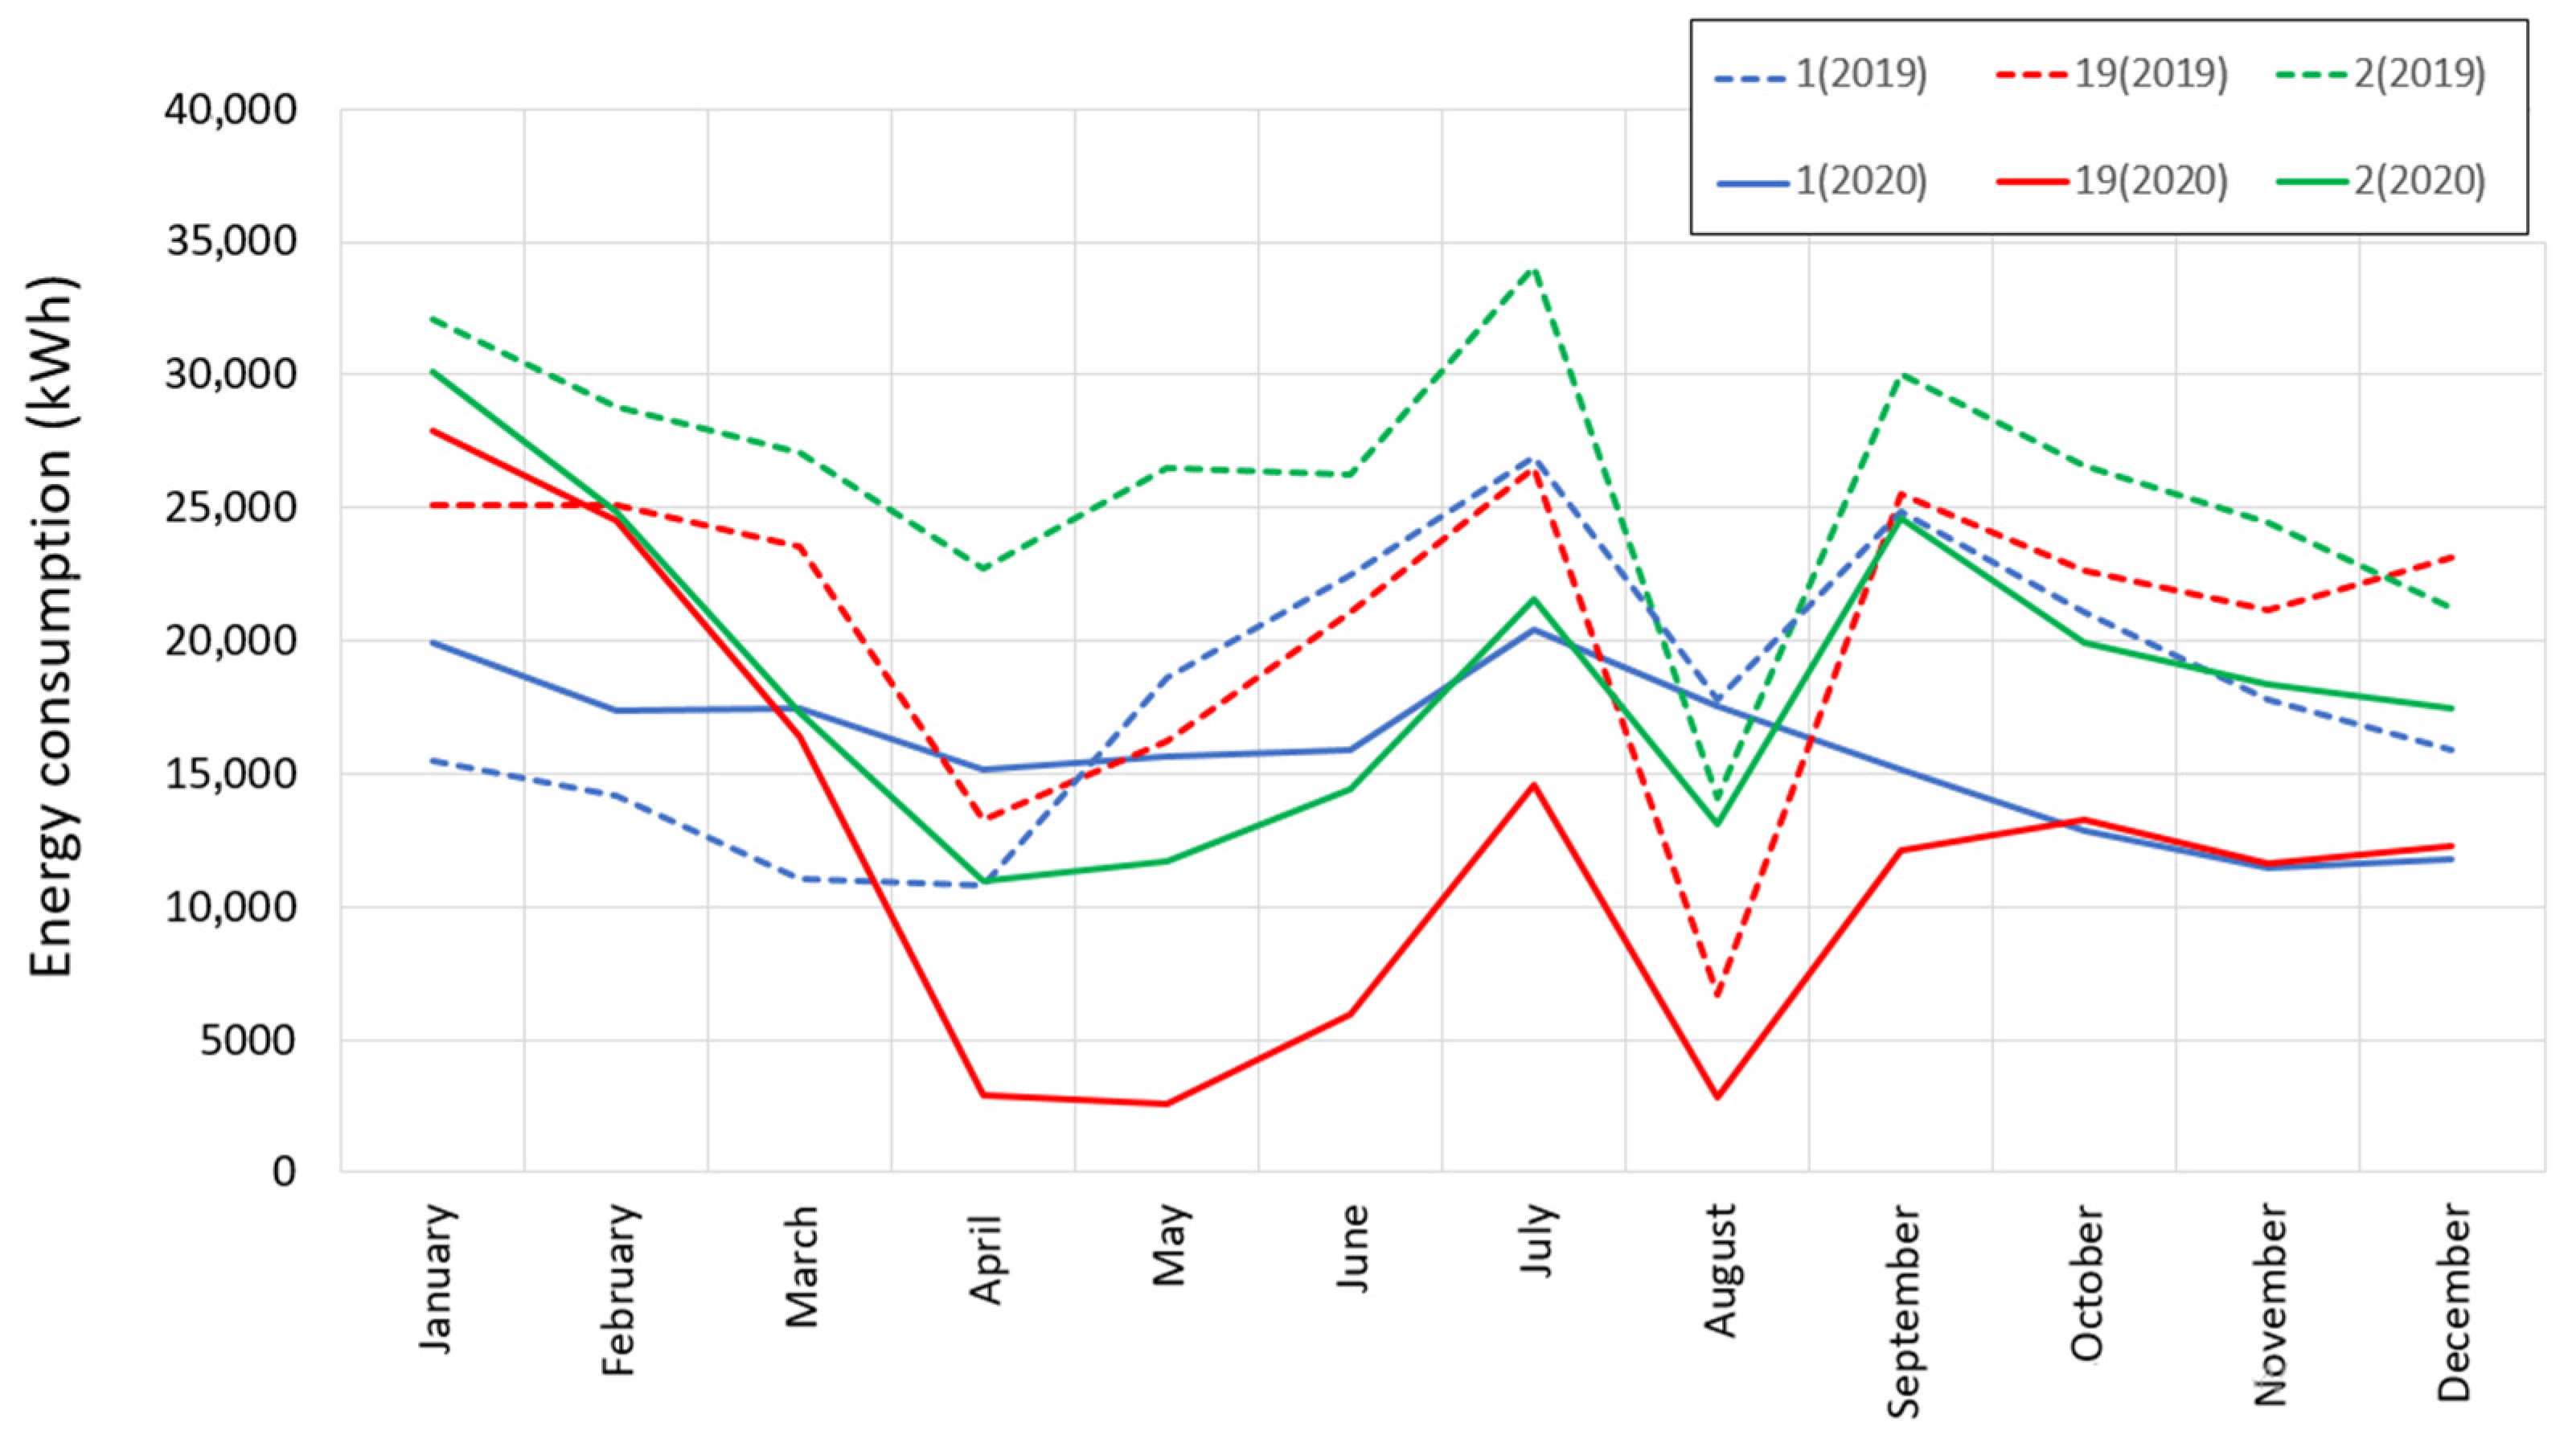
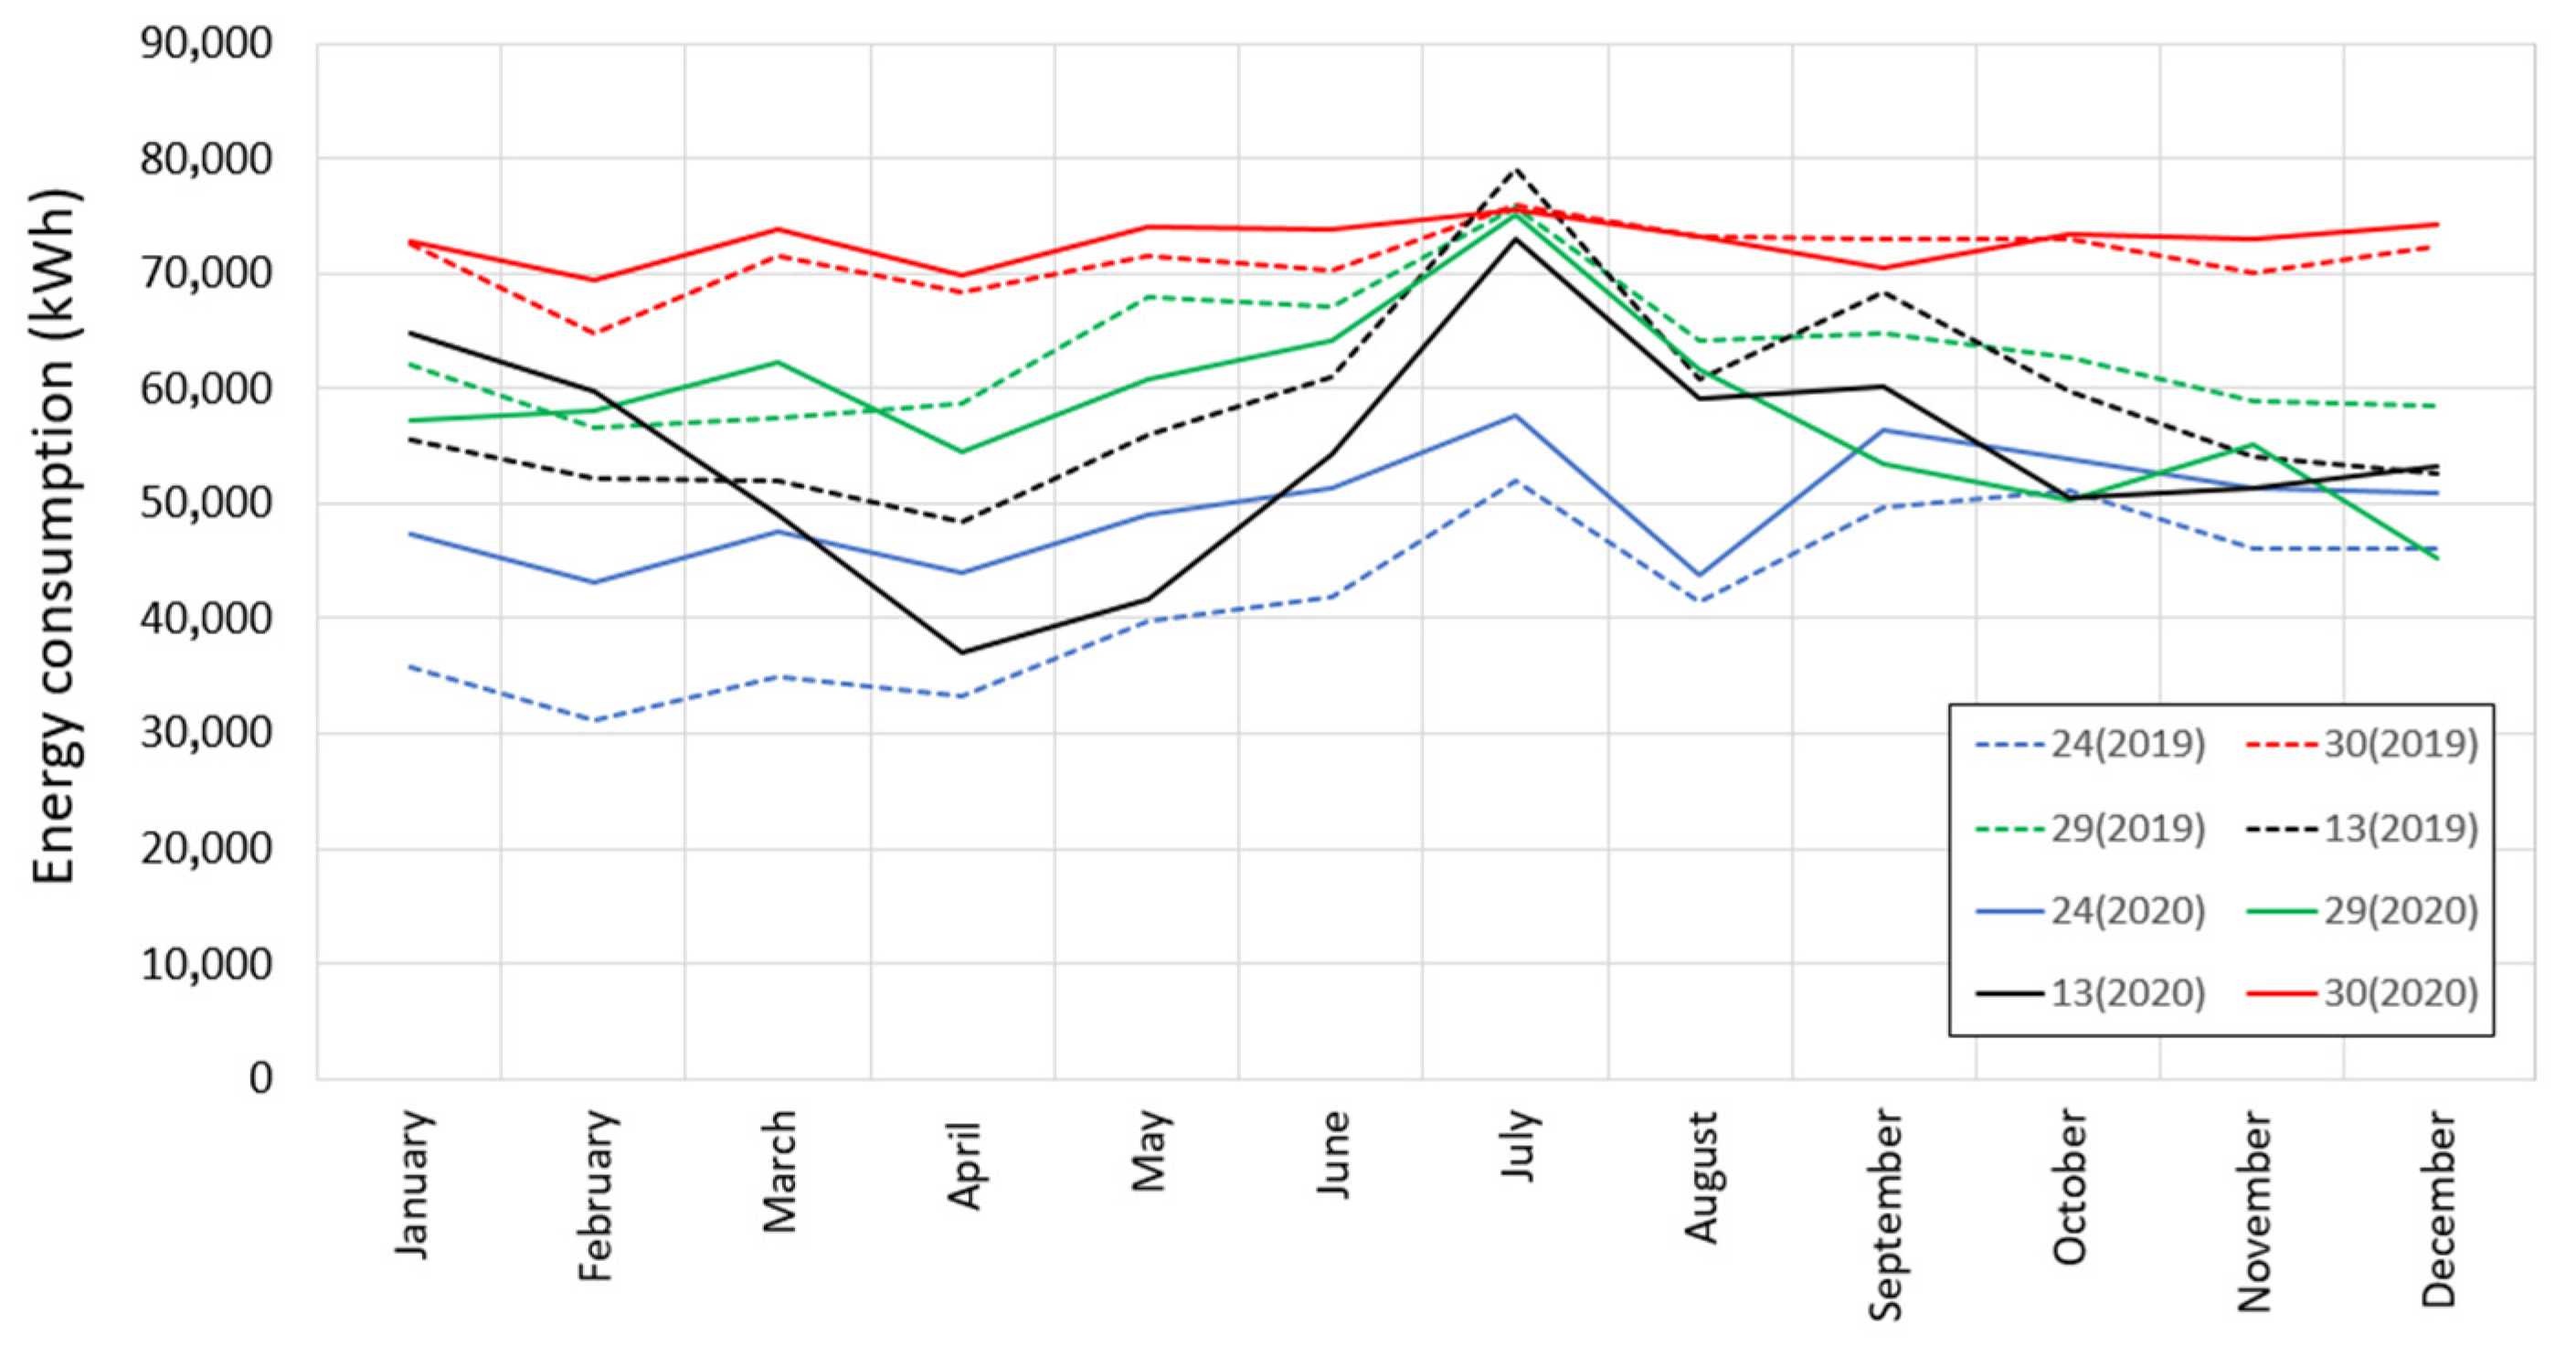
Figure 14 and
Figure 15 illustrate the monthly energy consumption patterns of research buildings in the research and laboratory category only fell by 2% in 2020; however, some of the buildings were affected by closing the campus during the outbreak period, and others were not. Building (13), which had a higher consumption than buildings (29) and (24) during January, fell in March and April to record a lower value than both buildings. Moreover, five out of eight buildings dropped and reached their minimum value during April, which was the following month of the lockdown. However, all the buildings seem to have their maximum value in July, except for building (9), and all of these peaks happened to be during a period of a very limited occupancy rate. The data showed (see
Table 3) that the research and laboratory category was the least affected by the pandemic situation in 2020; the two buildings (30) and (24) even consumed more electricity than the previous year. Furthermore, those two facilities had the lowest fluctuations among the research category; their gap ratios between the maximum and the minimum consumption on a monthly basis were 9% and 25% during 2020, respectively, showing that, unlike most facilities, they kept a high and steady level of their EC. The electricity consumption of buildings (13) and (28) dropped from January to April by 43% and 53%, respectively. However, buildings (9) and (31) were most affected by the lockdown in this category, and their consumption on an annual basis fell by 10% and 11%between 2019 and 2020, respectively (see
Table 3).
According to the deviation indicators developed in
Table 6, research facilities had relatively low fluctuations that varied from 2% to 32%. Even though this category was different from others in terms of structural components and energy performance, the majority of buildings exhibited higher fluctuations in 2020 than in the previous year. The three buildings (16), (30), and (24) had a steadier pattern in 2020 than in 2019, according to their relative standard deviation, and, unlike other facilities, two of these three buildings increased their EC share in the year of the pandemic (see
Table 3). The patterns of buildings (9) and (31) had the largest fluctuations in 2020, and they were the only buildings in the category that almost doubled their deviation indicators.
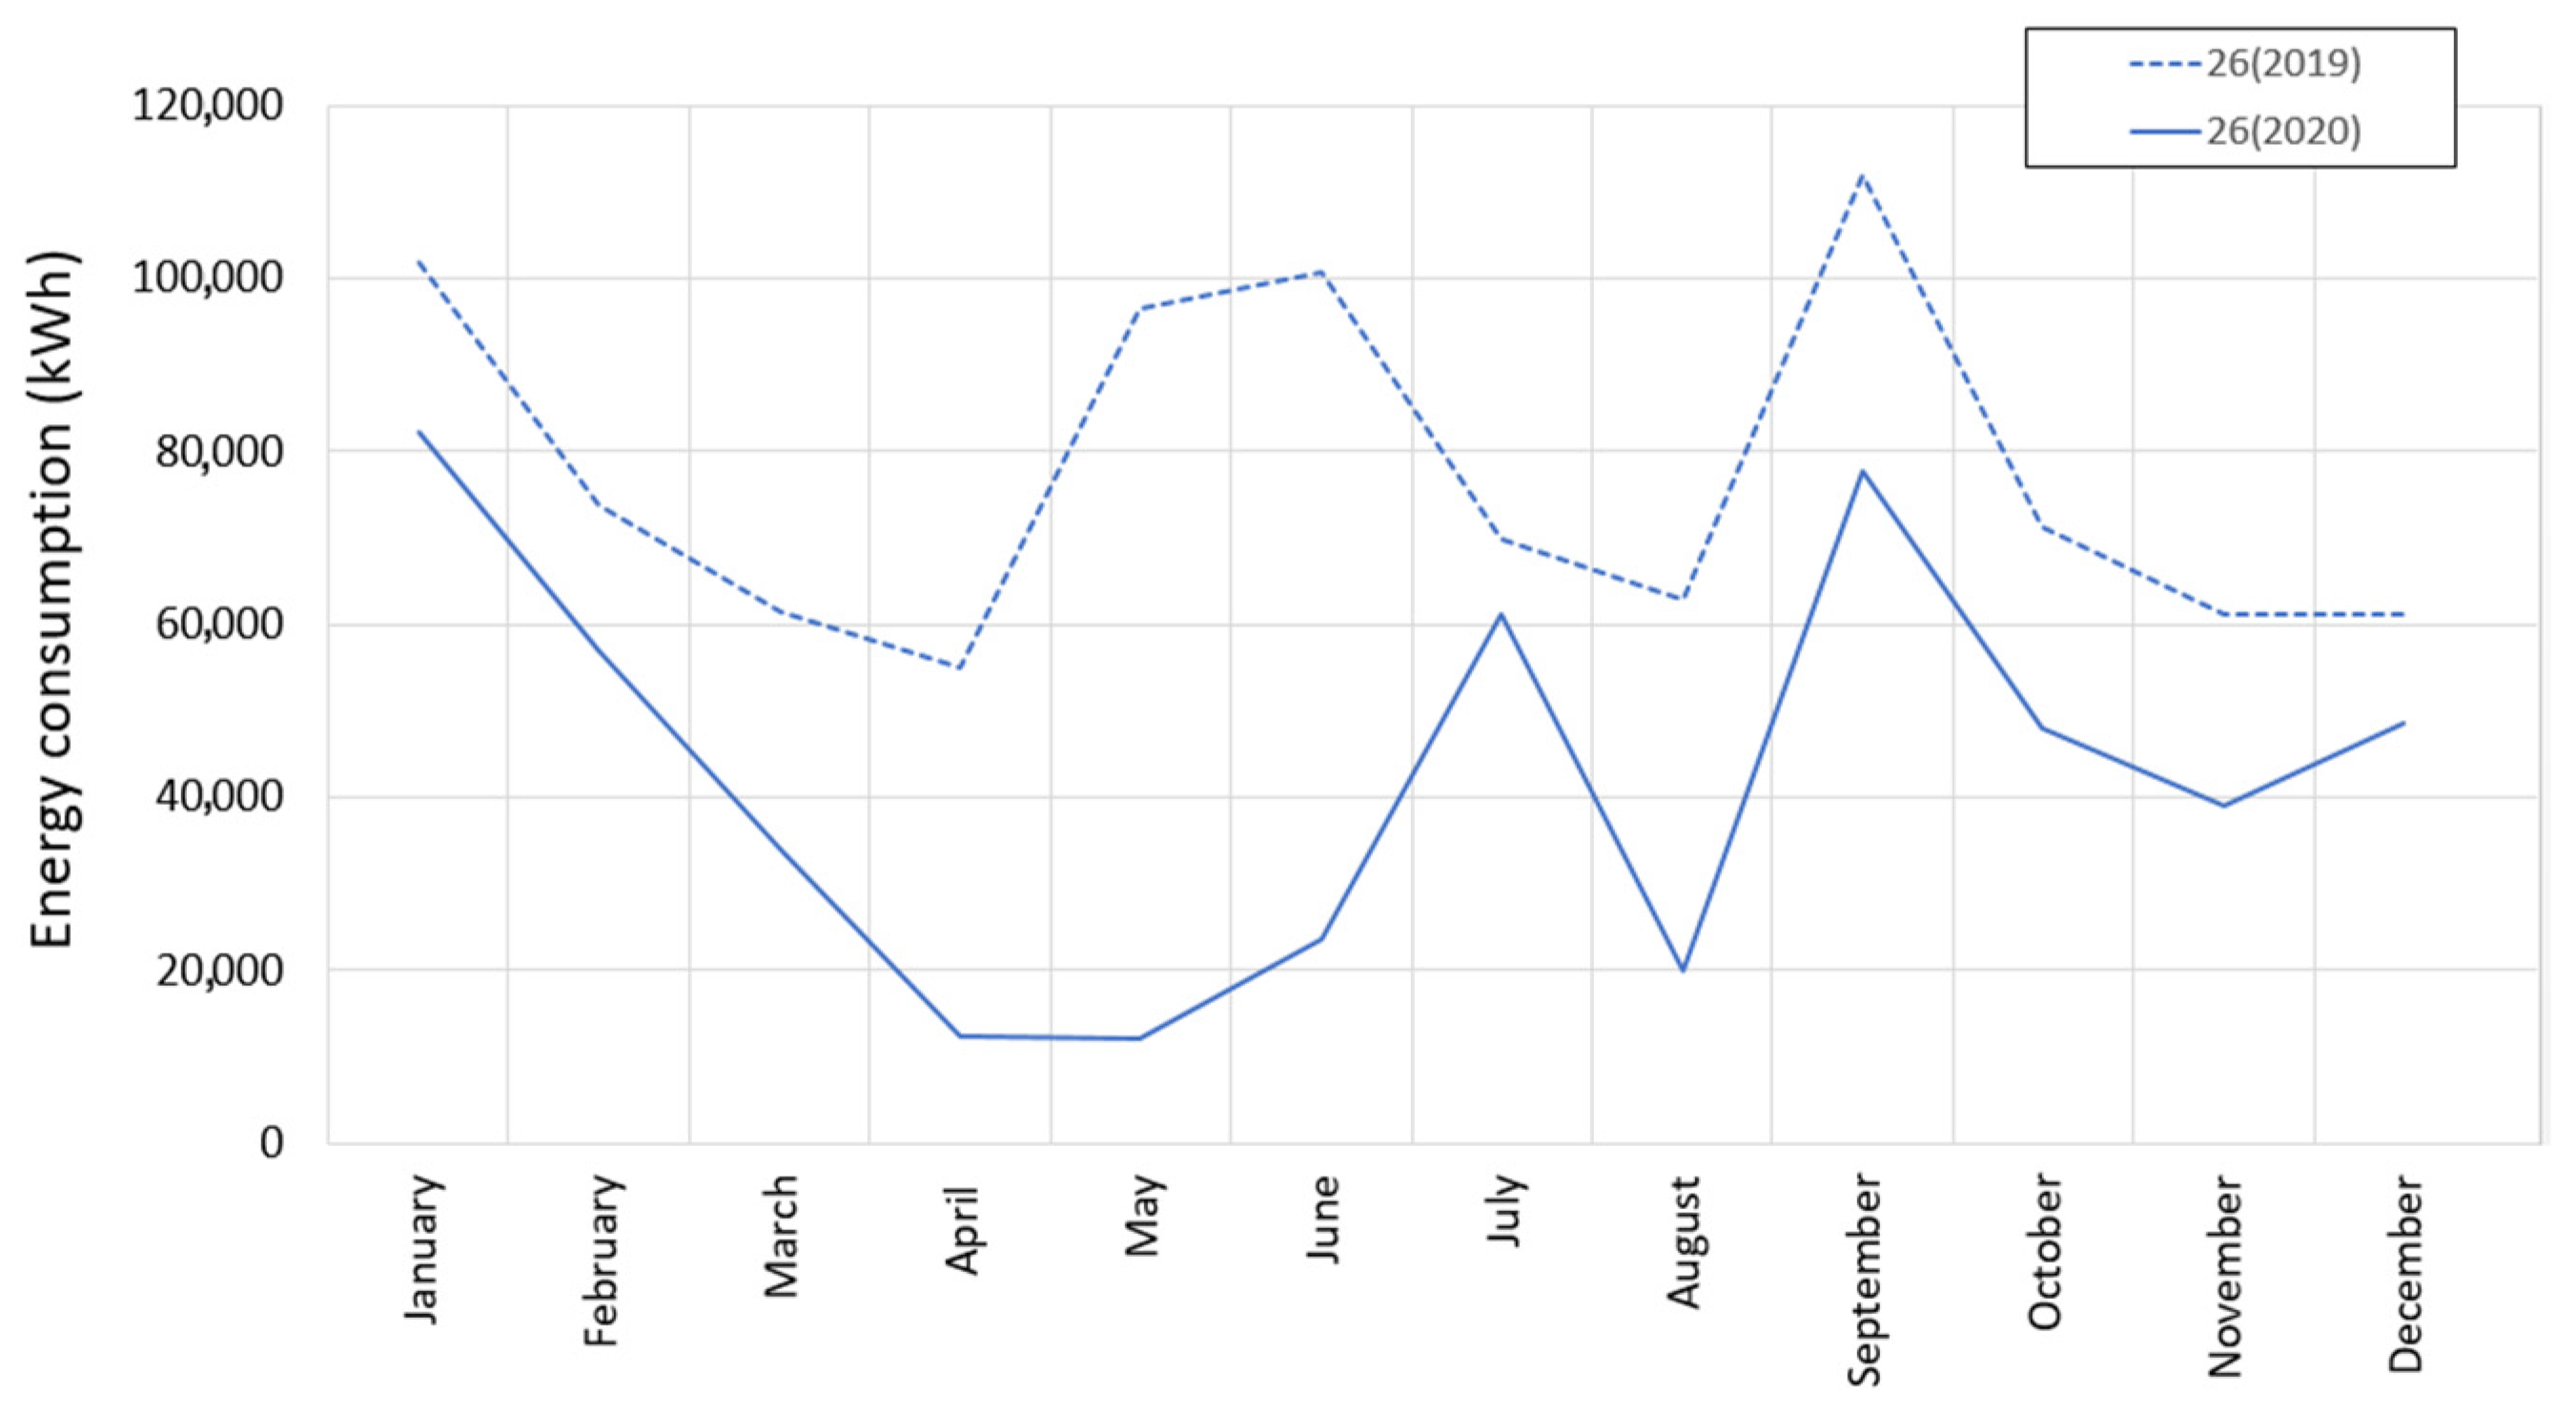
As
Figure 16 showcases, building (26) showed large fluctuations in 2020. Moreover, during the period of January–April of 2020, library facilities fell by 85% and then increased in June and July to reach the first spike of 74% from the post-outbreak era of the level. Then its consumption dropped significantly during the summer break in August to get back in September to reach a second spike of 95%, which was the closest level to the pre-outbreak era in 2020.
Table 7 shows that the library doubled its relative standard deviation and that it was among the most influenced buildings during the pandemic year: its pattern exhibited much more fluctuations in 2020 and its EC share on an annual basis declined by 44%.
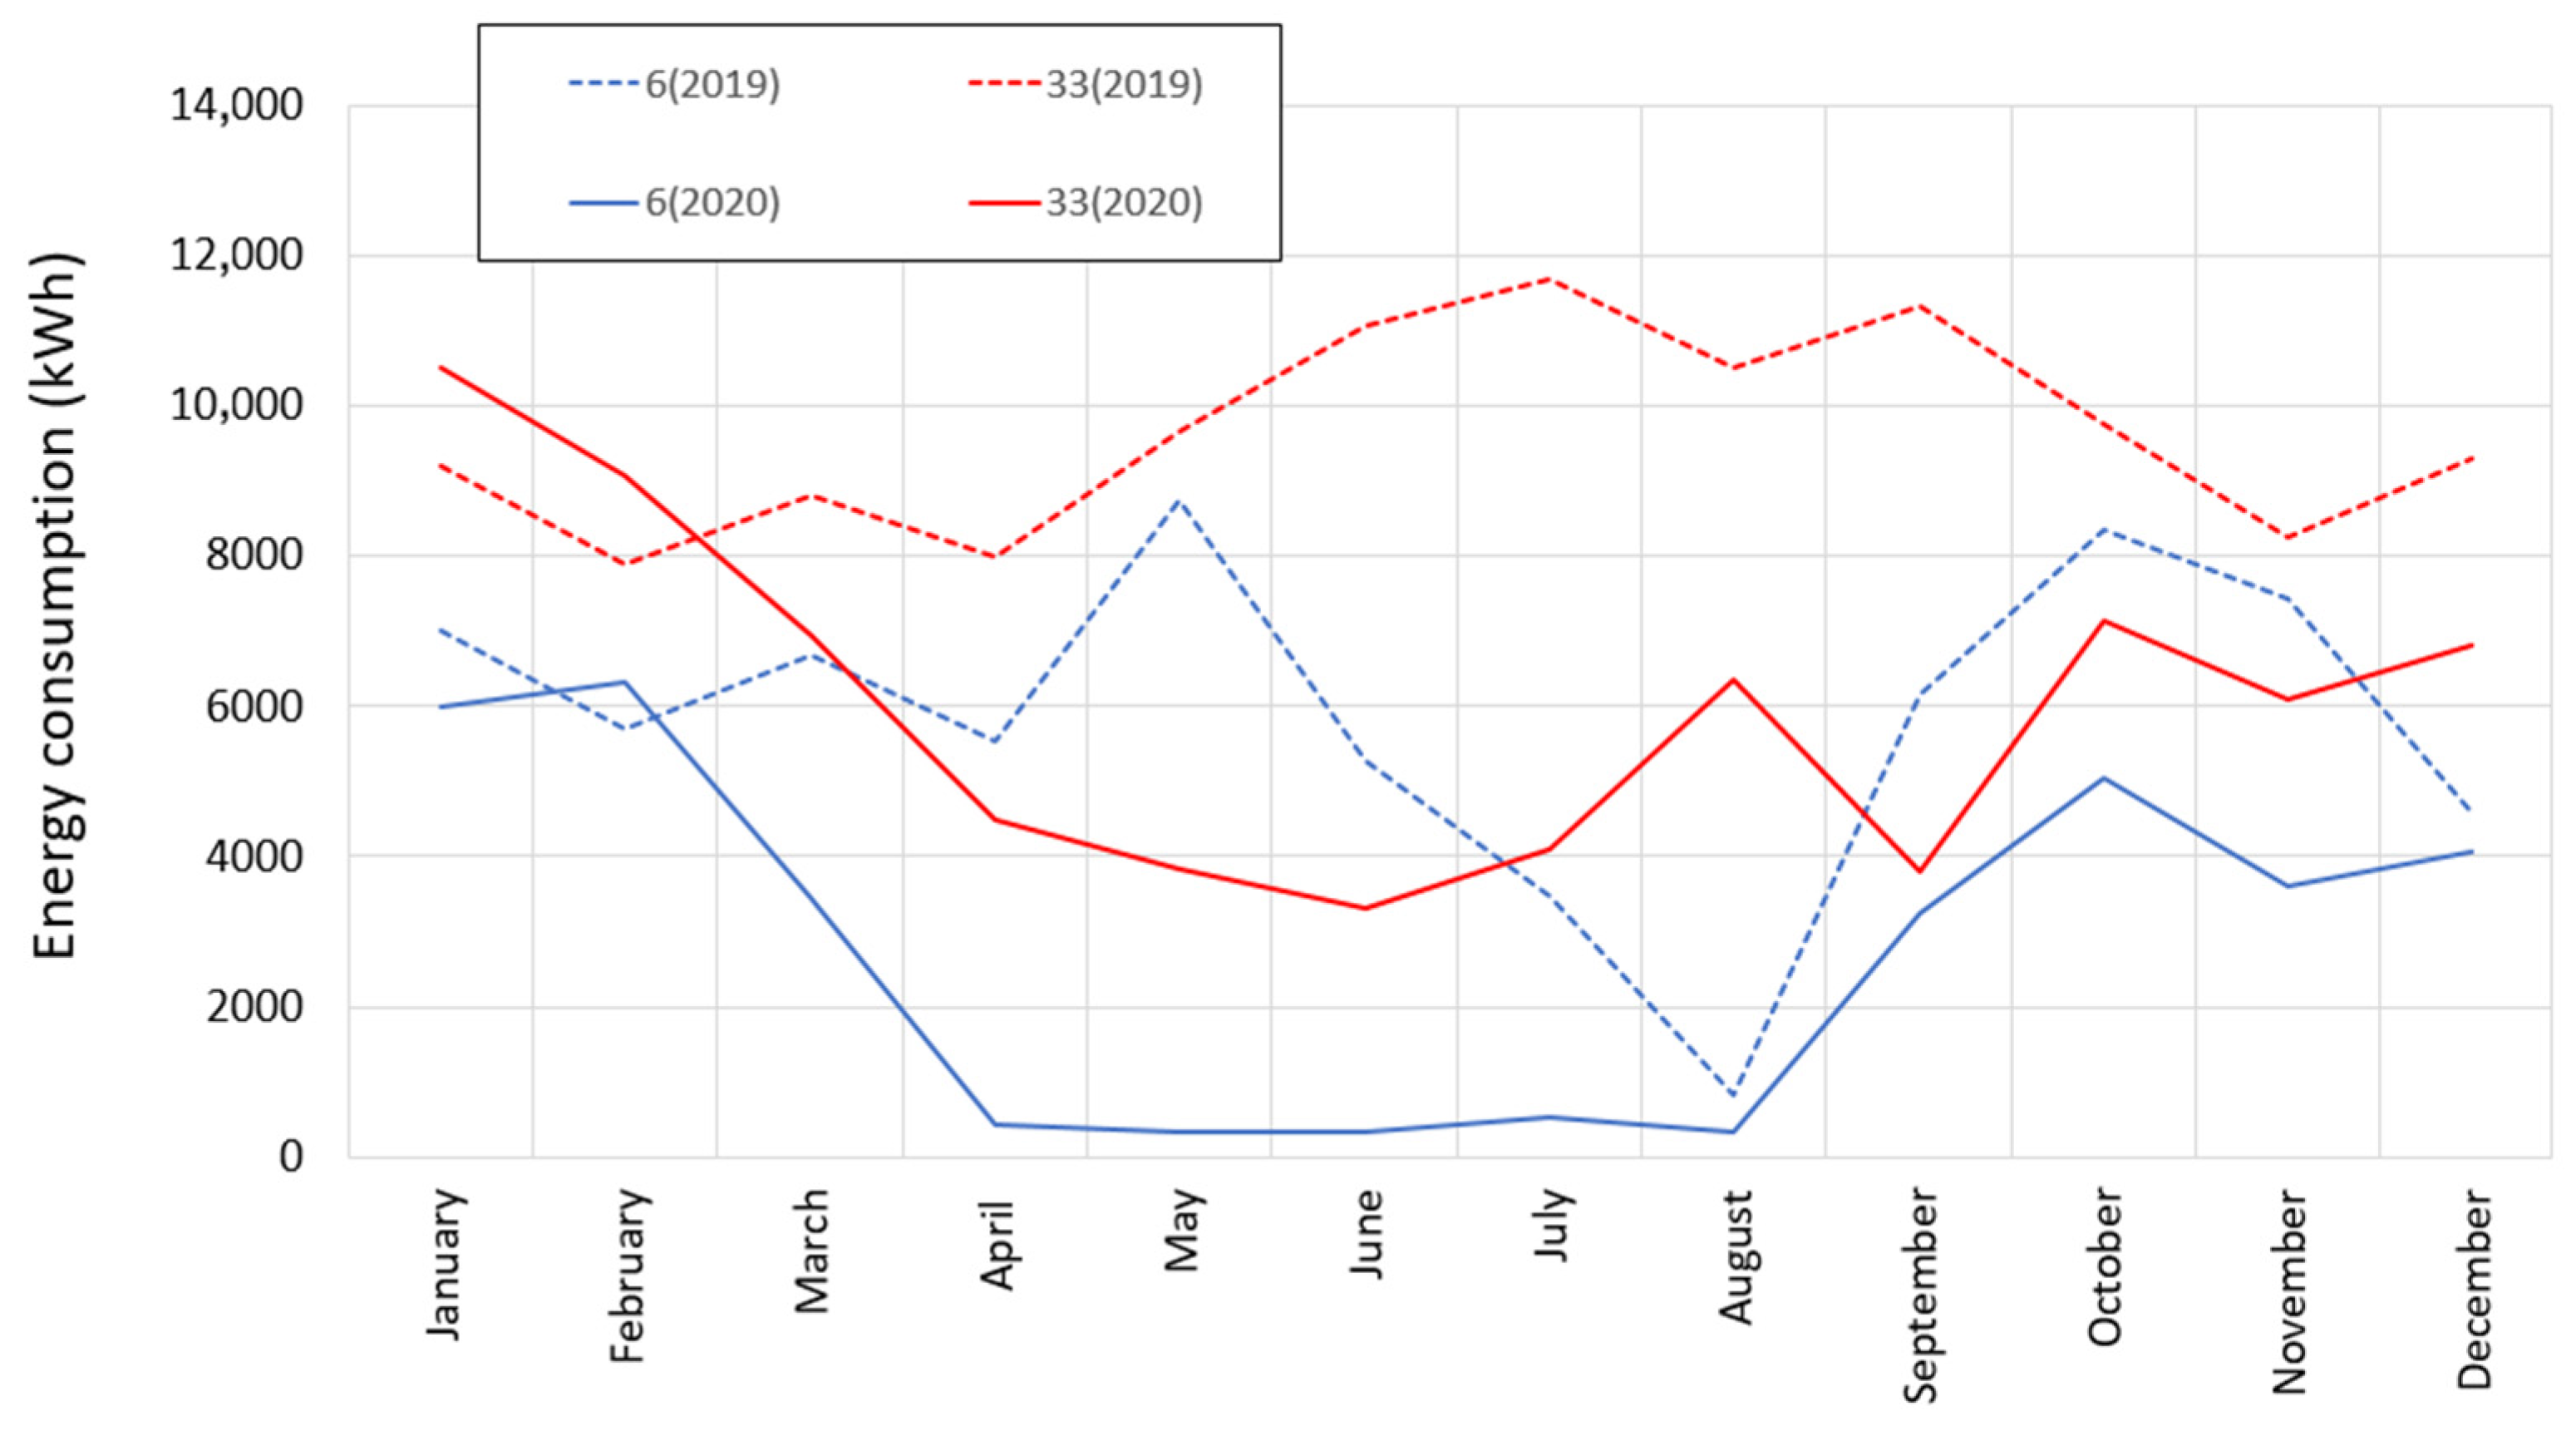
The restaurant category was one of the most affected by the pandemic, and its electricity consumption dropped by 42% (see
Figure 9). As
Figure 17 illustrates, the monthly consumption evolution of both facilities was generally similar. Their EC level fell sharply to unprecedented levels: both buildings (6) and (33) consumed in April 7% and 42% of what they consumed in January, respectively. They kept a low level of EC until August when building (6) experienced a minor spike as the restaurant was gaining back activity, and in the following month of September, they started to raise their EC again due to the start of the new academic year.
Table 8 showcases that they experienced a major increase in their monthly EC fluctuations. Building (33) raised its relative standard deviation from 11% to 29% and building (6) went up from 27% to 72%, which made it the most impacted building by the outbreak in this category. As the data in
Table 3 confirm, building (33) since dropped its EC share by 42% against 37.
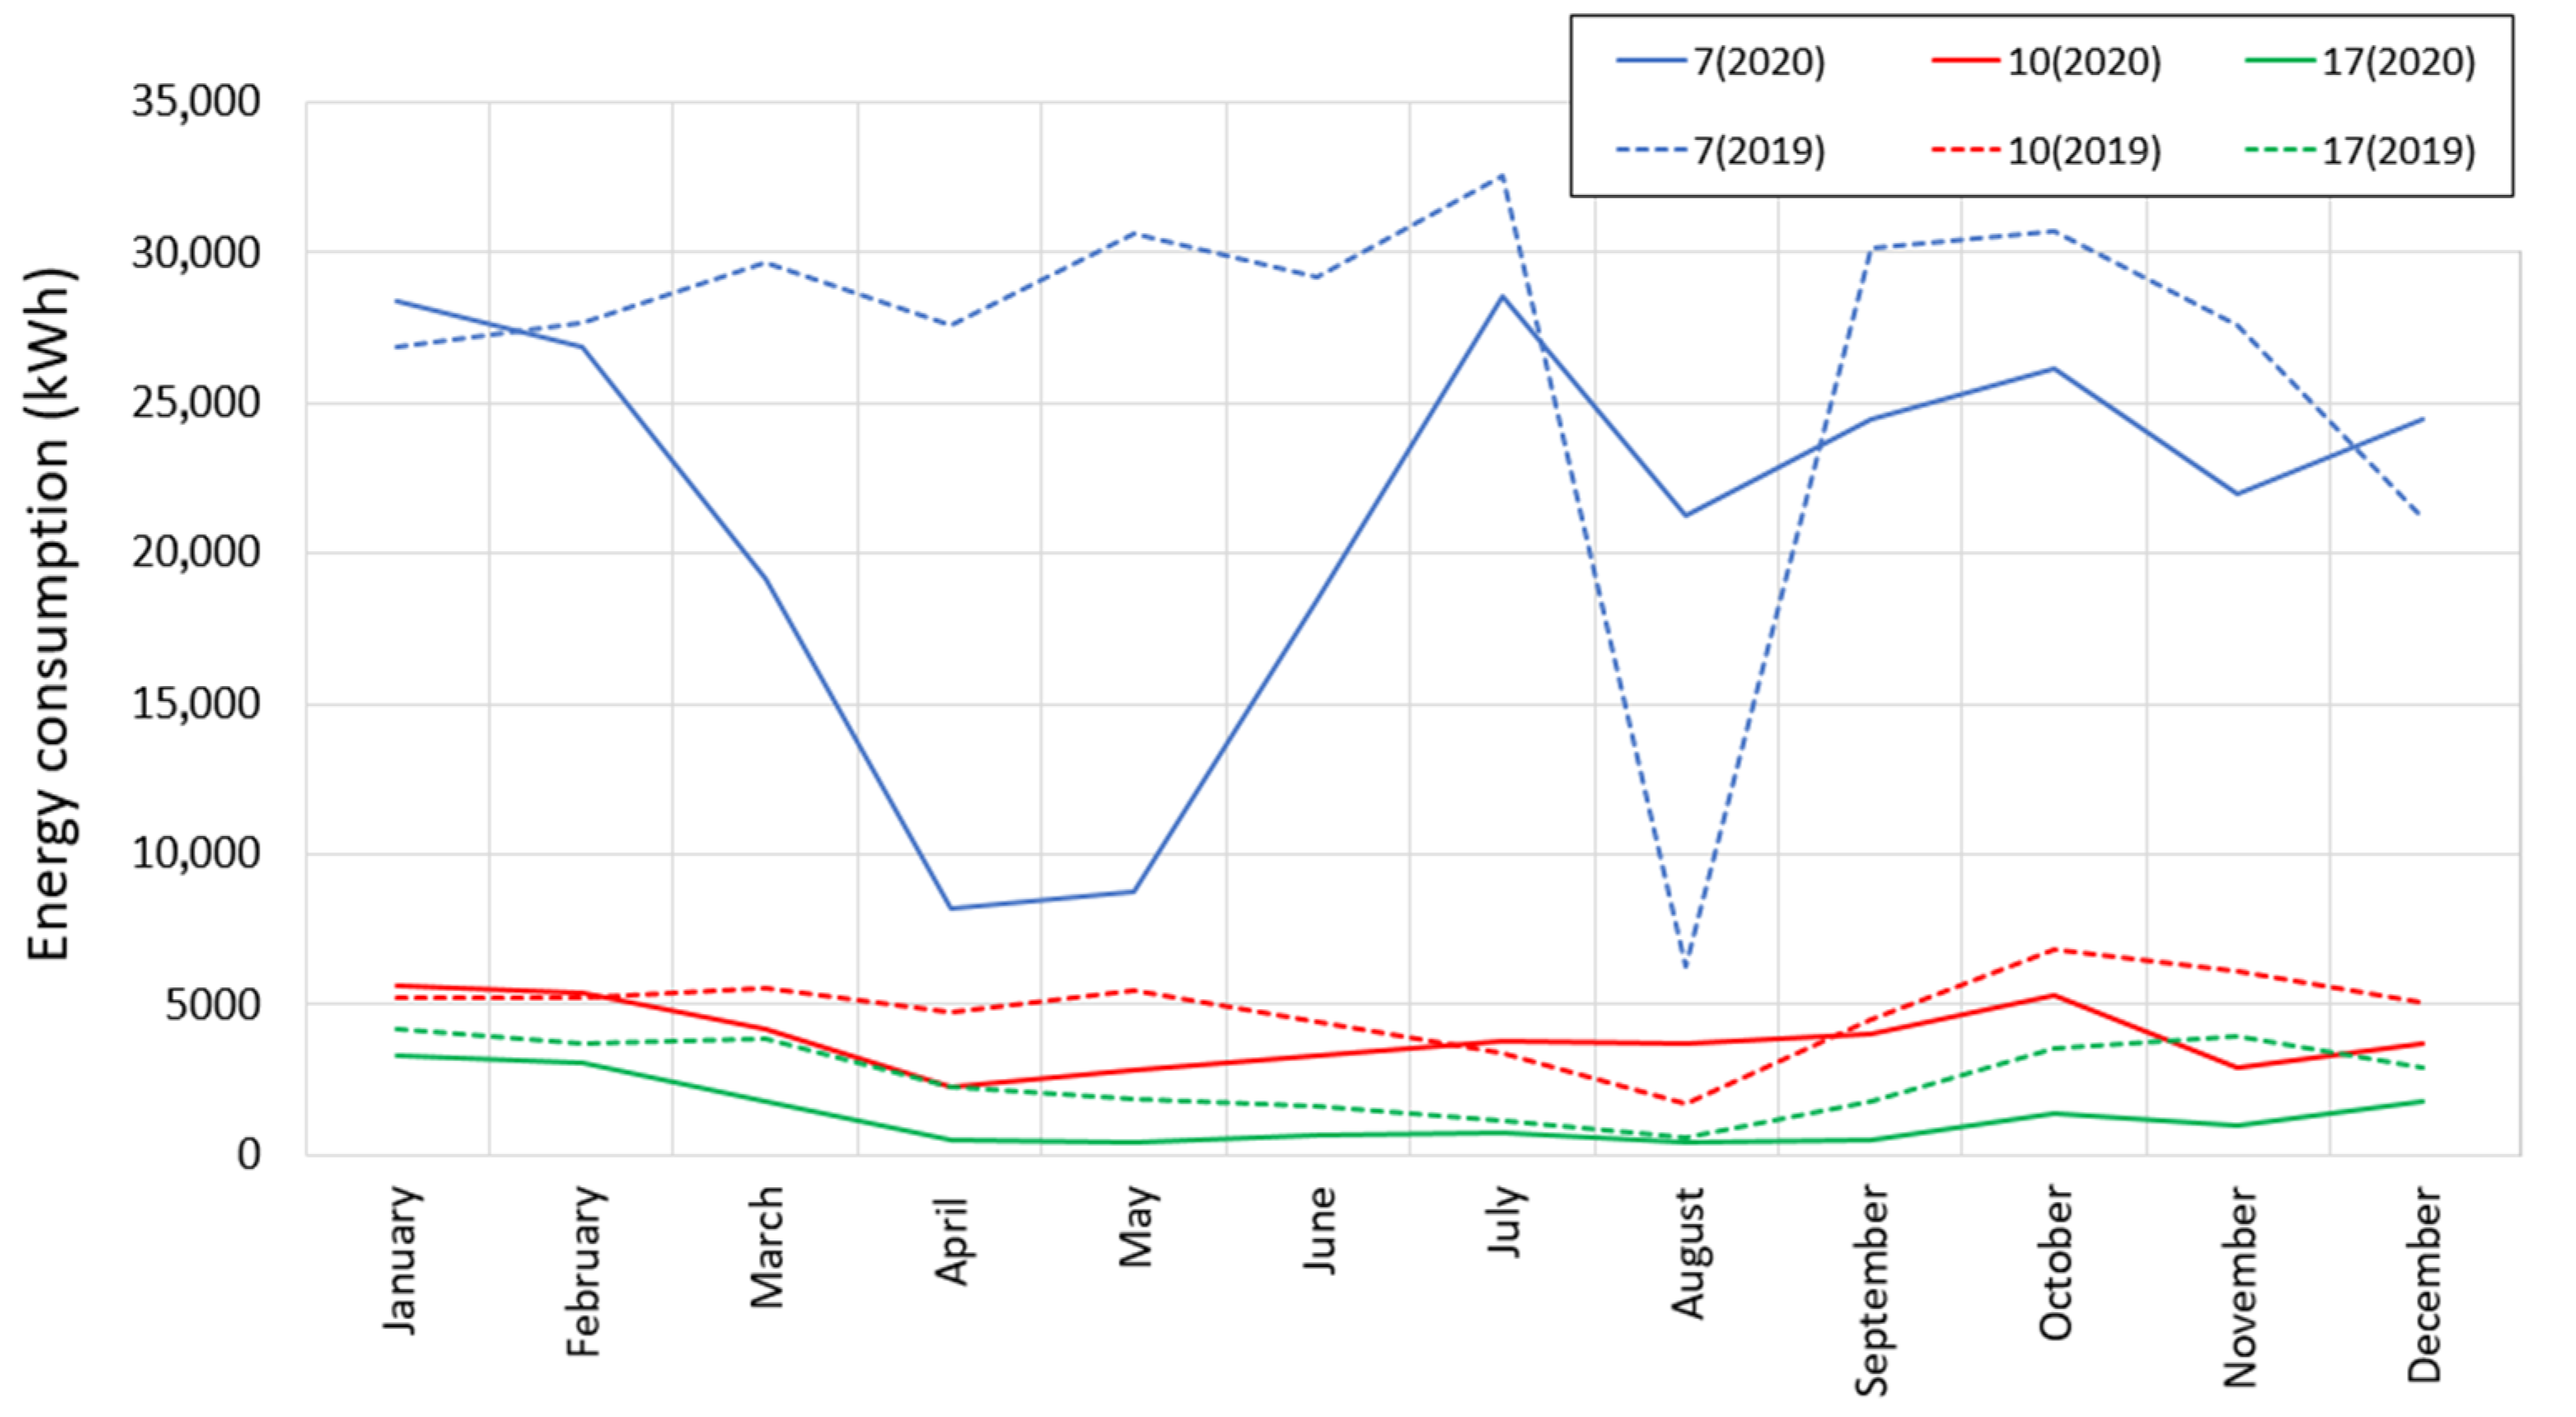
Sports facilities accounted for 3 structures and, as
Figure 18 shows, their EC patterns exhibited different trends through time: during the period of January–April of 2020, the three facilities (7), (10), and (17), respectively, declined by 71%, 60%, and 46%. They all maintained a low level of EC in May, then building (7) significantly increased in June to reach pre-confinement levels in July as students were allowed to use the gym and the swimming pool. Building (10) slightly increased in June and July, but it wasn’t until October when it regained pre-confinement levels. Unlike the previous structures, building (17) kept decreasing to reach a minimum level in August; then it started to rise again to reach pre-confinement levels in November.
The three facilities (7), (10), and (17) increased their relative standard deviation to 24%, 21%, and 62% (see
Table 9), respectively, and they decreased their EC share on an annual basis respectively to levels of 80%, 81%, and 50%, in comparison with the previous year.
4. Discussion
The campus’s overall energy consumption dropped by 1.3 million kWh in the year 2020 due to the COVID-19 outbreak. This level of consumption was the lowest recorded in the last ten years. The research and laboratory was the only category that preserved its high consumption rate with an annual loss of only 2%. This goes back to the particularity of the research buildings that include different types of laboratories with heavy plug load materials that remain in operation regardless of the occupancy rate. Despite the fact that this category shrank on the macro-scale, on the micro-scale, buildings (30) and (24) increased their consumption share during the year of limited occupancy. Building (30), the data processing center of the university, is managed by a private entity: it has optimal conditions for this type of infrastructure both for electricity supply (double electrical connections, uninterruptible power supply system), air conditioning (conditions of adequate refrigeration) and for security (fingerprint and/or card access control, video surveillance cameras, fire and early response systems). This building provides services like hosting servers, so the larger part of the operation of this facility does not rely on the presence of occupants. Moreover, during 2020 the demand for the hosting service increased since many services and businesses had to go online because of the pandemic, which explains its high and steady energy consumption. Building (24) also grew its consumption during 2020 as this facility operates mainly for research purposes that cover diverse fields such as information technology, food science, biotechnology, and chemistry, and this research facility includes equipment with heavy plug load, and it was operating during the confinement due to the importance of their projects.
The buildings of the teaching and seminary portfolio had a significant drop in energy consumption amid the outbreak, except for the two buildings (3) and (23), and the reason behind this resistance is the special infrastructure of building (3) that includes an underground tank that collects the used water of the campus, and this structure uses a water pumping system to clear it out. During this period, building (23) was going through an expansion project which required the use of electricity by the construction company. We noticed that construction activities were allowed to operate during the first weeks of lockdown, and the construction sector was also one of the first sectors to get back to operation as the confinement measures started to ease.
The administration and offices category recorded a wide gap of ratios in the second month of the outbreak. This gap was mainly driven by building (1), which is the university presidency, where all the management decisions are centralized. This facility includes the security office that manages all camera recordings inside the campus, and this office stays in operation for the entire year. Furthermore, this facility remained operational at a minimum level during lockdown because of the crucial role that it plays in overseeing the whole institution.
The facility (7) energy consumption declined its EC share in 2020 by 20%, in comparison with the previous year. However, it is the one that decreased the most (by 71%) during April: during this month, the facility did not receive any students, and it recorded 8000 kWh, and later in the same year during August, it recorded 21,000 kWh when the facility was practically inoperative (see
Table 2). This unusual trend motivated us to conduct an inventory to understand the reason behind this disparity.
Building (10) shrank by only 20%, in comparison with the previous year, despite being unoccupied for three months and having a limited number of occupants during the rest of the year. The gym materials remained plugged in during the closing period, which represents an additional waste of energy that could have been avoided.
Restaurant buildings (33) and (6) patterns tend to have the same trends (see
Figure 17). However, building (33) kept its level of EC above 3300kWh on a monthly basis (see
Table 8) because it is a private entity that stayed in operation during the summer. It also kept its activity during the lockdown as restaurants were allowed to operate delivery services. On the other hand, building (6) was greatly impacted by the lockdown: its EC share plummeted by 93% in April, and it kept low levels until the reopening for the next academic year. It is also considered the facility that decreased second-most on an annual basis by 62%.
The library energy consumption was mainly influenced when its location was open for users. The energy consumption pattern (see
Figure 17) has a correlation with the occupant activity; it fell by 85% during the first lockdown and the summer break.
5. Conclusions
The situation of closing the campus facilities during the COVID-19 outbreak influenced the overall energy consumption of the campus. However, the impact magnitude varied from one category to another, and even some facilities among the same category represented a disparity and based on the data that we collected, we shone some light through this study on how the energy performance may be different from one structure to another. All the categories decreased their consumption value, and the majority of the facilities had a higher relative standard deviation in 2020 than in 2019.
The research category was the least influenced by the outbreak situation. This was due to the nature of how laboratory facilities operate: these facilities include equipment with heavy electricity load such as an ultra-freezer, incubator, hosting servers equipment, and graphic processing units for a supercomputer, and most of this equipment remained operational even during times when the campus was closed because they are part of ongoing projects.
The library was one of the categories most impacted by closing down during the outbreak, and this was due to the operating nature of this facility: it offers desk light and, to every student, electric outlets to plug in their own devices (computer, phone). In addition, there is centralized air conditioning in common reading rooms and areas, and all of these appliances were shut down, which drove down the electricity consumption.
Efficient management could help reduce energy consumption by an important margin. Promoting energy-saving habits like unplugging unused appliances could reach 10% in some cases [
28,
29]. In our case study, after analyzing the patterns and conducting inventory in the University facilities, energy-saving measures such as switching off water heating systems in sports facilities for the swimming pool and showers and unplugging all the computers and other unused appliances such as vending machines during the time when the University locations are inoperative (confinement, summer break…) could have an important impact on energy savings in the future.


 ,
, 


