Article

The Impact of Air Quality and Meteorology on COVID-19 Cases at Kuala Lumpur and Selangor, Malaysia and Prediction Using Machine Learning

by
Juliana Jalaludin
1,*,
Wan Nurdiyana Wan Mansor
2,
Nur Afizan Abidin
1,
Nur Faseeha Suhaimi
1 and
How-Ran Chao
3
1
Department of Environmental and Occupational Health, Faculty of Medicine and Health Sciences, UPM, Serdang 43400, Malaysia
2
Faculty of Ocean Engineering Technology and Informatics, Universiti Malaysia Terengganu, Kuala Terengganu 21030, Malaysia
3
Department of Environmental Science and Engineering, National Pingtung University of Science and Technology, Neipu 91201, Taiwan
*
Author to whom correspondence should be addressed.
Atmosphere 2023, 14(6), 973; https://doi.org/10.3390/atmos14060973
Submission received: 5 April 2023 / Revised: 19 May 2023 / Accepted: 29 May 2023 / Published: 2 June 2023
(This article belongs to the Special Issue Exposure and Health Impacts of Air Pollution)

Abstract

:
Emissions from motor vehicles and industrial sources have contributed to air pollution worldwide. The effect of chronic exposure to air pollution is associated with the severity of the COVID-19 infection. This ecological investigation explored the relationship between meteorological parameters, air pollutants, and COVID-19 cases among residents in Selangor and Kuala Lumpur between 18 March and 1 June in the years 2019 and 2020. The air pollutants considered in this study comprised particulate matter (PM2.5, PM10), sulfur dioxide (SO2), nitrogen dioxide (NO2), ozone (O3), and carbon monoxide (CO), whereas wind direction (WD), ambient temperature (AT), relative humidity (RH), solar radiation (SR), and wind speed (WS) were analyzed for meteorological information. On average, air pollutants demonstrated lower concentrations than in 2019 for both locations except PM2.5 in Kuala Lumpur. The cumulative COVID-19 cases were negatively correlated with SR and WS but positively correlated with O3, NO2, RH, PM10, and PM2.5. Overall, RH (r = 0.494; p < 0.001) and PM2.5 (r = −0.396, p < 0.001) were identified as the most significant parameters that correlated positively and negatively with the total cases of COVID-19 in Kuala Lumpur and Selangor, respectively. Boosted Trees (BT) prediction showed that the optimal combination for achieving the lowest Root Mean Squared Error (RMSE), Mean Squared Error (MSE), and Mean Absolute Error (MAE) and a higher R-squared (R2) correlation between actual and predicted COVID-19 cases was achieved with a learning rate of 0.2, a minimum leaf size of 7, and 30 learners. The model yielded an R2 value of 0.81, a RMSE of 0.44, a MSE of 0.19, and a MAE of 0.35. Using the BT predictive model, the number of COVID-19 cases in Selangor was projected with an R2 value of 0.77. This study aligns with the existing notion of connecting meteorological factors and chronic exposure to airborne pollutants with the incidence of COVID-19. Integrated governance for holistic approaches would be needed for air quality management post-COVID-19 in Malaysia.

1. Introduction

The novel Coronavirus Disease (COVID-19) was announced by the World Health Organization (WHO) as a global health emergency on 11 March 2020. COVID-19 is a SARS-CoV-2 virus infectious disease initially reported in Wuhan, China, on December 1, 2019 [1]. This virus is highly infectious and spreads rapidly to many countries. COVID-19 spreads internationally, affecting the world’s economy and ecology in many ways, not only as a health problem [2]. There are four main structural proteins in SARS-CoV-2, namely the membrane (M), spike glycoprotein, nucleocapsid (N), and envelope (E) [3]. The spike of SARS-CoV-2 prevents neutralizing antibodies from reacting [4].
Long-term air pollution exposure is dangerous for the reproductive, neurological, and respiratory systems and could lead to cancer and even infrequent death [5]. It is important to note that dysfunction and neuroinflammation in the immune system [6] are associated with poor air quality. Increasing inflammation in more polluted areas could increase death and disease expression. According to previous research, people who live in polluted environments are more susceptible to SARS-CoV-2 infections and increased mortality [7,8]. Moreover, the transmission of infectious diseases, including Severe Acute Respiratory Syndrome (SARS), Middle East Respiratory Syndrome (MERS), and influenza, is significantly influenced by meteorological parameters [9]. As a result, the rate of incidence of infectious diseases is likely to be affected by the changes in weather. Chen et al. [10] also suggested that weather has a vital role in transmitting SARS-CoV-2 worldwide. However, meteorological factors in each country and region are different, and causal factors for each parameter may vary. Hence, a few researchers have attempted to explore the effects of dew point, ambient temperature (AT), rainfall, and wind speed (WS) on the spread of COVID-19 [9,11,12,13].
The COVID-19 pandemic has impacted the world in numerous ways, including changing the patterns of human mobility and transportation. In Malaysia, the government implemented various measures to control the spread of the virus, such as a series of movement control orders (MCO) beginning on 18 March 2020, which resulted in reduced human mobility and decreased transportation. This restriction led to a decrease in road traffic and public transportation usage, resulting in reduced emissions from transportation sources, including vehicles and factories. The decrease in human mobility also led to a decrease in energy consumption, which further contributed to reducing emissions and pollution levels. Other researchers had also investigated how the COVID-19 outbreak caused a decrease in human mobility and transportation, leading to a decline in the concentration of air pollutants in urban regions of Brazil and Krakow, Poland [14]. Rudke et al. (2022) reported that the most significant reductions in air pollutant concentrations occurred for CO, NO2, and PM10 during the first 30 days of restrictions. Similarly, Zaręba and Danek (2022) [14,15] collected data during the early spring of 2021, when car transportation was limited due to Poland’s COVID-19 lockdown, enabling them to observe air pollution levels from solid fuel heating with minimal background pollution caused by traffic.
The present study investigates the role of meteorological parameters and air pollutants in the transmission of COVID-19 in Selangor and Kuala Lumpur, Malaysia. Earlier studies found that respiratory infections were predicted by meteorological parameters and air pollution [10,16]. Atmospheric PM, both in the short and long term, is widely recognized for its contribution towards suppressing the respiratory system’s protective mechanisms. Consequently, it is a significant aggravating factor for susceptibility to SARS-CoV-2 infection and the severity and fatality of COVID-19 through multiple mechanisms. Furthermore, SARS-CoV-2 was found to stay longer in the air by attaching to air particles. Determining the risk factors or factors influencing the spread of COVID-19 is vital for the effective prevention and control of the novel virus. Thus, this research attempts to elucidate the association between air pollutants, meteorological parameters, air pollutants, and the transmission of COVID-19 in Malaysia.
Machine learning is gaining popularity owing to its ability to enable automated decision-making, reduce human labor, and increase efficiency. It has numerous applications in a variety of industries, including the following: (1) healthcare, where it aids in diagnosis, drug discovery, and medical imaging analysis [17]; (2) marketing, where it aids in customer segmentation, personalization, and recommendation systems [18,19]; (3) transportation, where it aids in autonomous vehicles, route optimization, and traffic prediction [20]; (4) manufacturing, where it aids in predictive maintenance and quality control [21,22]; (5) energy: predictive modeling of renewable energy supplies and demand forecasts [23,24]; and (6) security: facial recognition, intrusion detection, and biometric authentication [25,26]. In air quality monitoring, machine learning algorithms can analyze large amounts of air quality data to identify patterns and predict air pollution levels, helping cities and governments take proactive measures to reduce air pollution [27,28]. This study employs a machine learning technique called Boosted Trees (BT) to assess the influence of air quality parameters and meteorological factors on COVID-19 cases in Kuala Lumpur. Subsequently, the Selangor cases are predicted using the model. BT utilizes an ensemble of decision trees to make predictions, creating a sequence of trees where each successive tree is tailored to the negative gradient of the loss function concerning the current predictions. The ultimate prediction is generated by amalgamating the predictions of all trees in the sequence.

2. Materials and Methods

2.1. COVID-19 Incidence Data

Data on COVID-19 cases in Selangor and Kuala Lumpur were retrieved from the official website of Malaysia’s Ministry of Health available at http://COVID-19.moh.gov.my (accessed on 31 May 2020). The duration of the cumulative daily cases of COVID-19 was taken from 18 March to 26 May 2020.

2.2. Environmental Condition Data

Meteorological and air pollution data were obtained from the Department of Environment (DOE), Ministry of Environment and Water, Malaysia. Specifically, the data were sourced from two stations: Petaling Jaya Station in Selangor (coordinate: 3.1094° N 101.6388° E) and Batu Muda Station in Kuala Lumpur (coordinate: 3.2124° N 101.6822° E). The locations of these monitoring stations are visualized in Figure 1. Batu Muda Station in Kuala Lumpur was selected because it represented an urban area and is within proximity to the populous city of Kuala Lumpur, which has high COVID-19 cases. As for Petaling Jaya Station in Selangor, it was chosen because it covers the industrial area and highly populated zone in Selangor. The duration of the data was from 4 March 2019 to 26 May 2020 and the data was averaged over 24 h each day. Meteorological parameters included relative humidity (RH), wind direction (WD), wind speed (WS), solar radiation (SR), and AT data. The air pollutants components were PM2.5 (particulate matter with ≤10 μm diameter), PM10 (particulate matter with ≤2.5 μm diameter), sulfur dioxide (SO2), nitrogen dioxide (NO2), ozone (O3), and carbon monoxide (CO).
The hourly air pollution dataset recorded at the Continuous Air Quality Monitoring Station (CAQMS) was obtained from the Malaysian Department of Environment (DOE). The instrument used for the measurements of PM10 and PM2.5 was a Thermo Scientific Model TEOM 1450-DF, while for SO2, NO2, CO, and O3, the instruments were Thermo Scientific Models 43 i, 42 i, 48 i, and 49 i, respectively. Each instrument was calibrated monthly to ensure accuracy and precision. The concentration of each pollutant was determined at 10-min intervals and then calculated for 1-h averages. The instrument used for the measurements of PM10 and PM2.5 was a Thermo Scientific Model TEOM 1450-DF [29,30]. Meanwhile, NO2 concentrations were detected using the NO2 analyzer Model 200A based on chemiluminescence detection principles. The Teledyne API Model 400/400E instrument, via a UV absorption (Beer–Lambert) technique with a precision level of 0.5% and a detection limit of 0.4 ppb, was utilized in measuring the O3 concentrations [31,32]. Measurements of SO2 concentrations were conducted using the Teledyne API Model 100A/100E with the lowest detection level at 0.04 ppb by the UV fluorescence approach, while the Teledyne API Model 300/300E was employed to determine CO concentrations with a 0.04 ppm detection limit and 0.5% precision level by the non-dispersive and infrared absorption (Beer–Lambert) method [32]. Meanwhile, the meteorological parameters were measured using the Met One 062 sensor, the Met One 083D sensor, and the Met One 010C sensor for measurements of AT, RH, and WS, respectively [33]. Consequently, all monitoring instruments were calibrated daily using zero air and standard gas concentrations to certify and validate the monitored data, which were reviewed before they were handed to the DOE [34].

2.3. Statistical Analysis

Statistical analysis was performed using the Statistical Package for Social Science (SPSS) software version 25. The paired-samples t-test was performed to analyze a statistically significant difference between two related samples that were normally distributed. Data not conforming to normality assumptions were analyzed using the Wilcoxon signed-rank test. Furthermore, a Spearman’s correlation test was employed to determine the bivariate level relationship (correlation coefficient; r) between the cumulative number of COVID-19 cases, air pollutants, and meteorological parameters. Statistically significant relationships were considered when p < 0.05.
The data on air pollutants in 2019 were analyzed against the data on cumulative COVID-19 cases in 2020 to investigate the long-term effect of air pollutants. On the other hand, data on meteorological factors in 2020 were analyzed against the data on cumulative COVID-19 cases in 2020. After that, multiple linear regression was applied to investigate the relationship between cumulative COVID-19 cases and predictor variables.

2.4. Machine Learning Approach

During the period 18 March to 1 June 2020, BT regression was trained to assess the influence of air quality and meteorological data on COVID-19 cases. BT is opted for due to its numerous benefits, such as the capability to fine-tune the model using errors from preceding trees, enhanced effectiveness in handling imbalanced datasets, shorter training time since trees are trained one at a time, and implicit feature selection by assigning greater significance to features that are more informative for prediction. The training and validation of the model were performed using the Matlab software R2020a. The MATLAB software R2020a was developed and released by MathWorks. The predictors were months, PM10, PM2.5, SO2, NO2, O3, CO, and meteorological parameters WD, WS, RH, SR, and AT. Other parameters are shown in Table 1. The operational flow of the machine learning algorithm is depicted in Figure 2.
The process of BT prediction began with the collection and preparation of data for the algorithm. The data was then normalized using Equation (1), which rescaled it to a range between 0 and 1. Data normalization is an important preprocessing step in machine learning because it scales the features to a similar range, which helps reduce the influence of some features that might have significantly larger values than others. This helps prevent some features from dominating the objective function and improves the training of the model.
Xnormalized = (X − Xmin)/(Xmax − Xmin)
where X is a data point, Xmin is the minimum value in the dataset, and Xmax is the maximum value in the dataset. Then, the missing values were investigated. Many statistical and machine learning methods require complete datasets to generate good predictions; therefore, dealing with missing data is a required step. The BT model was chosen, and an ensemble of decision trees was generated using a boosting algorithm to combine multiple weak learners, which were decision trees in this case, into a strong learner. After training the model, its performance was evaluated before being employed to predict the response variable for new data. The performances of machine learning models were evaluated and compared using statistical error metrics such as Root Mean Square Error (RMSE), Mean Square Error (MSE), Mean Absolute Error (MAE), and R-squared (R2). The RMSE measures the difference between the predicted and true values of the response variable, with lower values indicating better model performance. It is calculated by taking the square root of the mean of the squared differences between the predicted and true values. Unlike RMSE, MAE calculates the average of the absolute differences between predicted and actual values, as shown in Equation (2).
RMSE =   ( MSE ) = ( 1 n i = 1 n ( x y ) 2 ) MAE = 1 n i = 1 n | x y |
where x is the actual value, y is the predicted value, and n is the number of samples in the dataset.
The R2 is utilized to show how well the regression model fits the data, where a higher R2 implies that a larger proportion of the variance in the dependent variable can be accounted for by the independent variable(s). In this study, the dependent and independent variables are actual and predicted values. The R2 value ranges from 0 to 1, where a value of 0 indicates that none of the variation in the dependent variable is explained by the independent variable(s), and a value of 1 indicates that all of the variation in the dependent variable is explained by the independent variable(s). Equation (3) shows how the R2 is calculated.
R 2 = n Σ x y ( Σ x Σ y ) n Σ x 2 Σ x 2 [ n Σ y 2 Σ y 2 ] 2

3. Results and Discussion

3.1. Status of the COVID-19 Outbreak Situation in Malaysia

The trend of cumulative COVID-19 cases in Kuala Lumpur and Selangor during the study duration is shown in Figure 3. MCO in Malaysia began on 18 March 2020. On the first day, 119 cases and 192 cases were reported in Kuala Lumpur and Selangor, respectively. At the beginning of this study, Selangor recorded a higher number of cases compared to Kuala Lumpur. Several months later, as of 1 June 2020, 7857 cumulative cases of COVID-19 were reported in Malaysia. Kuala Lumpur recorded the highest number of cases, with 2039 cases, while Selangor had 1920 cases.
Figure 4 shows the daily COVID-19 cases in Kuala Lumpur and Selangor. The highest number of cases in Kuala Lumpur was 177 on 26 May 2020, whereas in Selangor, there were 75 cases on 26 March 2020. In contrast, the lowest number of cases was one for both states. Based on Figure 3, the cases in Kuala Lumpur increased drastically from 24 May to 26 May 2020 and dropped to five cases on 27 May 2020. Due to the increasing cases on those days, the cumulative cases in Kuala Lumpur became higher than those in Selangor, making Kuala Lumpur the state with the highest number of COVID-19 cases in Malaysia.
A total of 115 COVID-19-related deaths were reported in the country between 18 March 2020 and 1 June 2020 during the study. As highlighted by Malaysia’s Ministry of Health, some of the patients that succumbed to COVID-19 had a minimum of two chronic illnesses, such as heart disease, diabetes, asthma, stroke, dementia, and kidney disease [35]. Exposure to poor air quality can lead to various health issues, especially among vulnerable populations such as immunocompromised patients. Moreover, air pollution can enhance the likelihood of COVID-19 infection due to comorbidities or other respiratory illnesses [36]. When a person has comorbidities, their immune system may be impaired or require extra care, which may expose them to other infections.
Cilia and upper airway defenses could have been weakened by persistent exposure to air pollution, which may have encouraged viral invasion by allowing viruses to invade lower airways, increasing COVID-19 occurrence and lethality [7]. The immune system could be severely compromised by a highly infectious virus, such as the novel SARS-CoV-2. This is particularly evident among people residing in locations with extreme levels of air pollution. Zhu et al. [8] reported a statistically significant association between COVID-19 infection and air pollution. Likewise, Liu et al. [37] demonstrated that COVID-19 community spread could be favored by low temperatures, low humidity, and mild diurnal temperature ranges.

3.2. Concentrations of Air Pollutants and Meteorological Parameters before and during MCO

Many processes contribute to causing air pollution in automobiles (aircraft, trucks, automobiles, and other engines), power plants, industries, and household heating systems. The release of chemicals and harmful gases interacts with sunlight to increase the toxicity of the material [38]. As predicted, the lockdown, better known as MCO in Malaysia, improved the air quality in the country. During MCO, there were restricted social interactions and the closure of non-essential industries; hence, particular air contaminants, primarily those controlled by primary sources, were temporarily reduced. Several studies also reported a significant reduction in air pollution and improved air quality in their regions during lockdown [16,39,40,41].
Table 1 and Table 2 depict the descriptive statistics (mean, standard deviation, median, interquartile range, maximum, and minimum) of daily parameters and air pollutants parameters between 18 March and 1 June in 2019 and 2020 in the study locations. This 11-week period represents MCO in Malaysia, with MCO starting on 18 March 2020. A pair-sample t-test (effect size, d) was employed in comparing the mean concentrations of all parameters that were normally distributed. In contrast, non-normally distributed parameters were appropriately interpreted using a Wilcoxon signed-rank test (effect size, r) during these two years.
In 2020, all studied air pollutants in Kuala Lumpur showed lower concentrations than in 2019, except for PM2.5, as shown in Table 2. The average of PM2.5 in 2020 was higher than in 2019 at 0.22 µg/m3, and the results were statistically different (t or Z) at p < 0.05. In other words, the MCO was influential in reducing toxic air levels. The effect size of NO2 was large (d ≥ 0.80 or r ≥ 0.80), whereas CO and SO2 recorded a medium effect size (r ≥ 0.50). Nevertheless, all meteorological parameters were statistically significant (t or Z) at p < 0.05, following the removal of AT. SR had the highest effect size compared to other variables, which was a medium effect size at r = 0.68.
On average, all air quality parameters in 2020 showed lower concentrations than in 2019, as shown in Table 3. These results were statistically significant at p < 0.05, reflecting the impact of the MCO on enhancing air quality. Whereas PM2.5 and PM10 recorded a medium effect size (r ≥ 0.50), a large effect size was observed for NO2, O3, and CO (d ≥ 0.80 or r ≥ 0.80). The exclusion of SR resulted in all meteorological parameters exhibiting non-statistically significant differences (t or Z) at p < 0.05. SR had the highest effect size compared to other variables, which had a medium effect size at r = 0.70.
The new Malaysia Ambient Air Quality Standard for 2020 from the DOE (2020) was compared with all six air pollutant parameters. None of these air pollution parameters exceeded the standards (PM10 = 100 μg m−3 for 24 h, PM2.5 = 35 μg m−3 for 24 h, SO2 = 95 ppb for 1 h, NO2 = 149 ppb for 1 h, O3 = 92 ppb for 1 h, and CO = 26.19 ppm for 1 h) except for PM2.5 for both states.
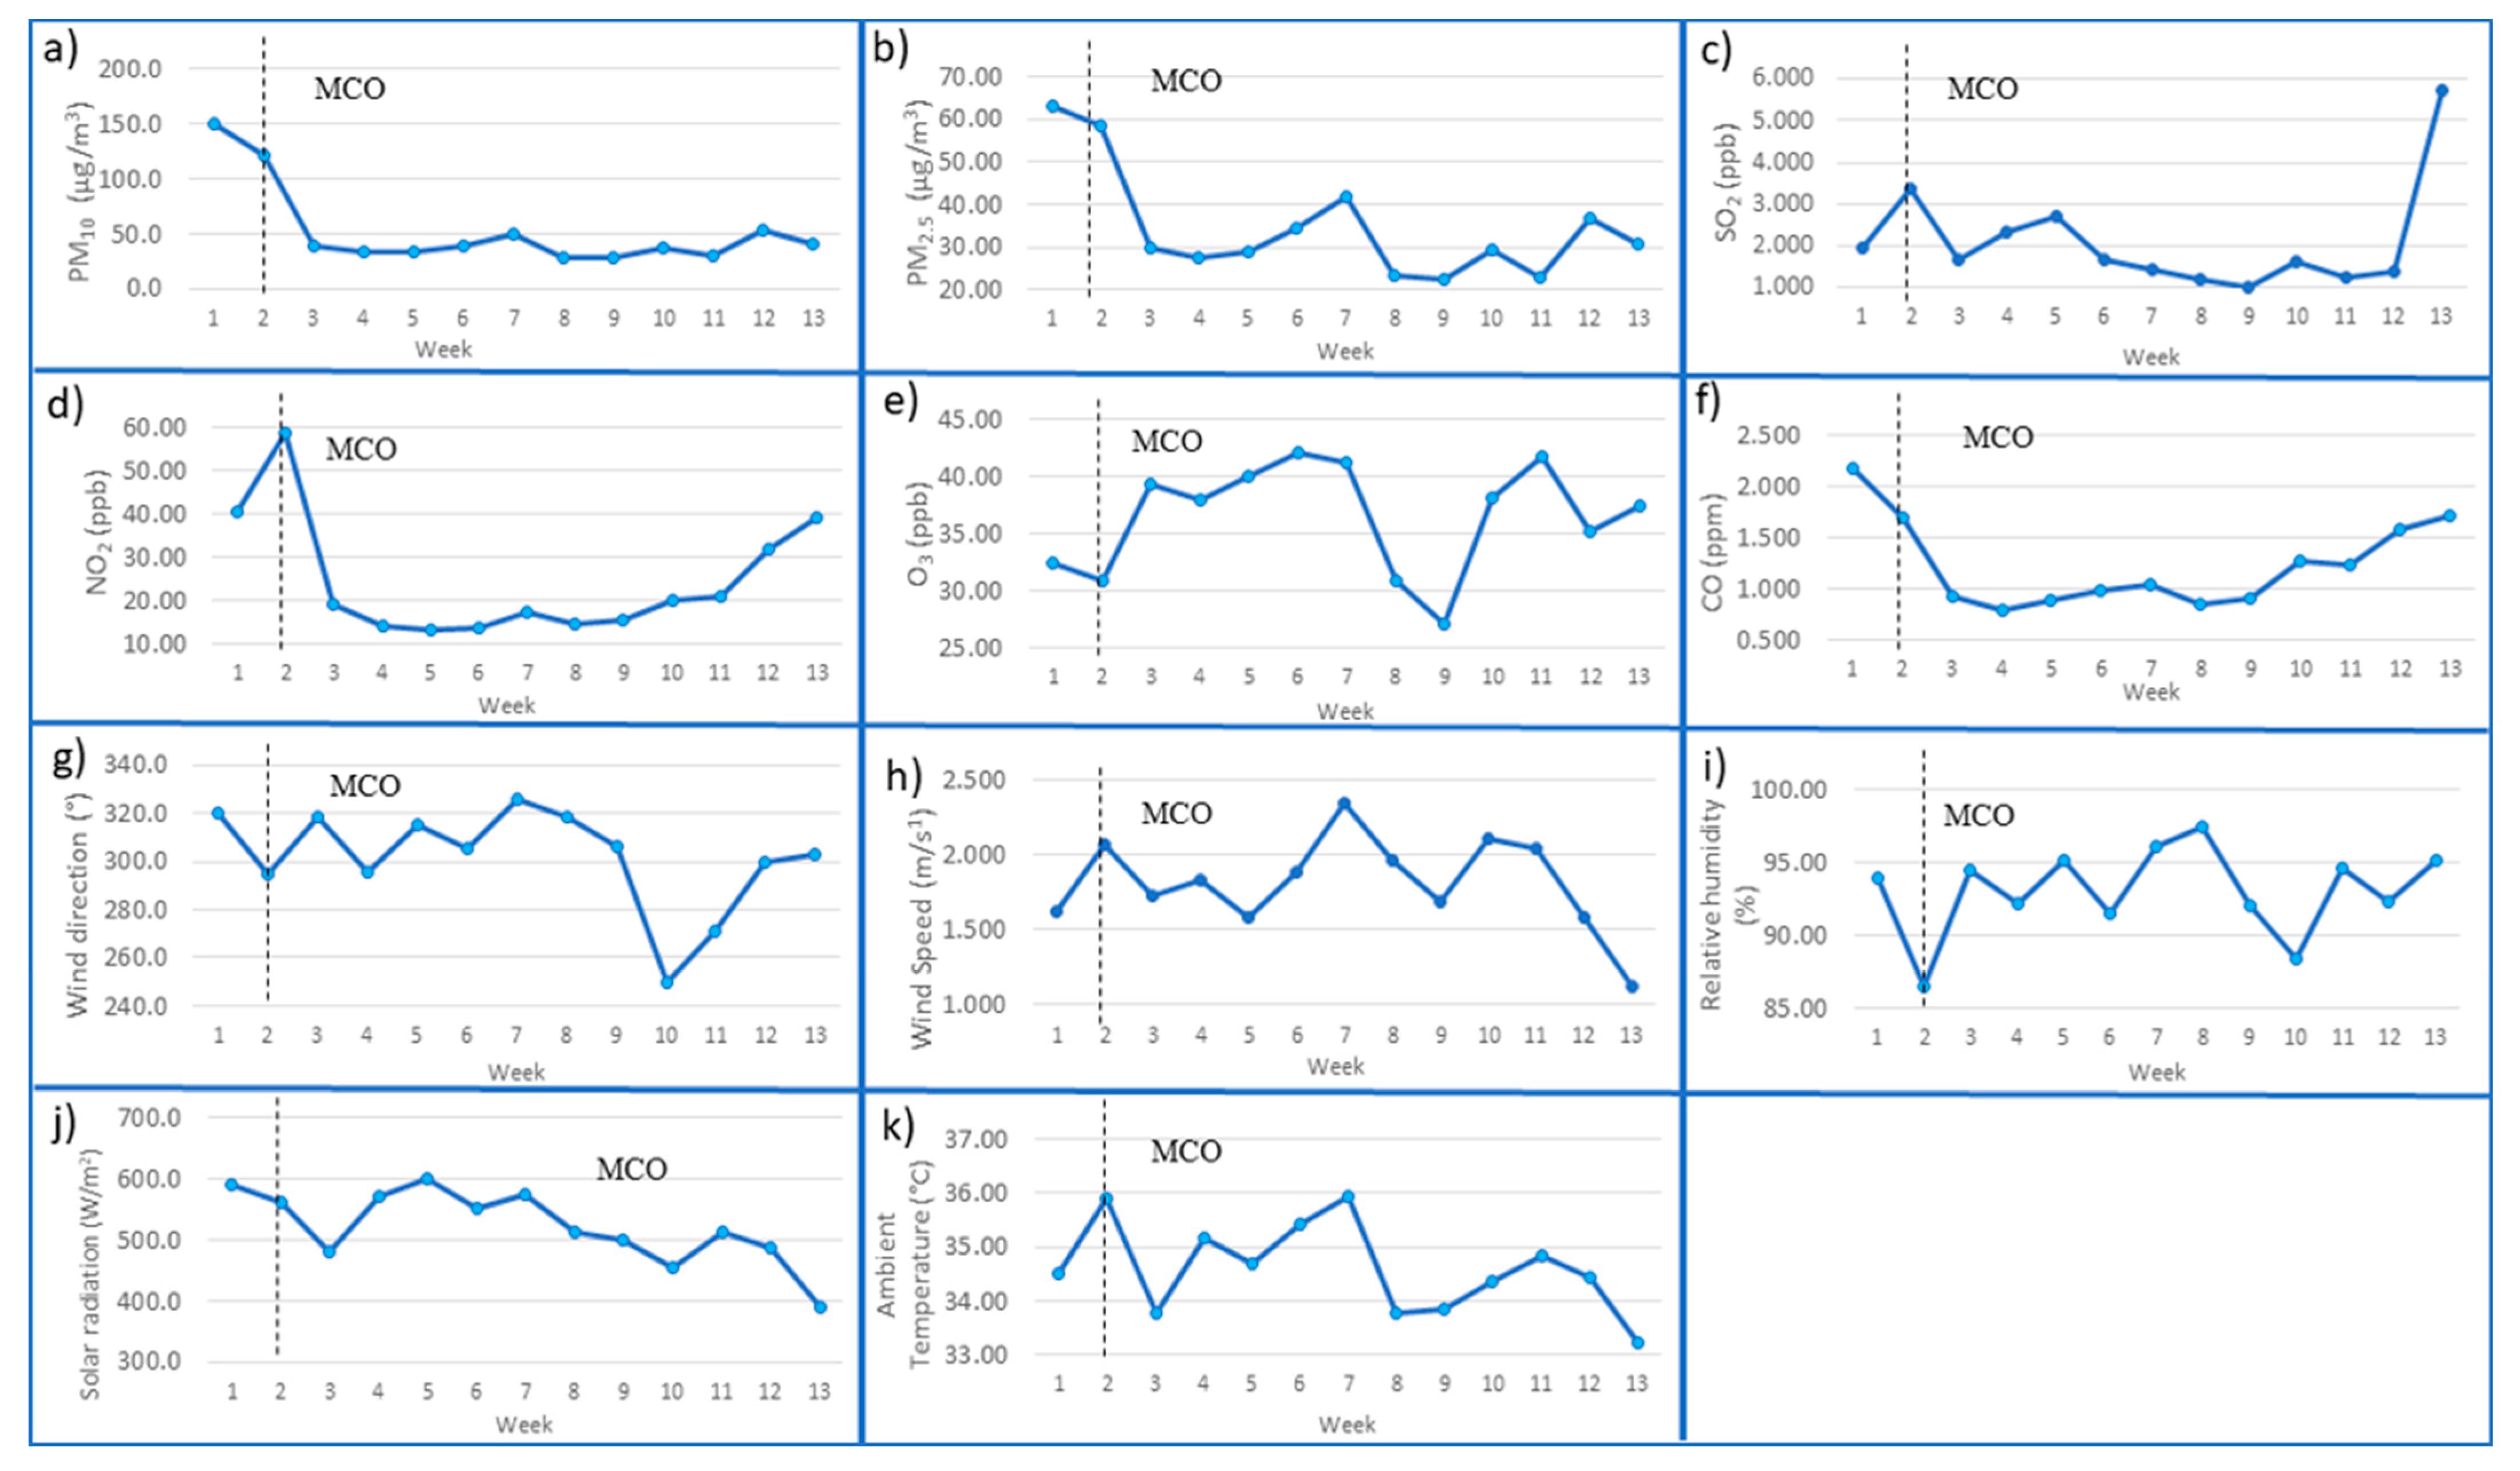
Figure 5 and Figure 6 indicate the weekly average levels of air pollutants and meteorological factors beginning from 4 March to 1 June 2020 (13 weeks) in Kuala Lumpur and Selangor, respectively. The measurements were categorized into two periods: (1) before the MCO (4 March 2020 to 17 March 2020, also Week 1–Week 2), and (2) during the MCO (18 March to 1 June 2020, also Week 3–Week 13). The 13-week duration was designated as (1) Week 1 from 4 March to 10 March, (2) Week 2 from 11 March to 17 March, (3) Week 3 from 18 March to 24 March, (4) Week 4 from 25 March to 31 March, (5) Week 5 from 1 April to 7 April, (6) Week 6 from 8 April to 14 April, (7) Week 7 from 15 April to 21 April, (8) Week 8 from 22 April to 28 April, (9) Week 9 from 29 April to 5 May, (10) Week 10 from 6 May to 12 May, (11) Week 11 from 13 May to 19 May, (12) Week 12 from 20 May to 26 May, and (13) Week 13 from 27 May to 1 June.
All air pollutants were significantly reduced, excluding O3 in Selangor and PM2.5 and O3 in Kuala Lumpur and O3 in Selangor, during the third and fourth weeks of the MCO. PM10 and PM2.5 concentrations in Kuala Lumpur did not decrease after MCO from Week 3 until Week 5, but the concentrations increased drastically in Week 10. In contrast, PM10 in Selangor showed decreasing trends, which were from the range of 120.9–151 μg m−3 before MCO to the range of 29.2–53.1 μg m−3 during MCO; PM2.5 in Selangor exhibited declining trends, which were from the range of 58.2–62.8 μg m−3 before MCO to the range of 22.3–41.8 μg m−3 during MCO.
There are industrial areas and heavy road traffic around the monitoring station, so when MCO was implemented, the restriction of movement and operation of industries also stopped, decreasing the production of particulate matter in the atmosphere. However, trucks used to transport foods and other essential goods during the MCO were operating as usual. Consequently, the concentrations of PM2.5 and PM10 in Kuala Lumpur did not reduce during MCO due to the ongoing essential activities in the region [30].
As a result of reduced manufacturing operations in Malaysia throughout MCO, SO2 concentrations also decreased. Nevertheless, the SO2 concentration increased drastically in Week 13 in Selangor. This finding could be due to the reopening of many economic sectors and activities when MCO moved to a new phase, the Conditional Movement Control Order (CMCO). Apart from this finding, concentrations of CO2 and NO2 in Kuala Lumpur and Selangor had recorded higher concentrations before MCO than during MCO. A decreased number of vehicles on the road caused fewer emissions from motor vehicles, which explained the significant reductions in NO2 and CO emissions. Previous studies reported on CO reduction in the megacity of Delhi, India, and a decline in NO2 levels in the city of Rio de Janeiro, Brazil, due to a reduction in vehicle movement and the closure of industrial complexes and power plants during the COVID-19 lockdown [42,43]. Therefore, shutting down transport and industrial sectors mainly explains why these pollutants declined sharply during the lockdown phase.
Furthermore, Lefohn et al. [44] and Paoletti et al. [45] indicated that the reduction of nitrogen oxide (NOx) concentrations had an inverse relationship with O3 concentrations. Contrastingly, concentrations of O3 fell rapidly at higher concentrations of NOx [46,47]. In the presence of sunlight, photolysis of NOx and volatile organic compounds (VOCs) produces O3 [48]. As a result of restricted movements and operations during the lockdown phase, decreased NO2 emissions increased O3 concentrations [49,50].
The climate of Malaysia is categorized as hot and humid throughout the year because its location is just north of the equator, with average temperatures around 28 degrees on the mainland. There are two monsoon wind seasons: the southwest monsoon from May to September and the northeast monsoon from October to March. These monsoon seasons bring in more rainfall with a higher RH, lower SR, and lower AT on average than hot seasons. Kuala Lumpur experienced the transitional period of the inter-monsoon season during the study period, March–April. For meteorological parameters, excluding WD and RH, the concentrations of all the variables were reduced during the first week of the MCO. The RH increase was expected to continue until May 2020 due to the monsoon season, which can cause frequent rain. Malaysia experienced an inter-monsoon season between March and April throughout the research period. In early May, we experienced the early stage of the Southwest monsoon; hence, more rainfall will happen as a result of increasing RH and decreasing SR and AT.
Nonetheless, on average, WS showed a slightly decreasing trend at the end of the MCO for Kuala Lumpur (2.65 to 2.17 m s−1) and Selangor (1.11 to 2.33 m s−1), where the WS might be attributed to seasonal change. The RH value was slightly higher during the MCO compared to the pre-MCO period, ranging from 88.40% to 97.47% and from 89.87% to 97.40% in Selangor and Kuala Lumpur, respectively. In comparison, the AT during MCO presented similar trends for both states, which were higher trends at the beginning of MCO but lower trends at the end of MCO.
In a broader context, these movement restrictions are not just to control the outbreak of COVID-19 but also to minimize the air pollution problem in Malaysia. The restrictions on pollution-generating activities and human mobility during the lockdown period resulted in an overall improvement in air quality throughout the world, including Malaysia. The present results are consistent with earlier reports [51], in which low levels of contaminants (CO, PM2.5, and PM10) were documented in the Klang Valley during the MCO. In the same manner, studies from other countries such as India (Delhi) and Spain (Barcelona) also reported on the reduction of PM2.5, PM10, CO, and NO2 but the increment of O3 during the lockdown period in Delhi, India [43] and Barcelona, Spain [50]. In addition, studies from major cities in China and Morocco also showed a significant reduction in concentrations of PM2.5, PM10, NO2, SO2, and CO during the lockdown phase [8,52].

3.3. Relationship between Air Quality, Meteorological Factors, and COVID-19 Cases

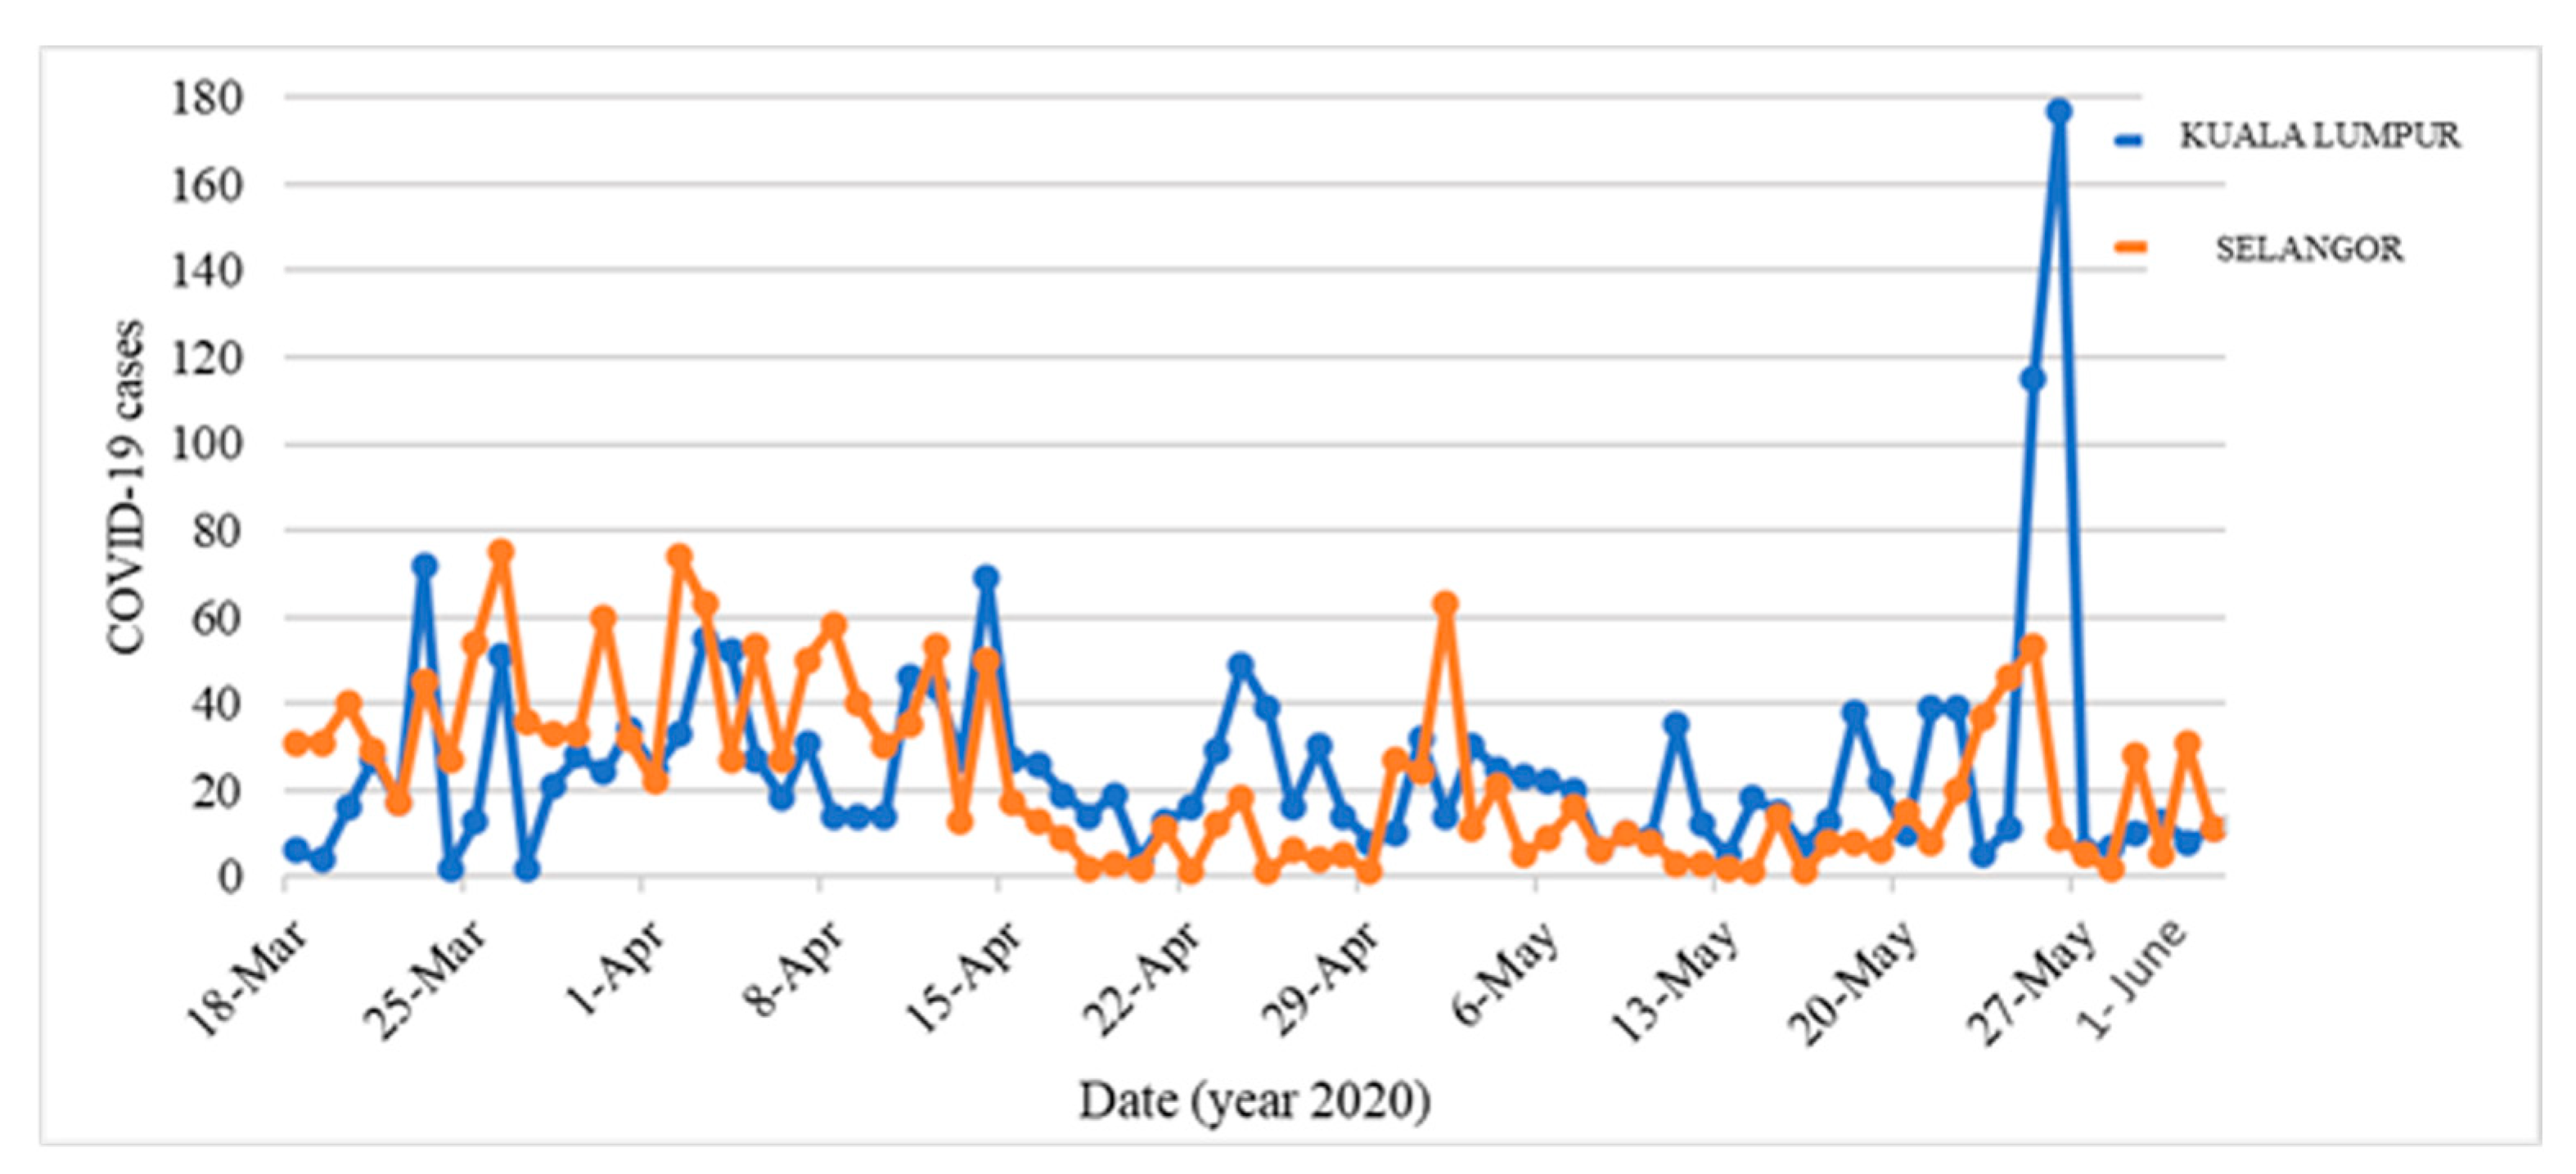
COVID-19 has a 1–14-day incubation period [53], and the impact of meteorological parameters could last for a few days [4]. Another study evaluated the correlations between COVID-19 cases, related mortality, and the concentrations of air pollutants between the years in which COVID-19 cases occurred and the years before the pandemic [54]. In line with their findings, applying the lag effect of various air quality and meteorological variables was reasonable in this study. Assuming that the usual duration from virus transmission to infection is 7 days, the average daily air quality and meteorological parameters of 7 days ago were compared with the total reported cases during MCO. For instance, COVID-19 cases on 18 March 2020, were analyzed against the average air pollution parameters on 11 March 2019, and meteorological factors on 11 March 2020, as applied previously in a local study by Suhaimi et al. [55]. Table 4 depicts the correlations of meteorological parameters and air pollutant variables in the cumulative cases of COVID-19 in Selangor and Kuala Lumpur. Only NO2, O3, PM10, and PM2.5 were associated with the cumulative COVID-19 cases among air pollutant variables. Meanwhile, RH, WS, and SR were the only meteorological parameters that demonstrated significant correlations with the outcome variable. Conversely, WD, O3, SO2, and AT reflected no significant correlations with COVID-19 cases. Besides, weak positive correlations were observed for cumulative COVID-19 cases and NO2, O3, PM2.5, and PM10, while RH exhibited a strong positive correlation. However, WS and SR had negative correlations with COVID-19 cases. Up to this point, the impact of outdoor air pollution levels and meteorological conditions on COVID-19 infections was statistically significant.
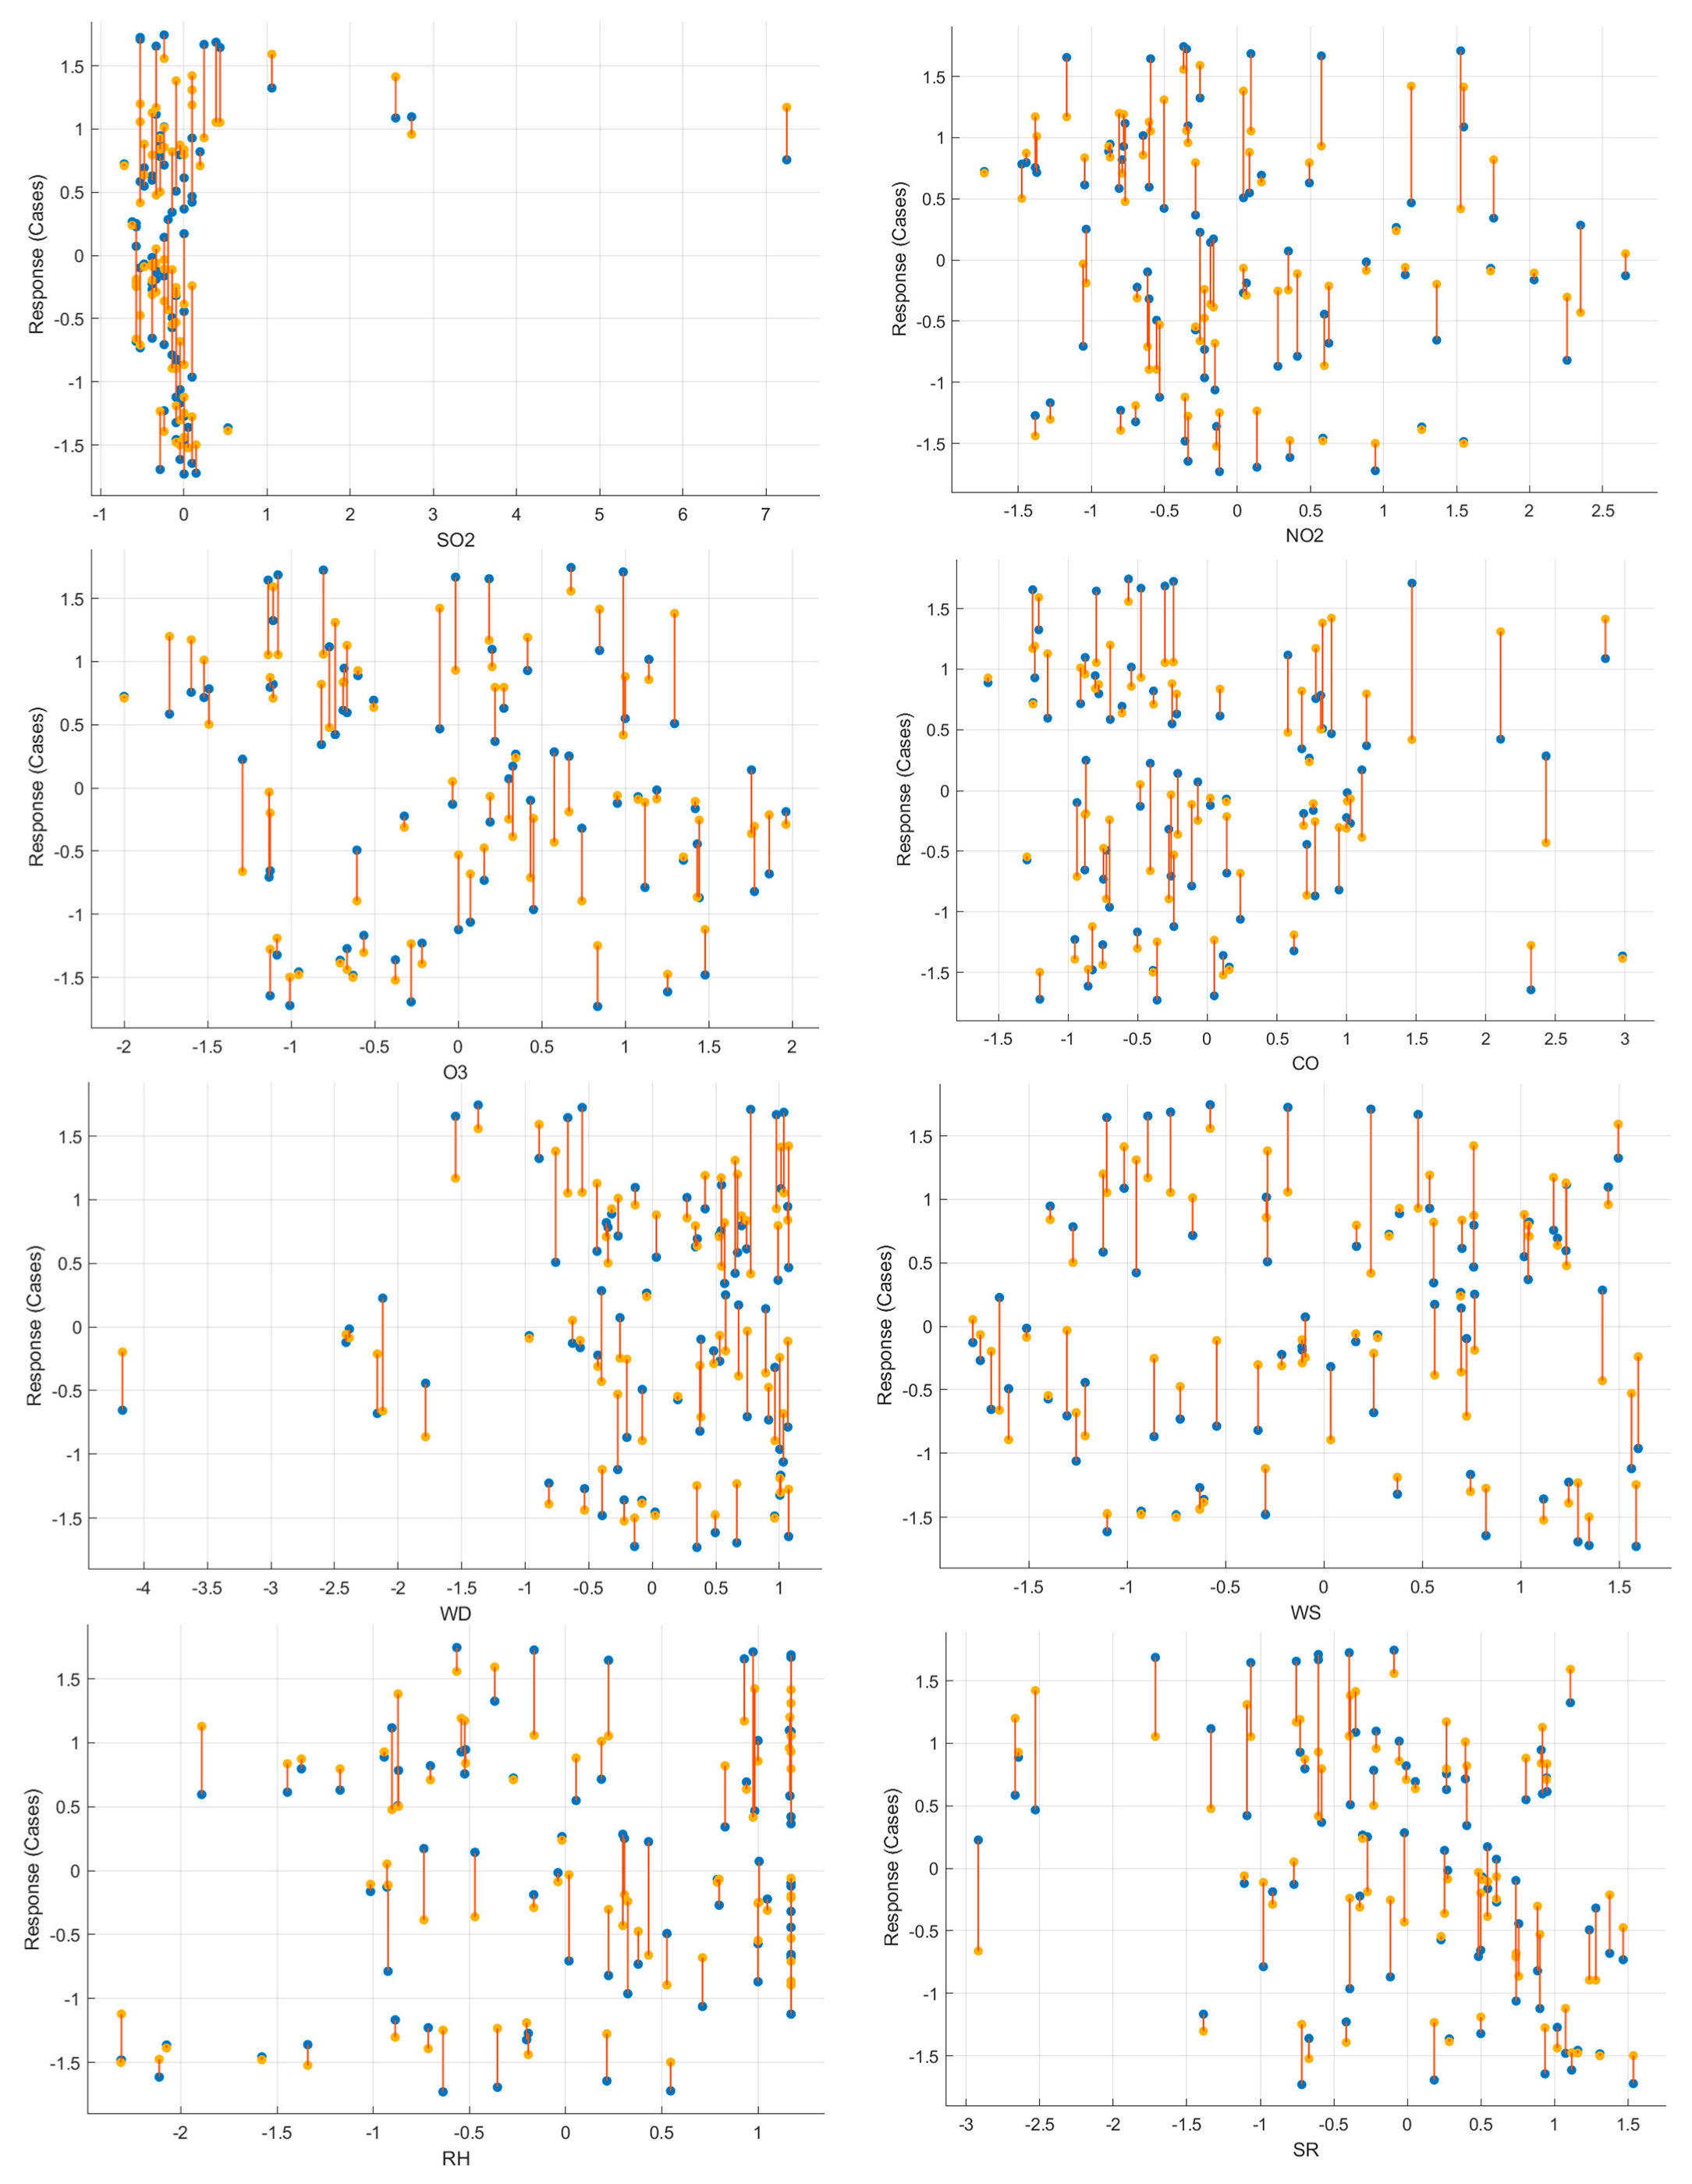
Moving on, the variables that were statistically significant at the bivariate level were analyzed at the multivariate level by applying multiple linear regression. Kuala Lumpur had six predictor variables (PM10, PM2.5, NO2, WS, RH, and SR), whereas Selangor had five predictor variables (PM10, PM2.5, NO2, O3, and SR). Only variables with a significant p < 0.05 were selected from this model when the model was fitted with the stepwise method. Table 5 and Table 6 show variables for each region representing air quality and meteorological factor variables that were strongly linked to cumulative COVID-19 cases in Kuala Lumpur and Selangor. From the analysis, results revealed that RH was the most contributing meteorological indicator that significantly influenced the incidence of COVID-19 in Kuala Lumpur, followed by Equation (4).
Total COVID-19 cases = 2547.83 + 47.84 (RH)
For every unit (1%) increase in RH, COVID-19 cases will increase by 47.84. Beta values were significant at 0.05. VIF readings were less than five, which showed no multicollinearity concern. Additionally, 33.4% of the variance in COVID-19 cases could be explained by RH, R2 = 0.379, F (5, 70) = 8.54, p < 0.001. These findings can be presumed to have a large combined effect (f2 = 0.61), thus showing RH has a large contribution to COVID-19 cases.
As for Selangor, PM2.5 was strongly linked to cumulative COVID-19 cases. The equation is portrayed in Equation (5).
Total COVID-19 cases = 1885.26 + 13.25 (PM2.5)
For every unit (1 μg m−3) increase in PM2.5, COVID-19 cases will increase by 13.25. Beta values were significant at 0.05. VIF readings were less than five, which showed no multicollinearity concern. Moreover, 20.1% of the variance in COVID-19 cases can be explained by PM2.5, R2 = 0.244, F (4, 71) = 5.72, p < 0.001. A combined effect of this magnitude can be considered large (f2 = 0.73); hence, PM2.5 has a huge influence on COVID-19 cases. However, several factors that were not considered in this study might influence the incidence of COVID-19.
Our findings demonstrated a link between COVID-19 cumulative cases, air contaminants, meteorological factors, and their relationships. This scientific study supports the evidence that chronic illnesses are linked to environmental pollution, particularly in urban areas. Air pollution is a well-known contributor to chronic inflammation, resulting in an overactive innate immune system [7]. Long-term air pollution exposure can lead to persistent immune system disturbances [56]. It may result in a weakened circulatory and respiratory viral invasion, thus increasing the risk of the severe outcome of COVID-19 [7].
In our study, the correlation test showed that air pollutant parameters PM10, PM2.5, NO2, and O3 had positively significant correlations with COVID-19 cumulative cases. Results from our study are comparable with those from a prior investigation that revealed a positive relationship between cumulative COVID-19 cases and O3 in China [9]. Moreover, a study discovered that a rise in the long-term O3 average is linked to COVID-19 mortality and morbidity [54].
On the other hand, our findings were contrasted with findings from previous studies by Sahoo et al. [57] in India, Zhu et al. [8] in China, and Bashir et al. [58] in California, who reported that the air pollutants (PM10, PM2.5, and NO2) were negatively and significantly correlated with COVID-19 cases; another study reported that O3 was negatively correlated with daily COVID-19 cases [59].
PM2.5 and PM10 have been related to several health effects, including inflammatory responses, oxidative damage, DNA damage, and respiratory, cardiovascular, and nervous system problems [60]. PM2.5 impairs bronchial immunity and affects the integrity of the epithelial cells [61], and these events reduce the capacity of the antibodies to combat viruses and increase susceptibility to respiratory diseases. Hence, the current findings regarding the positive correlation between cumulative COVID-19 cases and both particulate matter components (PM2.5 and PM10) are consistent with the report in Millan, Italy [60]. The researchers also found a positive correlation between PM2.5 and PM10 and daily cases of COVID-19. The presence of atmospheric PM can serve as a means of transportation for viruses, facilitating their spread in aerosol form and creating an environment that is conducive to their survival. This is because PM10 and PM2.5 can be inhaled, along with any associated microorganisms. Studies have shown that particle concentration and dimension can have a significant impact on the composition and concentration of microbial communities. When particles are inhaled, particularly those smaller than 2.5 microns, such as PM2.5 and UFPs, they can penetrate deep into the lungs, allowing viruses to develop within the respiratory tract and cause infections.
It has been proven that NO2, SO2, and CO emissions are connected to an increased prevalence of lung and cardiovascular disease infections [62]. Nonetheless, the present findings reflect no significant correlation between CO and SO2 and the cumulative cases of COVID-19. Meanwhile, positive correlations were found between cumulative COVID-19 cases and NO2, aligning with research conducted in China and Italy [8,63]. Furthermore, a study in England shows that exposure to such pollutants could prevent pulmonary antimicrobial responses, limiting virus clearance from the lungs and increasing infectivity [54]. They also stated that 3.3% of cases and 3.1% of deaths were linked to an increase of 1 mg m−3 of NO2 concentration in 2018.
Moving on to susceptibility to diseases from air pollution exposure, demonstrated how chronic exposure to air pollutants can cause respiratory symptoms and lead to COVID-19 infection [64]. This study revealed that the expression level of Angiotensin-Converting Enzyme 2 (ACE-2) in the alveolar cells of the lungs is a strong determinant of the different categories of severity exhibited by COVID-19 patients. These could range from being asymptomatic to mildly symptomatic to severely symptomatic if the ACE-2 in the aforementioned location is low (↑), moderate (↑↑), or high (↑↑↑) for NO2, PM2.5, and NOX, respectively. Exposure to these air pollutants may contribute to low host defenses and immunity, increase susceptibility to diseases, and cause a high viral load of the SARS-CoV-2 virus.
In addition, meteorological factors are considered influential determinants for viability, transmission, and range of virus transmission [65,66]. These meteorological indicators can also impact droplet stability in the environment or virus survival; hence, they influence coronavirus transmission [10]. From our findings, the meteorological factors of WS, RH, and RH were correlated with cumulative COVID-19 cases in Kuala Lumpur and Selangor. A study from Jordan discovered a higher infection rate with low levels of WS, RH, and SR, thus promoting the coronavirus’s survival [67].
In this study, a moderately positive correlation was detected between the cumulative COVID-19 cases and RH (r = 0.494, p < 0.001), indicating that the cases increased positively with an increment in RH. Our findings are consistent with those of researchers in India [68], who demonstrated that cumulative cases increased rapidly with RH. Similarly, previous studies in Singapore and Thailand, which are neighboring countries of Malaysia, had shown significant positive correlations between RH and daily COVID-19 cases [9,69]. However, a group of researchers found a negative association between RH and daily new COVID-19 cases [70]. Based on the findings from these tropical nations, it can be concluded that high RH supported COVID-19 spread in tropical nations, such as Malaysia, Singapore, and Thailand, but not in colder regions, such as Europe and the United States of America, as previously stated by Suhaimi et al. [55].
Moving on with our findings on another meteorological indicator. SR had a weak negative correlation with COVID-19 cases in Kuala Lumpur (r = −0.368, p = 0.001) and Selangor (r = −0.249, p = 0.030). These findings implied that the number of confirmed cases was reduced with SR. Moreover, these outcomes may be due to our study period because there was a monsoon season that caused the cloud to cover the sun and led to decreasing SR concentration (Figure 4j and 5j). UV rays, especially in the summer period, might be vital for the prevention of COVID-19 transmission given their deleterious effects on a variety of viruses such as SARS and MERS [71].
Furthermore, a study identified that the growth of SARS-CoV-2 can be promoted by lower UV rays [72]. In another study in Jordan, the researchers established an adverse correlation between SR and COVID-19 cases and discovered that SR plays a crucial role in COVID-19 outbreaks, which matched our findings [67]. Overall, meteorological factors contributed more to SARS-CoV-2 transmission in regions and months with colder and drier conditions and lower UV radiation than in regions and months with warmer, wetter seasons and higher UV radiation levels, as previously claimed by [73].
Negative correlations were detected between the cumulative COVID-19 cases and WS in Kuala Lumpur (r = −0.311, p = 0.006), but such an association was lacking in Selangor. Our findings in Kuala Lumpur were in agreement with the outcomes reported by Alkhowailed et al. [74], who reported a negative relationship between WS and the incidence of COVID-19. They also claimed that WS influenced COVID-19 transmission in cities with a high population, which could be due to a low WS in these areas, favoring the spread of the SARS-COV-2 virus among persons living near congested areas as compared to areas with a higher WS. Our findings on WS in Selangor found no significant correlation with COVID-19 cases, although the relationship was positive, which was in line with a previous study in Africa [75]. On days when AT was cooler, increased WS might cause people to remain indoors, reducing the spread of COVID-19 [76].

3.4. Boosted Tree Prediction

In this study, the impact of air quality and meteorological factors on COVID-19 cases was accessed using the machine learning method. The model’s performance is evaluated at various leaf sizes, learners, and learning rates. As shown in Table 7, it is found that the BT method for this investigation is best at the seven leaf size with Principal Component Analysis (PCA) disabled, 30 learners, and a 0.2 learning rate. Figure 7 shows the response plot of the predictors and response (COVID-19 cases) variables. The plotted response indicates the outcomes of the regression model. By employing cross-validation, these predictions are made on unseen data points. In simpler terms, each prediction is generated by a model that was trained without incorporating the relevant observation. Figure 8 shows the plot of the predicted versus actual data, followed by Figure 9, where the residual plot is shown. The residual plot shows the difference between the predicted response and the true response. It can be seen from the figure that the residual errors fall between 1 and -1 and are scattered around 0. The outliers are not visible, and there are no significant changes between the data on the x-axis, which suggests an acceptable prediction model. Finally, using the BT regression model, the COVID-19 cases in Selangor were forecast. The forecasted COVID-19 cases found that the RMSE, R2, MAE, and MSE were 0.47, 0.77, 0.39, and 0.22, respectively, as shown in Table 8. R2 has become a commonly used metric for evaluating regression analyses in different scientific fields because of its ability to provide accurate and informative information [77]. An R2 value higher than 0.75 is considered substantial, indicating that the model is the best fit for predicting COVID-19 cases [78]. The BT regression model was utilized to estimate the COVID-19 cases at Selangor Station by considering the air quality and meteorological data of the region. Figure 9 illustrates a comparison between the predicted cases and the actual cases recorded at Selangor Station. The graph shows that the predicted cases follow a similar trend to the actual cases, although the actual cases exhibit some variability not captured by the model. Nevertheless, the fact that the predicted cases track the actual cases quite closely suggests that the BT regression model was successful in forecasting COVID-19 cases in Selangor using air quality and meteorological data. Overall, this study demonstrates that environmental factors can be used to predict the spread of COVID-19 in a given region, which could be useful for policymakers in implementing targeted interventions to control the spread of the virus.

3.5. Limitations

Despite the findings highlighted in this study, it has limitations. First, the study only considered two major locations (Kuala Lumpur and Selangor), thereby leading to some outcomes that were different from the real influence of meteorological factors and ambient pollution on the transmission of the novel SARS-CoV-2 in Malaysia. Second, there was only one station studied for the whole state. More data and relationships could be explored if more stations were included in this study. Third, the data on air quality parameters and meteorological factors were only studied for 11 weeks to compare when COVID-19 was absent and when COVID-19 was present. By lengthening the study period, better results could represent the year without COVID-19 and with COVID-19. Fourth, the ecological study design used in this research may contain an ecological fallacy. Individual-level data on air pollutant exposure and coexisting health conditions were not collected, resulting in limited assumptions for group-level analysis of the available data.
These limitations need to be addressed in future studies involving cohort groups in which factors such as gender, age, occupation, underlying conditions, and high-risk or vulnerable groups are considered in the Malaysian context. Examples of high-risk individuals include those with tuberculosis, cardiovascular diseases, diabetes, asthma, and chronic obstructive pulmonary disease. Chronic exposure to polluted air can lead to a compromised immune system; hence, the affected individuals will be more susceptible to any kind of respiratory disease, including COVID-19. Moreover, changes in the SARS-CoV-2 virus have been detected over time and need more study, particularly on its transmission as it is related to the environment, such as meteorological factors.
Considering the potential effects of air pollution, it could be considered a confounding factor in the association between close interaction among people, population density, and eating and drinking behaviors. Air pollution can weaken the respiratory and immune systems, which may heighten the vulnerability of individuals to infectious diseases such as COVID-19. Additionally, people living in areas with high levels of air pollution might be more likely to spend time indoors or in overcrowded spaces, amplifying the risk of transmission. Therefore, when studying the relationship between close interactions between people, it is important to consider the potential confounding effects of air pollution. This may involve controlling for air pollution levels in the analysis or conducting stratified analyses based on air pollution levels. By taking into account the potential effects of air pollution, researchers can better understand the true relationship between these factors and develop appropriate interventions to prevent the spread of infectious diseases.

4. Conclusions

In conclusion, this study highlights the significant correlation between air pollution, meteorological parameters, and COVID-19 cases in Malaysia. PM2.5, PM10, NO2, O3, RH, WS, and RH were found to be significantly correlated with COVID-19 cases. The findings also indicate that COVID-19 cases were positively correlated with O3, NO2, RH, PM10, and PM2.5 but negatively correlated with SR and WS. The use of the BT regression model in forecasting COVID-19 cases in Selangor was successful, with an R2 value of 0.77 indicating substantial accuracy. Although the actual cases exhibited some variability not captured by the model, the predicted cases tracked the actual cases closely, suggesting that the model was effective in forecasting COVID-19 cases in Selangor using air quality and meteorological data.
This study could provide valuable insights for future research in countries with similar climates and population densities. However, preventive measures, such as handwashing, sanitization, and physical distancing, are still crucial during the epidemic phase. Wearing masks and getting vaccinated against COVID-19 is also highly recommended to increase herd immunity and prevent the severe impacts of COVID-19. The findings of this study could benefit policymakers in developing a better systematic policy for Malaysia based on pollution sources and mitigation measures to improve air quality. Integrated efforts to control emissions and minimize exposure to air pollutants can improve human health in general and alleviate the public health burden of COVID-19 specifically. The Malaysian government’s COVID-19 mitigation measures had a significant impact on air pollutant concentrations in the country. Reduced human activities, vehicle emissions, industrial emissions, and coal-fired power plant emissions were the main factors that led to cleaner air during the MCO period. This study’s results enable the government to devise systematic policies that take into account the pollution sources and characteristics of pollutants. One such policy could be to encourage the use of cleaner alternatives and new vehicle technology, given the positive trend in air quality observed during the MCO period due to the reduced number of vehicles. Local authorities can also adopt their own measures to reduce air pollution on a smaller scale, which can be extended to a larger scale over time. In general, this study underscores the need for ongoing efforts to reduce air pollution in Malaysia and the potential advantages of implementing emission reduction policies over the long term.

Author Contributions

Conceptualization, J.J.; methodology, J.J. and N.F.S.; software, J.J.; & W.N.W.M.; validation, J.J.; N.F.S., and N.A.A.; formal analysis, J.J.; N.F.S. and W.N.W.M.; investigation, J.J. and N.A.A.; resources, J.J.; data curation, J.J.; N.F.S. writing—original draft preparation, J.J., N.F.S. and N.A.A.; writing—review and editing, J.J. & H.-R.C.; visualization, J.J. & W.N.W.M.; supervision, J.J. project administration, J.J.; funding acquisition, J.J. All authors have read and agreed to the published version of the manuscript.

Funding

This research was funded by the Ministry of Higher Education Malaysia under the Fundamental Research Grant Scheme (FRGS) project (Project Code: FRGS/1/2019/SKK06/UPM/02/6).

Institutional Review Board Statement

Not applicable.

Informed Consent Statement

Not applicable.

Data Availability Statement

Acknowledgments

The authors would like to thank Mashitah Darus and Ezahtulsyahreen Ab Rahman from the Air Division, Department of Environment, Ministry of Environment and Water, Malaysia, for providing us with the raw data in both monitoring stations for our study, and the Ministry of Health, Malaysia, for providing accessible information on COVID-19 on their website.

Conflicts of Interest

The authors declare no conflict of interest.

References

  1. WHO. Coronavirus Disease (COVID-19) Situation Report-114. Available online: https://www.who.int/docs/default-source/coronaviruse/situation-reports/20200513-covid-19-sitrep-114.pdf?sfvrsn=17ebbbe_4 (accessed on 14 May 2020).
  2. Shakil, M.H.; Munim, Z.H.; Tasnia, M.; Sarowar, S. COVID-19 and the Environment: A Critical Review and Research Agenda. Sci. Total Environ. 2020, 745, 141022. [Google Scholar] [CrossRef]
  3. Fehr, A.R.; Perlman, S. Coronaviruses: An Overview of Their Replication and Pathogenesis. In Coronaviruses: Methods and Protocols; Springer: New York, NY, USA, 2015; Volume 1282, pp. 1–23. ISBN 9781493924387. [Google Scholar]
  4. Elengoe, A. COVID-19 Outbreak in Malaysia. Osong Public Health Res. Perspect. 2020, 11, 93–100. [Google Scholar] [CrossRef]
  5. Manisalidis, I.; Stavropoulou, E.; Stavropoulos, A.; Bezirtzoglou, E. Environmental and Health Impacts of Air Pollution: A Review. Front. Public Health 2020, 8, 14. [Google Scholar] [CrossRef] [Green Version]
  6. Genc, S.; Zadeoglulari, Z.; Fuss, S.H.; Genc, K. The Adverse Effects of Air Pollution on the Nervous System. J. Toxicol. 2012, 2012, 782462. [Google Scholar] [CrossRef] [Green Version]
  7. Conticini, E.; Frediani, B.; Caro, D. Can Atmospheric Pollution Be Considered a Co-Factor in Extremely High Level of SARS-CoV-2 Lethality in Northern Italy? Environ. Pollut. 2020, 261, 114465. [Google Scholar] [CrossRef]
  8. Zhu, Y.; Xie, J.; Huang, F.; Cao, L. Association between Short-Term Exposure to Air Pollution and COVID-19 Infection: Evidence from China. Sci. Total Environ. 2020, 727, 138704. [Google Scholar] [CrossRef]
  9. Pani, S.K.; Lin, N.H.; RavindraBabu, S. Association of COVID-19 Pandemic with Meteorological Parameters over Singapore. Sci. Total Environ. 2020, 740, 140112. [Google Scholar] [CrossRef]
  10. Chen, B.; Liang, H.; Yuan, X.; Hu, Y.; Xu, M.; Zhao, Y.; Zhang, B.; Tian, F.; Zhu, X. Roles of Meteorological Conditions in COVID-19 Transmission on a Worldwide Scale. BMJ Open 2003, preprint. [Google Scholar] [CrossRef] [Green Version]
  11. Ma, Y.; Zhao, Y.; Liu, J.; He, X.; Wang, B.; Fu, S.; Yan, J.; Niu, J.; Zhou, J.; Luo, B. Effects of Temperature Variation and Humidity on the Death of COVID-19 in Wuhan, China. Sci. Total Environ. 2020, 724, 138226. [Google Scholar] [CrossRef]
  12. Sahoo, P.K.; Powell, M.A.; Mittal, S.; Garg, V.K. Is the Transmission of Novel Coronavirus Disease (COVID-19) Weather Dependent? J. Air Waste Manag. Assoc. 2020, 70, 1061–1064. [Google Scholar] [CrossRef]
  13. Wu, Z.; McGoogan, J.M. Characteristics of and Important Lessons from the Coronavirus Disease 2019 (COVID-19) Outbreak in China: Summary of a Report of 72314 Cases from the Chinese Center for Disease Control and Prevention. JAMA-J. Am. Med. Assoc. 2020, 323, 1239–1242. [Google Scholar] [CrossRef]
  14. Rudke, A.P.; de Almeida, D.S.; Alves, R.A.; Beal, A.; Martins, L.D.; Martins, J.A.; Hallak, R.; de Almeida Albuquerque, T.T. Impacts of Strategic Mobility Restrictions Policies during 2020 COVID-19 Outbreak on Brazil’s Regional Air Quality. Aerosol Air Qual. Res. 2022, 22, 210351. [Google Scholar] [CrossRef]
  15. Zaręba, M.; Danek, T. Analysis of Air Pollution Migration during COVID-19 Lockdown in Krakow, Poland. Aerosol Air Qual. Res. 2022, 22, 210275. [Google Scholar] [CrossRef]
  16. Abdullah, S.; Mansor, A.A.; Napi, N.N.L.M.; Mansor, W.N.W.; Ahmed, A.N.; Ismail, M.; Ramly, Z.T.A. Air Quality Status during 2020 Malaysia Movement Control Order (MCO) Due To 2019 Novel Coronavirus (2019-NCoV) Pandemic. Sci. Total Environ. 2020, 729, 139022. [Google Scholar] [CrossRef]
  17. Waring, J.; Lindvall, C.; Umeton, R. Automated Machine Learning: Review of the State-of-the-Art and Opportunities for Healthcare. Artif. Intell. Med. 2020, 104, 101822. [Google Scholar] [CrossRef]
  18. Varad, R. Thalkar Customer Segmentation Using Machine Learning. Int. J. Sci. Res. Comput. Sci. Eng. Inf. Technol. 2021, 29–37. [Google Scholar] [CrossRef]
  19. Rachman, F.P.; Santoso, H.; Djajadi, A. Machine Learning Mini Batch K-Means and Business Intelligence Utilization for Credit Card Customer Segmentation. Int. J. Adv. Comput. Sci. Appl. 2021, 12, 218–227. [Google Scholar] [CrossRef]
  20. Razali, N.A.M.; Shamsaimon, N.; Ishak, K.K.; Ramli, S.; Amran, M.F.M.; Sukardi, S. Gap, Techniques and Evaluation: Traffic Flow Prediction Using Machine Learning and Deep Learning. J. Big Data 2021, 8, 152. [Google Scholar] [CrossRef]
  21. Bouabdallaoui, Y.; Lafhaj, Z.; Yim, P.; Ducoulombier, L.; Bennadji, B. Predictive Maintenance in Building Facilities: A Machine Learning-Based Approach. Sensors 2021, 21, 1044. [Google Scholar] [CrossRef]
  22. Nurdiyana Wan Mansor, W.; Abdullah, S.; Ashraf Razali, N.; Albani, A.; Ramli, A.; Olsen, D. Prediction of Emissions of a Dual Fuel Engine with Artificial Neural Network (ANN). In IOP Conference Series: Earth and Environmental Science; IOP Publishing: Bristol, UK, 2019; Volume 373. [Google Scholar]
  23. Grimaldo, A.I.; Novak, J. Combining Machine Learning with Visual Analytics for Explainable Forecasting of Energy Demand in Prosumer Scenarios. Procedia Comput. Sci. 2020, 175, 525–532. [Google Scholar] [CrossRef]
  24. Abdulrahman, M.L.; Ibrahim, K.M.; Gital, A.Y.; Zambuk, F.U.; Ja′Afaru, B.; Yakubu, Z.I.; Ibrahim, A. A Review on Deep Learning with Focus on Deep Recurrent Neural Network for Electricity Forecasting in Residential Building. Procedia Comput. Sci. 2021, 193, 141–154. [Google Scholar] [CrossRef]
  25. al Alkeem, E.; Kim, S.K.; Yeun, C.Y.; Zemerly, M.J.; Poon, K.F.; Gianini, G.; Yoo, P.D. An Enhanced Electrocardiogram Biometric Authentication System Using Machine Learning. IEEE Access 2019, 7, 123069–123075. [Google Scholar] [CrossRef]
  26. Kim, S.K.; Yeun, C.Y.; Yoo, P.D. An Enhanced Machine Learning-Based Biometric Authentication System Using RR-Interval Framed Electrocardiograms. IEEE Access 2019, 7, 168669–168674. [Google Scholar] [CrossRef]
  27. Stirnberg, R.; Cermak, J.; Fuchs, J.; Andersen, H. Mapping and Understanding Patterns of Air Quality Using Satellite Data and Machine Learning. J. Geophys. Res. Atmos. 2020, 125, e2019JD031380. [Google Scholar] [CrossRef]
  28. Abdullah, S.; Napi, N.N.L.M.; Ahmed, A.N.; Mansor, W.N.W.; Mansor, A.A.; Ismail, M.; Abdullah, A.M.; Ramly, Z.T.A. Development of Multiple Linear Regression for Particulate Matter (PM10) Forecasting during Episodic Transboundary Haze Event in Malaysia. Atmosphere 2020, 11, 289. [Google Scholar] [CrossRef] [Green Version]
  29. Abdullah, S.; Ismail, M.; Fong, S.Y. Multiple Linear Regression (MLR) Models for Long Term PM10 Concentration Forecasting During Different Monsoon Seasons. J. Sustain. Sci. Manag. 2017, 12, 60–69. [Google Scholar]
  30. Othman, M.; Latif, M.T. Air Pollution Impacts from COVID-19 Pandemic Control Strategies in Malaysia. J. Clean Prod. 2021, 291, 125992. [Google Scholar] [CrossRef]
  31. Awang, N.R.; Elbayoumi, M.; Ramli, N.A.; Yahaya, A.S. Diurnal Variations of Ground-Level Ozone in Three Port Cities in Malaysia. Air Qual. Atmos. Health 2015, 9, 25–39. [Google Scholar] [CrossRef]
  32. Latif, M.T.; Dominick, D.; Ahamad, F.; Khan, M.F.; Juneng, L.; Hamzah, F.M.; Nadzir, M.S.M. Long Term Assessment of Air Quality from a Background Station on the Malaysian Peninsula. Sci. Total Environ. 2014, 482–483, 336–348. [Google Scholar] [CrossRef]
  33. Awang, N.; Ramli, N.; Yahaya, A.; Elbayoumi, M. Multivariate Methods to Predict Ground Level Ozone During Daytime, Nighttime, and Critical Conversion Time in Urban Areas. Atmos. Pollut. Res. 2015, 6, 726–734. [Google Scholar] [CrossRef]
  34. Banan, N.; Latif, M.T.; Juneng, L.; Ahamad, F. Characteristics of Surface Ozone Concentrations at Stations with Different Backgrounds in the Malaysian Peninsula. Aerosol Air Qual. Res. 2013, 13, 1090–1106. [Google Scholar] [CrossRef] [Green Version]
  35. Ministry of Health Malaysia DG of Health Press Statement 22 April 2020–Current Situation of Coronavirus Infection 2019 (COVID-19) in Malaysia. Available online: https://kpkesihatan.com/2020/04/22/kenyataan-akhbar-kpk-22-april-2020-situasi-semasa-jangkitan-penyakit-coronavirus-2019-covid-19-di-malaysia (accessed on 14 May 2022).
  36. Dutheil, F.; Baker, J.S.; Navel, V. COVID-19 as a Factor Influencing Air Pollution? Environ. Pollut. 2020, 263, 114466. [Google Scholar] [CrossRef] [PubMed]
  37. Liu, J.; Zhou, J.; Yao, J.; Zhang, X.; Li, L.; Xu, X.; He, X.; Wang, B.; Fu, S.; Niu, T.; et al. Impact of Meteorological Factors on the COVID-19 Transmission: A Multi-City Study in China. Sci. Total Environ. 2020, 726, 138513. [Google Scholar] [CrossRef] [PubMed]
  38. Usmani, R.S.A.; Saeed, A.; Abdullahi, A.M.; Pillai, T.R.; Jhanjhi, N.Z.; Hashem, I.A.T. Air Pollution and Its Health Impacts in Malaysia: A Review. Air Qual. Atmos. Health 2020, 13, 1093–1118. [Google Scholar] [CrossRef]
  39. Zambrano-Monserrate, M.A.; Ruano, M.A.; Sanchez-Alcalde, L. Indirect Effects of COVID-19 on the Environment. Sci. Total Environ. 2020, 728, 138813. [Google Scholar] [CrossRef]
  40. Muhammad, S.; Long, X.; Salman, M. COVID-19 Pandemic and Environmental Pollution: A Blessing in Disguise? Sci. Total Environ. 2020, 728, 138820. [Google Scholar] [CrossRef]
  41. Wang, Q.; Su, M. A Preliminary Assessment of the Impact of COVID-19 on Environment—A Case Study of China. Sci. Total Environ. 2020, 728, 138915. [Google Scholar] [CrossRef]
  42. Dantas, G.; Siciliano, B.; França, B.B.; da Silva, C.M.; Arbilla, G. The Impact of COVID-19 Partial Lockdown on the Air Quality of the City of Rio de Janeiro, Brazil. Sci. Total Environ. 2020, 729, 139085. [Google Scholar] [CrossRef]
  43. Mahato, S.; Pal, S.; Ghosh, K.G. Effect of Lockdown amid COVID-19 Pandemic on Air Quality of the Megacity Delhi, India. Sci. Total Environ. 2020, 730, 139086. [Google Scholar] [CrossRef]
  44. Lefohn, A.S.; Malley, C.S.; Simon, H.; Wells, B.; Xu, X.; Zhang, L.; Wang, T. Responses of Human Health and Vegetation Exposure Metrics to Changes in Ozone Concentration Distributions in the European Union, United States, and China. Atmos. Environ. 2017, 152, 123–145. [Google Scholar] [CrossRef] [Green Version]
  45. Paoletti, E.; De Marco, A.; Beddows, D.C.S.; Harrison, R.M.; Manning, W.J. Ozone Levels in European and USA Cities Are Increasing More than at Rural Sites, While Peak Values Are Decreasing. Environ. Pollut. 2014, 192, 295–299. [Google Scholar] [CrossRef]
  46. Tiwari, S.; Dahiya, A.; Kumar, N. Investigation into Relationships among NO, NO2, NOx, O3, and CO at an Urban Background Site in Delhi, India. Atmos. Res. 2015, 157, 119–126. [Google Scholar] [CrossRef]
  47. Wang, Y.; Ying, Q.; Hu, J.; Zhang, H. Spatial and Temporal Variations of Six Criteria Air Pollutants in 31 Provincial Capital Cities in China during 2013–2014. Environ. Int. 2014, 73, 413–422. [Google Scholar] [CrossRef] [PubMed]
  48. Fang, X.; Xiao, H.; Sun, H.; Liu, C.; Zhang, Z.; Xie, Y.; Liang, Y.; Wang, F. Characteristics of Ground-Level Ozone from 2015 to 2018 in BTH Area, China. Atmosphere 2020, 11, 130. [Google Scholar] [CrossRef] [Green Version]
  49. Sharma, S.; Zhang, M.; Anshika; Gao, J.; Zhang, H.; Kota, S.H. Effect of Restricted Emissions during COVID-19 on Air Quality in India. Sci. Total Environ. 2020, 728, 138878. [Google Scholar] [CrossRef] [PubMed]
  50. Tobías, A.; Carnerero, C.; Reche, C.; Massagué, J.; Via, M.; Minguillón, M.C.; Alastuey, A.; Querol, X. Changes in Air Quality During the Lockdown in Barcelona (Spain) One Month into The SARS-CoV-2 Epidemic. Sci. Total Environ. 2020, 726, 138540. [Google Scholar] [CrossRef]
  51. Mohd Nadzir, M.S.; Ooi, M.C.G.; Alhasa, K.M.; Abu Bakar, M.A.; Ahmad Mohtar, A.A.; Mohd Nor, M.F.F.; Latif, M.T.; Abd Hamid, H.H.; Md Ali, S.H.; Mohd Ariff, N.; et al. The Impact of Movement Control Order (MCO) during Pandemic COVID-19 on Local Air Quality in an Urban Area of Klang Valley, Malaysia. Aerosol Air Qual. Res. 2020, 20, 1237–1248. [Google Scholar] [CrossRef]
  52. Otmani, A.; Benchrif, A.; Tahri, M.; Bounakhla, M.; Chakir, E.M.; El Bouch, M.; Krombi, M. Impact of Covid-19 Lockdown on PM10, SO2 and NO2 Concentrations in Salé City (Morocco). Sci. Total Environ. 2020, 735, 139541. [Google Scholar] [CrossRef]
  53. CDC. Symptoms of Coronavirus. Available online: https://www.cdc.gov/coronavirus/2019-ncov/symptoms-testing/symptoms.html (accessed on 4 May 2020).
  54. Travaglio, M.; Yu, Y.; Popovic, R.; Selley, L.; Leal, N.S.; Martins, L.M. Links between Air Pollution and COVID-19 in England. Environ. Pollut. 2021, 268, 115859. [Google Scholar] [CrossRef]
  55. Suhaimi, N.; Jalaludin, J.; Latif, M. Demystifying A Possible Relationship between COVID-19, Air Quality and Meteorological Factors: Evidence from Kuala Lumpur, Malaysia. Aerosol Air Qual. Res. 2020, 20, 1520–1529. [Google Scholar] [CrossRef]
  56. Tsai, D.H.; Riediker, M.; Berchet, A.; Paccaud, F.; Waeber, G.; Vollenweider, P.; Bochud, M. Effects of Short- and Long-Term Exposures to Particulate Matter on Inflammatory Marker Levels in the General Population. Environ. Sci. Pollut. Res. 2019, 26, 19697–19704. [Google Scholar] [CrossRef] [PubMed]
  57. Sahoo, P.K.; Mangla, S.; Pathak, A.K.; Salãmao, G.N.; Sarkar, D. Pre-to-Post Lockdown Impact on Air Quality and The Role of Environmental Factors in Spreading the COVID-19 Cases—A Study from A Worst-Hit State of India. Int. J. Biometeorol. 2021, 65, 205–222. [Google Scholar] [CrossRef] [PubMed]
  58. Bashir, M.F.; MA, B.J.; Bilal; Komal, B.; Bashir, M.A.; Farooq, T.H.; Iqbal, N.; Bashir, M. Correlation between Environmental Pollution Indicators and COVID-19 Pandemic: A Brief Study in Californian Context. Environ. Res. 2020, 187, 109652. [Google Scholar] [CrossRef] [PubMed]
  59. Lorenzo, J.S.L.; Tam, W.W.S.; Seow, W.J. Association between Air Quality, Meteorological Factors and COVID-19 Infection Case Numbers. Environ. Res. 2021, 197, 111024. [Google Scholar] [CrossRef]
  60. Zoran, M.A.; Savastru, R.S.; Savastru, D.M.; Tautan, M.N. Assessing the Relationship between Surface Levels of PM2.5 and PM10 Particulate Matter Impact on COVID-19 in Milan, Italy. Sci. Total Environ. 2020, 738, 139825. [Google Scholar] [CrossRef]
  61. Jiang, Y.; Wu, X.J.; Guan, Y.J. Effect of Ambient Air Pollutants and Meteorological Variables on COVID-19 Incidence. Infect. Control Hosp. Epidemiol. 2020, 41, 1011–1015. [Google Scholar] [CrossRef]
  62. Arphorn; Ishimaru; Hara; Mahasandana Considering the Effects of Ambient Particulate Matter on The Lung Function of Motorcycle Taxi Drivers in Bangkok, Thailand. J. Air Waste Manag. Assoc. 2018, 68, 139–145. [CrossRef]
  63. Frontera, A.; Cianfanelli, L.; Vlachos, K.; Landoni, G.; Cremona, G. Severe Air Pollution Links to Higher Mortality in COVID-19 Patients: The “Double-Hit” Hypothesis. J. Infect. 2020, 81, 255–259. [Google Scholar] [CrossRef]
  64. Paital, B.; Agrawal, P.K. Air Pollution by NO2 and PM2.5 Explains COVID-19 Infection Severity by Overexpression of Angiotensin-Converting Enzyme 2 in Respiratory Cells: A Review. Environ. Chem. Lett. 2021, 19, 25–42. [Google Scholar] [CrossRef]
  65. Chan, K.H.; Peiris, J.S.M.; Lam, S.Y.; Poon, L.L.M.; Yuen, K.Y.; Seto, W.H. The Effects of Temperature and Relative Humidity on the Viability of the SARS Coronavirus. Adv. Virol. 2011, 2011, 734690. [Google Scholar] [CrossRef]
  66. van Doremalen, N.; Bushmaker, T.; Munster, V.J. Stability of Middle East Respiratory Syndrome Coronavirus (MERS-CoV) under Different Environmental Conditions. Eurosurveillance 2013, 18, 20590. [Google Scholar] [CrossRef] [PubMed] [Green Version]
  67. Abdelhafez, E.; Dabbour, L.; Hamdan, M. The Effect of Weather Data on the Spread of COVID-19 in Jordan. Environ. Sci. Pollut. Res. 2021, 1, 40416–40423. [Google Scholar] [CrossRef] [PubMed]
  68. Gautam, S.; Samuel, C.; Gautam, A.S.; Kumar, S. Strong Link between Coronavirus Count and Bad Air: A Case Study of India. Environ. Dev. Sustain. 2021, 23, 16632–16645. [Google Scholar] [CrossRef]
  69. Sangkham, S.; Thongtip, S.; Vongruang, P. Influence of Air Pollution and Meteorological Factors on the Spread of COVID-19 in the Bangkok Metropolitan Region and Air Quality during the Outbreak. Environ. Res. 2021, 197, 111104. [Google Scholar] [CrossRef]
  70. Wu, Y.; Jing, W.; Liu, J.; Ma, Q.; Yuan, J.; Wang, Y.; Du, M.; Liu, M. Effects of Temperature and Humidity on The Daily New Cases and New Deaths of COVID-19 in 166 Countries. Sci. Total Environ. 2020, 729, 139051. [Google Scholar] [CrossRef]
  71. Türsen, Ü.; Türsen, B.; Lotti, T. Ultraviolet and COVID-19 Pandemic. J. Cosmet. Dermatol. 2020, 19, 2162–2164. [Google Scholar] [CrossRef] [PubMed]
  72. Merow, C.; Urban, M.C. Seasonality and Uncertainty in COVID-19 Growth Rates. medRxiv 2020, 117, 27456–27464. [Google Scholar] [CrossRef] [PubMed]
  73. Ma, Y.; Pei, S.; Shaman, J.; Dubrow, R.; Chen, K. Role of Meteorological Factors in the Transmission of SARS-CoV-2 in the United States. Nat. Commun. 2021, 12, 3602. [Google Scholar] [CrossRef] [PubMed]
  74. Alkhowailed, M.; Shariq, A.; Alqossayir, F.; Alzahrani, O.A.; Rasheed, Z.; Al Abdulmonem, W. Impact of Meteorological Parameters on COVID-19 Pandemic: A Comprehensive Study from Saudi Arabia: Impact of Weather on COVID-19. Inform. Med. Unlocked 2020, 20, 100418. [Google Scholar] [CrossRef]
  75. Adekunle, I.A.; Tella, S.A.; Oyesiku, K.O.; Oseni, I.O. Spatio-Temporal Analysis of Meteorological Factors in Abating the Spread of COVID-19 in Africa. Heliyon 2020, 6, e04749. [Google Scholar] [CrossRef]
  76. Clouston, S.A.P.; Morozova, O.; Meliker, J.R. A Wind Speed Threshold for Increased Outdoor Transmission of Coronavirus: An Ecological Study. BMC Infect. Dis. 2021, 21, 1–9. [Google Scholar] [CrossRef] [PubMed]
  77. Chicco, D.; Warrens, M.J.; Jurman, G. The coefficient of determination R-squared is more informative than SMAPE, MAE, MAPE, MSE and RMSE in regression analysis evaluation. PeerJ Comput. Sci. 2021, 7, e623. [Google Scholar] [CrossRef] [PubMed]
  78. Hair, J.F.; Hult, G.T.M.; Ringle, C.M.; Sarstedt, M.; Danks, N.P.; Ray, S. Evaluation of the Structural Model. In Partial Least Squares Structural Equation Modeling (PLS-SEM) Using R. Classroom Companion: Business; Springer: Cham, Switzerland, 2021. [Google Scholar] [CrossRef]
Figure 1. Selected continuous air monitoring stations.
Atmosphere 14 00973 g001
Figure 2. Flow chart for machine learning workflow.
Atmosphere 14 00973 g002
Figure 3. Cumulative COVID-19 cases in Kuala Lumpur and Selangor from 18 March to 1 June 2020.
Atmosphere 14 00973 g003
Figure 4. Daily COVID-19 cases in Kuala Lumpur and Selangor from 18 March to 1 June 2020.
Atmosphere 14 00973 g004
Figure 5. (a) PM10 (μg m−3), (b) PM2.5 (μg m−3), (c) SO2 (ppb), (d) NO2 (ppb), (e) O3 (ppb), (f) CO (ppm), (g) WD (°) (h) WS (m s−1), (i) RH (%), (j) SR (W m−2) and (k) AT (°C) in Kuala Lumpur from 4 March 2020 (before MCO) to 1 June 2020 (during MCO).
Atmosphere 14 00973 g005
Figure 6. (a) PM10 (μg m−3), (b) PM2.5 (μg m−3), (c) SO2 (ppb), (d) NO2 (ppb), (e) O3 (ppb), (f) CO (ppm), (g) WD (°) (h) WS (m s−1), (i) RH (%), (j) SR (W m−2) and (k) AT (°C) in Selangor from 4 March 2020 (before MCO) to 1 June 2020 (during MCO).
Atmosphere 14 00973 g006
Figure 7. The relationship between a response variable and predictor variables in a dataset. Response (cases) refers to COVID-19 cases.
Atmosphere 14 00973 g007aAtmosphere 14 00973 g007bAtmosphere 14 00973 g007c
Figure 8. Relationship between the predicted and actual COVID-19 cases at Batu Muda Station.
Atmosphere 14 00973 g008
Figure 9. The predicted and actual COVID-19 cases in Selangor. The predicted cases were based on air quality and meteorological data at Selangor Station using the developed BT regression model.
Atmosphere 14 00973 g009
Table 1. Parameters for the development of the BT model.
ParameterValue
PredictorsMonth, PM10, PM2.5, SO2, NO2, O3, CO, WD, WS, RH, SR, AT
ResponseCOVID-19 cases
Number of observations76
Validation methodCross-Validation 10-fold
Number of learners50
Minimum leaf size4
Learning rate0.2
Table 2. Descriptive statistics and differences analysis of air pollutants and meteorological data in Kuala Lumpur.
VariablesYearMinMaxMeanSDMedianIQRt or Zpd or r
PM10 (µg m−3) b201924.38100.152.0514.8950.2318.55−2.4490.014 *0.28
202018.9394.0644.6915.6741.7322.74
PM2.5 (µg m−3) b201916.9175.6939.8012.2338.2915.90−1.5580.1190.18
202015.45309.140.0234.2635.3316.81
SO2 (ppb) b20190.50017.102.0842.3061.5500.800−5.867<0.001 *0.67
20200.3002.5001.0420.4110.9500.700
NO2 (ppb) b201913.8037.3030.359.75628.3512.97−7.181<0.001 *0.82
20205.20056.6013.976.36612.009.300
O3 (ppb) a201912.1079.2045.1616.6845.5524.900.9750.3320.16
20201.40075.8042.6215.6344.4522.32
CO (ppm) b20191.1402.9151.7470.3801.6640.585−6.762<0.001 *0.78
20200.6202.5001.1520.3071.1130.300
WD (°) b2019218.3359.8328.427.69331.633.51−2.1070.035 *0.24
202092.52358.9307.358.63329.049.06
WS (m s−1) b20191.2408.6205.0702.1605.3483.660−3.666<0.001 *0.42
20200.8708.5303.7022.0433.1123.550
RH (%)b201979.0798.0092.035.33792.689.100−3.0710.002 *0.35
202086.5298.4094.093.60094.555.320
SR (W m−2) b2019378.5886.8705.0112.4716.2148.9−5.954<0.001 *0.68
2020138.6784.4564.5124.8597.7149.1
AT (°C) b201932.3536.3734.481.06534.601.700−0.9580.3380.11
202028.7736.9434.601.34734.811.360
a = paired t-test; b = Wilcoxon signed rank test; * significant at p < 0.05.
Table 3. Descriptive statistics and differences analysis of air pollutants and meteorological data in Selangor.
VariablesYearMinMaxMeanSDMedianIQRt or Zpd or r
PM10 (µg m−3) b201932.51125.255.4417.6050.6713.35−6.441<0.001 *0.74
202021.4576.7137.2310.7935.8812.29
PM2.5 (µg m−3) b201924.43107.341.8416.2136.6213.38−5.633<0.001 *0.65
202016.7163.3229.798.90328.128.355
SO2 (ppb) b20190.90014.402.4242.2351.9000.800−2.7480.006 *0.32
20200.40019.301.9502.4171.2001.480
NO2 (ppb) b201922.0059.2038.509.30838.2514.2013.078<0.001 *2.02
20205.60060.7019.639.40917.2510.18
O3 (ppb) a201917.7090.6049.4616.6050.3522.805.629<0.001 *0.90
20202.20055.8037.3710.1538.4513.55
CO (ppm) b20191.2323.2132.1250.4522.1010.62514.212<0.001 *2.33
20200.4833.2641.0990.4280.9600.445
WD (°) b2019209.8359.2308.940.36320.169.28−0.5020.6160.06
2020204.2358.4300.642.55307.166.33
WS (m s−1) b20191.0295.9541.8540.7961.7370.686−0.2410.8100.03
20200.6363.5121.8170.5811.7330.805
RH (%) b201976.8498.0092.864.18593.657.093−0.7670.4430.09
202082.5898.0093.554.07794.466.592
SR (W m−2) b2019298.8829.6655.2112.5680.6144.0−6.14<0.001 *0.70
2020128.9661.8514.0107.5536.4132.9
AT (°C) b201931.4237.0934.421.18134.541.600−0.4650.6430.07
202029.2136.7634.511.43534.761.886
a = paired t-test; b = Wilcoxon signed rank test; * significant at p < 0.05.
Table 4. Spearman’s correlation tests between daily air pollutants and meteorological factors data and cumulative COVID-19 cases in Kuala Lumpur and Selangor.
Kuala LumpurSelangor
Variables rprp
PM10 (µg m−3)0.2810.014 *0.3540.002 *
PM2.5 (µg m−3)0.3520.002 *0.396<0.001 **
SO2 (ppb)0.0860.4620.0700.550
NO2 (ppb)0.2450.033 *0.2630.022 *
O3 (ppb)0.1820.1150.3060.007 *
CO (ppm)0.1160.3200.0670.563
WD (°)−0.1510.192−0.1910.099
WS (m s−1)−0.3110.006 *0.0370.748
RH (%)0.494<0.001 **0.0300.798
SR (W m−2)−0.3680.001 *−0.2490.030 *
AT (°C)−0.0210.857−0.1750.131
* Significant at p < 0.05; ** Significant at p < 0.001.
Table 5. Multiple linear regression for associations between relative humidity and cumulative COVID-19 cases in Kuala Lumpur.
Independent Variables B (SE) Standardized Coefficients p95% CI VIF
Constant2547.83 (1157.54)-0.031 *239.19 to 4856.48-
Relative Humidity (%)47.84 (11.29)0.424<0.001 *25.31 to 70.361.129
* Significant at p < 0.05.
Table 6. Multiple linear regression for associations between PM2.5 and cumulative COVID-19 cases in Selangor.
Independent Variables B (SE) Standardized Coefficients p95% CI VIF
Constant1885.261 (325.31)-<0.001 *1236.61 to 2533.91-
PM2.5 (µg/m3)13.246 (3.61)0.471<0.001 *6.058 to 20.431.541
* Significant at p < 0.05.
Table 7. RMSE, R2, MAE, and MSE values at various leaf sizes, learners, and learning rates for model training.
Leaf SizeLearnerLearning RatePCARMSER2MAEMSE
1100.1ON0.540.710.440.29
1100.1OFF0.840.300.680.70
2200.2ON0.700.510.540.49
2200.2OFF0.460.790.350.21
3300.2ON0.690.520.550.48
3300.2OFF0.450.800.350.20
4400.2ON0.680.550.550.46
4400.2OFF0.450.790.360.21
7300.2ON0.650.580.510.42
7300.2OFF0.440.810.350.19
Table 8. Results of a machine learning algorithm for predicting COVID-19 cases using air quality data at Petaling Jaya Station in Selangor.
RMSER2MAEMSE
0.470.770.390.22
Disclaimer/Publisher’s Note: The statements, opinions and data contained in all publications are solely those of the individual author(s) and contributor(s) and not of MDPI and/or the editor(s). MDPI and/or the editor(s) disclaim responsibility for any injury to people or property resulting from any ideas, methods, instructions or products referred to in the content.

