Article Text

Abstract
Objectives Predictive studies play important roles in the development of models informing care for patients with COVID-19. Our concern is that studies producing ill-performing models may lead to inappropriate clinical decision-making. Thus, our objective is to summarise and characterise performance of prognostic models for COVID-19 on external data.
Methods We performed a validation of parsimonious prognostic models for patients with COVID-19 from a literature search for published and preprint articles. Ten models meeting inclusion criteria were either (a) externally validated with our data against the model variables and weights or (b) rebuilt using original features if no weights were provided. Nine studies had internally or externally validated models on cohorts of between 18 and 320 inpatients with COVID-19. One model used cross-validation. Our external validation cohort consisted of 4444 patients with COVID-19 hospitalised between 1 March and 27 May 2020.
Results Most models failed validation when applied to our institution’s data. Included studies reported an average validation area under the receiver–operator curve (AUROC) of 0.828. Models applied with reported features averaged an AUROC of 0.66 when validated on our data. Models rebuilt with the same features averaged an AUROC of 0.755 when validated on our data. In both cases, models did not validate against their studies’ reported AUROC values.
Discussion Published and preprint prognostic models for patients infected with COVID-19 performed substantially worse when applied to external data. Further inquiry is required to elucidate mechanisms underlying performance deviations.
Conclusions Clinicians should employ caution when applying models for clinical prediction without careful validation on local data.
- BMJ Health Informatics
- health care sector
Data availability statement
No data are available. Due to specific institutional requirements governing privacy protection, data used in this study will not be available.
This is an open access article distributed in accordance with the Creative Commons Attribution Non Commercial (CC BY-NC 4.0) license, which permits others to distribute, remix, adapt, build upon this work non-commercially, and license their derivative works on different terms, provided the original work is properly cited, appropriate credit is given, any changes made indicated, and the use is non-commercial. See: http://creativecommons.org/licenses/by-nc/4.0/.
Statistics from Altmetric.com
Summary
What is already known?
The novelty of COVID-19 resulted in a knowledge gap regarding the clinical trajectory of hospitalized patients. In an effort to address this knowledge gap, researchers have developed and published models to estimate the prognosis of hospitalised patients. These models have performed well on data from populations similar to those used to construct them. In general, however, models are known to perform poorer on populations different from those used to train them.
What does this paper add?
The ability of models to predict patients’ clinical courses is substantially impaired when such models are applied to real-world data. As such, published external models are unlikely to be appropriate as significant, reliable inputs for clinical decision making. This study serves as a reminder that predictive models should be carefully applied in new settings only after local validation.
Introduction
COVID-19 is a rapidly growing threat to public health. As of 4 October 2020, over 35 million positive cases and over 1 million deaths have been reported.1 While most of these deaths have occurred in older patients and those with chronic disease, outcomes even within these strata are highly variable.2 Given the large number of cases and limited healthcare resources, there exists substantial need for predictive models that allow healthcare providers and policymakers to estimate prognoses for individual patients.
Several such models have been published or made available in preprint. Many have been derived through machine learning techniques to identify a reasonably small set of features that are predictive of poor outcomes in order to make their application in other settings feasible. While these models have generally performed well when applied to their own ‘held-out’ data, it is well known that such models are often biased and rarely perform as well on ‘real-world’ data. A systematic review and critical appraisal by Wynants et al found that prognostic models examined were at a high risk of bias and postulated that real-world performance on these models would likely be worse than that reported.3
A secondary concern is the use of these prognostic models in a clinical setting without validation. A paper that reports specific prognostic factors may misinform providers about trends, relationships and associations and inadvertently drive faulty decision-making regarding prognosis and treatment decisions.
In order to evaluate applicability to data from American patients, we report the performance of 10 such prognostic models on data from New York University (NYU) Langone Health, a multisite hospital system in New York City.
Methods
Literature review
We searched PubMed, arXiv, medRxiv and bioRxiv for papers reporting prognostic predictive models between 1 January 2020 and 3 May 2020. Queries were constructed by combining COVID-19 illness with terms denoting predictive or parsimonious models (online supplemental table A). Results were supplemented with individual hits from Google Scholar searches using the same queries. Both peer-reviewed articles and preprint manuscripts were considered.
Supplemental material
Search results were subjected to six inclusion criteria:
The model was developed using patients with COVID-19. Models approximating COVID-19 using other types of viral pneumonia were excluded.
The model predicted prognosis of individual cases. Various targets were considered, including mortality, intensive care unit transfer and WHO definitions of severe and critical illness.2 Models seeking to predict diagnostic test results or epidemiological trends were excluded.
The model used only clinical and/or demographical factors. The American College of Radiology has outlined contamination-related and technical challenges associated with the use of imaging for patients with COVID-19.4 Given these challenges, models requiring the use of chest radiographs or CT scans were excluded.
The model was parsimonious, involving fewer than 20 features. Models with large numbers of features require collection of more information from patients and are difficult to reliably apply to other settings.
The model was validated on a held-out test set (internal validation), on an outside dataset (external validation) or via cross-validation. Reporting training performance alone, without one of these three forms of author-facilitated validation (online supplemental table B), was not sufficient.
The model is reportedly applicable as a prediction model. Classification models, which report on a snapshot in time, were not included.
In order to effectively rebuild and assess each model, we further subjected search results to two exclusion criteria:
The model used features assessed within standard of care protocols at our institution. Features outside standard of care include unique laboratory values such as T cell subtyping and epidemiological factors such as travel history.
The model used features and targets with characterisable definitions. The feature ‘other precondition’, for example, cannot be succinctly and reliably characterised.
Our selection process (figure 1) yielded ten studies, as summarised in table 1. Each study’s model parameters are detailed in table 2. These models were subsequently applied on our own NYU validation dataset, shown in table 3.

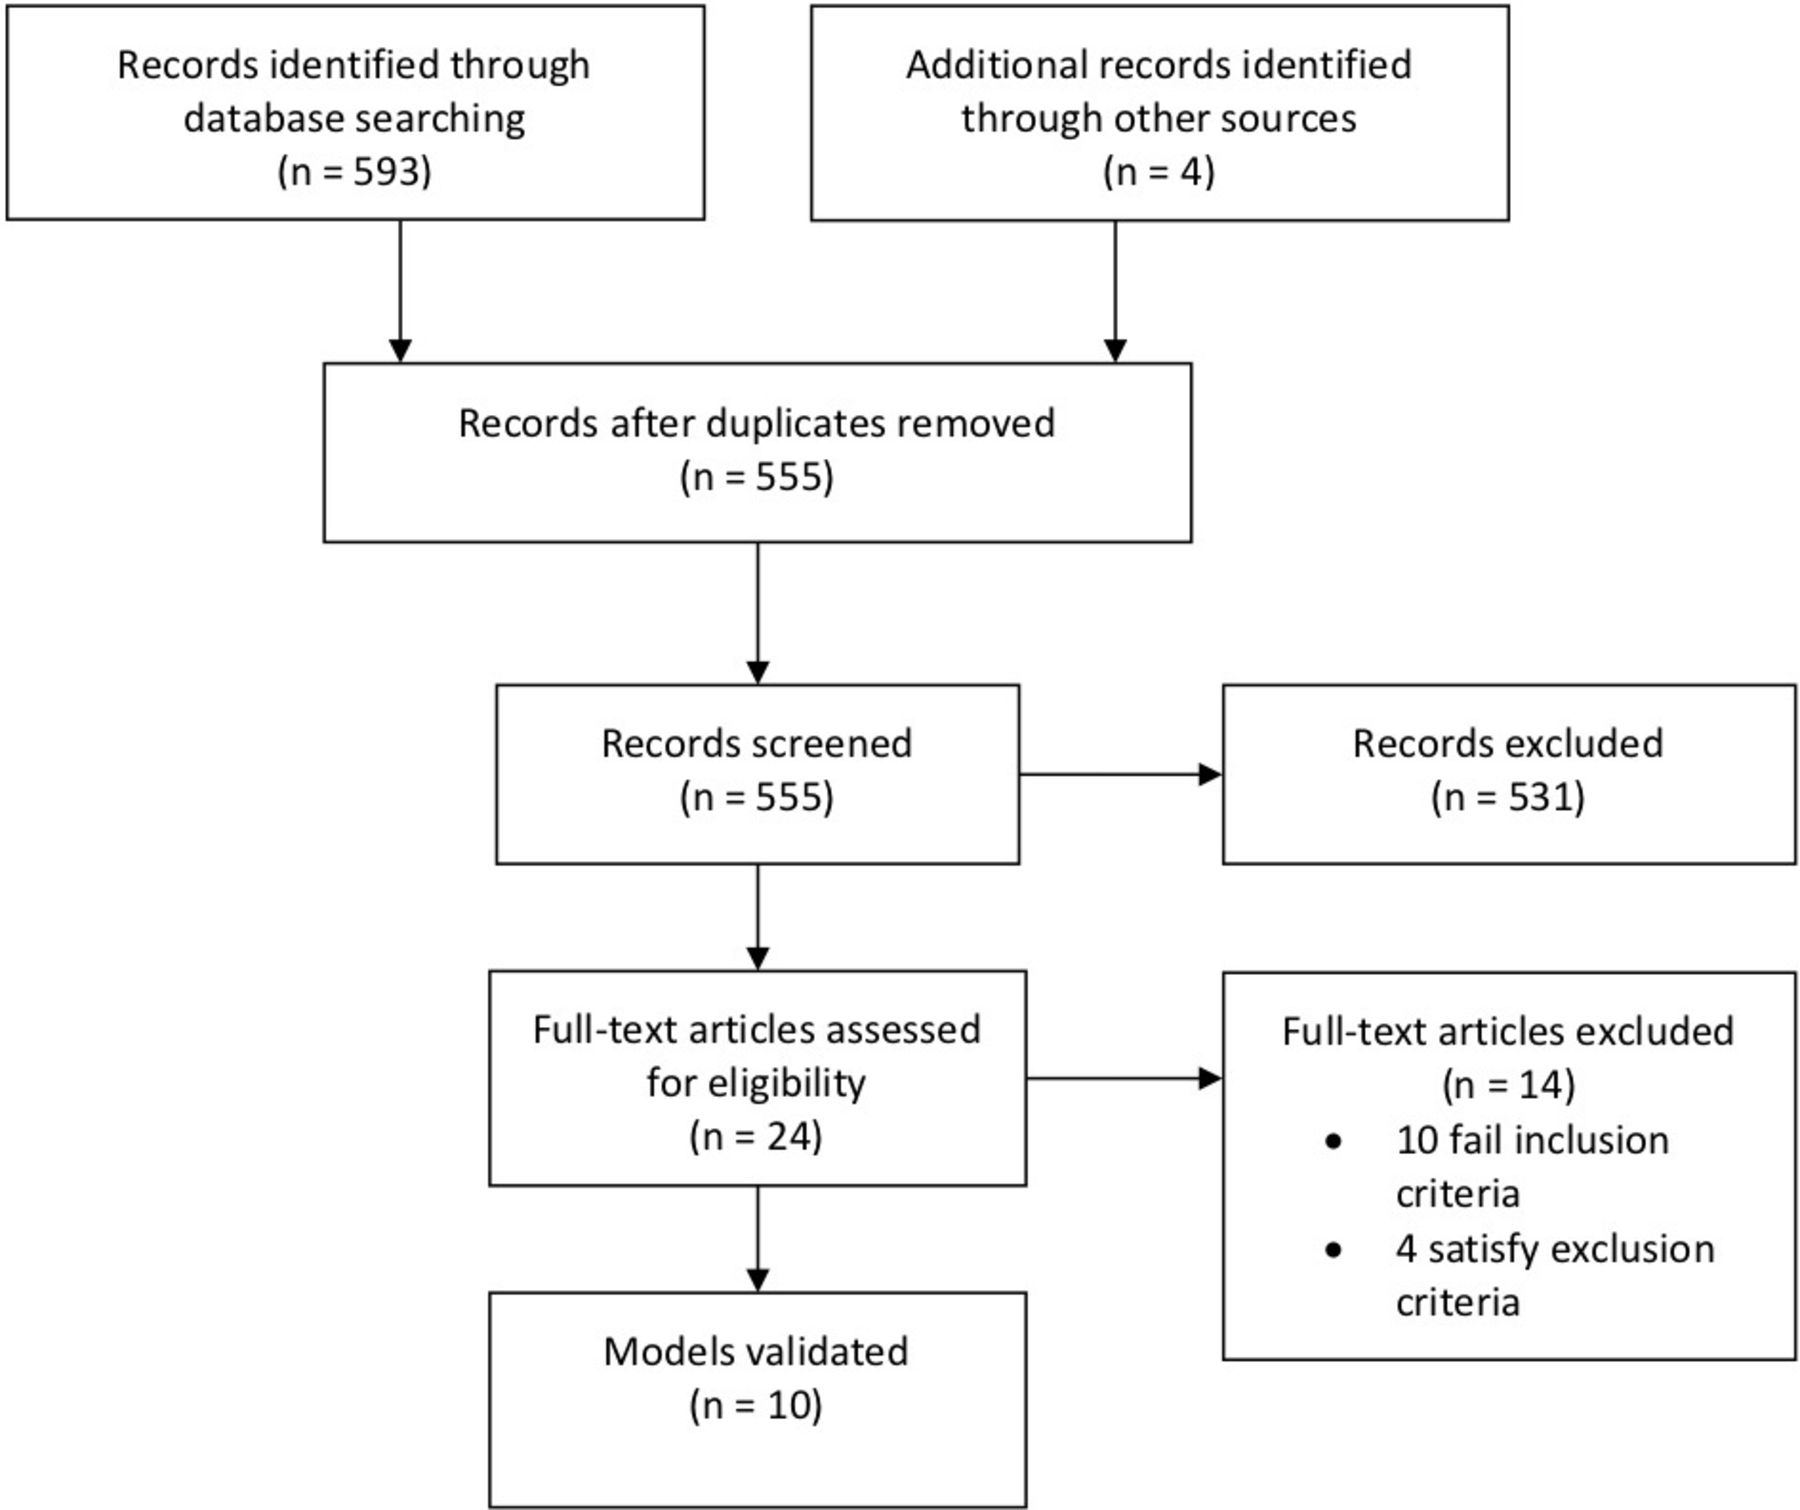
Literature search screening and selection.
Summary of studies selected
Model parameters
Summary of validation cohorts
Evaluation methods
Evaluating models requires four types of information: features, feature weights, population inclusion and exclusion criteria and targets. Studies were categorised based on the degree of information reported. Five papers reported feature weights,5–9 and the remaining five did not report feature weights.10–14 Those that reported feature weights, whether explicitly or through another elucidating form, such as a nomogram, were applied directly to our external validation cohort (applied models). For those papers that lacked feature weights, we rebuilt models by using reported features (rebuilt models). When discussed, we replicated construction of those models, including the train-to-test split and cross-validation. Where construction was not discussed, we performed a default 8:2 train-to-test split and threefold cross-validation to choose hyperparameters. CIs were estimated using the DeLong method.
All studies reported population inclusion and exclusion criteria and targets. We were able to run four models to these reported specifications (models without deviations).6 7 10 11 For the remaining six models, we deviated from the reported specifications (models with deviations) for one of two reasons.5 8 9 12–14 First, the models defined criteria using data that were not collected at our institution. For example, Gong et al5 defined a partial pressure of oxygen to fraction of inspired oxygen ratio(PaO2/FiO2)threshold target. We had to exclude this target because PaO2 was not commonly recorded in our dataset. Second, the models defined criteria using labels that are not characterisable. For example, Zhou et al8 used severe respiratory distress. Severe respiratory distress is a subjective measure of acuity and not defined explicitly in the study. Thus, this target was excluded. In general, the features used in selected models represented results from clinical tests used commonly across facilities. Commonly used tests include complete blood counts and metabolic panels.
Therefore, the 10 studies were split into four designations: (1) models applied without deviations (table 4), (2) models applied with deviations (table 5), (3) models rebuilt without deviations (table 6) and (4) models rebuilt with deviations (table 7). Area under the receiver–operator curve (AUROC) was used as our main measure of model performance, with F1 score used as a secondary measure of model performance, if used in the original study.
Performance of models applied without deviations
Performance of models applied with deviations
Performance of models rebuilt without deviations
Performance of models rebuilt with deviations
Validation cohort
The 4444 inpatients with COVID-19 in our validation cohort were admitted after 1 March 2020 and were followed until either discharge or the occurrence of an outcome on or before 27 May 2020. Outcomes include any of those listed in table 2. Some papers did not specify the prediction time. If prediction time was not specified, we used the earliest data points available. We excluded patients with missing features on a case-by-case basis, as determined by the range of features required by each model. If the minimum set of features was not available for a patient, this patient was excluded from the evaluation. An overview of the NYU validation cohort used in each study is shown in table 3. For reference, a comparison of cohort demographics is available in the supplement (online supplemental table C).
Results
We summarise our results in multiple tables.
Table 4 shows the performance of models applied without deviations. In these studies, we applied the model as reported in the respective paper, as is. The study reported mean AUROC dropped from 0.98 to 0.67 when applied to our dataset, with a mean AUROC difference of 0.31. When we retrained against our own data, the mean AUROC dropped from 0.98 to 0.82, with a mean difference of 0.21. In this cohort of models, the models do not validate optimally.
Yan et al reported performance metrics using the most recent laboratory values taken from patients.7 However, the study claims that the published model can be used to predict outcomes several days in advance.7 For this reason, we have evaluated the model using both patients’ earliest and most recent laboratory values. We consider the earliest laboratory values as the preferable model to evaluate. This model gives the longest lead time towards patient prognosis.
Table 5 shows the performance of models applied with deviations. In these studies, we applied the model as reported in the respective paper with deviations as outlined in Methods section. The study reported mean AUROC dropped from 0.83 to 0.66 when applied to our dataset, with a mean AUROC difference of 0.19. When we retrained against our own data, the mean AUROC dropped from 0.83 to 0.71, with a mean difference of 0.13. In this cohort of models, the models do not validate optimally.
Table 6 shows the performance of models rebuilt without deviations. In these studies, we rebuilt the model with our data using the features outlined in the respective paper. After retraining, the mean AUROC increased slightly, from 0.73 to 0.76, with a mean difference of 0.02. Levy et al did not report a testing AUROC. However, we rebuilt the model and made the comparison.10 We note a small increase in performance; however, Levy et al do not report a validation performance, and the bump may be a statistical artefact.10
Table 7 shows the performance of models rebuilt with deviations. In these studies, we rebuilt the model with our data with deviations as outlined in the table. After retraining, the mean AUROC dropped slightly, from 0.78 to 0.75, with a mean difference of 0.03.
Table 8 summarises the bottom-line results from table 4 to table 7. Studies are stratified by each of the four study types: studies applied without deviation, studies applied with deviation, studies rebuilt without deviation and studies rebuilt with deviation. Because not all studies reported AUROC values for study validation performances, not all studies are represented where mean values are given. N is shown for all mean values.
Model performance summary
We make a few observations. First, the applied models perform more poorly than the rebuilt models. This poor generalisation is expected as models are transferred from one setting to another. However, such a large difference is not expected, and likely, there are methodological errors in model construction in the original papers, or the sample cohorts are significantly different. We believe though that the sample cohorts are quite similar. The rebuilt models perform close to the reported studies. This result implies that the cohorts and the features that define them are similar.
Table 9 summarises results from table 4 to table 7. Studies are stratified by three types of tasks: models predicting only clinical deterioration, models predicting only clinical mortality or models that predict the occurrence of either clinical deterioration or mortality. Because not all studies reported AUROC values for study validation performances and not all studies provided feature weights, not all studies are represented where mean values are given. N is shown for all mean values. In general, predicting mortality is easier than deterioration. Both deterioration and mortality tasks do not generalise against the reported results. The mean AUROC differences for predicting deterioration and mortality respectively are 0.10 and 0.15. Finally, predicting either deterioration or mortality is consistent but poor. We also note that in the mean AUROC differences for those studies with compound tasks, we were unable to apply them and verify that the study weights are clinically useful.
Model performance by task type
By rebuilding each model using its features, we were able to elucidate positive predictive value–sensitivity relationships. We show these results to further make the justification of clinical applicability and the potential false positives that the various models may produce. Table 10 shows the positive predictive values of rebuilt models given a sensitivity threshold. Only two models achieved average positive predictive value scores over 0.75: Yan et al (given the most recently taken laboratory values as features) and Guo et al7 13. We note that, in the case of Yan et al, using the most recent values effectively renders the model a classifier rather than a predictor.7
Positive predictive value of rebuilt models given sensitivity
Discussion
Principal findings
Prognostic models for COVID-19 may be able to provide important decision support to policymakers and clinicians attempting to make treatment and resource allocation decisions under adverse circumstances. Several such models have been developed and have reported excellent performance on held-out data from their own sources. Unfortunately, when applied to data from a large American healthcare system, the predictive power of these models is substantially impaired.
While disappointing, this loss of performance is not surprising. Multiple differences may account for the performance loss, such as different populations, different viral strains, different clinical workflows and treatments, lab variations, small sample model construction, poor experimental design and general overfitting.
Meaning of the study
Translating any model to apply to data from another source inevitably introduces error caused by divergence in how data are defined and represented. While strictly ‘unfair’ to the models under consideration, this issue directly results from attempting to implement any algorithm in a new setting. The phenomenon is widely known as the curly braces problem in medical informatics, so named after the curly braces used in Arden Syntax to identify a piece of clinical information that may be stored or structured differently between electronic health record (EHR) systems.15 As such, studies like ours provide a sensible estimate of how well these prognostic algorithms will perform should they be applied to an urban American population.
Our finding of markedly decreased performance has significant implications, suggesting that these models are unlikely to be useful as a major, reliable input for clinical decision-making or for institutional resource allocation planning. Our results should serve as a reminder that predictive models should only be applied in new settings with local validation and that inferences from identified features about prognostic value should be carefully considered.
Ultimately, in clinical settings, users must choose a point on the receiver–operator curve. This point generates calculable positive predictive value and sensitivity (table 10). The consideration of potential clinical workflows and integration must be driven by the desired sensitivities and positive predictive values. In general, the values are low except for bolded instances.
Strengths and weaknesses of the study
The primary strength of this study is its dataset, which is made up of over four thousand patients with COVID-19 infection, most of whom presented as infected during the peak of the epidemic in the New York City metropolitan area. As such, this dataset is likely to be reasonably representative in one of the scenarios under which these prognostic algorithms might be used to guide decision-making: a severe epidemic in a major metropolitan centre.
Several caveats should be applied. The most obvious is that like all of the models themselves, we report here on retrospective data, rather than performing a prospective validation, which is the true standard by which predictive models should be judged. It should also be noted that in several cases, we deviated from exact reproductions of previously reported models in order to facilitate their application to our data, which is likely to explain at least some of their decreased performance.
Strengths and weaknesses in relation to other studies
As far as we know, there are no other studies validating multiple COVID-19 prognostic models with which to compare as of the time of writing.
Unanswered questions and future research
Multiple mechanisms may account for performance differences. More analysis would be required in order to elucidate these mechanisms.
First, most obvious are geographical and demographical differences. It is noteworthy that models derived from Chinese data showed the greatest decrement when applied to our data, which was also seen when Zhang et al performed an external validation of their model using data from the UK.12 Differences in access to care, healthcare facility policies and patient demographics between countries may make generalisation difficult for prognostic models derived in one setting to another.
Second are differences in care practices over time. Many of the models we report on here were derived from an earlier phase of the epidemic, which may further have changed the characteristics of the patients in the training sets from which the models were built.16 Altered clinical practice, trialled therapeutics or shifting demographics over time might endanger the utility of models built towards the beginning of the pandemic.
Third, it is possible the virus itself has changed. Though there is evidence of viral mutation, the clinical effects of which have not been fully characterised.17 These changes may not be reflected in this validation analysis.
Regarding future research, additional models are being produced, and rigorous validations should be done and encouraged to establish potential clinical use cases.
Data availability statement
No data are available. Due to specific institutional requirements governing privacy protection, data used in this study will not be available.
Ethics statements
Patient consent for publication
Ethics approval
This study met the criteria for quality improvement established by the NYULH IRB and was exempt from institutional review board review.
Supplementary materials
Supplementary Data
This web only file has been produced by the BMJ Publishing Group from an electronic file supplied by the author(s) and has not been edited for content.
Footnotes
KH, BZ and PS are joint first authors.
Twitter @yinformatics
Contributors KHar, BZ and PS performed the literature search and extracted information. BZ and PS collected validation data and assessed models. KHar, BZ, PS and YA drafted the manuscript. KHar, BZ, PS, KHau, MMM, NMA, LIH and YA critically revised the work. MMM, NMA and LIH provided clinical guidance. YA supervised the work and is the guarantor.
Funding YA was partially supported by NIH grant 3UL1TR001445-05 and National Science Foundation award number 1928614.
Competing interests None declared.
Provenance and peer review Not commissioned; externally peer reviewed.
Supplemental material This content has been supplied by the author(s). It has not been vetted by BMJ Publishing Group Limited (BMJ) and may not have been peer-reviewed. Any opinions or recommendations discussed are solely those of the author(s) and are not endorsed by BMJ. BMJ disclaims all liability and responsibility arising from any reliance placed on the content. Where the content includes any translated material, BMJ does not warrant the accuracy and reliability of the translations (including but not limited to local regulations, clinical guidelines, terminology, drug names and drug dosages), and is not responsible for any error and/or omissions arising from translation and adaptation or otherwise.