Abstract
Background:
The consequences of coronavirus disease (COVID-19) pandemic, especially the financial burden imposed on the healthcare systems and hospitals, have been unpredictable around the world. Radiology wards have been exposed to the highest burden during this pandemic.Objectives:
This study aimed to calculate the cost of diagnostic imaging services before and during the COVID-19 pandemic, using the activity-based costing (ABC) method in an important diagnostic center of COVID-19 in Khorramabad, Iran.Patients and Methods:
In this retrospective study, data were extracted from the hospital accounting sources in the radiology ward over two years (2019 - 2021). According to the ABC method, four types of cost were defined, including wage, supporting services, Consuming materials, and overhead expenses. Therefore, based on the monthly number of services, the unit cost of each service was calculated.Results:
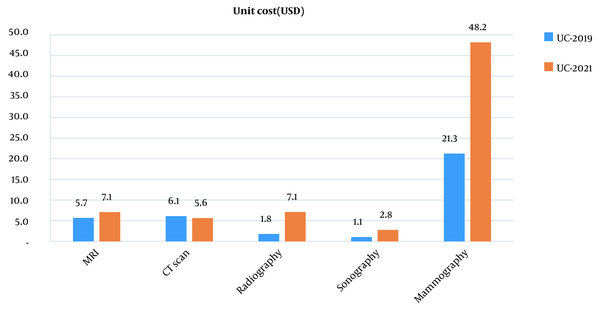
The unit cost of all services during the COVID-19 pandemic was higher than before, except for CT scan (before: 6.1 United States dollar [USD]; during: 5.6 USD) (P = 0.008). The unit cost of MRI service was 5.7 USD before the pandemic and 7.1 USD during the pandemic (P = 0.57); the cost per radiography service was 1.8 USD before the pandemic and 7.1 USD during the pandemic (P = 0.01); and the cost per sonography service was 1.1 USD before the pandemic and 2.8 USD during the pandemic (P = 0.04). Finally, the cost of mammography increased dramatically during the pandemic (before the pandemic: 21.3 USD; during the pandemic: 48.2 USD) (P = 0.004).Conclusion:
The COVID-19 pandemic has increased the radiology department expenses. The cost of CT scan services decreased due to the large number of services provided compared to the pre-pandemic period.Keywords
Unit Cost Imaging Services COVID-19 Pandemic MRI CT Scan Sonography Mammography Radiography Activity-Based Costing (ABC)
1. Background
The coronavirus disease (COVID-19) pandemic has caused catastrophic resource management challenges for healthcare systems. These challenges have been significant, especially in low- to middle-income countries with limited resources to fight this pandemic (1, 2). The scarcity of manpower, along with insufficient protective equipment, has intensified the situation and increased the healthcare costs (3, 4). Accordingly, cost management in the healthcare system is an inevitable approach to limit the costs, as it reduces the unit cost of services for patients as end users (5).
Population aging, technological advances, economic fluctuations, and variety of health insurances have imposed a significant burden on the health system of most countries (6). Governments employ different economic tools to control expenditures (7). Cost analysis studies do not aim to reduce the quantity or quality of health services, but to help make better decisions for selecting a cost-effective method (8). Activity-based costing (ABC) is an accounting tool for identifying the costs of health services according to consumed sources (9). Unlike traditional costing methods, ABC focuses on operational costs, regardless of outputs, and all the steps are examined in detail (10, 11). Overall, measurement of the unit cost of health services provides a framework for privatization, tariff estimation, cost studies, and financial management (12).
Several detailed studies have investigated the economic status of hospitals in developing countries, most of which have calculated the cost of individual units rather than service units (13). Radiological technologies, including magnetic resonance imaging (MRI) and computed tomography (CT) scans, require major resources (14). However, their actual costs have not been accurately calculated; these costs are more prominent in the public sector compared to the private sector.
2. Objectives
This study aimed to calculate the unit costs of various imaging services, such as MRI, CT scan, sonography, mammography, and radiography, in the imaging ward of Shahid Rahimi Hospital (a large teaching hospital) in Khorramabad, Iran, in 2021.
3. Patients and Methods
This retrospective study was conducted based on the hospital records. Data were collected from the accounting centers and documents according to the ABC method. First, four types of cost were identified: (1) Overhead bills, such as electricity, gas, telephone, and Internet bills, (2) salary and benefits, (3) consumable medical and office materials, and (4) support services of hospitals, including nutrition, cleaning, transportation, facilities, and repair. Some of these centers were directly involved in providing services, and some were indirectly involved. To calculate the cost of each imaging service, consumable materials and salaries were directly included in the calculations. However, to divide centers which were indirectly involved in providing imaging services, overhead and support costs were measured based on the area of the ward relative to the total hospital.
As an assumption, to facilitate cost calculations, the costs of imaging machines, equipment depreciation, and share of deposit benefits were excluded. First, all annual cost factors were extracted then, the monthly cost was divided by the number of monthly services to calculate the unit cost of each service. In the final part of this study, the unit cost of each service was compared with the tariff to determine the profit or loss of that particular service. All expenses were expressed in Rial (as the official currency of Iran) and then converted to American Dollar (official exchange rate of United States dollar [USD] in 2021, 300,000 Rials).
Additionally, to better compare the effects of the COVID-19 pandemic on the costs of imaging, paired t-test was used. All the data collected in this study were analyzed by software programs, including Microsoft Excel and SPSS Version 21 (IBM Corp. Released 2012. IBM SPSS Statistics for Windows, Version 21.0. Armonk, NY: IBM Corp.).
4. Results
Table 1 presents the cost components, expenditures, revenues, and the number of different services before and during the COVID-19 pandemic. According to this table, the total monthly cost of various types of imaging services was 10,457.5 USD in 2019 and 26,482.2 USD in 2021. In both years, CT scan and radiography services accounted for the highest expenses (3,825.9 USD). The salary costs also had the largest share of all cost components in both years (7,290.5 and 17,373.9 USD, respectively). The largest share of costs was attributed to CT scan in 2021 (13,473.3 USD with 2,385 services per month).
Comparison of the Unit Cost (USD) of Diagnostic Imaging Services in 2019 and 2021
| Cost components | Average monthly cost | Magnetic resonance imaging | Computed tomography scan | Radiography | Sonography | Mammography | ||||||
|---|---|---|---|---|---|---|---|---|---|---|---|---|
| 2019 | 2021 | 2019 | 2021 | 2019 | 2021 | 2019 | 2021 | 2019 | 2021 | 2019 | 2021 | |
| Salary | 7,290.5 | 17,373.9 | 1,244.7 | 1,621.6 | 2,667.3 | 6,949.6 | 2,667.3 | 6,949.6 | 622.4 | 1,621.6 | 88.9 | 231.7 |
| Consumed materials | 1,916.4 | 7,074.5 | 327.2 | 212.2 | 701.1 | 5,710.2 | 701.1 | 909.5 | 163.6 | 212.2 | 23.4 | 30.3 |
| Indirect support services | 1,038.5 | 1,730.8 | 177.3 | 161.5 | 379.9 | 692.3 | 379.9 | 692.3 | 88.7 | 161.5 | 12.7 | 23.1 |
| Bills | 212.1 | 303.1 | 36.2 | 28.3 | 77.6 | 121.2 | 77.6 | 121.2 | 18.1 | 28.3 | 2.6 | 4 |
| Total cost per month a | 10,457.5 ± 894 | 26,482.2 ± 158 | 1,785.4 ± 239 | 2,023.6 ± 189 | 3,825.9 ± 299 | 13,473.3 ± 1782 | 3,825.9 ± 413 | 8,672.6 ± 678 | 892.7 ± 75 | 2,023.6 ± 265 | 127.5 ± 17 | 289.1 ± 34 |
| Unit cost | 5.7 | 7.1 | 6.1 | 5.6 | 1.8 | 7.1 | 1.1 | 2.8 | 21.3 | 48.2 | ||
| Total income per month | 6,880 | 14,490.4 | 940.5 | 1,509.5 | 1,842.9 | 9,371.4 | 1,437.6 | 1,400.0 | 2,645.2 | 2,190.5 | 13.8 | 19 |
| Number of services per month a | 3,939 ± 256 | 4,625 ± 451 | 313 ± 36 | 286 ± 31 | 625 ± 111 | 2,385 ± 331 | 2,145 ± 189 | 1,221 ± 211 | 849 ± 65 | 727 ± 79 | 6 ± 1 | 6 ± .5 |
| Price cost | 3.0 | 5.3 | 2.9 | 3.9 | 0.7 | 1.1 | 3.1 | 3.0 | 2.3 | 3.2 | ||
| Profit or loss | -3,577.5 | -11,991.8 | -2.7 | -1.8 | -3.2 | -1.7 | -1.1 | -6 | +2.1 | + 0.2 | -19 | -45 |
| P-value (significance level, 0.05) | 0.007 | 0.57 | 0.008 | 0.015 | 0.047 | 0.004 | ||||||
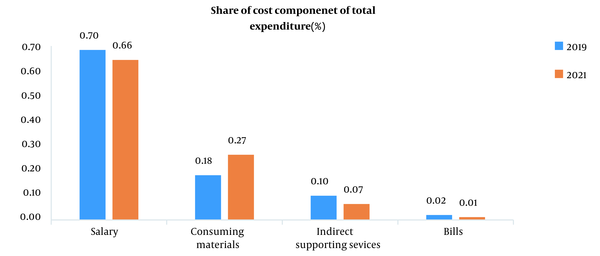
According to Figure 1, before and during the COVID-19 pandemic, salary accounted for the largest share of the total expenditure of the radiology ward, while the bills had the lowest share of the total cost in both periods.
Comparison of the share of cost components of monthly total expenditure in a radiology ward before and after the coronavirus disease (COVID-19) pandemic

A notable finding presented in Figure 2 is that in both intervals, the unit cost of mammography was significantly higher than that of other services (21.3 vs. 48.2 USD), while the unit cost of sonography was lower than others (1.1 vs. 2.8 USD).
Comparison of the unit cost of diagnostic imaging services before and after the coronavirus disease (COVID-19) pandemic (* UC: Unit cost)

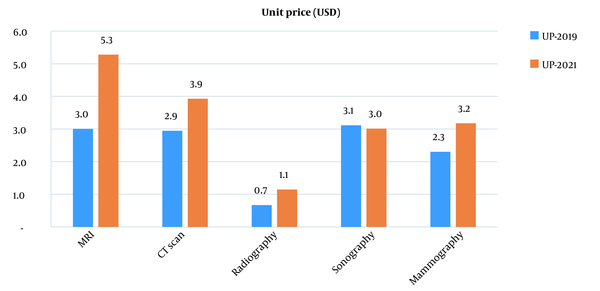
Based on fixed tariffs and predetermined prices by the Ministry of Health, a simple radiography is less costly than other imaging services (Figure 3).
Comparison of the unit price of diagnostic imaging services before and after the coronavirus disease (COVID-19) pandemic (* UP: Unit price)

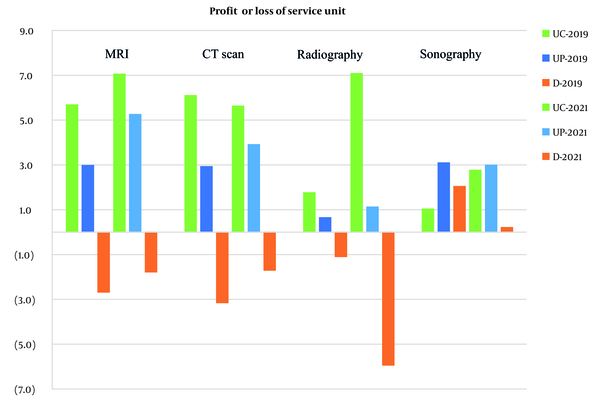
According to the unit cost of each imaging service and the average cost of services, profit or loss was calculated for each service in both periods; this comparison is presented in Figure 4. All services were loss-making, except sonography. Figure 2 indicates that the highest rate of loss was related to mammography (19 USD and 45 USD, respectively) due to the very high unit cost and low unit price (Table 1 and Figure 2). However, Due to the great difference between this service than other services and its high altitude, not included in the Figure 4.
Comparison of the profit or loss of the imaging services before and after the coronavirus disease (COVID-19) pandemic (* UC: Unit cost, * UP: Unit price, * D: Difference)

5. Discussion
The present results indicated a significant difference in the unit cost of all imaging services during the COVID-19 pandemic and before the pandemic, except for CT scan services (Figure 2). It seems that there is a significant correlation between the high number of CT scan services during the pandemic and the reduced unit cost. According to the results, compared to other services, the unit cost of mammography and simple radiography services increased significantly during the COVID-19 pandemic compared to the pre-pandemic period. The main reason for this finding is the high inflation rate which rises every year in Iran, resulting in an increase in salary and other prices by 20% to 30%. However, the tariff rates have not increased as rapidly as the inflation rate by the Ministry of Health, which is related to governmental policies for increasing the accessibility and affordability of services for patients, because people’s health is more valuable than the profit of public centers, although the costs need to be managed. However, in another study in Iran, there was a significant difference between the costs and tariffs (15). Due to the inaccessibility of imaging services, budgets and budget depreciation are severely reduced; therefore, it is necessary to reduce the unit costs of services.
In this study, salary had the highest share of total costs. This finding is in line with the results of a study performed in Kashani Hospital, Tehran, Iran, which showed that salary accounted for the largest share of costs, followed by consumable materials (16). Moreover, in a study by Bayati et al., based on the cost analysis of MRI in Iran, salary accounted for the biggest share of total costs (15). On the other hand, in a study by Ibrahim et al. examining the costs of MRI and CT scan services in Malaysia, the equipment cost was the highest, while the costs of maintenance and salary were the lowest (14). Based on the results presented in Table 1 and Figure 2, the unit cost of MRI was 5.7 and 7.1 USD In 2019 and 2021, respectively, while in another study, the cost was estimated at 4 USD (16). Also, in a study by Thant et al. in Myanmar, the cost of per imaging service was 21 USD during the COVID-19 pandemic (17).
According to Figure 1, the consumption of materials during the COVID-19 pandemic has increased more than before, which suggests the high consumption of materials related to the disease. Also, in another study, using of consumables materials increased during the COVID-19 pandemic (14). Overall, the high cost of mammography services (Figure 2) and the low number of services decrease the productivity of these services; therefore, these services must be either terminated or outsourced to the private sector. On the other hand, sonography was found to be profitable. Therefore, by increasing these services, besides cost management, they can be more effective and advantageous. An important prerequisite for unit cost calculations is the existence of a strong information system and accurate documentation of all expenses; however, in Iran, there are substantial database limitations (15).
Significant differences between costs and tariffs impose major pressure on financing and budget deficits. Therefore, if the current situation persists, the activities of centers will be disrupted; accordingly, financial management of services is necessary. Since salary accounts for the largest share of unit costs, performance-based manpower management is a fundamental approach to reduce the costs, as radiology departments should hire personnel based on shift works and dismiss surplus labor. Besides, performance-based consumables should be allocated to these departments, and specific consumables should be defined for each service. Monthly consumption should be also reported to avoid extravagance and other excess costs. Finally, considering the governmental involvement in this sector, the ward supervisor and the head of the hospital are responsible for energy consumption management.
In conclusion, due to the high prevalence of infection during the COVID-19 pandemic, along with the patients’ need for CT scan services, CT scans have been performed at high rates. A remarkable finding of this study was the unexpected reduction in the unit cost of these services compared to other services and also compared to the pre-pandemic period. According to economic principles, The Economies of Scale is a most important factor for profit in market. Therefore, by increasing the number of services and maintaining fixed costs, the unit cost of services can be reduced.
Acknowledgements
References
-
1.
Wang Z, Duan Y, Jin Y, Zheng ZJ. Coronavirus disease 2019 (COVID-19) pandemic: how countries should build more resilient health systems for preparedness and response. Glob Health J. 2020;4(4):139-45. [PubMed ID: 33312747]. [PubMed Central ID: PMC7719199]. https://doi.org/10.1016/j.glohj.2020.12.001.
-
2.
Gereffi G. What does the COVID-19 pandemic teach us about global value chains? The case of medical supplies. Journal of International Business Policy. 2020;3(3):287-301. https://doi.org/10.1057/s42214-020-00062-w.
-
3.
Zhang SX, Liu J, Afshar Jahanshahi A, Nawaser K, Yousefi A, Li J, et al. At the height of the storm: Healthcare staff's health conditions and job satisfaction and their associated predictors during the epidemic peak of COVID-19. Brain Behav Immun. 2020;87:144-6. [PubMed ID: 32387345]. [PubMed Central ID: PMC7199703]. https://doi.org/10.1016/j.bbi.2020.05.010.
-
4.
Zhang SX, Chen J, Afshar Jahanshahi A, Alvarez-Risco A, Dai H, Li J, et al. Succumbing to the COVID-19 Pandemic—Healthcare Workers Not Satisfied and Intend to Leave Their Jobs. Int J Ment Health Addiction. 2021;20(2):956-65. https://doi.org/10.1007/s11469-020-00418-6.
-
5.
Rehana K, Tabish SA, Gojwari T, Ahmad R, Abdul H. Unit cost of CT scan and MRI at a large tertiary care teaching hospital in North India. Health. 2013;5(12):2059-63. https://doi.org/10.4236/health.2013.512279.
-
6.
Kesteloot K, Lievens Y, van der Schueren E. Improved management of radiotherapy departments through accurate cost data. Radiother Oncol. 2000;55(3):251-62. [PubMed ID: 10869740]. https://doi.org/10.1016/s0167-8140(99)00034-1.
-
7.
Hayati H, Kebriaeezadeh A, Ehsani MA, Nikfar S, Akbari Sari A, Mehrvar A, et al. Cost-utility of Protocols of BFM-ALL and UK-ALL for Treatment of Children with Acute Lymphoblastic Leukemia in Iran. Iran J Public Health. 2018;47(3):407-12. [PubMed ID: 29845029]. [PubMed Central ID: PMC5971178].
-
8.
Hayati H, Kebriaeezadeh A, Ehsani MA, Nikfar S. Cost-Analysis of Treatment of Childhood Acute Lymphoblastic Leukemia Based on UKALL Protocol. Iran J Pediatr. 2018;In Press(In Press). https://doi.org/10.5812/ijp.7985.
-
9.
Lexa FJ, Mehta T, Seidmann A. Managerial accounting applications in radiology. J Am Coll Radiol. 2005;2(3):262-70. [PubMed ID: 17411809]. https://doi.org/10.1016/j.jacr.2004.08.020.
-
10.
Waters H, Abdallah H, Santillan D. Application of activity-based costing (ABC) for a Peruvian NGO healthcare provider. Int J Health Plann Manage. 2001;16(1):3-18. [PubMed ID: 11326572]. https://doi.org/10.1002/hpm.606.
-
11.
Yereli AN. Activity-based costing and its application in a Turkish university hospital. AORN J. 2009;89(3):573-6. 579-91. [PubMed ID: 19269382]. https://doi.org/10.1016/j.aorn.2008.09.002.
-
12.
Federowicz MH, Grossman MN, Hayes BJ, Riggs J. A tutorial on activity-based costing of electronic health records. Qual Manag Health Care. 2010;19(1):86-9. [PubMed ID: 20042937]. https://doi.org/10.1097/QMH.0b013e3181ccbd71.
-
13.
Adam T, Evans DB. Determinants of variation in the cost of inpatient stays versus outpatient visits in hospitals: a multi-country analysis. Soc Sci Med. 2006;63(7):1700-10. [PubMed ID: 16769168]. https://doi.org/10.1016/j.socscimed.2006.04.023.
-
14.
Ibrahim R, Samian S, Mazli MZ, Amrizal MN, Aljunid SM. Cost of Magnetic Resonance Imaging (MRI) and Computed Tomography (CT) scan in UKMMC. BMC Health Serv Res. 2012;12(S1). https://doi.org/10.1186/1472-6963-12-s1-p11.
-
15.
Bayati M, Mahboub Ahari A, Badakhshan A, Gholipour M, Joulaei H. Cost Analysis of MRI Services in Iran: An Application of Activity Based Costing Technique. Iran J Radiol. 2015;12(4). e18372. [PubMed ID: 26715979]. [PubMed Central ID: PMC4691520]. https://doi.org/10.5812/iranjradiol.18372v2.
-
16.
Javid M, Hadian M, Ghaderi H, Ghaffari S, Salehi M. Application of the Activity-Based Costing Method for Unit-Cost Calculation in a Hospital. Glob J Health Sci. 2015;8(1):165-72. [PubMed ID: 26234974]. [PubMed Central ID: PMC4803948]. https://doi.org/10.5539/gjhs.v8n1p165.
-
17.
Thant PW, Htet KT, Win WY, Htwe YM, Htoo TS. Cost estimates of COVID-19 clinical management in Myanmar. BMC Health Serv Res. 2021;21(1):1365. [PubMed ID: 34961536]. [PubMed Central ID: PMC8710920]. https://doi.org/10.1186/s12913-021-07394-0.
